Article

Growth and Deformation Simulation of Aluminum Bronze Grains Produced by Electron Beam Additive Manufacturing

by
Anton Yu. Nikonov
1,2,
Dmitry V. Lychagin
1,2,*,
Artem A. Bibko
1,2 and
Olga S. Novitskaya
1
1
ISPMS Institute of Strength Physics and Material Science SB RAS, Akademicheskii pr. 2/4, 634055 Tomsk, Russia
2
Department of Metal Physics, Department of Mineralogy and Geochemistry, TSU Tomsk State University, Lenin av. 36, 634050 Tomsk, Russia
*
Author to whom correspondence should be addressed.
Metals 2022, 12(1), 114; https://doi.org/10.3390/met12010114
Submission received: 13 December 2021 / Revised: 3 January 2022 / Accepted: 4 January 2022 / Published: 7 January 2022
(This article belongs to the Special Issue Processing, Microstructure and Mechanical Properties of Alloys)

Abstract

:
When working out 3D building-up modes, it is necessary to predict the material properties of the resulting products. For this purpose, the crystallography of aluminum bronze grains after electron beam melting has been studied by EBSD analysis methods. To estimate the possibility of sample form changes by pressure treatment, we simulated structural changes by the method of molecular dynamics during deformation by compression of individual grains of established growth orientations. The analysis was carried out for free lateral faces and grain deformation in confined conditions. Simulation and experiments on single crystals with free lateral faces revealed the occurrence of stepwise deformation in different parts of the crystal and its division into deformation domains. Each domain is characterized by a shear along a certain slip system with the maximum Schmidt factor. Blocking the shear towards the lateral faces leads to selectivity of the shear along the slip systems that provide the required shape change. Based on the simulation results, the relationship between stress–strain curves and structural characteristics is traced. A higher degree of strain hardening and a higher density of defects were found upon deformation in confined conditions. The deformation of the columnar grains of the built material occurs agreed with the systems with the maximum Schmidt factor.

1. Introduction

In manufacturing related to additive technologies, the relationship of microstructure, properties and the process of obtaining materials is more significant than anywhere else [1]. The emergence of controlled microstructures is one of the promising trends in additive manufacturing (AM) [2]. The deliberate setting of the material’s crystallographic parameters will allow predicting its desired properties as well as predicting its behavior during deformation.
Widely used materials in AM are alloys based on aluminum [3,4], nickel [5,6] and iron [7,8]. This is often associated with their field of application like medicine, aerospace production and mechanical engineering. The reviews in [1,4,9,10] provide comprehensive information on the materials used in AM for directed energy deposition (DED) and powder bed fusion (PBF) depending on the primary heat source. The use of electron beam energy sources in AM has been known since the late 1990s. The electron beam has a high density of energy, which helps to reduce manufacturing costs by saving printing time [11], and this process has high possibility for automation.
Interest in copper and Cu-based alloys as a material compatible with AM has arisen relatively recently [12,13,14]. Therefore, at present, additional studies are required aimed at studying the material and the process of its preparation by the AM method.
The crystallography and growth structure near the melt boundary are determined by the base metal, because it is this metal that dominates near the boundary [15,16]. The preferred crystallographic direction for grain growth in face-centered cubic (FCC) materials is the <100> direction [9]. Therefore, during solidification, preferred growth occurs when the base metal grains are oriented along <100>, which corresponds to the direction of maximum heat flux. The farther away from the melt boundary, the more pronounced the competitive growth of crystals becomes [17]. There are studies [18] reporting the existence of two crystallographic orientations with very different grain growth morphologies. This feature is associated with the influence of a thermal gradient along the build direction, which contributes to the appearance of columnar grains with two main crystallographic orientations: <001> and <011>.
Columnar microstructure, substantiated by the epitaxial growth of crystals during AM, is recorded for almost all alloys [19,20,21]. It is known that DED treatment of titanium-based alloys promotes columnar grain growth. Such grains lead to anisotropy of the material’s mechanical properties, thereby limiting the field of application, showing a crystallographic dependence during active deformation. Thus, Zhu et al. in their study [22] of Ti alloys made by the AM method, suggest that the proportion of uniaxial grains increase as the alloying content of the residual powders in the melt pools increases. Study of Ti alloys [23] also showed that changing the building-up parameters allows for a change in the columnar structure, but also promotes side-branching, leading to spiral growth of the microstructure.
Experimental studies on the copper’s processing using electron beam melting (EBM) are described in detail in the work [24]. Ramirez et al. observed columnar structures parallel to the direction of surfacing. The evolution of the nickel-aluminum bronze microstructure in different areas along the growth direction during wire-arc additive manufacturing is investigated in the work [25]. It has been shown that the grain size decreases along the build direction. Fine grains replace the elongated grain structure. Further heat treatment of the samples led to significant increase in strength and decrease in plasticity [26]. In the study [27] of the supplied heat influence on the structure and mechanical characteristics of the Al bronze alloy obtained by the Electron Beam Additive Manufactured (EBAM) method, three types of microstructures are shown that are formed at different heat input. Khoroshko et al. [13], in their study of aluminum bronze, showed that transitional interlayer deformation can reduce the tendency to form a dendritic structure during EBAM. Deformation of 9.3% and annealing at a temperature of 985 °C contributed to the formation of a scattered texture, which favorably affected on the mechanical characteristics of the alloy. Furthermore, Wei et al. [28] investigated the tensile properties and fracture behavior of a Co-based alloy fabricated by EBM before and after complex heat treatment. They have improved the properties of the alloy due to deformation induced by martensite transformation along the planes {111}.
Additional ideas about physical mechanisms, which are difficult to explain and describe using only experiment, are given by computer simulation. The molecular dynamics (MD) method makes it possible to cover events reaching hundreds of nanoseconds in the time range, which makes it applicable for studying structural reconstructions in the bulk of a material during active deformation. Recent studies [29] used molecular dynamics modeling to study the process of crystal nucleation in a melt and the formation of a nanostructure during solidification during micro selective laser melting (μ-SLM). Furthermore, MD simulations of hot isostatic pressing and uniaxial tensile tests were performed separately. In [30], MD modeling was carried out for copper manufactured by AM. The influence of several parameters was investigated, such as the cooling rate and the layer thickness. Using eight simulated layers as an example, it is shown that a low cooling rate leads to a decrease in the number of defects, and also that defect-free single crystals are printed up to the critical layer thickness. The results [31] of MD simulation of the TiAl alloy deformation behavior under tension and compression at temperatures of 10 and 300 K show a significant temperature dependence associated with the crystal structure.
Previously, the authors in their works [32,33] simulated uniaxial compression along <001> and <111> for FCC single crystals of materials using in AM, which showed the effect of stacking fault energy on their deformation behavior. Simulation also made it possible to identify the role of different types of dislocations in hardening and deformation.
The purpose of this work is to reveal the crystallographic characteristics by an electron backscatter diffraction (EBSD) method growing grains of aluminum bronze alloy product obtained by the EBAM method, and to establish a relationship between the crystallographic orientation and the structure and the mechanical properties by modeling deformation using molecular dynamics method.

2. Materials and Methods

The object of research is aluminum bronze. Single crystals and polycrystal were studied. The single crystals were grown by the Bridgman method. Polycrystalline sample was cut from a product obtained by 3D electron-beam building-up in a vacuum. Building-up was carried out on a laboratory installation of ISPMS SB RAS, which was specially developed for building-up with wire. Additive production modes: the electron beam accelerating potential—30 kV; the beam current—30 mA; the spot size—4.5 mm; the beam sweep frequency—1000 Hz; the heat input—0.22 kJ/mm. The building-up modes corresponded to the modes described in the work [27]. The building was carried out with an aluminum bronze wire containing 7.5 wt.% aluminum (Cu-13 at.% Al) with a diameter of 1 mm. Surfacing was carried out by a zigzag motion of the table relative to the gun in layers along programmed transitions to a new layer in a time of 2...3 s. The resulting bar had the following dimensions: length~90 mm, width~40 mm, height~20 mm.
The crystallographic and morphological analysis of the bar grains was carried out on sample 4 × 4 × 8 mm3 in size. The long side of the sample was oriented perpendicular to the building-up layers. Samples were cut out by electrical discharge machining. The surface of the samples for the study was prepared according to a standard technique, including polishing on abrasive paper and polishing suspensions. The final stage of preparation was the surface ion milling with a low-energy ion beam on a SEMPrep2 device (Technoorg Linda Co. Ltd., Budapest, Hungary).
Surfaces of samples were examined using a confocal microscope Olympus LEXT OLS4100. The grain orientations and grain boundary misorientations have been studied EBSD method (Instrument Nordlys, Oxford Instruments, High Wycombe, UK) mounted on a Tescan Mira 3 LMU scanning electron microscope (SEM) (TESCAN ORSAY HOLDING, Brno, Czech Republic). HKL Channel 5 software (Oxford Instruments, High Wycombe, UK) is used for an analysis of the EBSD data [34].

3. Model Description

All MD calculations were implemented using the large-scale atomic/molecular massively parallel simulator (LAMMPS) [35]. This software is used for calculations within the framework of classical molecular dynamics and is provided free of charge by Sandia National Laboratory. An aluminum bronze alloy Cu-13 at.% Al was considered as a model material. The interaction between atoms was described using many-body potential plotted within the modified embedded atom method [36,37]. The modeled crystallite was a parallelepiped with dimensions 30a × 60a × 30a along the X, Y and Z directions of the laboratory coordinate system, where a is the lattice parameter for a given material. Samples with the following crystal lattice orientations were considered: compression axis <001> and lateral faces {110}; compression axis <110>, lateral faces {110} and {001}; and compression axis <112>, lateral faces {110} and {111}. The loading was set by moving with a constant speed of 2.5 m/s two layers of atoms with a thickness of 3 lattice parameters and a length of 60 lattice parameters located in the X0Z plane above and below the sample and simulating the punches of the test machine. The deformation in the description of the simulation results corresponds to a change in dl/l0*100%. Here, l0 is the initial crystallite height, dl—the total path traversed by two loaded layers. Deformation stresses were calculated by the formula σ = F ( l 0 d l ) / V 0 . Here, F is the force acting on the atoms of loading layers; V0 is the initial volume of the simulated sample.
For the lateral faces of the simulated sample, free boundary conditions were specified or additional loading was simulated to simulate constrained conditions. The loading was set as follows. A virtual fixed plane was located along the surface of the lateral face. The atoms of the sample, which crossed the given plane, began to act with additional forces calculated by the formula F(r) = –Kr2. Here, K is the coefficient; r is the shortest distance from the plane to the atom. Thus, the planes were set along the three lateral faces of the sample.
To identify defects in the crystal lattice, the DXA (Dislocation Extraction Algorithm) algorithm was used, implemented in the OVITO program [38,39]. This algorithm determines linear defects of the crystal lattice, such as dislocations, and calculates the corresponding values of the Burgers vector.

4. Results of Simulation and Comparison with Experiment

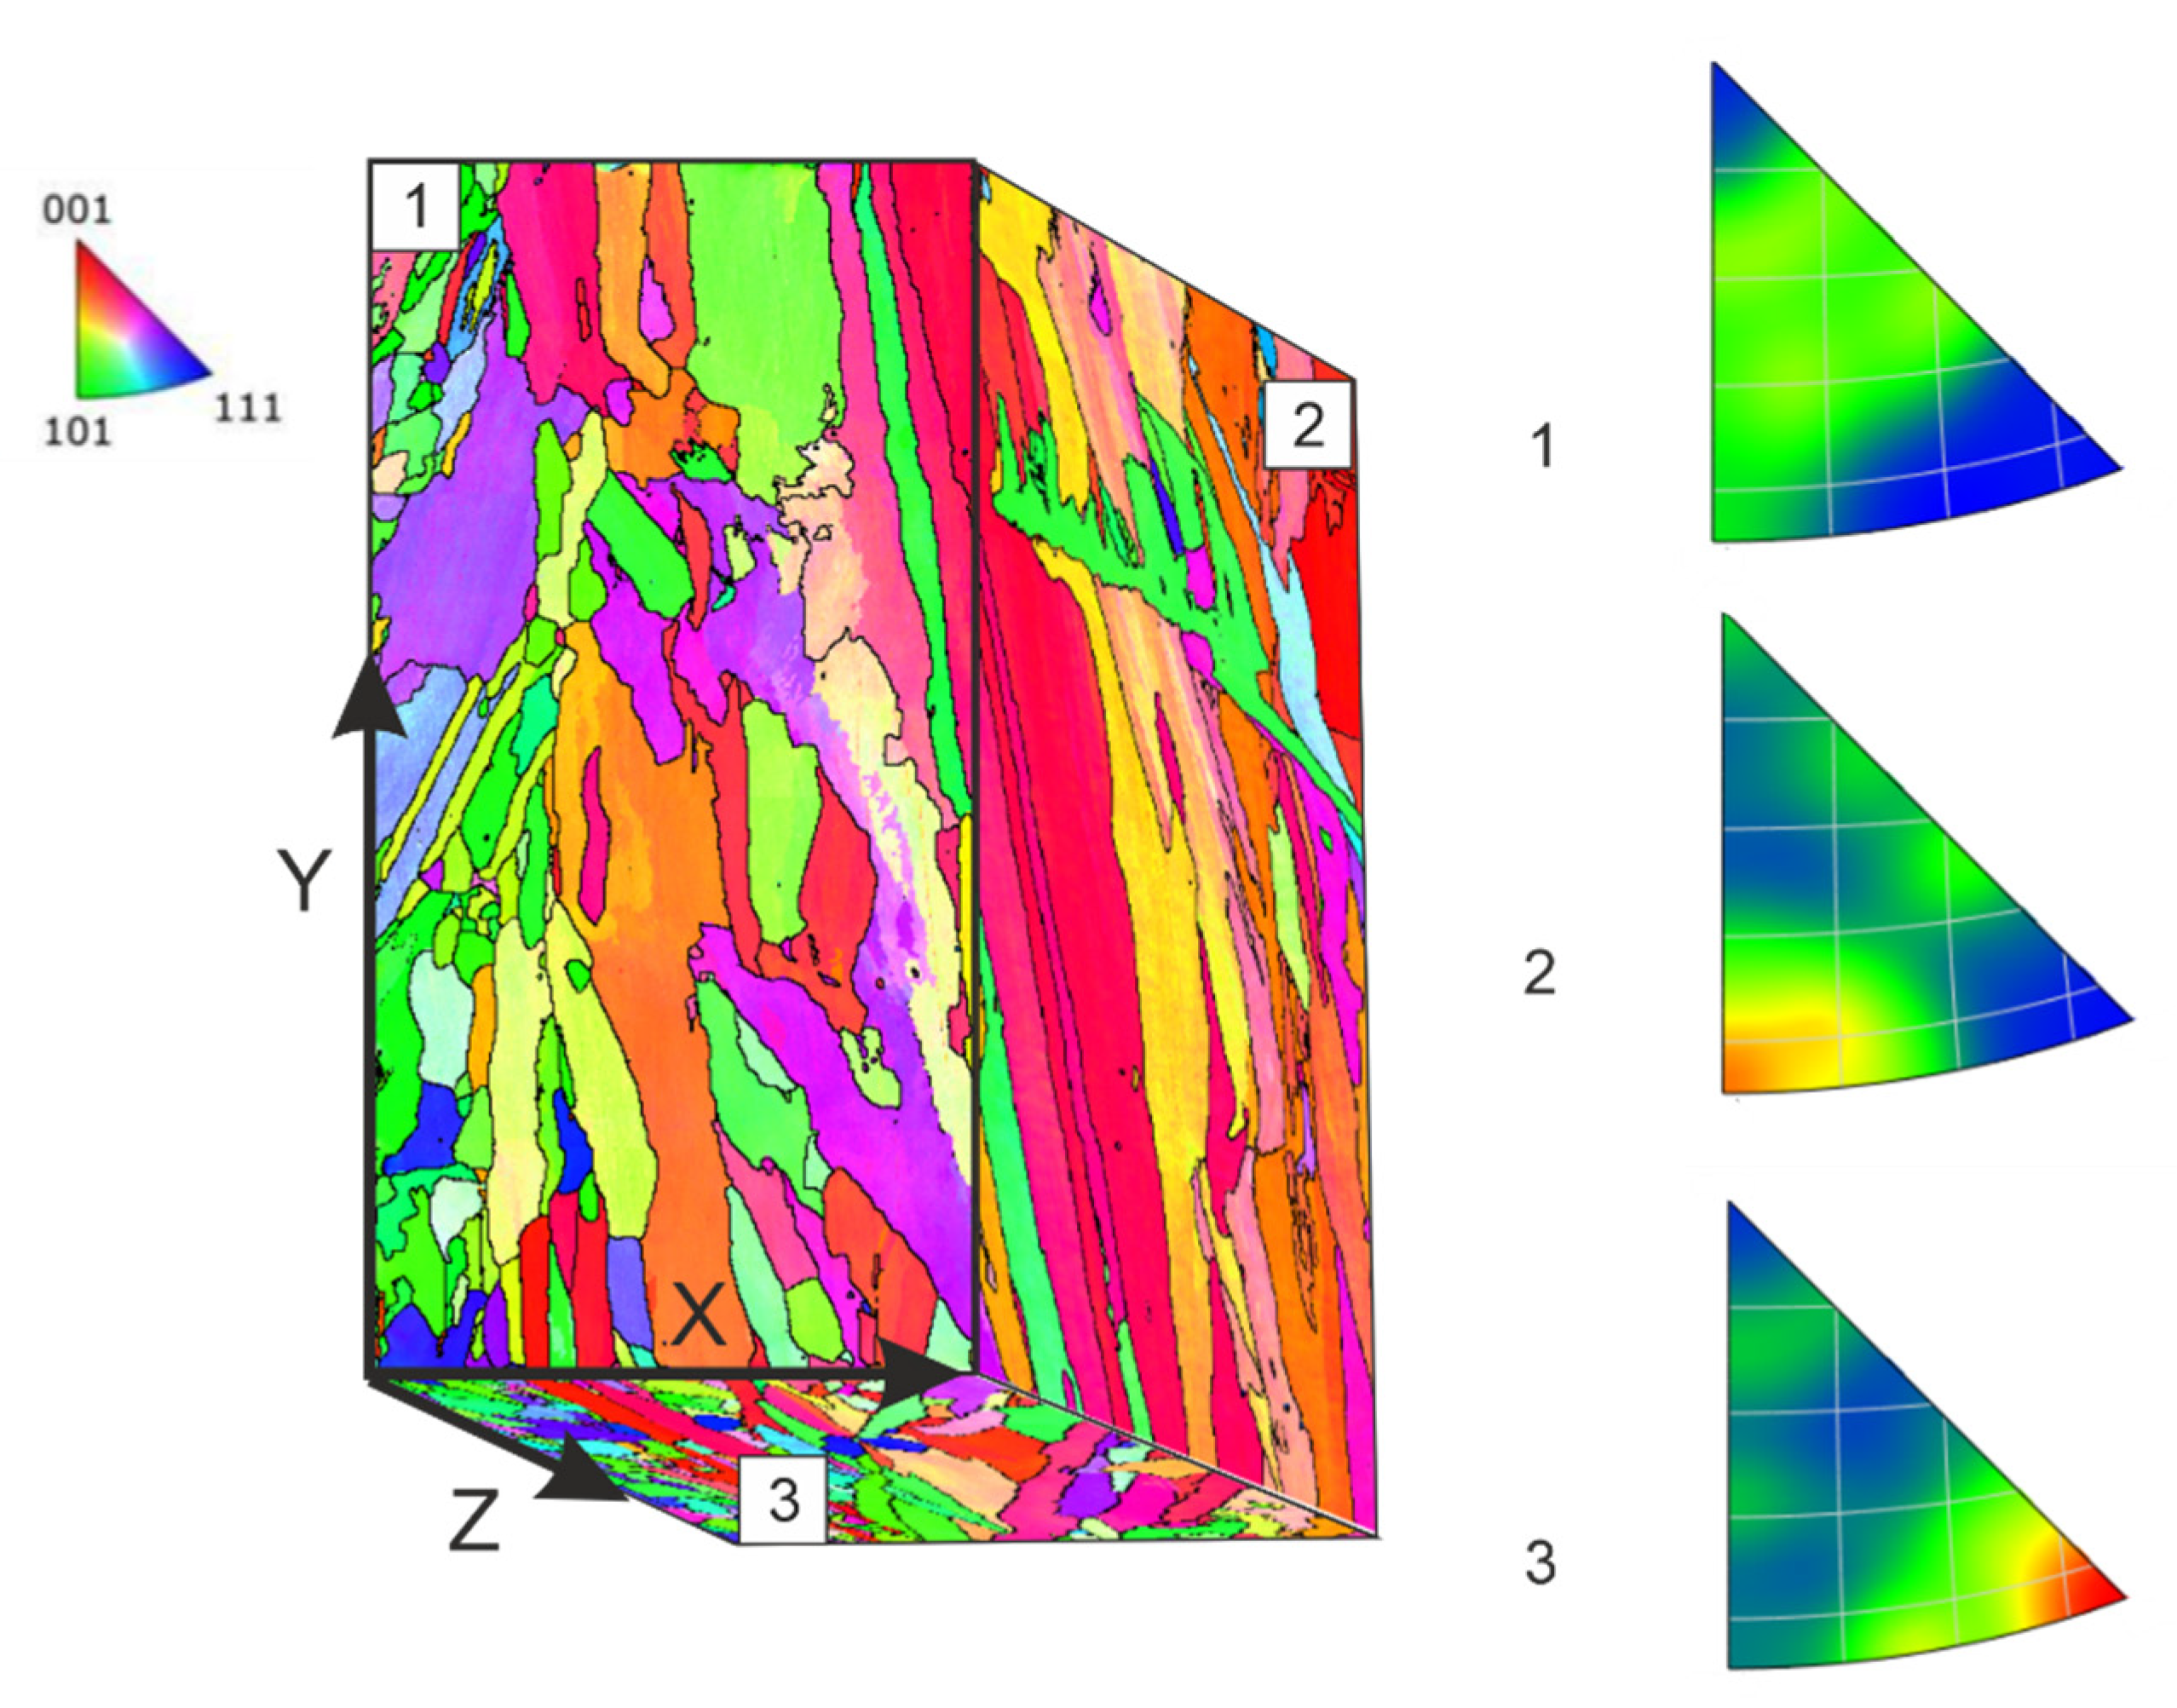
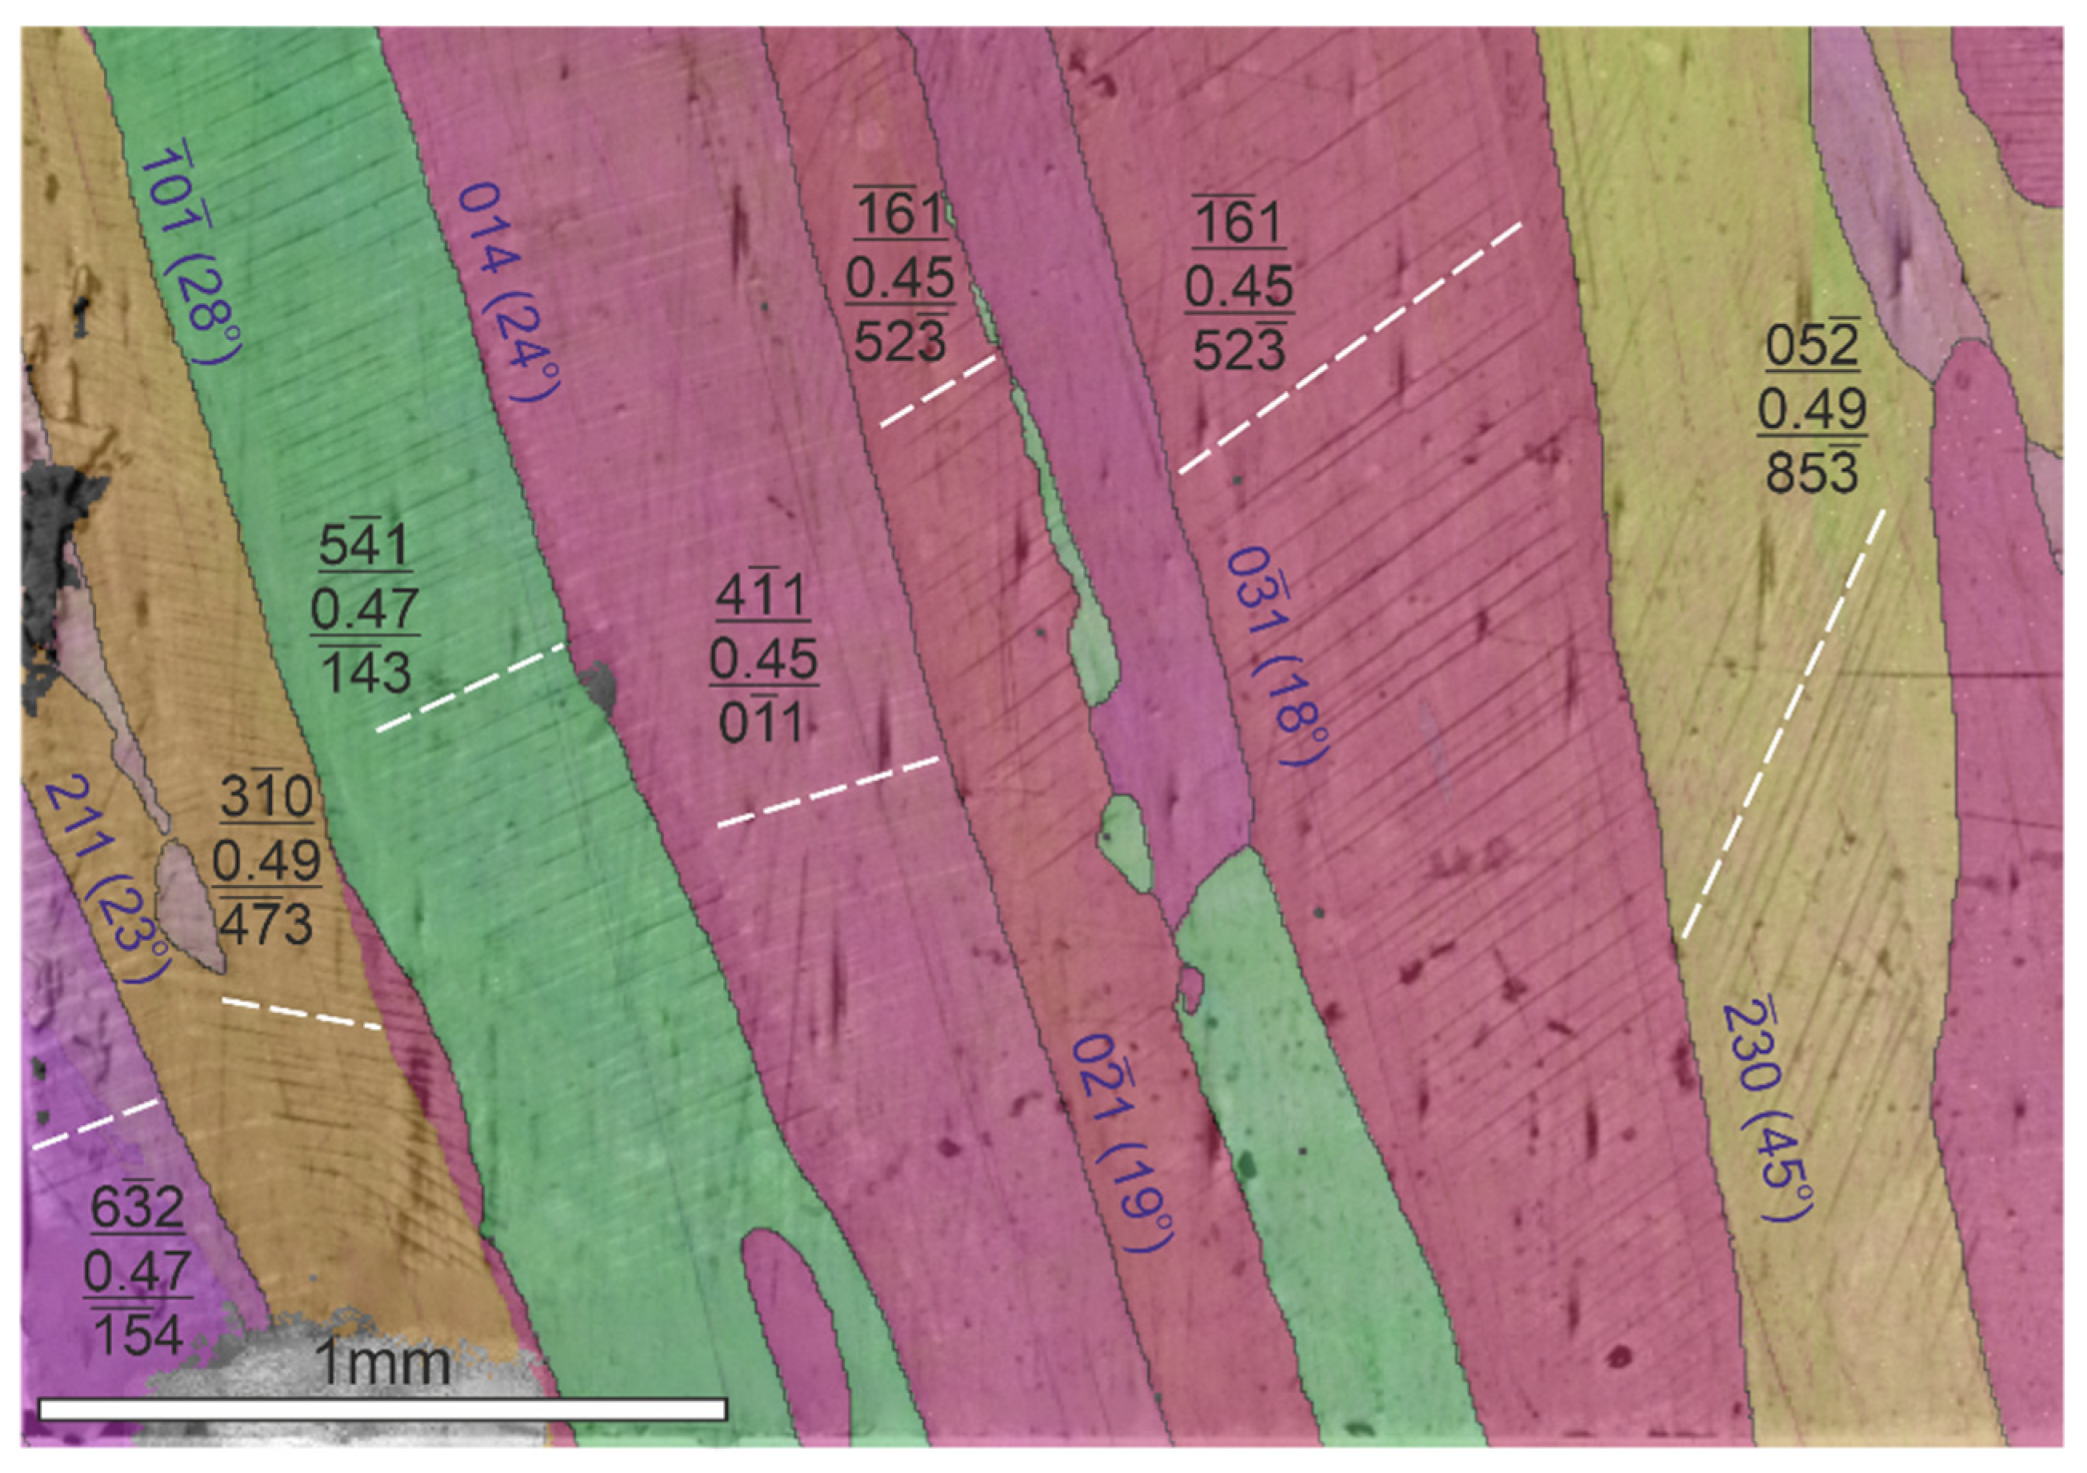
4.1. EBSD Crystallographic Analysis of Grains Obtained by Electron Beam Surfacing
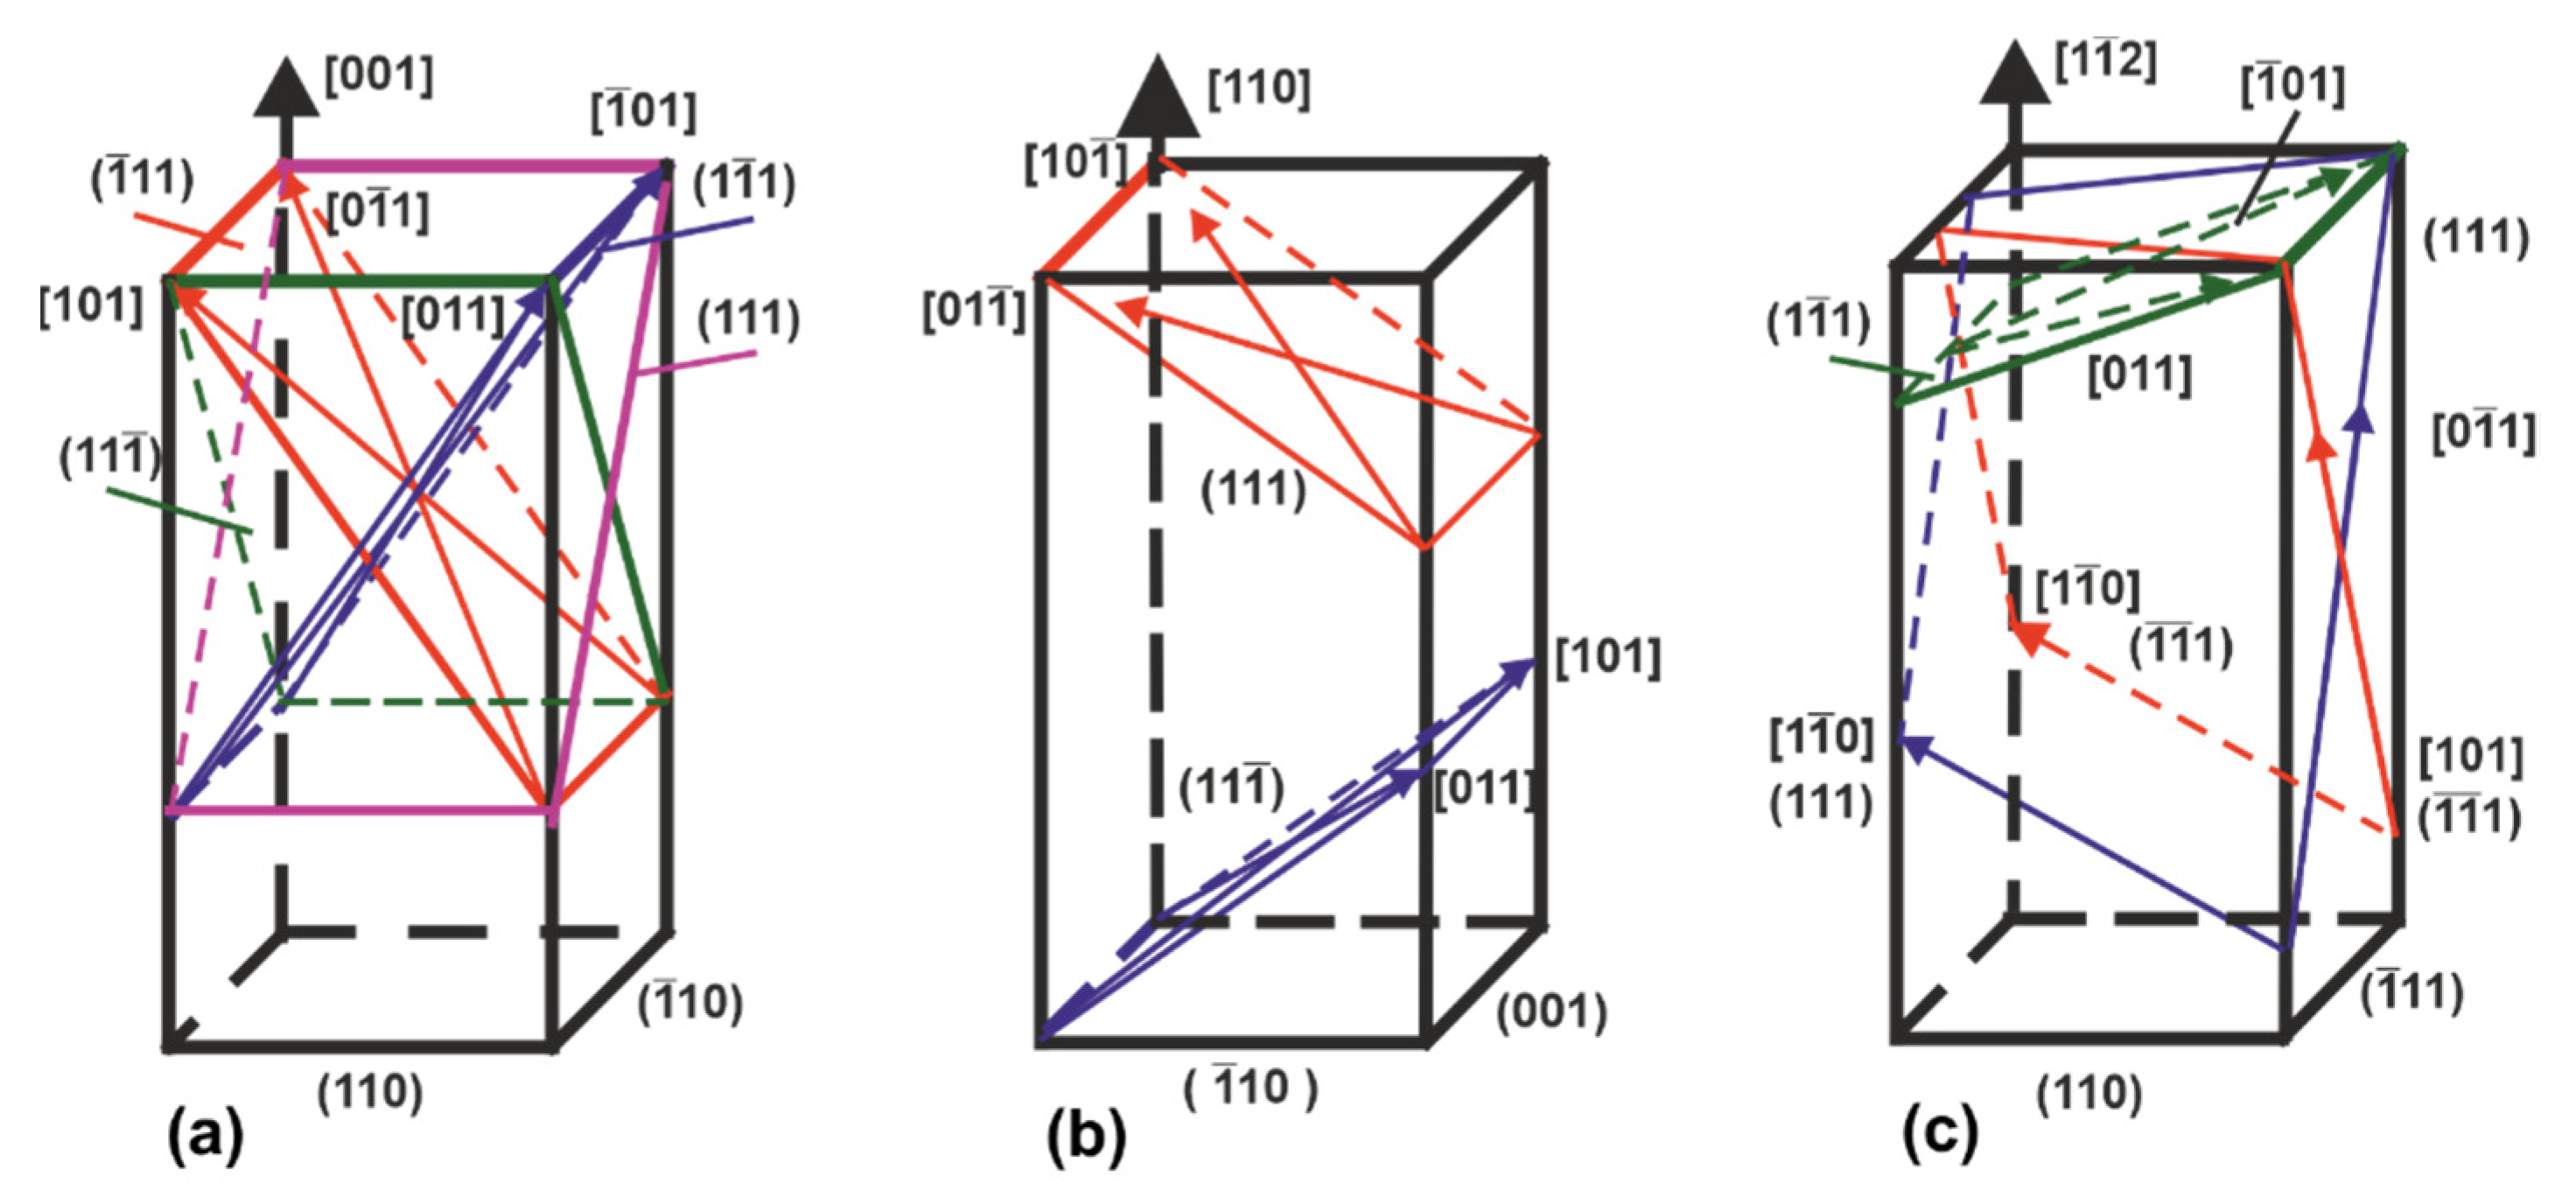
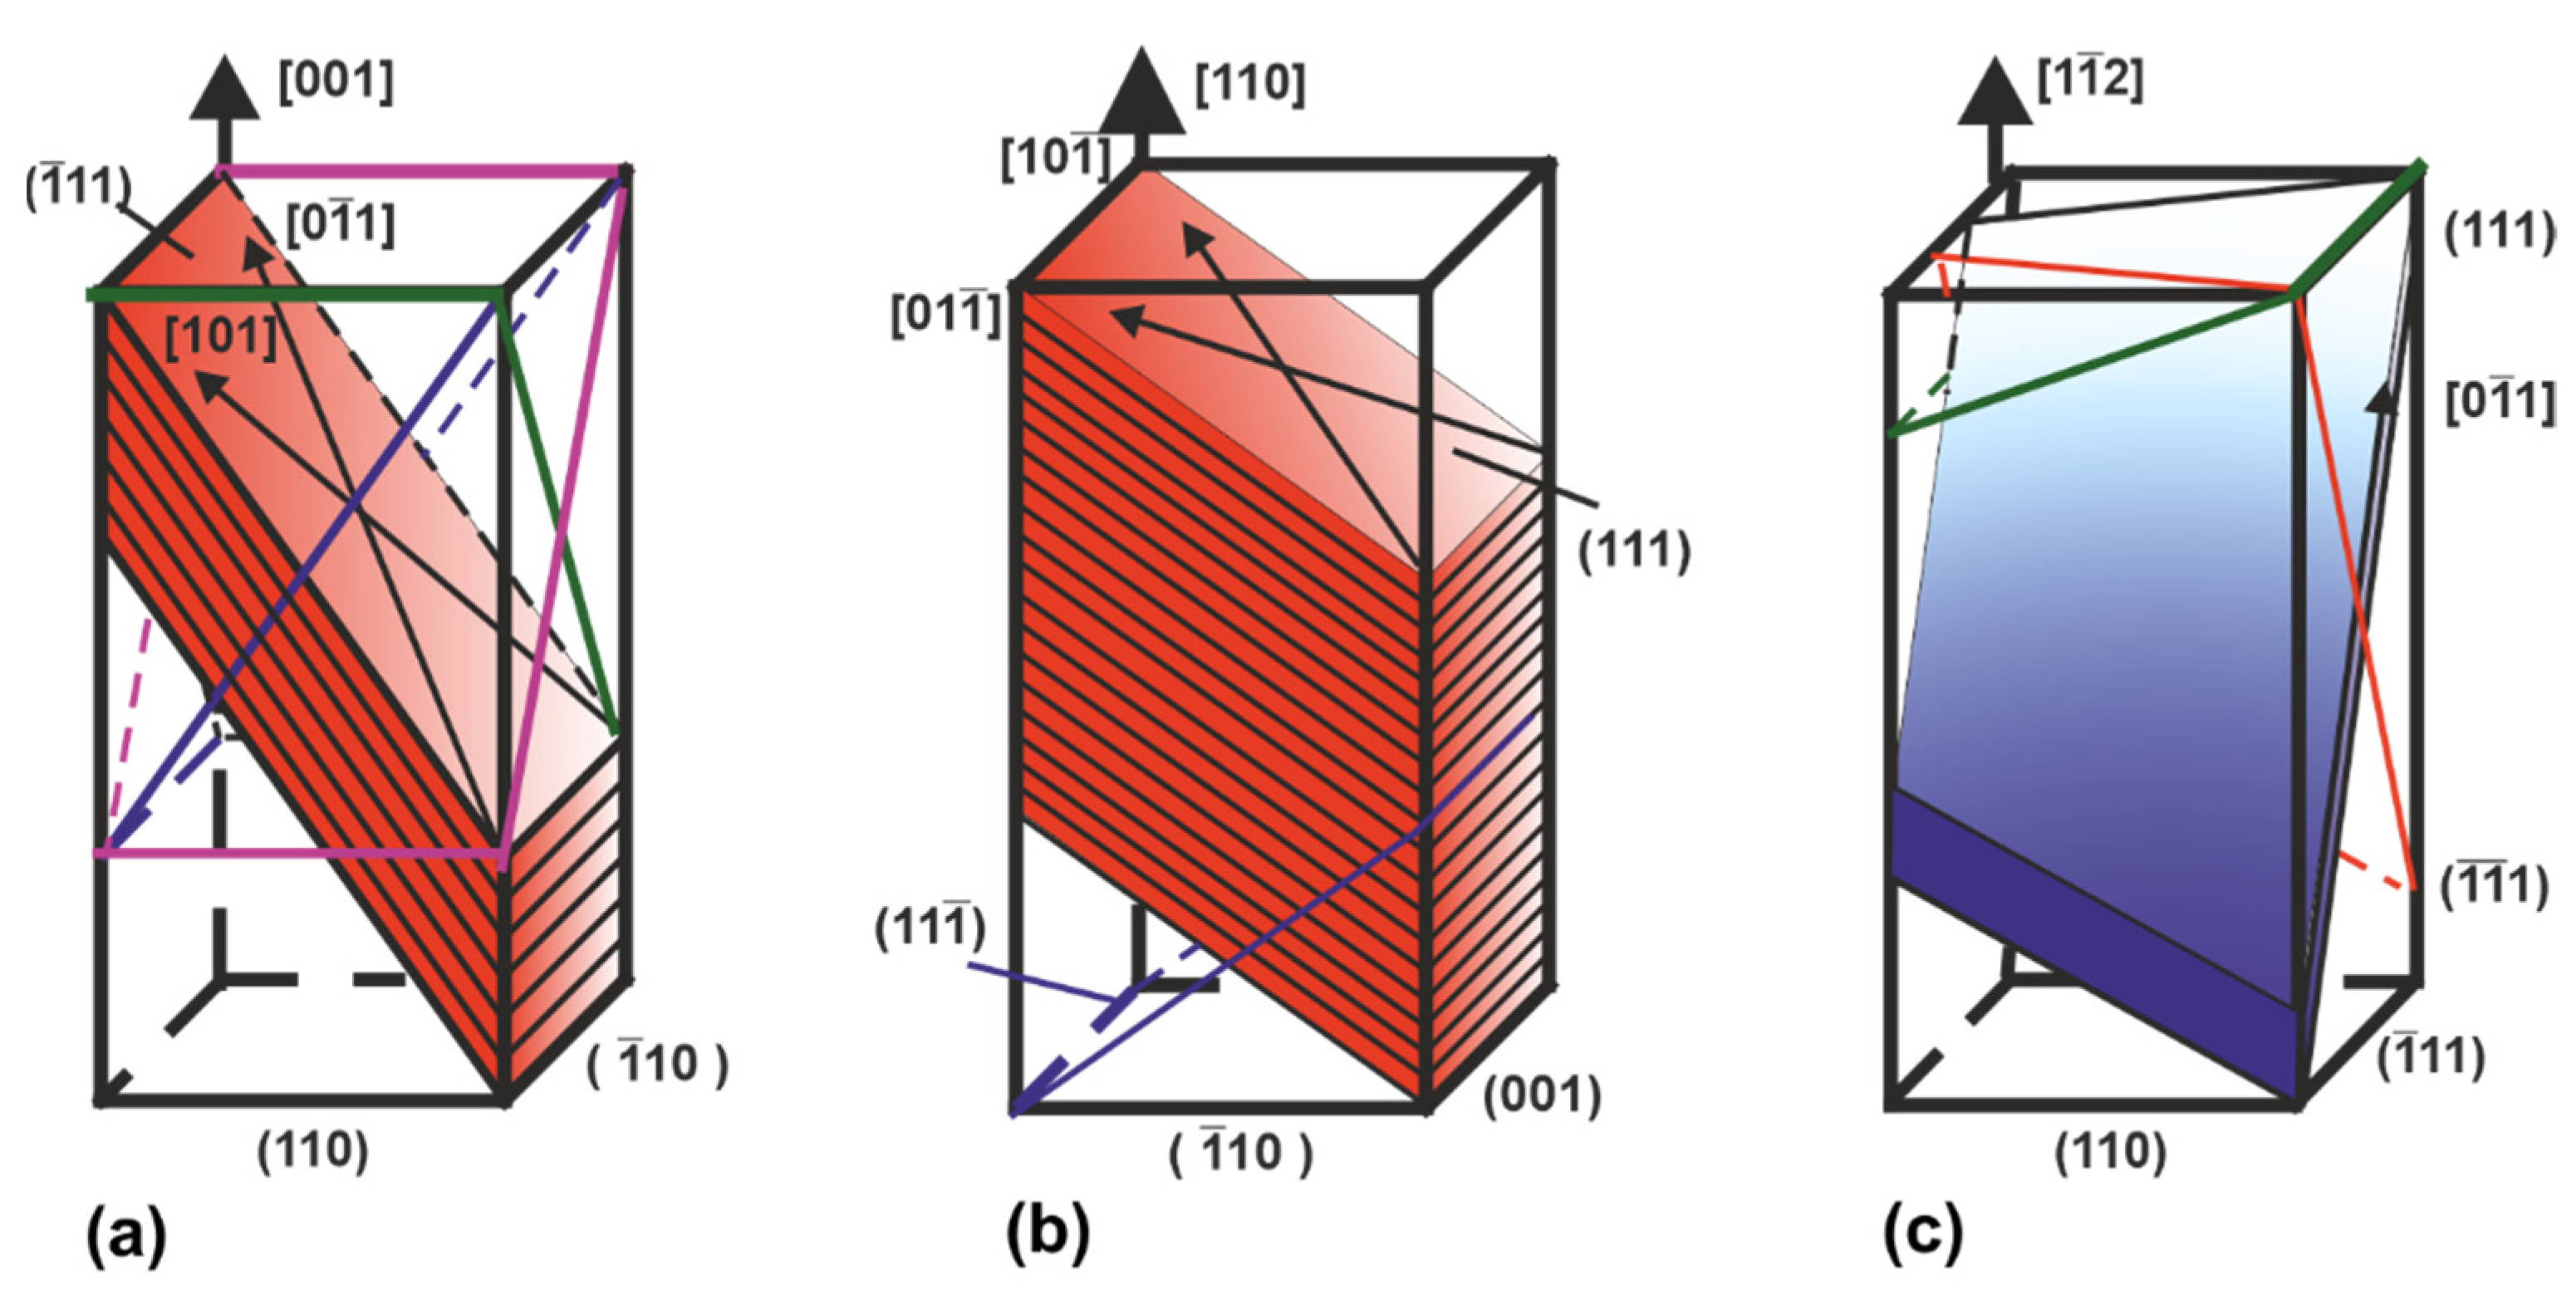
The results of the study of a specimen cut from a bar are presented below. Figure 1 shows orientation grains maps relative to the Y-axis of three mutually perpendicular faces of the sample. The map gives an idea of the orientation of each grain according to colors on an inverse pole figure (IPF) (inset in Figure 1). High-angle grain boundaries are shown on the map.
IPF characterize the crystallographic orientation of grain of the sample face relative to standard axes of the crystal lattice. In this case, Figure 1 shows the IPF orientations relative to the Y-axis. They give us information about the proportion of grains {hkl} in the texture for each face plane. A cumulative analysis of pole figures from all faces relative to the axes of the laboratory coordinate system gives an idea of the preferred orientation of grains from each face. It shows that the crystallographic grain orientation for the face parallel to the building layers is scattered in the center of the inverse stereographic triangle in the orientation range <001>...<112>...<101>. Comparison of IPF from different faces indicates a shear in the orientation of growing grains in the <001> direction. The IPF and map from face 2 show the displacement of the growing grain axis in the direction of electron beam movement.
Simulating involves taking into account the crystallographic orientation of the lateral faces of the growth grains relative to other coordinate axes (X and Z-axes). The IPF analysis showed that grains on face 2 (X-axis) have a preferred orientation near <101>, and grains on face 1 (Z-axis)—<111>. We will use the data on the growth crystals orientation in the simulation parameters.

4.2. Slip Schemes

The revealed typical grain orientations formed during building in shear conditions during plastic deformation. Therefore, in the case of uniaxial deformation equally loaded for orientation <001> will be 8 slip systems, <112>—2 and <101>—4. For these orientations, the Schmidt factor is 0.408. The orientations within the stereographic triangle between these orientations also have a high Schmidt factor, but their number is two or one. The diagrams in Figure 2 give an idea of the orientation of the most loaded slip systems in the bulk of the crystal.
In the work of Lychagin [40], a difference in the conditions of a shear towards free lateral faces was shown. The single crystal is divided into deformation domains. Their position in the volume depends on the places of stress concentration near the edges of the sample and the possibility of a shear towards free lateral faces. The shear bands pattern is formed by the successive inclusion of equally loaded slip planes into the deformation. Upon deformation, free from neighbors polycrystal grains will behave like single crystals with similar faces. Let us consider the results of simulating the deformation relief and the features of the implementation of shear in single crystals of close orientations.

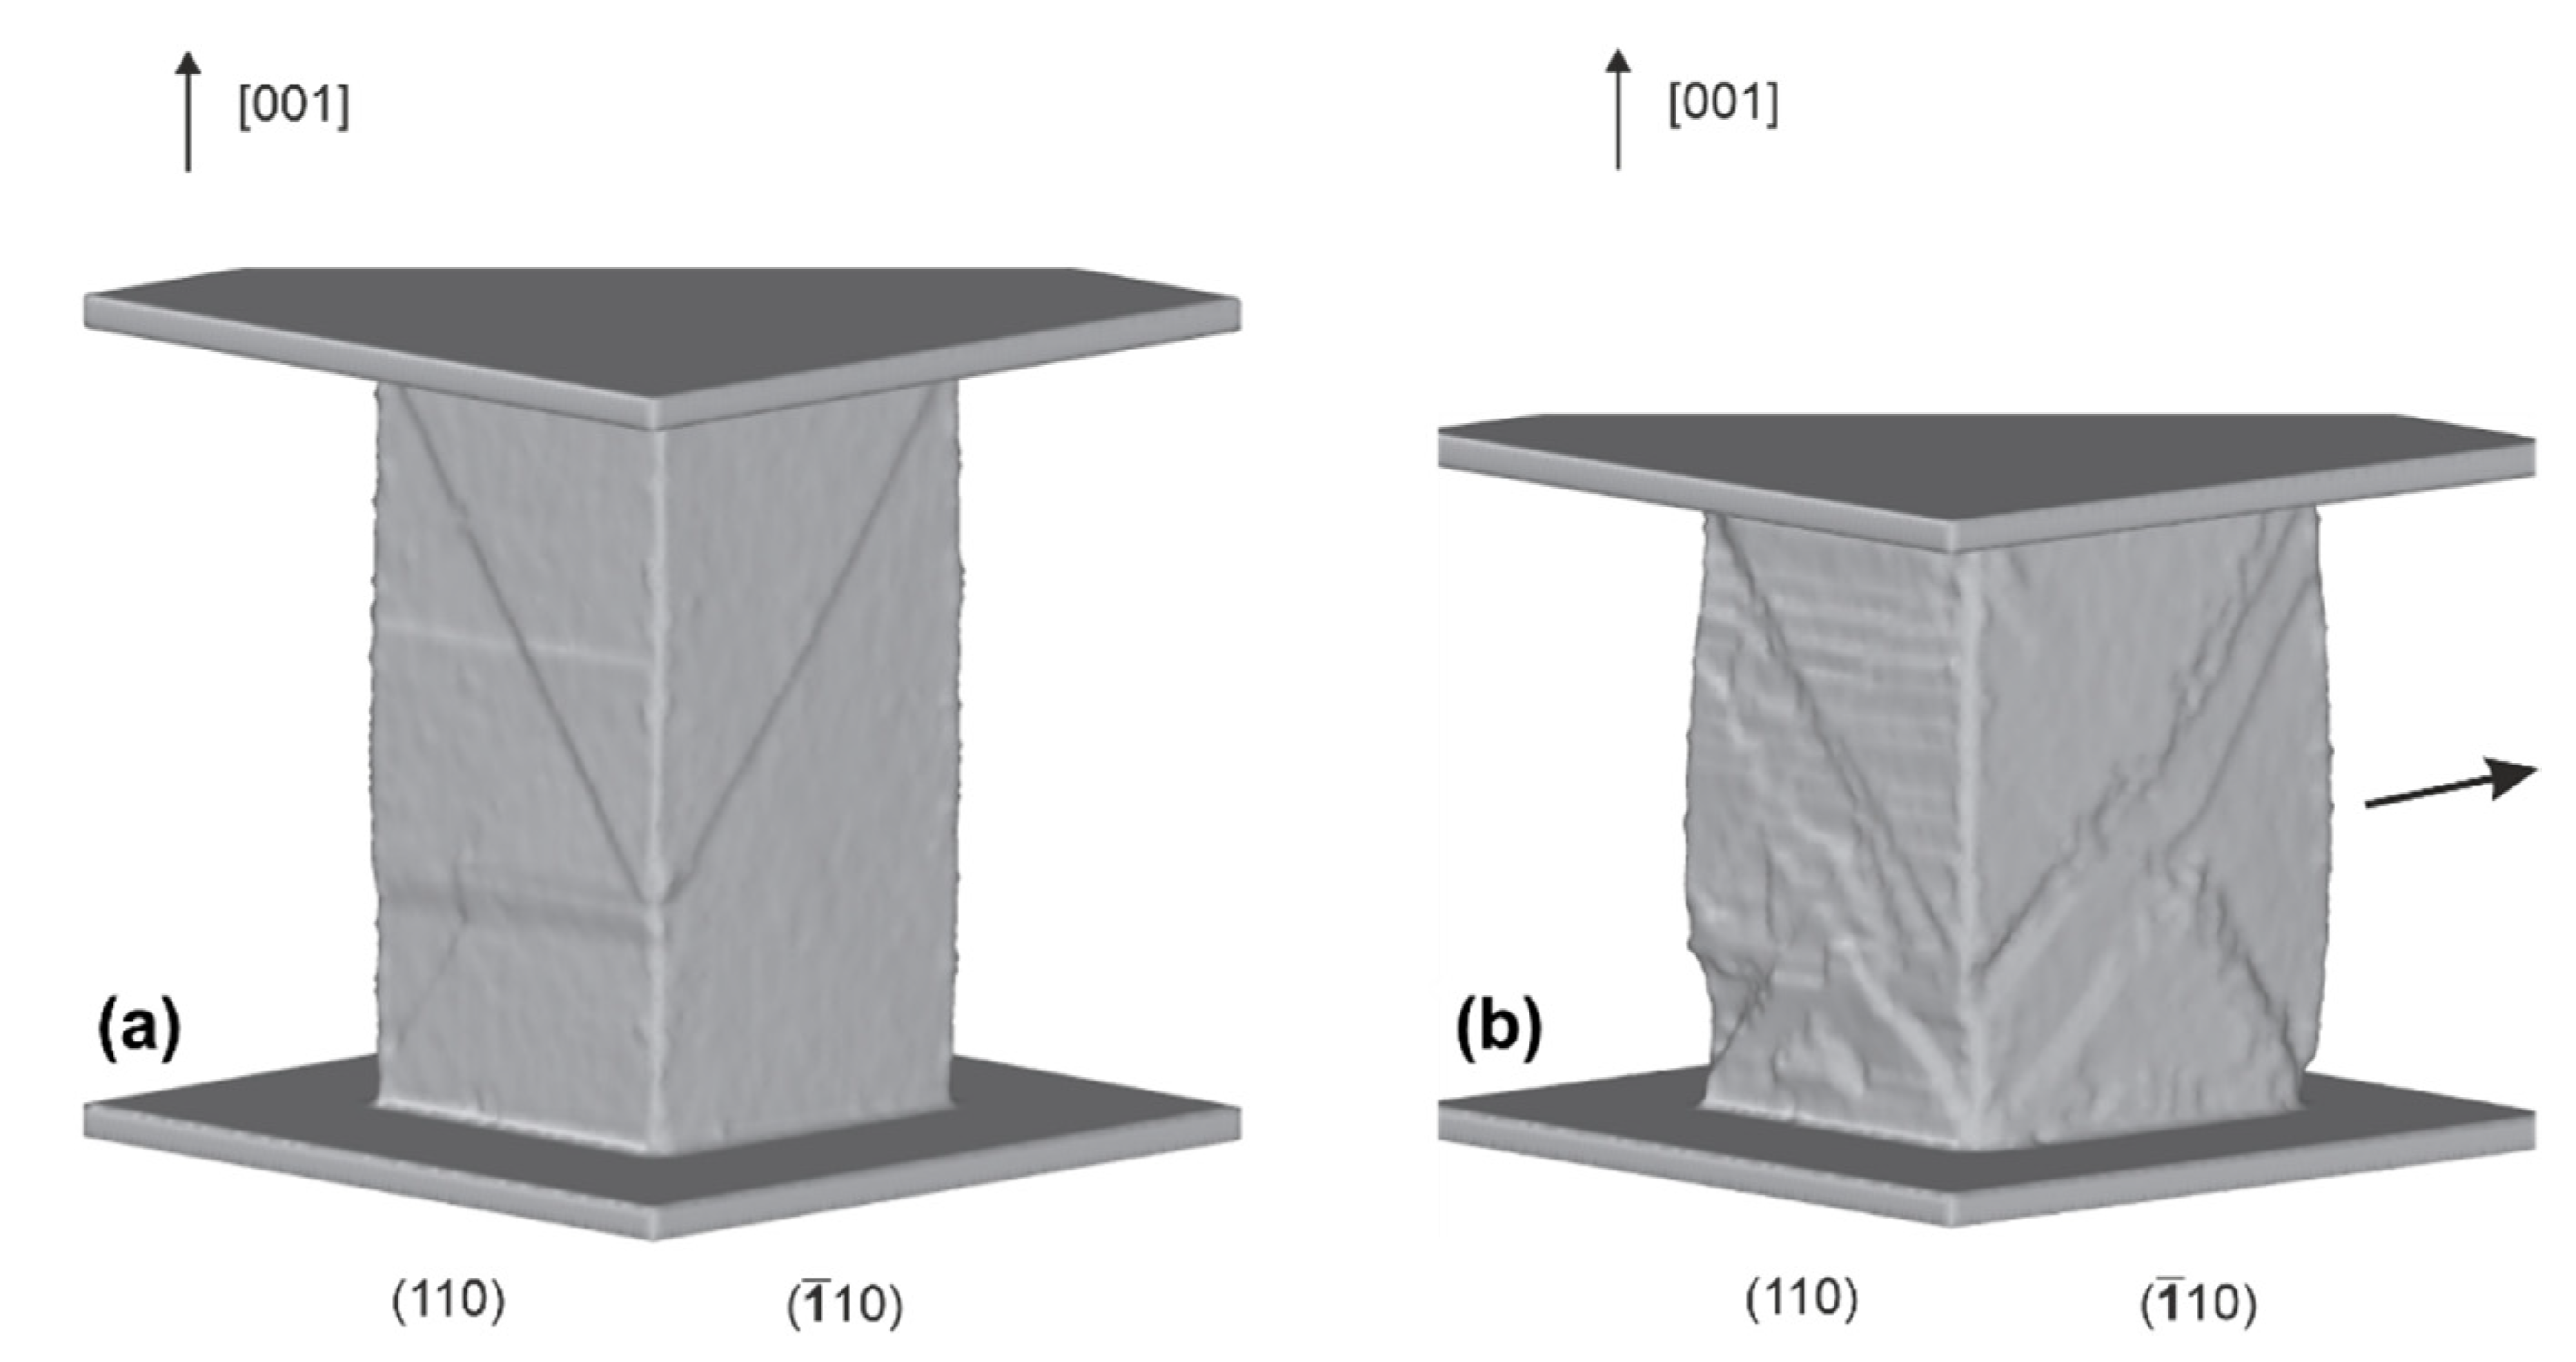
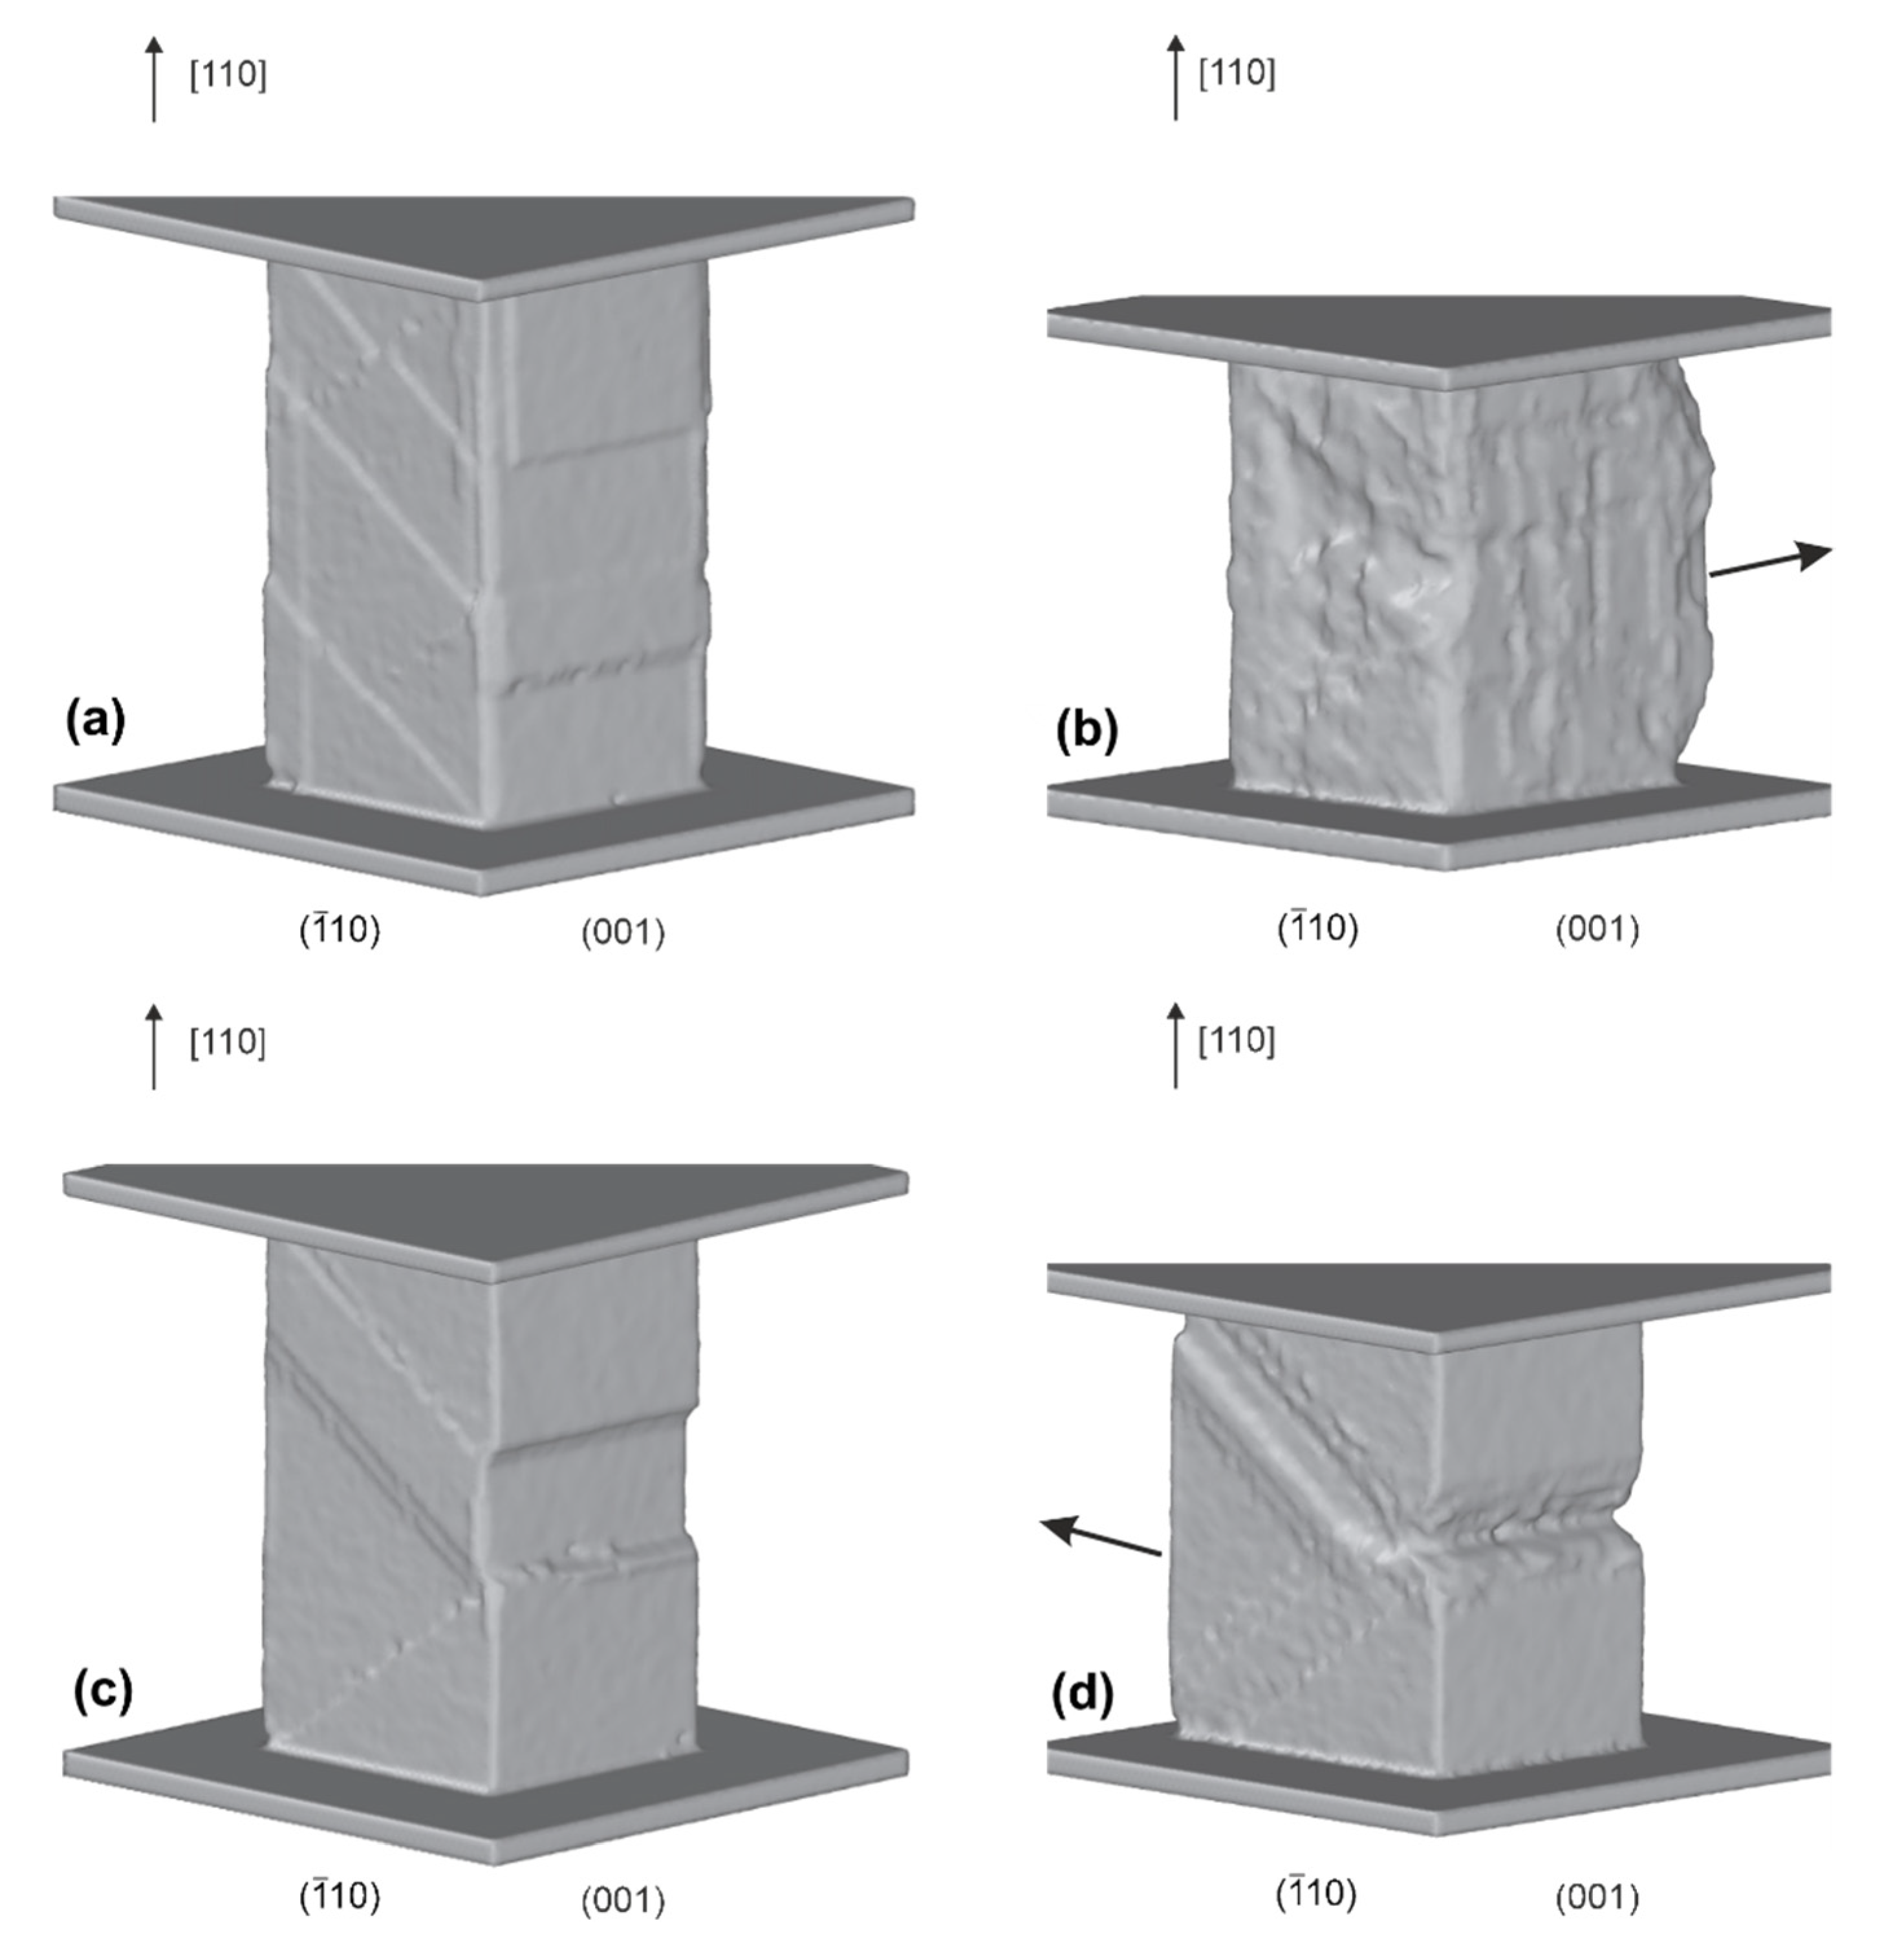
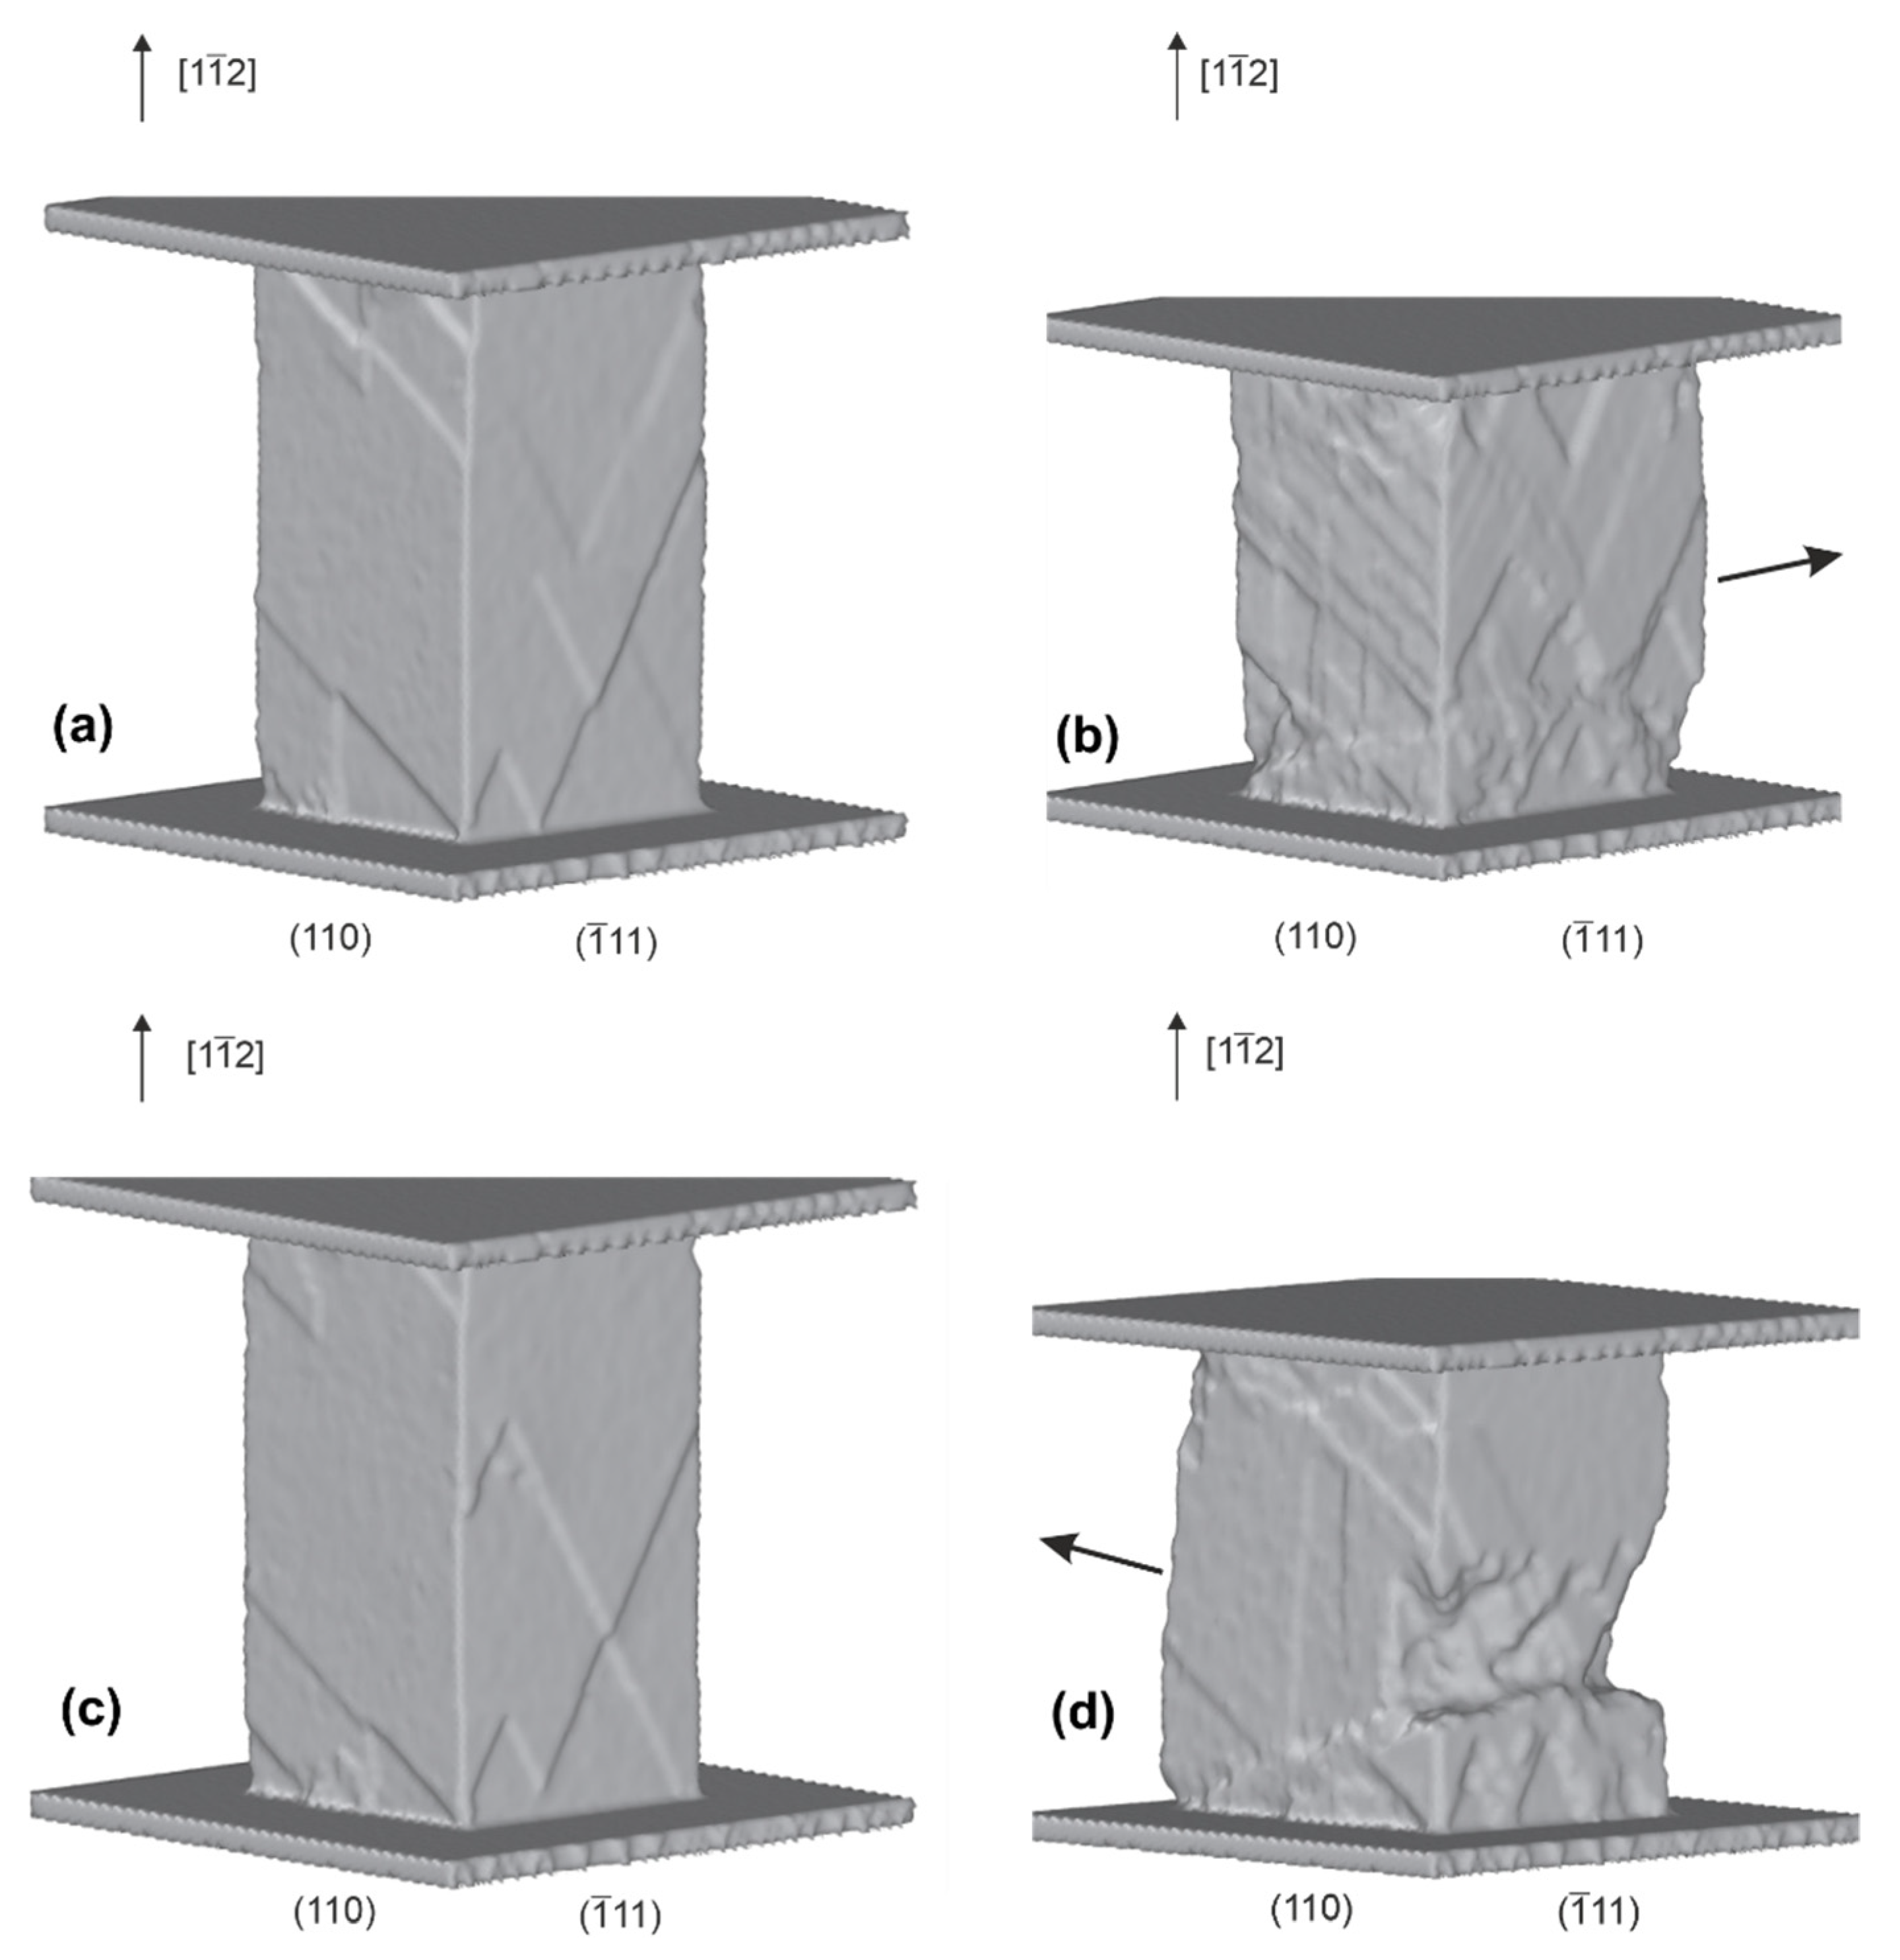
4.3. The Deformation Relief: Simulation of Individual Grain Deformation (The Case of Free Lateral Faces) and Experiment

Compression deformation leads to the formation of a relief on the lateral faces. The deformation relief obtained during modeling for the considered orientations of the lateral faces compression axes and planes shown in Figure 3. Shear bands form a characteristic pattern, defining the division of the volume into deformation domains. Each domain is characterized by a shear along a defined slip system at a selected moment of deformation.
The evolution of shear in the process of plastic deformation occurs along one of the maximum loaded slip systems in one part of the single crystal, in the other–another slip system acts. On the initial shear bands during subsequent deformation, the shear bands of a different slip system are superimposed, complicating the analysis of the sequence of deformation from different systems. Conducting simulation allows considering the sequence of shear along slip systems. In the case of crystal deformation with the [001] compression axis, the shear along four equally loaded slip systems was initially localized near the upper loaded layer. With an increase in the degree of deformation, other slip systems were activated in the neighboring regions of the crystal. As a result, a relief pattern was formed, shown in Figure 3a. The relief pattern for the [110] orientation is caused by a shear along the (111) and ( 11 1 ¯ ) planes in different parts of the crystal (Figure 3b). In Figure 3c, for the orientation [ 1 1 ¯ 2 ] on the face ( 1 ¯ 11 ) we observe a shear band along the plane ( 1 ¯ 1 ¯ 1 ) , and on the face (110) from (111). In order to select the working systems at a certain moment of deformation, in situ experiments or with surface repolishing are used.
The deformation relief pattern observed upon deformation of single crystals of Cu-13 at.% Al for highly symmetric orientations at the corners of the stereographic triangle is shown in Figure 4. There is a good agreement between simulation results (Figure 3) and experiment (Figure 4).
The single crystal volume used in the experiment is several orders of magnitude larger than the volume simulated by the MD method. This is affected on the features that distinguish the deformation relief in simulating and the experimentally observed pattern. In the simulation, we analyze the shear of one of the possible slip planes. In reality, it goes along a system of parallel planes. It develops most actively in the central part of the sample, where the octahedral shear planes from all sides have an exit to free lateral faces. In this area, a uniaxial compression scheme is implemented. Near the compression surface deformation is hindered due to the forces of contact friction. In this area, the scheme of uneven uniaxial compression is realized. The diagrams in Figure 5 give an idea of the geometric arrangement of the most active slip planes. In Figure, the area in which the shear bands develop along one of the most loaded parallel shear planes are highlighted.
Deformation of grains in a polycrystal occurs under constrained conditions from the side of the nearest neighbors. This deformation feature is taken into account at the next stage of deformation simulation.

4.4. The Deformation Relief: Simulation of Individual Grain Deformation (The Constrained Deformation Conditions)

If we consider the deformation of the grains located on the inner part of the lateral face, then the following case of deformation can be accepted. A uniaxial compression force acts upon the selected volume of grain (single crystal). A shear is possible only towards the free surface. If we consider an individual grain (single crystal), then such a surface will be one of the four faces of the single crystal. We take the shape of a single crystal, as in the case of free lateral faces. The shape is a tetragonal prism with a height to width ratio of two. Taking into account the difference in the indices of the faces for the selected orientations, we have five cases of simulation. In the case of the compression axis [001] orientation, we have one case, as the lateral faces are equivalent. For the cases [110] and [ 1 1 ¯ 2 ] the side faces indices are different. Therefore, for these orientations, two calculation options are assumed.
The loaded layer parallel to the crystallographic compression plane sets the deformation during simulation in this, as in the previous case. The lateral displacement of the three lateral surfaces was limited. For this, a virtual stationary plane was formed along the surface of the lateral face. If in the deformation process the atoms in the sample crossed this plane, then additional forces began to act, simulating the constrained conditions.
In the case of the [001] orientation, 8 slip systems are equally loaded. Taking into account the shear direction, there will be 16 such systems. When the shear of the single crystal is limited towards the three lateral sides, one free lateral face of the {110} type remains. In this case, deformation seems to be the most probable shear along two out of four equally loaded octahedral planes and along two slip systems lying in each plane in the direction of the free face. One of such selected planes and a volume subject to shear along the system of such parallel planes was shown in Figure 5a. Thus, four shear systems can be distinguished in two slip planes. It is assumed that the result of deformation along these systems is the material deformation in the direction of this face.
The pattern of shear bands on the faces obtained in the simulation indicates a more complex nature of slip along octahedral planes in the bulk of the crystal in comparison with the case considered above. We observe that the shear bands occur from the side of the fixed face in the direction of the Z axis along the planes perpendicular to the lateral faces at 7% strain. Shear leads to the formation of shear bands parallel to the loaded layer (face (110) in Figure 6a). This corresponds to the above scheme of shearing along the selected planes. Here, however, we observe slanted shear bands. This indicates the action of two other octahedron planes perpendicular to the free surface. Thus, the crystal deformation towards the free lateral face occurs due to shear along four more slip systems (it is assumed that the direction of shear is towards the free lateral face). As a result, deformation is carried out along eight sliding systems out of 16 possible equally loaded slip directions.
We observe a similar organization of the shear for the case of all free lateral faces (Figure 3a and Figure 4a). The main difference is observed with developed deformation. More active slip processes in the crystal region adjacent to the free face led to an active change in shape in the direction of this face. Meanwhile, the shear activity is determined by the possibility of shear along the slip direction in both sides. Here, we see an obvious interruption of this possibility during deformation in cramped conditions. In the case of free lateral faces, an equal activity in 16 slip systems is possible, taking into account the slip direction. In the case of constrained deformation conditions (one lateral face is free)—only 8 slip systems. Figure 6b shows the case of the relief evolution at 24% strain. Different densities of systems of shear bands (i.e., having different orientations) on the portions of the faces indicates a different activity of slip systems and the realization of deformation through the forming of deformation domains in the volume of the single crystal. The deformation organization assumes a consistent deformation of the domains and maximum change in shape in the direction of the free lateral face.
The deformation of the other two orientations of single crystals also implies an active change in shape towards one of the free lateral faces. In these cases, it is also necessary to take into account the directional selectivity of the slip systems. In single crystals with a deformation axis orientation [110], in the case of free lateral faces, 8 slip systems are equally loaded (taking into account the slip direction). In the case of one free lateral face (001) or ( 1 ¯ 10 ) their number is reduced to four. The following remark should be made here. For this orientation of the deformation axis, in the case of uniaxial loading, the two octahedral shear planes are unloaded. However, as shown by experiments on FCC single crystals [40,41] in the region of uneven uniaxial compression the Schmidt factor for slip systems in these planes is nonzero. We see vertical shear band in this case. This case can easily be realized in polycrystals. The case of an inhomogeneous stress state is most likely under the neighboring grains action. In this case the number of existing slip systems may increase. The shear bands pattern observed at 7% strain in simulated [110] single crystals with a free lateral face ( 1 ¯ 10 ) is given in Figure 7a. The shear goes along 2 octahedral planes (shear bands from the second plane have a weak contrast). Considering that the direction of shear is carried out towards the free lateral face and 4 slip systems out of 8 previously assumed are involved in deformation taking into account the direction of shear. At 24% strain an active change in shape towards the free lateral face is observed, as well as vertical shear bands (Figure 7b). The latter indicates the action of previously unloaded slip planes and the activation of 4 more slip systems. The number of slip systems becomes 8.
The shear bands pattern in [110] single crystals with a free (001) face, deformed by 7%, is shown in Figure 7c. The shear goes along equally loaded planes towards the free face (X axis). Deformation goes through 4 sliding systems. At 24% strain activation of other slip systems is not observed (Figure 7d).
Two slip systems are maximally equally loaded in [ 1 1 ¯ 2 ] single crystals (4 systems if the direction of shear is taken into account). In single crystals with all free lateral faces the shear can occur with equal probability in all 4 systems. When the shear is limited to the side of three lateral faces, deformation in them occurs only along two slip systems toward the free lateral face (110). The Schmidt factor of these systems is 0.408. If the free lateral face is a face parallel to the crystallographic plane   ( 1 ¯ 11 ) , when the shear along these systems cannot realize the required shape change, as the shear directions lie in the plane of the face. Then, the most probable shear will be for systems with a Schmidt factor of 0.272. There can be four such systems that promote deformation towards the free lateral face. Simulation gives a qualitatively similar shear bands pattern at 7% strain (Figure 8a,c). At 24% strain the deformation relief in these two cases is noticeably different (Figure 8b,d). Thus, when limiting the shear towards the lateral faces, it becomes important to take into account the sign of the operating slip systems. Shear limitation can lead to a redistribution of slip systems, a decrease in their number, or activation of less loaded slip systems.

4.5. Analysis of Grains Deformation of Polycrystal Obtained by Electron Beam Melting

Let us analyze the regularities of slip in grains of a compression-deformed polycrystal obtained by the electron beam melting method. We choose the direction of deformation parallel to the growth of crystals (Y axis). Before deformation crystallographic study of grains was carried out by the EBSD method (Section 4.1). Figure 9 shows a fragment of face 2 with a superimposed map of grain orientation in IDF colors relative to the deformation axis Y on the slip band pattern at 7% strain. Seven grains with a clear picture of the development of shear bands were selected in the array of consideration. All orientations of the grain deformation axes are within the previously selected area of the inverse stereographic triangle. The grains color gives a visual representation of which part of the grains is close to the orientations [001], [110] and [ 1 1 ¯ 2 ] . The picture shows the crystallographic orientations of the grains relative to the Y axis, the indices of the shear bands, and the Schmidt factor of slip systems involved in the formation of shear bands. All shear bands correspond to slip systems with the maximum Schmidt factor. If several systems with close Schmidt factors can act in a grain, groups of parallel tracks from one slip system are observed in one region of the grain, and from another in the neighboring one. This shows the agreement between the simulation and experimental results. A transition of one system of slip bands in a grain into systems of slip bands of neighboring grains is observed. Usually, this effect is interpreted as transfer of shear from grain to grain. However, as follows from crystallographic and geometric analyzes and simulation results, this effect is due to a consistent shear in neighboring grains along the slip planes towards the free face. Noteworthy is the fact that the crystallographic orientations of the rotation axes lie, as a rule, on the boundaries of a standard stereographic triangle, and in most cases, the amount of misorientation between adjacent grains has an angle of up to 30 degrees.

5. Discussion

The deformation processes were considered above from the point of view of the deformation relief evolution. The main attention was paid to the regularities of the shear bands evolution on the lateral faces of single crystals. Deformation processes are accompanied by nucleation, slip and interaction of different type dislocations. Slip band patterns, mobile and sedentary configurations depend on the crystal’s orientation and their shape. Some of them were traced on FCC metals [32,33] and aluminum bronze with the deformation axis orientation [111] [33].
Let us consider the structural elements and deformation mechanisms using the example of a simulated [001] single crystal. Figure 10 shows the structure at different degrees of deformation of a single crystal with free lateral faces. Common Neighbor Analysis was used to visualize the defects: hexagonal close-packed (HCP) atoms are shown as red dots. The structure is presented intrinsic stacking fault (ISF), extrinsic stacking fault (ESF) and twin boundary (TB) (indicated in the Figure in the plane of the face). Structural elements revealed in Figure 10a indicate shear deformation in the main volume of the single crystal with the formation of interstitial stacking faults and deformation by twinning diagonally to the faces in the central part of the sample (central deformation domain). With increasing strain, the role of twinning in this region is retained. Slip deformation continues to develop in the adjacent parts of the crystal with the formation of predominantly interstitial stacking faults. Single subtraction packing faults can be observed. With further deformation and a decrease in the height of the sample, the stress state diagram in the main volume of the single crystal changes from the uniaxial compression scheme of stress to the uniform compression scheme in the central part of the sample and compression-tension scheme of stress at the lateral surfaces [40]. This leads to a change in the acting slip systems in the domains adjacent to the central (Figure 10b). The role of twinning in the central domain remains.
Let us carry out a similar analysis of the structural evolution with deformation for [001] single crystals with one free lateral face. At strain, when the uniaxial compression scheme is realized, the main features of the structural evolution are similar to the case of deformation of a specimen with free lateral faces (Figure 10c). Differences are observed when the scheme of principal stresses is changed (Figure 10d). The volume is divided into a set of domains with differing shear systems, in which interstitial stacking faults, rarely subtractions, and twins predominate. The density of stacking faults is higher than in the case of a crystal with free faces. Obviously, an important role is played by the change in the direction of the material flow under the action of another scheme of principal stresses. The uniaxial compression scheme is shifted towards the area bounded by impermeable walls. The tension–compression scheme covers a larger volume from the side of the free face. Overall, a similar consideration can be carried out for other cases of the crystallographic orientation of the compression axis and various options for limiting the shear towards the lateral faces, depending on their crystallographic orientation.
For the investigated orientations and cases of free and constrained deformation, the behavior of stress–strain curves from the simulation results can be considered and compared with the change in the fraction of HCP atoms and the total length of dislocations, which are related to the value of the deforming stress. These curves are shown in Figure 11. From the analysis of these curves, the following conclusions can be drawn.
Stress–strain curve analysis.
  • Strengthening depends not on the number of equally loaded slip systems, but on the possibility of interaction between dislocations of different slip systems. In this case, the relationship between the averaged values of the strain hardening coefficient θ = d σ d ε can be represented by the following ratio θ ¯ 001 > θ ¯ 112 > θ ¯ 110 0 .
  • Relationship between strain hardening coefficients for free and constrained deformation conditions: θ free θ c o n s t r .
  • θ c o n s t r depends on the face orientation.
  • The stages of the deformation curves do not always appear.
Relationship between the fraction of HCP atoms and the dislocations length with the stress–strain curve.
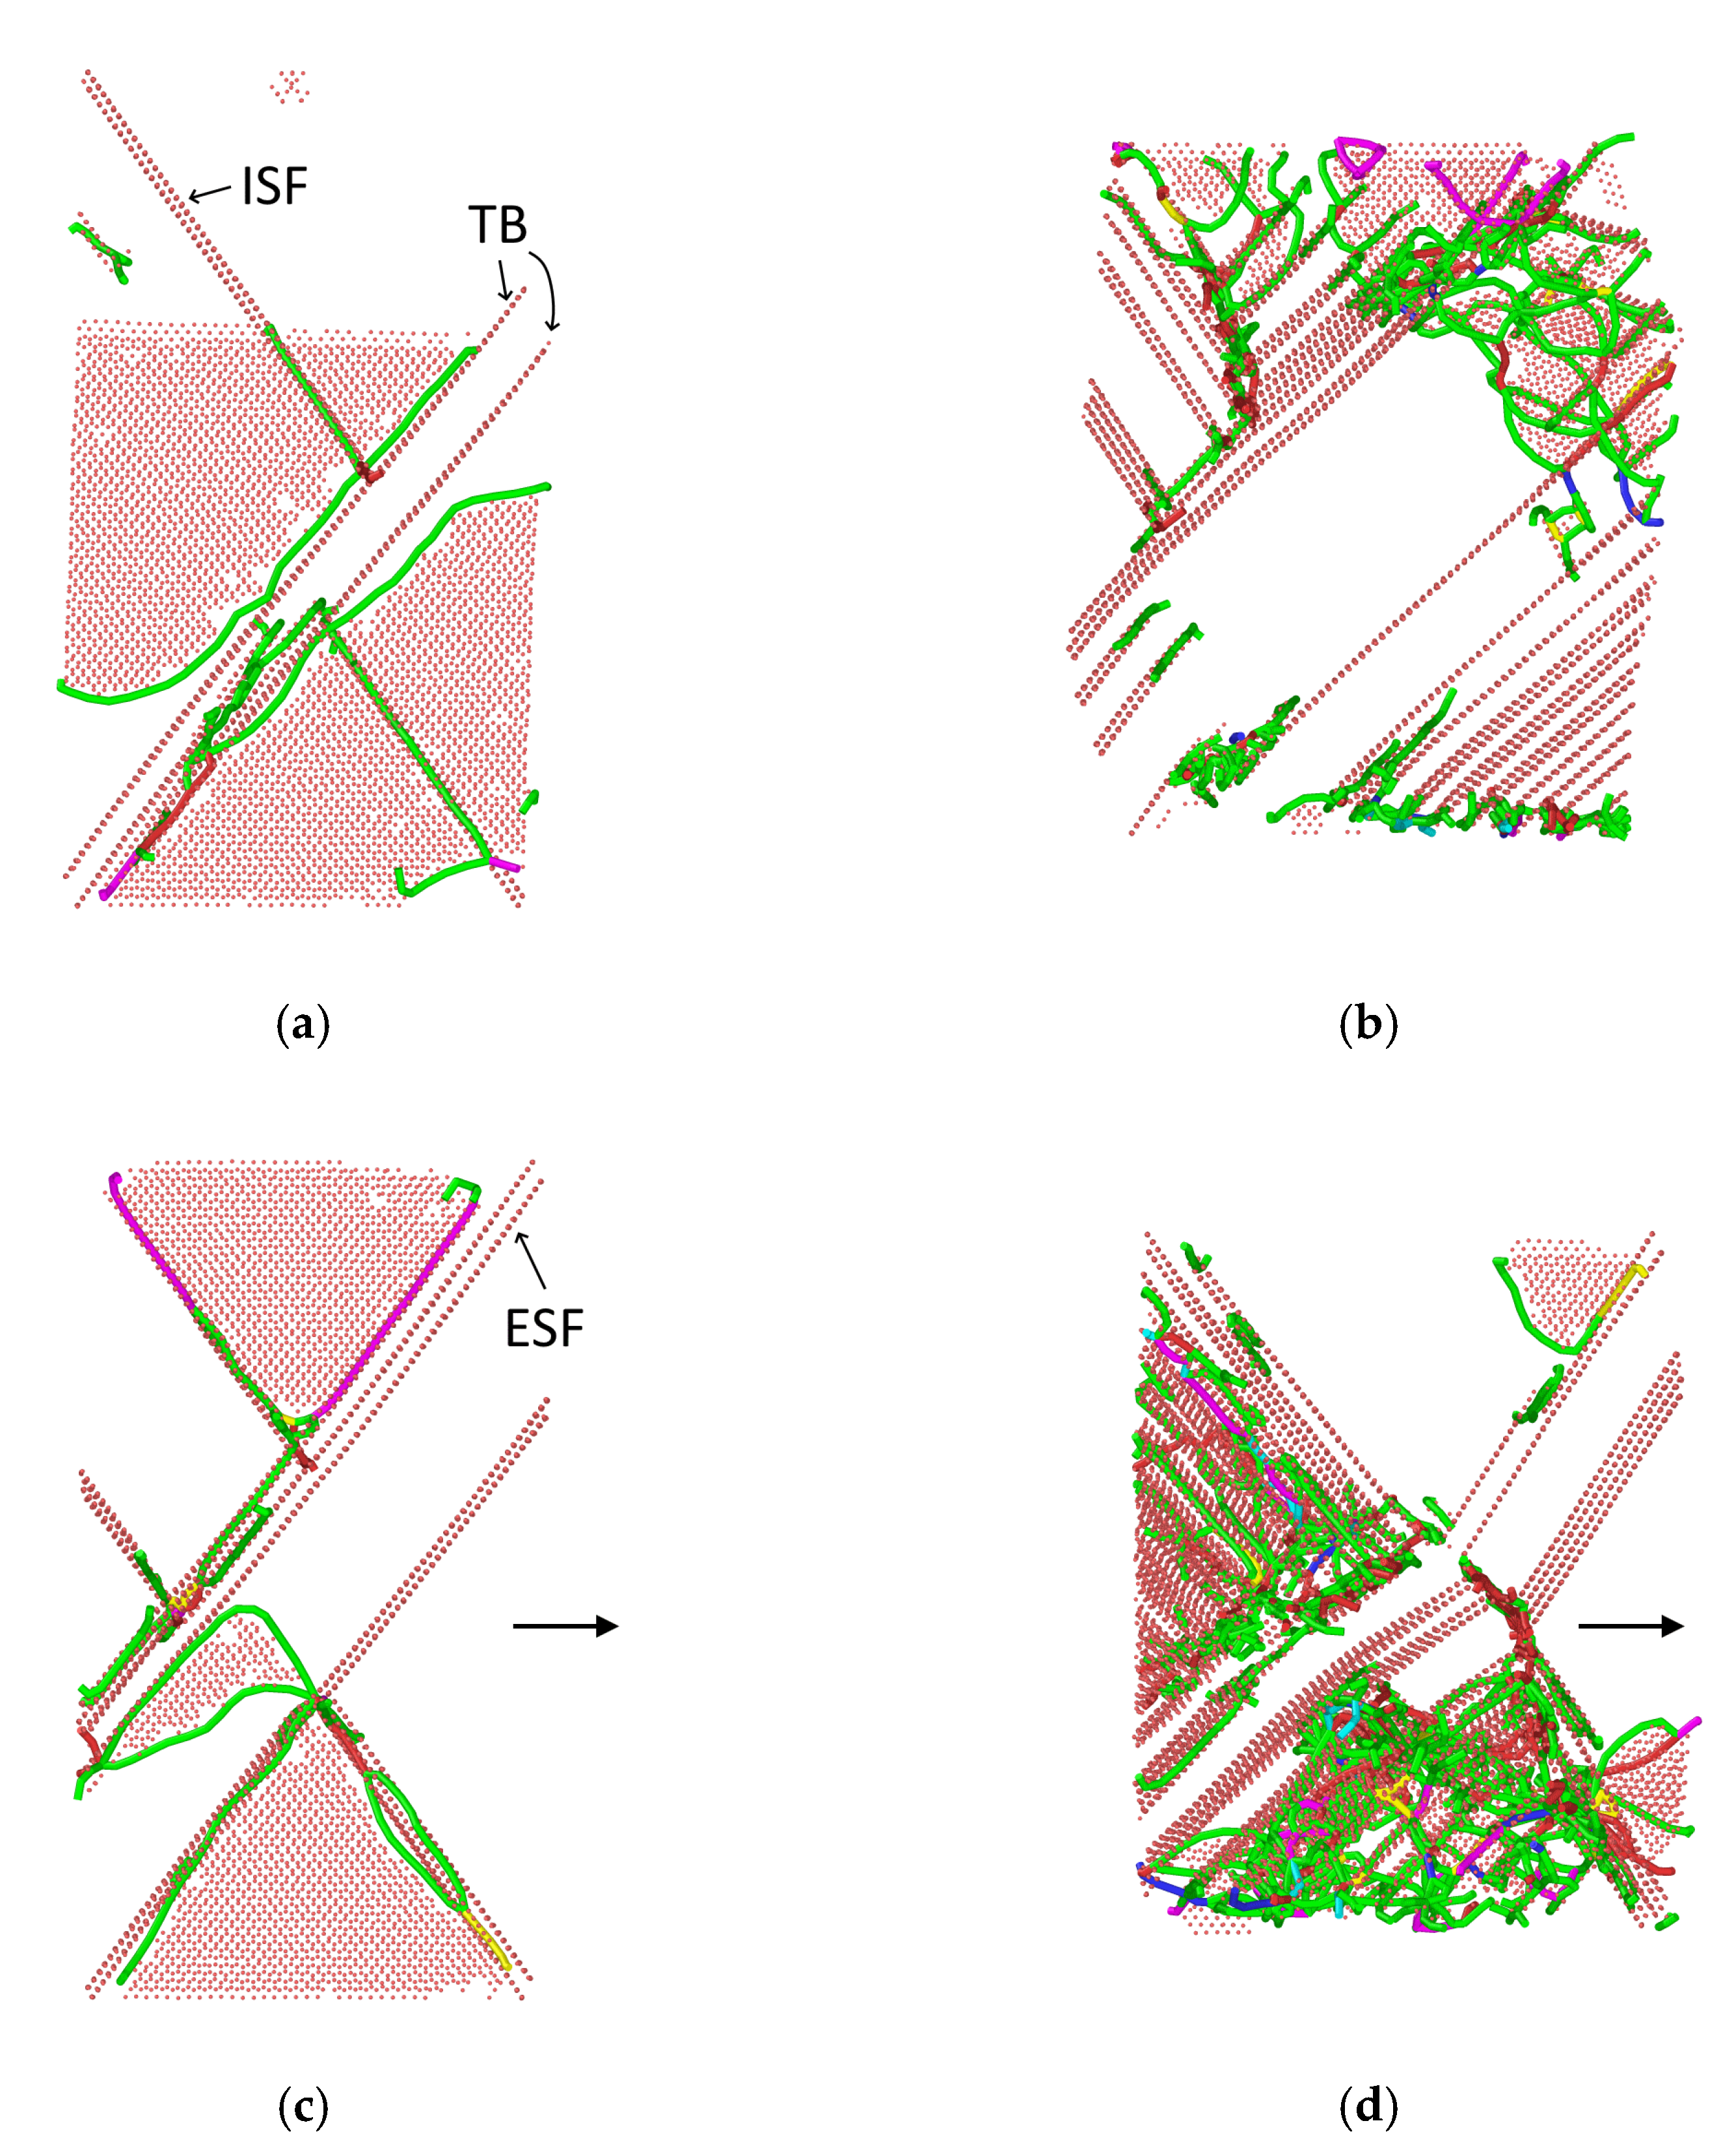
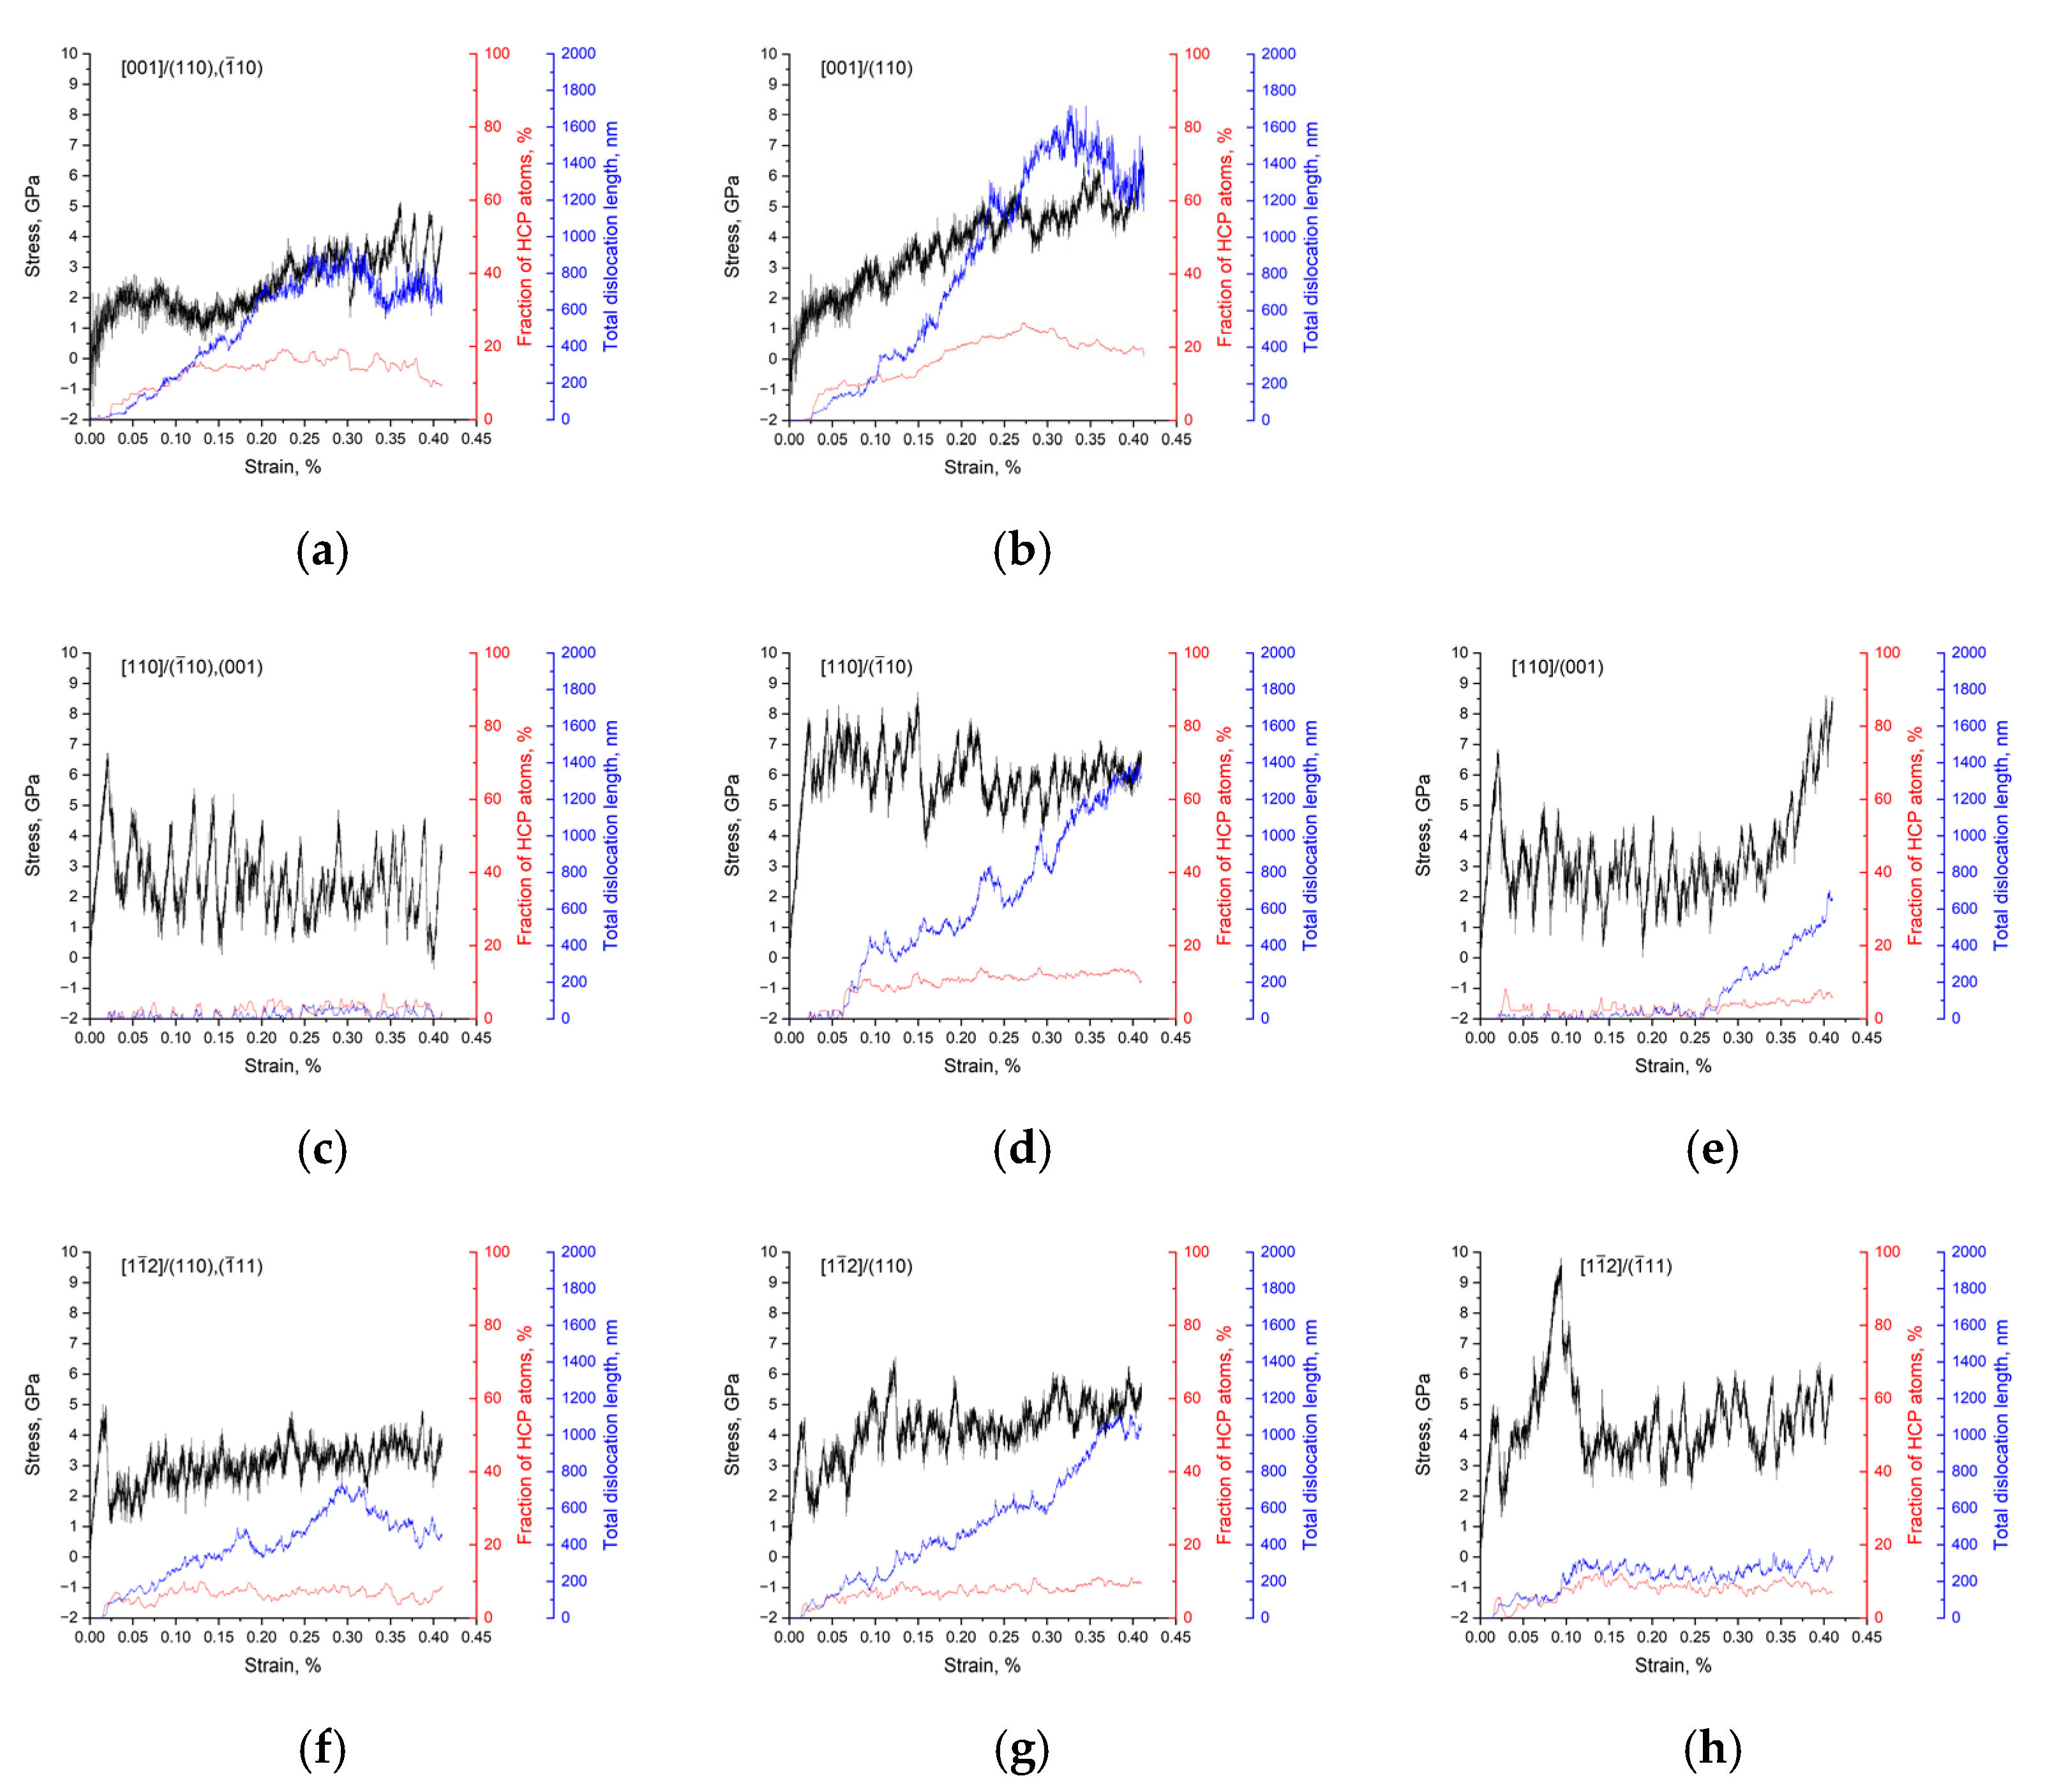
  • The fraction of HCP atoms increases at 15% strain for orientations most favorable for the interaction of different slip systems. Further growth is observed only for [001] single crystals deformed under constrained conditions.
  • The change in the fraction of HCP dislocations can be approximately compared with the change in stress up to 20% strain.
  • An increasing in stress for [001] single crystals with 20% strain correlates with an increasing in the total dislocation length while maintaining the fraction of HCP atoms at the same level for the cases of free and constrained deformation conditions.
  • In the case of single crystals [110] and [ 1 1 ¯ 2 ] an increasing in the total length of dislocations is not always accompanied by an increasing in the stress. The absence of such correlation is due to the possibility of deformation twinning along with slip.
Experimental results on the study of the dislocation structure by transmission electron microscope showed that for alloys with a low stacking fault energy, to which the investigated alloy belongs, at moderate deformations, the network dislocation structure prevails. [42,43,44]. With the development of deformation, twinning occurs along with slip. The authors of [44] associate twinning with a decrease in strain hardening at stage III. The formation of micro twins competes with the micro bands that forms at stage II of stress–strain curves. However, note that the representative volume in the study of single crystals is the entire single crystal. This is indicated by studies of single crystals fragmentation [40] and the simulation results. Moreover, the role of each of the volumes (deformation domains), in one of which there is twinning in the other, is still to be clarified. Let us note their different contributions to strain hardening. The contribution to strengthening during the network substructure formation depends on the dislocation density. When twins are formed, they determine their level of strain hardening. The next stage of strain hardening is the interaction of dislocations with twin boundaries [45].

6. Conclusions

The EBSD crystallographic analysis of grains formed during electron beam melting of aluminum bronze was carried out. The most extended in the direction of grain growth were analyzed and the most typical value of the boundaries misorientation angles was established—up to 30 degrees. The crystallographic orientations of the misorientation axes are at the boundaries of the inverse pole figure. Crystallographic analysis made it possible to isolate the most typical orientations and carry out a deformation analysis for them by the MD method. The regularities of shear during compression of single crystals with free lateral faces were traced. The analysis was carried out for the compression axes orientations [001], [110] and [ 1 1 ¯ 2 ] , which have a different number of equally loaded slip systems. The formation of deformation domains, differing in slip systems, is revealed by the results of modeling and is confirmed experimentally. Acting slip systems have a maximum Schmidt factor.
In polycrystalline grains, near-surface grains are deformed under conditions of limited deformation from the side of neighboring grains. To consider this effect, we simulated individual crystals with a limited shear towards three lateral faces. It was found that the selectivity of slip towards the free lateral face is noticeably appeared at significant deformations, when the stress tensor in the bulk of the crystal changes. Deformation occurs both in systems with the maximum Schmidt factor, and there can be a redistribution of slip systems and the use of systems with a lower Schmidt factor. The initial deformation of grains in samples of built-up material occurs in local regions of the grain by shear along one system of planes, and consistently in neighboring grains. The indexing of the shear bands orientation showed that the shear bands occur along the planes in which the systems with the maximum Schmidt factor operate.
Simulation of the structure has shown that deformation occurs by both slip and twinning. It is shown that the stress level is due to the slip resistance at dislocation forest and twin boundaries, as well as the twinning resistance. Comparisons with literature experimental data for [001] single crystals made.
According to the simulation results, it was revealed that deformation in confined conditions leads, as a rule, to a higher stress level and coefficient of strain hardening compared to deformation in free conditions. A higher density of defects of various types accompanies this process.

Author Contributions

Conceptualization, D.V.L. and A.Y.N.; writing—original draft preparation, D.V.L. and A.Y.N.; software, A.Y.N. and A.A.B.; writing—review and editing, A.A.B.; experiment D.V.L. and O.S.N. All authors have read and agreed to the published version of the manuscript.

Funding

This research was funded the Research Program 20-72-10184 of the Russian Science Foundation for 2020–2023.

Institutional Review Board Statement

Not applicable.

Informed Consent Statement

Not applicable.

Data Availability Statement

The data presented in this study are available on request from the corresponding author.

Acknowledgments

The authors express their gratitude Starenchenko V.A. for providing single crystals for research, Shamarin N.N. for surfacing, Moskvichev E.N. for EBSD analysis. Investigations were carried out using the equipment of Tomsk Regional Core Shared Research Facilities Center of National Research Tomsk State University and Institute of Strength Physics and Materials Science of the Siberian Branch of the Russian Academy of Sciences.

Conflicts of Interest

The authors declare no conflict of interest.

References

  1. Clare, A.T.; Mishra, R.S.; Merklein, M.; Tan, H.; Todd, I.; Chechik, L.; Li, J.; Bambach, M. Alloy design and adaptation for additive manufacture. J. Mater. Process. Technol. 2022, 299, 117358. [Google Scholar] [CrossRef]
  2. Gaytan, S.M.; Murr, L.E.; Martinez, E.; Martinez, J.L.; Machado, B.I.; Ramirez, D.A.; Medina, F.; Collins, S.; Wicker, R.B. Comparison of Microstructures and Mechanical Properties for Solid and Mesh Cobalt-Base Alloy Prototypes Fabricated by Electron Beam Melting. Metall. Mater. Trans. A 2010, 41, 3216–3227. [Google Scholar] [CrossRef]
  3. Muhammad, M.; Nezhadfar, P.D.; Thompson, S.; Saharan, A.; Phan, N.; Shamsaei, N. A comparative investigation on the microstructure and mechanical properties of additively manufactured aluminum alloys. Int. J. Fatigue 2021, 146, 106165. [Google Scholar] [CrossRef]
  4. Blakey-Milner, B.; Gradl, P.; Snedden, G.; Brooks, M.; Pitot, J.; Lopez, E.; Leary, M.; Berto, F.; du Plessis, A. Metal additive manufacturing in aerospace: A review. Mater. Des. 2021, 209, 110008. [Google Scholar] [CrossRef]
  5. Lopez-Galilea, I.; Ruttert, B.; He, J.; Hammerschmidt, T.; Drautz, R.; Gault, B.; Theisen, W. Additive manufacturing of CMSX-4 Ni-base superalloy by selective laser melting: Influence of processing parameters and heat treatment. Addit. Manuf. 2019, 30, 100874. [Google Scholar] [CrossRef]
  6. Buchbender, I.; Hoff, C.; Hermsdorf, J.; Wesling, V.; Kaierle, S. Single-crystal height extension by Laser Metal Deposition of CMSX-4. Procedia CIRP 2020, 94, 304–309. [Google Scholar] [CrossRef]
  7. Hitzler, L.; Merkel, M.; Hall, W.; Öchsner, A. A Review of Metal Fabricated with Laser- and Powder-Bed Based Additive Manufacturing Techniques: Process, Nomenclature, Materials, Achievable Properties, and its Utilization in the Medical Sector. Adv. Eng. Mater. 2018, 20, 1700658. [Google Scholar] [CrossRef] [Green Version]
  8. Bailey, N.S.; Katinas, C.; Shin, Y.C. Laser direct deposition of AISI H13 tool steel powder with numerical modeling of solid phase transformation, hardness, and residual stresses. J. Mater. Process. Technol. 2017, 247, 223–233. [Google Scholar] [CrossRef]
  9. DebRoy, T.; Wei, H.L.; Zuback, J.S.; Mukherjee, T.; Elmer, J.W.; Milewski, J.O.; Beese, A.M.; Wilson-Heid, A.; De, A.; Zhang, W. Additive manufacturing of metallic components–Process, structure and properties. Prog. Mater. Sci. 2018, 92, 112–224. [Google Scholar] [CrossRef]
  10. Ngo, T.D.; Kashani, A.; Imbalzano, G.; Nguyen, K.T.Q.; Hui, D. Additive manufacturing (3D printing): A review of materials, methods, applications and challenges. Compos. Part B Eng. 2018, 143, 172–196. [Google Scholar] [CrossRef]
  11. Heinl, P.; Rottmair, A.; Körner, C.; Singer, R.F. Cellular Titanium by Selective Electron Beam Melting. Adv. Eng. Mater. 2007, 9, 360–364. [Google Scholar] [CrossRef]
  12. Silbernagel, C.; Gargalis, L.; Ashcroft, I.; Hague, R.; Galea, M.; Dickens, P. Electrical resistivity of pure copper processed by medium-powered laser powder bed fusion additive manufacturing for use in electromagnetic applications. Addit. Manuf. 2019, 29, 100831. [Google Scholar] [CrossRef]
  13. Khoroshko, E.; Filippov, A.; Tarasov, S.; Shamarin, N.; Moskvichev, E.; Fortuna, S.; Lychagin, D.V.; Kolubaev, E. Strength and Ductility Improvement through Thermomechanical Treatment of Wire-Feed Electron Beam Additive Manufactured Low Stacking Fault Energy (SFE) Aluminum Bronze. Metals 2020, 10, 1568. [Google Scholar] [CrossRef]
  14. Zhang, X.; Pan, T.; Chen, Y.; Li, L.; Zhang, Y.; Liou, F. Additive manufacturing of copper-stainless steel hybrid components using laser-aided directed energy deposition. J. Mater. Sci. Technol. 2021, 80, 100–116. [Google Scholar] [CrossRef]
  15. Rappaz, M.; Gandin, C.-A. Probabilistic modelling of microstructure formation in solidification processes. Acta Metall. Mater. 1993, 41, 345–360. [Google Scholar] [CrossRef]
  16. Thijs, L.; Verhaeghe, F.; Craeghs, T.; Van Humbeeck, J.; Kruth, J.-P. A study of the microstructural evolution during selective laser melting of Ti–6Al–4V. Acta Mater. 2010, 58, 3303–3312. [Google Scholar] [CrossRef]
  17. Dinda, G.P.; Dasgupta, A.K.; Mazumder, J. Evolution of microstructure in laser deposited Al–11.28%Si alloy. Surf. Coat. Technol. 2012, 206, 2152–2160. [Google Scholar] [CrossRef]
  18. Piglione, A.; Dovgyy, B.; Liu, C.; Gourlay, C.M.; Hooper, P.A.; Pham, M.S. Printability and microstructure of the CoCrFeMnNi high-entropy alloy fabricated by laser powder bed fusion. Mater. Lett. 2018, 224, 22–25. [Google Scholar] [CrossRef]
  19. Pham, M.S.; Dovgyy, B.; Hooper, P.A. Twinning induced plasticity in austenitic stainless steel 316L made by additive manufacturing. Mater. Sci. Eng. A 2017, 704, 102–111. [Google Scholar] [CrossRef]
  20. Dinda, G.P.; Dasgupta, A.K.; Mazumder, J. Texture control during laser deposition of nickel-based superalloy. Scr. Mater. 2012, 67, 503–506. [Google Scholar] [CrossRef]
  21. Ramsperger, M.; Singer, R.F.; Körner, C. Microstructure of the Nickel-Base Superalloy CMSX-4 Fabricated by Selective Electron Beam Melting. Metall. Mater. Trans. A 2016, 47, 1469–1480. [Google Scholar] [CrossRef] [Green Version]
  22. Zhu, Y.-Y.; Tang, H.-B.; Li, Z.; Xu, C.; He, B. Solidification behavior and grain morphology of laser additive manufacturing titanium alloys. J. Alloy. Compd. 2019, 777, 712–716. [Google Scholar] [CrossRef]
  23. Pham, M.-S.; Dovgyy, B.; Hooper, P.A.; Gourlay, C.M.; Piglione, A. The role of side-branching in microstructure development in laser powder-bed fusion. Nat. Commun. 2020, 11, 749. [Google Scholar] [CrossRef]
  24. Ramirez, D.A.; Murr, L.E.; Martinez, E.; Hernandez, D.H.; Martinez, J.L.; Machado, B.I.; Medina, F.; Frigola, P.; Wicker, R.B. Novel precipitate–microstructural architecture developed in the fabrication of solid copper components by additive manufacturing using electron beam melting. Acta Mater. 2011, 59, 4088–4099. [Google Scholar] [CrossRef]
  25. Dharmendra, C.; Gururaj, K.; Pradeep, K.G.; Mohammadi, M. Characterization of κ-precipitates in wire-arc additive manufactured nickel aluminum bronze: A combined transmission Kikuchi diffraction and atom probe tomography study. Addit. Manuf. 2021, 46, 102137. [Google Scholar] [CrossRef]
  26. Dharmendra, C.; Amirkhiz, B.S.; Lloyd, A.; Ram, G.D.J.; Mohammadi, M. Wire-arc additive manufactured nickel aluminum bronze with enhanced mechanical properties using heat treatments cycles. Addit. Manuf. 2020, 36, 101510. [Google Scholar] [CrossRef]
  27. Filippov, A.; Shamarin, N.; Moskvichev, E.; Savchenko, N.; Kolubaev, E.; Khoroshko, E.; Tarasov, S. Heat Input Effect on Microstructure and Mechanical Properties of Electron Beam Additive Manufactured (EBAM) Cu-7.5wt.%Al Bronze. Materials 2021, 14, 6948. [Google Scholar] [CrossRef]
  28. Wei, D.; Anniyaer, A.; Koizumi, Y.; Aoyagi, K.; Nagasako, M.; Kato, H.; Chiba, A. On microstructural homogenization and mechanical properties optimization of biomedical Co-Cr-Mo alloy additively manufactured by using electron beam melting. Addit. Manuf. 2019, 28, 215–227. [Google Scholar] [CrossRef]
  29. Kurian, S.; Mirzaeifar, R. Selective laser melting of aluminum nano-powder particles, a molecular dynamics study. Addit. Manuf. 2020, 35, 101272. [Google Scholar] [CrossRef]
  30. Singh, G.; Waas, A.M.; Sundararaghavan, V. Understanding defect structures in nanoscale metal additive manufacturing via molecular dynamics. Comput. Mater. Sci. 2021, 200, 110807. [Google Scholar] [CrossRef]
  31. Arifin, R.; Astuti, F.; Baqiya, M.A.; Winardi, Y.; Wicaksono, Y.A.; Darminto; Selamat, A. Structural Change of TiAl Alloy under Uniaxial Tension and Compression in the <001>; Direction: A Molecular Dynamics Study. Metals 2021, 11, 1760. [Google Scholar] [CrossRef]
  32. Lychagin, D.; Dmitriev, A.; Nikonov, A.; Alfyorova, E. Crystallographic and Geometric Factors in the Shear Development in <001> FCC Single Crystals: Molecular Dynamics Simulation and Experimental Study. Crystals 2020, 10, 666. [Google Scholar] [CrossRef]
  33. Nikonov, A.Y.; Dmitriev, A.I.; Lychagin, D.V.; Lychagina, L.L.; Bibko, A.A.; Novitskaya, O.S. Numerical Study and Experimental Validation of Deformation of <111> FCC CuAl Single Crystal Obtained by Additive Manufacturing. Metals 2021, 11, 582. [Google Scholar] [CrossRef]
  34. CHANNEL 5, General Introduction, Oxford Instruments HKL. 2007, p. 475. Available online: www.oxinst.com. (accessed on 13 December 2021).
  35. Plimpton, S. Fast Parallel Algorithms for Short-Range Molecular Dynamics. J. Comput. Phys. 1995, 117, 1–19. [Google Scholar] [CrossRef] [Green Version]
  36. Mishin, Y.; Farkas, D.; Mehl, M.; Papaconstantopoulos, D. Interatomic potentials for monoatomic metals from experimental data and ab initio calculations. Phys. Rev. B 1999, 59, 3393–3407. [Google Scholar] [CrossRef] [Green Version]
  37. Cai, J.; Ye, Y.Y. Simple analytical embedded-atom-potential model including a long-range force for fcc metals and their alloys. Phys. Rev. B 1996, 54, 8398–8410. [Google Scholar] [CrossRef]
  38. Stukowski, A. Visualization and analysis of atomistic simulation data with OVITO–the Open Visualization Tool. Model. Simul. Mater. Sci. Eng. 2010, 18, 015012. [Google Scholar] [CrossRef]
  39. Stukowski, A.; Bulatov, V.V.; Arsenlis, A. Automated identification and indexing of dislocations in crystal interfaces. Model. Simul. Mater. Sci. Eng. 2012, 20, 085007. [Google Scholar] [CrossRef]
  40. Lychagin, D.V. Fragmentation of plastically deformed fcc metallic materials. Phys. Mesomech. 2006, 9, 95–105. (In Russian) [Google Scholar]
  41. Teplyakova, L.A.; Lychagin, D.V.; Bespalova, I.V. Mechanisms of deformation macrolocalization in aluminium single crystals with loading axis orientation [110]. Phys. Mesomech. 2004, 7, 63–78. [Google Scholar]
  42. Pande, C.S.; Hazzledine, P.M. Dislocation arrays in Cu-Al alloys. II. Philos. Mag. 1971, 24, 1393–1410. [Google Scholar] [CrossRef]
  43. Fujita, H.; Sumida, N.; Kimura, S.; Takemoto, T. Dislocation Multipoles in Slightly Deformed Cu–10 at%Al Single Crystals. J. Phys. Soc. Jpn. 1982, 51, 577–582. [Google Scholar] [CrossRef]
  44. Solov’ev, A.N.; Starenchenko, S.V.; Solov’eva, Y.V.; Starenchenko, V.A. Substructural Transformations in Cu–12 at.% Al Single Crystals with [001] Deformation Axis. Russ. Phys. J. 2020, 63, 1233–1237. [Google Scholar] [CrossRef]
  45. Starenchenko, S.V.; Solov’eva, Y.V.; Starenchenko, V.A.; Solov’ev, A.N. Stress and Strain Effect on Defect Structure Parameters of Single Crystals in Cu–12 at.% Al Alloy. Russ. Phys. J. 2021, 64, 625–631. [Google Scholar] [CrossRef]
Figure 1. The orientation grains maps relative to the Y axis of three mutually perpendicular faces of the sample in colors IPF and 1, 2 and 3 faces IPF relative to the Y axis.
Metals 12 00114 g001
Figure 2. The orientation schemes of single crystals slip systems (panels (ac) differ in the direction of the deformation axis and the orientation of the lateral faces, which are indicated in the sub-pictures).
Metals 12 00114 g002
Figure 3. The deformation relief of simulated single crystals in the case of free lateral faces, ε = 7% (panels (ac) differ in the direction of the deformation axis and the orientation of the lateral faces, which are indicated in the sub-pictures).
Metals 12 00114 g003
Figure 4. Experimentally observed single crystals deformation relief, ε = 7% (panels (a,b) differ in the direction of the deformation axis and the orientation of the lateral faces, which are indicated in the sub-pictures).
Metals 12 00114 g004
Figure 5. The volume of the single crystals covered by a shear along one system of the most active slip planes (panels (ac) differ in the direction of the deformation axis and the orientation of the lateral faces, which are indicated in the sub-pictures).
Metals 12 00114 g005
Figure 6. The deformation relief of simulated [001]-single crystal, ε = 7% (a) and 24% (b) (the constrained deformation conditions, the free lateral face ( 1 ¯ 1 ¯ 0 ) ).
Metals 12 00114 g006
Figure 7. The deformation relief of simulated [110]-single crystals, ε = 7% (a,c), 24% (b,d) (the constrained deformation conditions; (a,b) the free lateral face ( 1 1 ¯ 0 ) ; (c,d) the free lateral face ( 00 1 ¯ ) ).
Metals 12 00114 g007
Figure 8. The deformation relief of simulated [ 1 1 ¯ 2 ] -single crystals, ε = 7% (a,c), 24% (b,d) (the constrained deformation conditions; (a,b) the free lateral face ( 1 ¯ 1 ¯ 0 ) ; (c,d) the free lateral face ( 1 1 ¯ 1 ¯ ) ).
Metals 12 00114 g008
Figure 9. The fragment of face 2: the grain orientation map and the deformation relief superimposed on it (explanations in the text).
Metals 12 00114 g009
Figure 10. The deformation structure of simulated [001]-single crystal: (a,b) the case of free lateral faces; (c,d) the constrained deformation conditions (the arrow indicates the direction from the free face); (a,c) ε = 7%, (b,d) ε = 24%.
Metals 12 00114 g010
Figure 11. Stress–strain curves, the fraction of atoms in the sites of the HCP lattice, and the length of dislocations depending on the strain: (a,b) [001]-single crystals; (c,d,e) [110]-single crystals; (f,g,h) [112]-single crystals. On the graph, the direction of deformation and the free lateral face ((a,c,f) four or (b,d,e,g,h) one) are indicated.
Metals 12 00114 g011
Publisher’s Note: MDPI stays neutral with regard to jurisdictional claims in published maps and institutional affiliations.

