1. Introduction
Techniques based on layer-by-layer fabrication have expanded enormously over the past two decades due to the availability of a variety of materials (metals, ceramics, polymers, and sands) and post-treatment procedures [
1]. These technologies began for the manufacture of prototypes due to the geometric freedom and validation of physical prototypes during the product development cycle, reducing delivery time. [
2,
3]. However, several sectors (aerospace, automotive, foundry) have included this new technology in their production to make functional parts. In particular, casting industries immediately identified the benefits of additive manufacturing for the production of molds [
4]. The ability to make parts layer by layer allows the designer to achieve one-piece molds, integrating sprue, runner, gate, and feeder into the mold design, and these unique geometries and complex designs are difficult to achieve through traditional casting processes. In addition, manufacturing time is reduced since the production of patterns, use of tools, and machining processes is avoided [
5]. These aspects generate enormous advantages considering that more than 70% of all metal castings are produced by the sand casting process [
6]. Moreover, sand consumption can be significantly reduced with the additive manufacturing process, which can be helpful for energy saving and reducing environmental pollution as it allows the selective deposition of an acid catalyst (e.g., furan).
Binder jetting is one of the most suitable additive manufacturing technologies for the manufacture of casting molds. Several studies have focused on improving this process, applied to different materials. Tang et al. [
7] optimized the binder jetting process for inkjet printing Ti6Al4V parts with excellent properties. Mariani et al. [
8] demonstrated the feasibility of binder jetting technology to print WC–Co parts. This study revealed the importance of the characteristics of the initial powder and its influence on the mechanical properties of the printed parts. Other studies have focused on improving inkjet technology. Cheng et al. [
9] investigated the process of driving waveform design for the multi-nozzle piezoelectric printhead. The developed procedure allows reducing the number of experimental tests to find suitable waveform parameters for different 3D printers and new materials. Other studies [
10] have focused on improving the roller-type leveling mechanism in order to achieve desired layer thickness, smooth surface, and good color quality. Li et al. [
11] conducted a study to solve the jamming problem of the printhead and to improve the dimensional accuracy of binder jetting technology. For this purpose, several water-based binders and gypsum composite powders were prepared, and the optimum binder-powder assembly was then determined through elementary adhesive testing and roller paving testing.
In the bibliography, there are several works focused on validating the advantages of applying additive manufacturing technologies to the manufacture of casting molds. Sneling et al. [
12] took advantage of using 3D printed molds to cast parts with complex geometries, such as cellular structures and sandwich panels. In this way, they would avoid joints in the final part that would act as stress concentrators. Walker et al. [
13] used binder injection technology to manufacture molds with built-in sensors that allowed monitoring the casting process by recording different parameters (temperature, pressure, humidity, gas chemistry) in different parts of the mold during the casting process.
Despite the advantages of applying additive manufacturing in the foundry industry, the process is not yet ready to completely replace the traditional casting process. A deeper understanding of the properties of printed molds and their effect on the quality of castings is still needed. The quality of castings depends on various factors related to the casting process, as well as the properties of the mold used. With regard to the casting process, it is necessary to consider the rate of heat removal from the metal to the mold, the pouring temperature, and the chemical composition of the starting alloy. Regarding the properties of the mold, it is necessary to know the mechanical properties, the surface finish, and the permeability fundamentally. Most of the studies have focused on studying the properties of printed molds using gypsum powder and sand in order to obtain castings of light alloys such as aluminum. McKenna et al. [
14] analyzed the effects of temperature and curing time on the mechanical properties of the printed mold. The authors concluded that due to the loss of volatile compounds, permeability increased with increasing curing time. Vaezi et al. [
15] studied the effect of layer thickness on mold properties. They observed that by decreasing the thickness of the layer and increasing the amount of binder added between particles bond, an improvement in tensile strength was achieved, although worse results were produced in the surface quality of the mold. Edwin et al. [
16] studied the feasibility of printing plaster molds to produce aluminum metal castings. To improve the mechanical and thermal properties of the mold, they performed post-processing operations such as infiltration. The infiltrated molds had good resistance to heat, although the mold did not have enough mechanical strength to withstand the metallostatic pressure due to the molten metal.
There have been some studies that analyzed the quality of the castings obtained from 3d printed molds but the number of studies is limited. Snelling et al. [
17,
18] conducted a comparative study using two different materials to produce the 3DP mold—ZCorp’s plaster vs. ExOne’s silica—in order to obtain A356 aluminum alloy casting. In this study, they focused on analyzing various properties of the casting, including roughness, density, hardness, porosity, and microstructure. They concluded that the material of the mold significantly influences the quality of the final part. Different factors, such as the amount of binder used to bind the particles of the mold, the grain size, the permeability, and the composition of the mold material, modify the material properties of resultant castings. These properties are related to the microstructural aspects of the final casting matrix (secondary dendrite arm separation, grain size), secondary intermetallic phases (size, morphology, distribution, and quantity), and porosity [
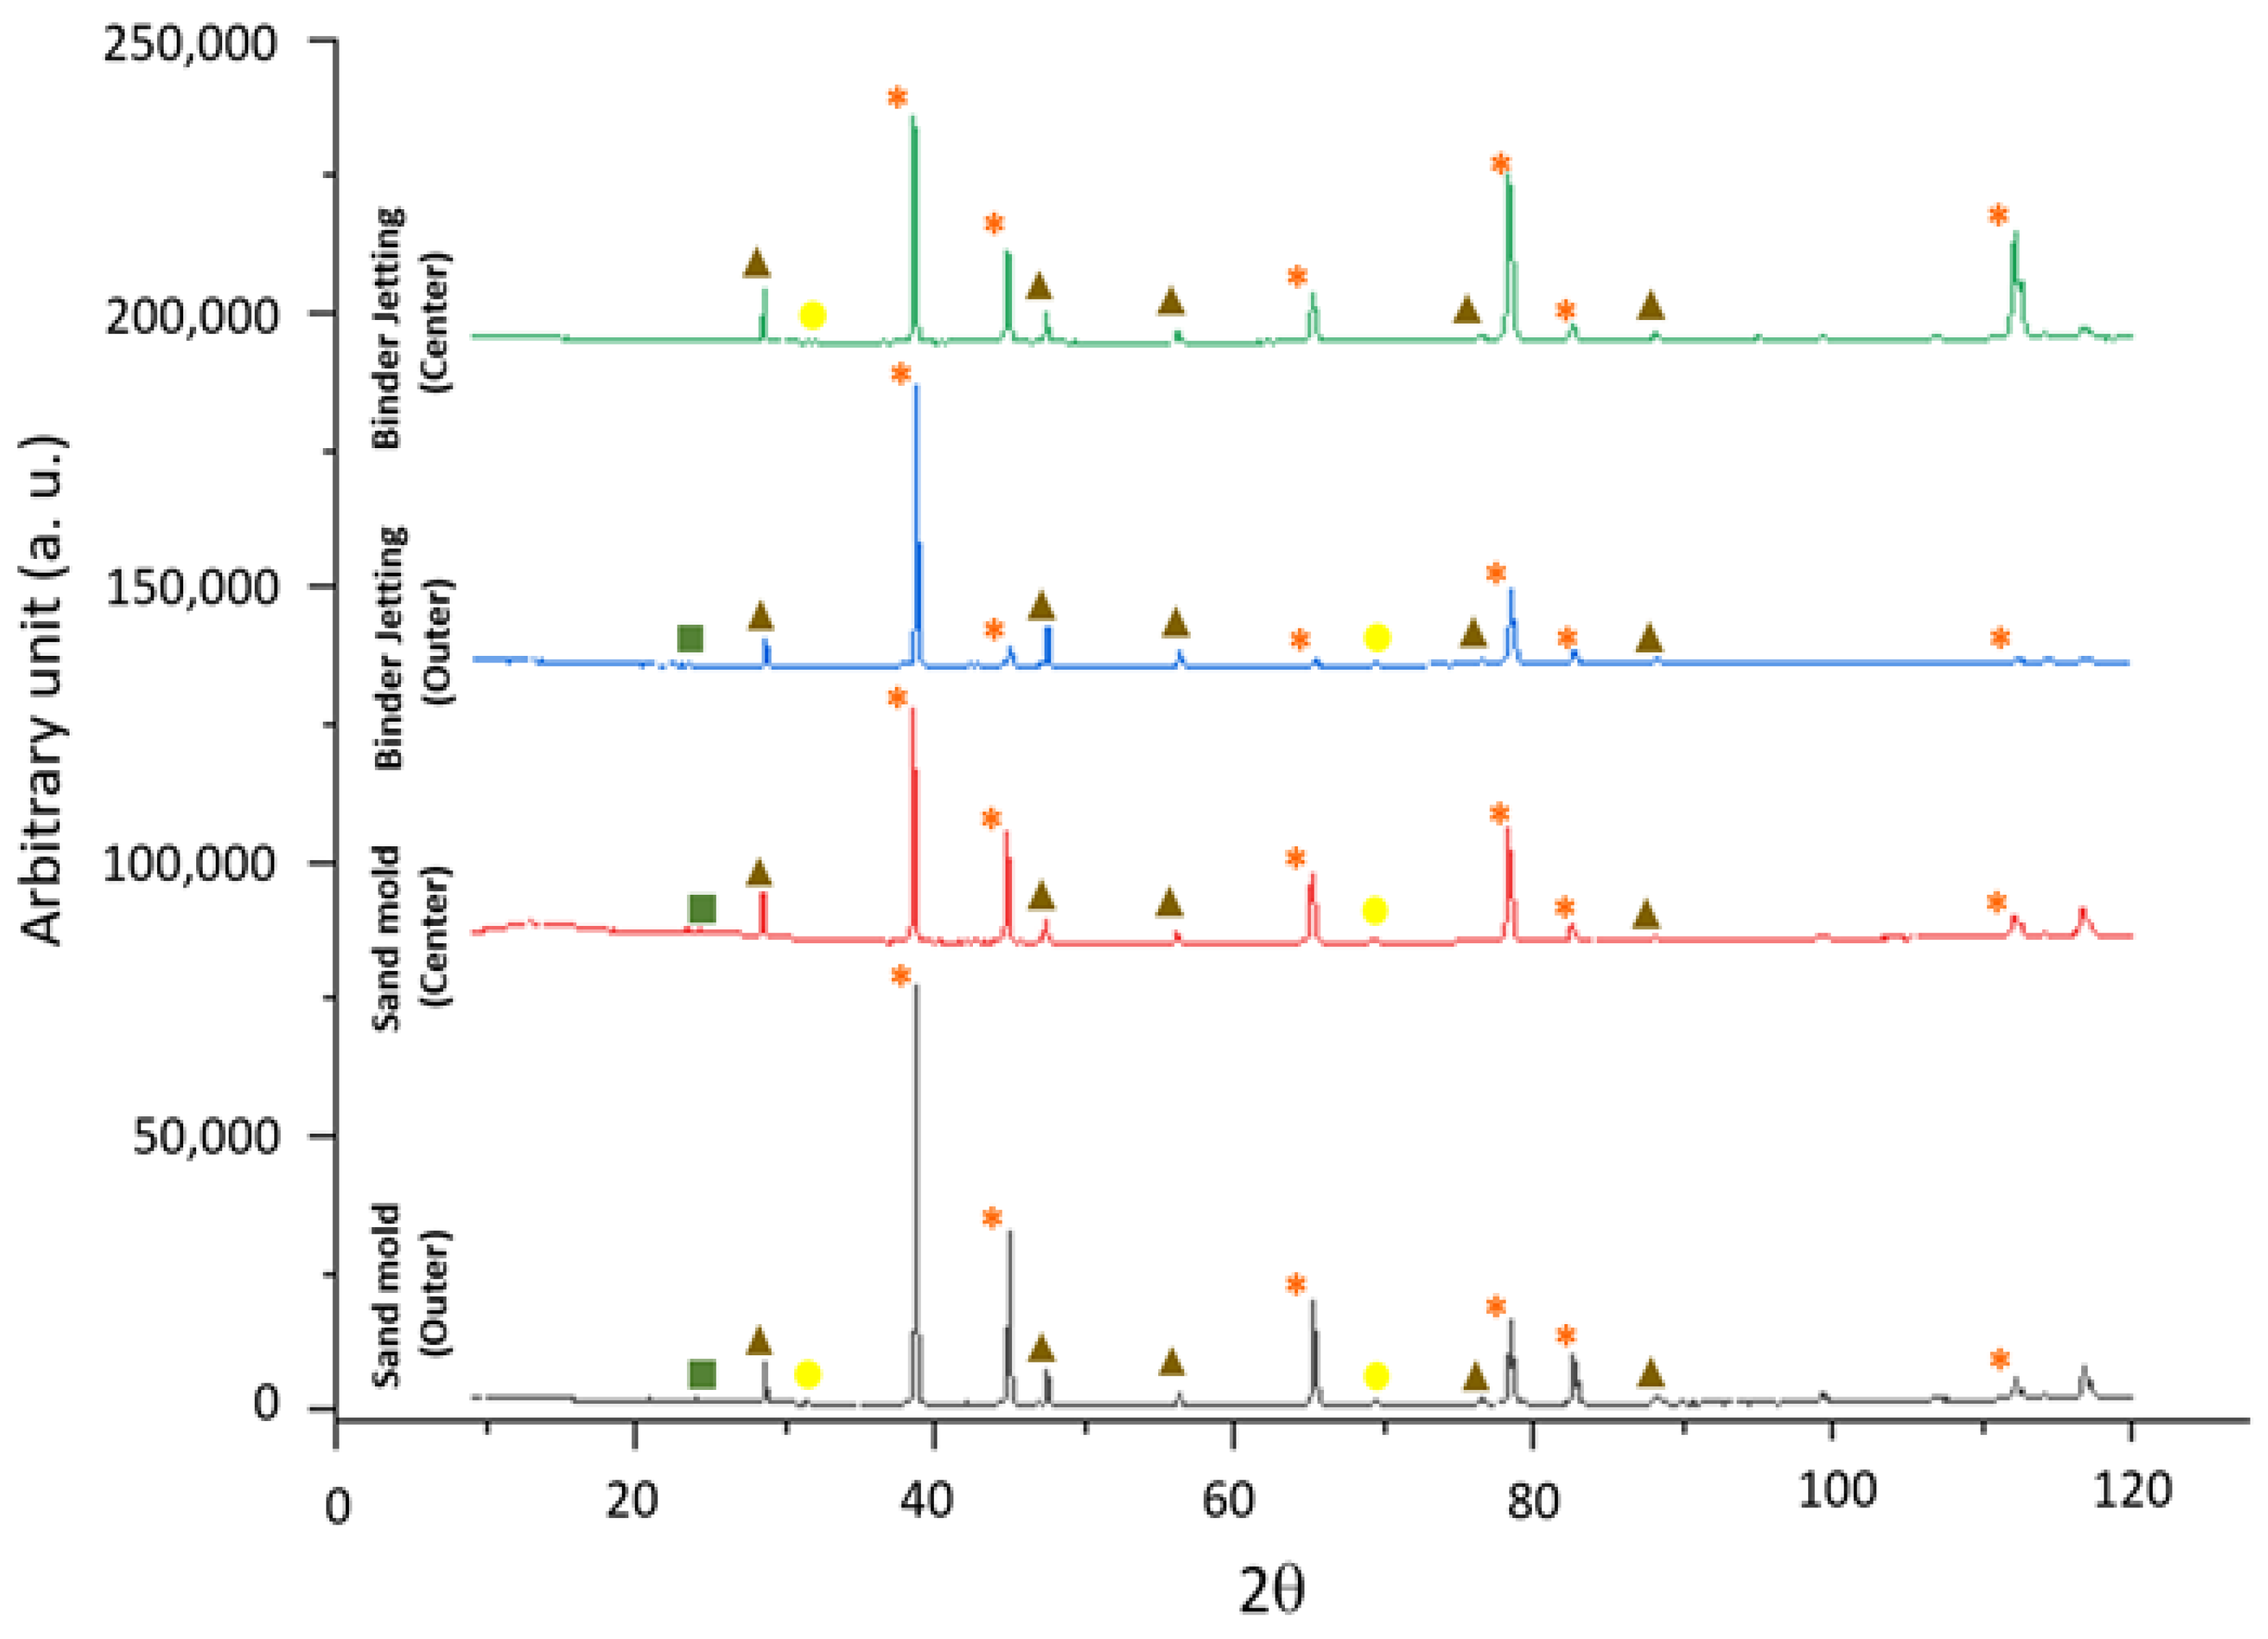
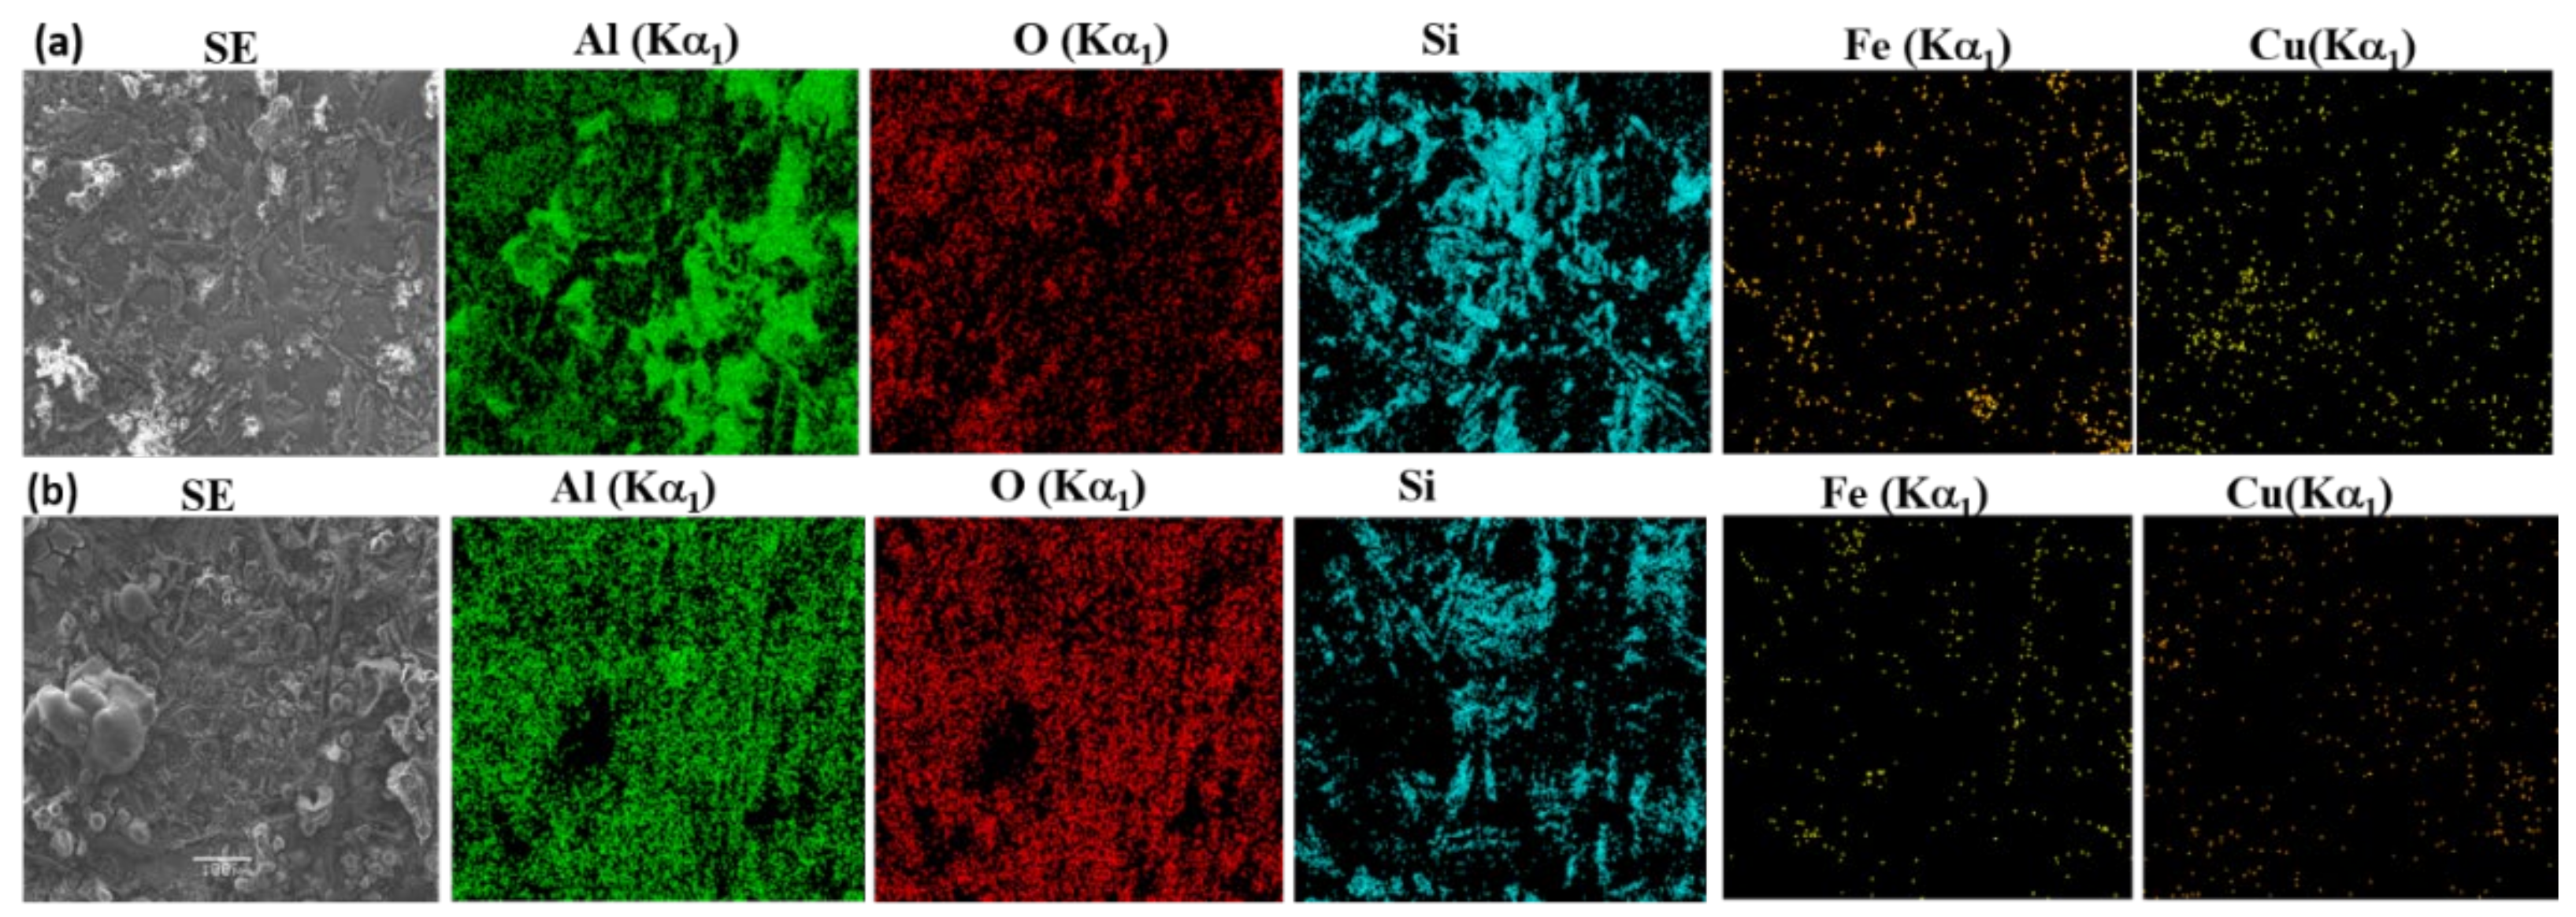
19]. Specifically, the microstructure of the Al-Si alloys, the object of study in this article, present in their microstructure a matrix of α-aluminum dendrites as the main component and several phases. Among the phases present are eutectic Si particles, several secondary intermetallic phases such as Al
2Cu, Mg
2Si, and several Fe-bearing phases (AlFeSi, AlFeSiMn). The secondary phases (eutectic Si, Al
2Cu, Mg
2Si, AlFeSi, and AlFeSiMn) provide specific properties to the alloy and can affect the mechanical and corrosion behavior of the material.
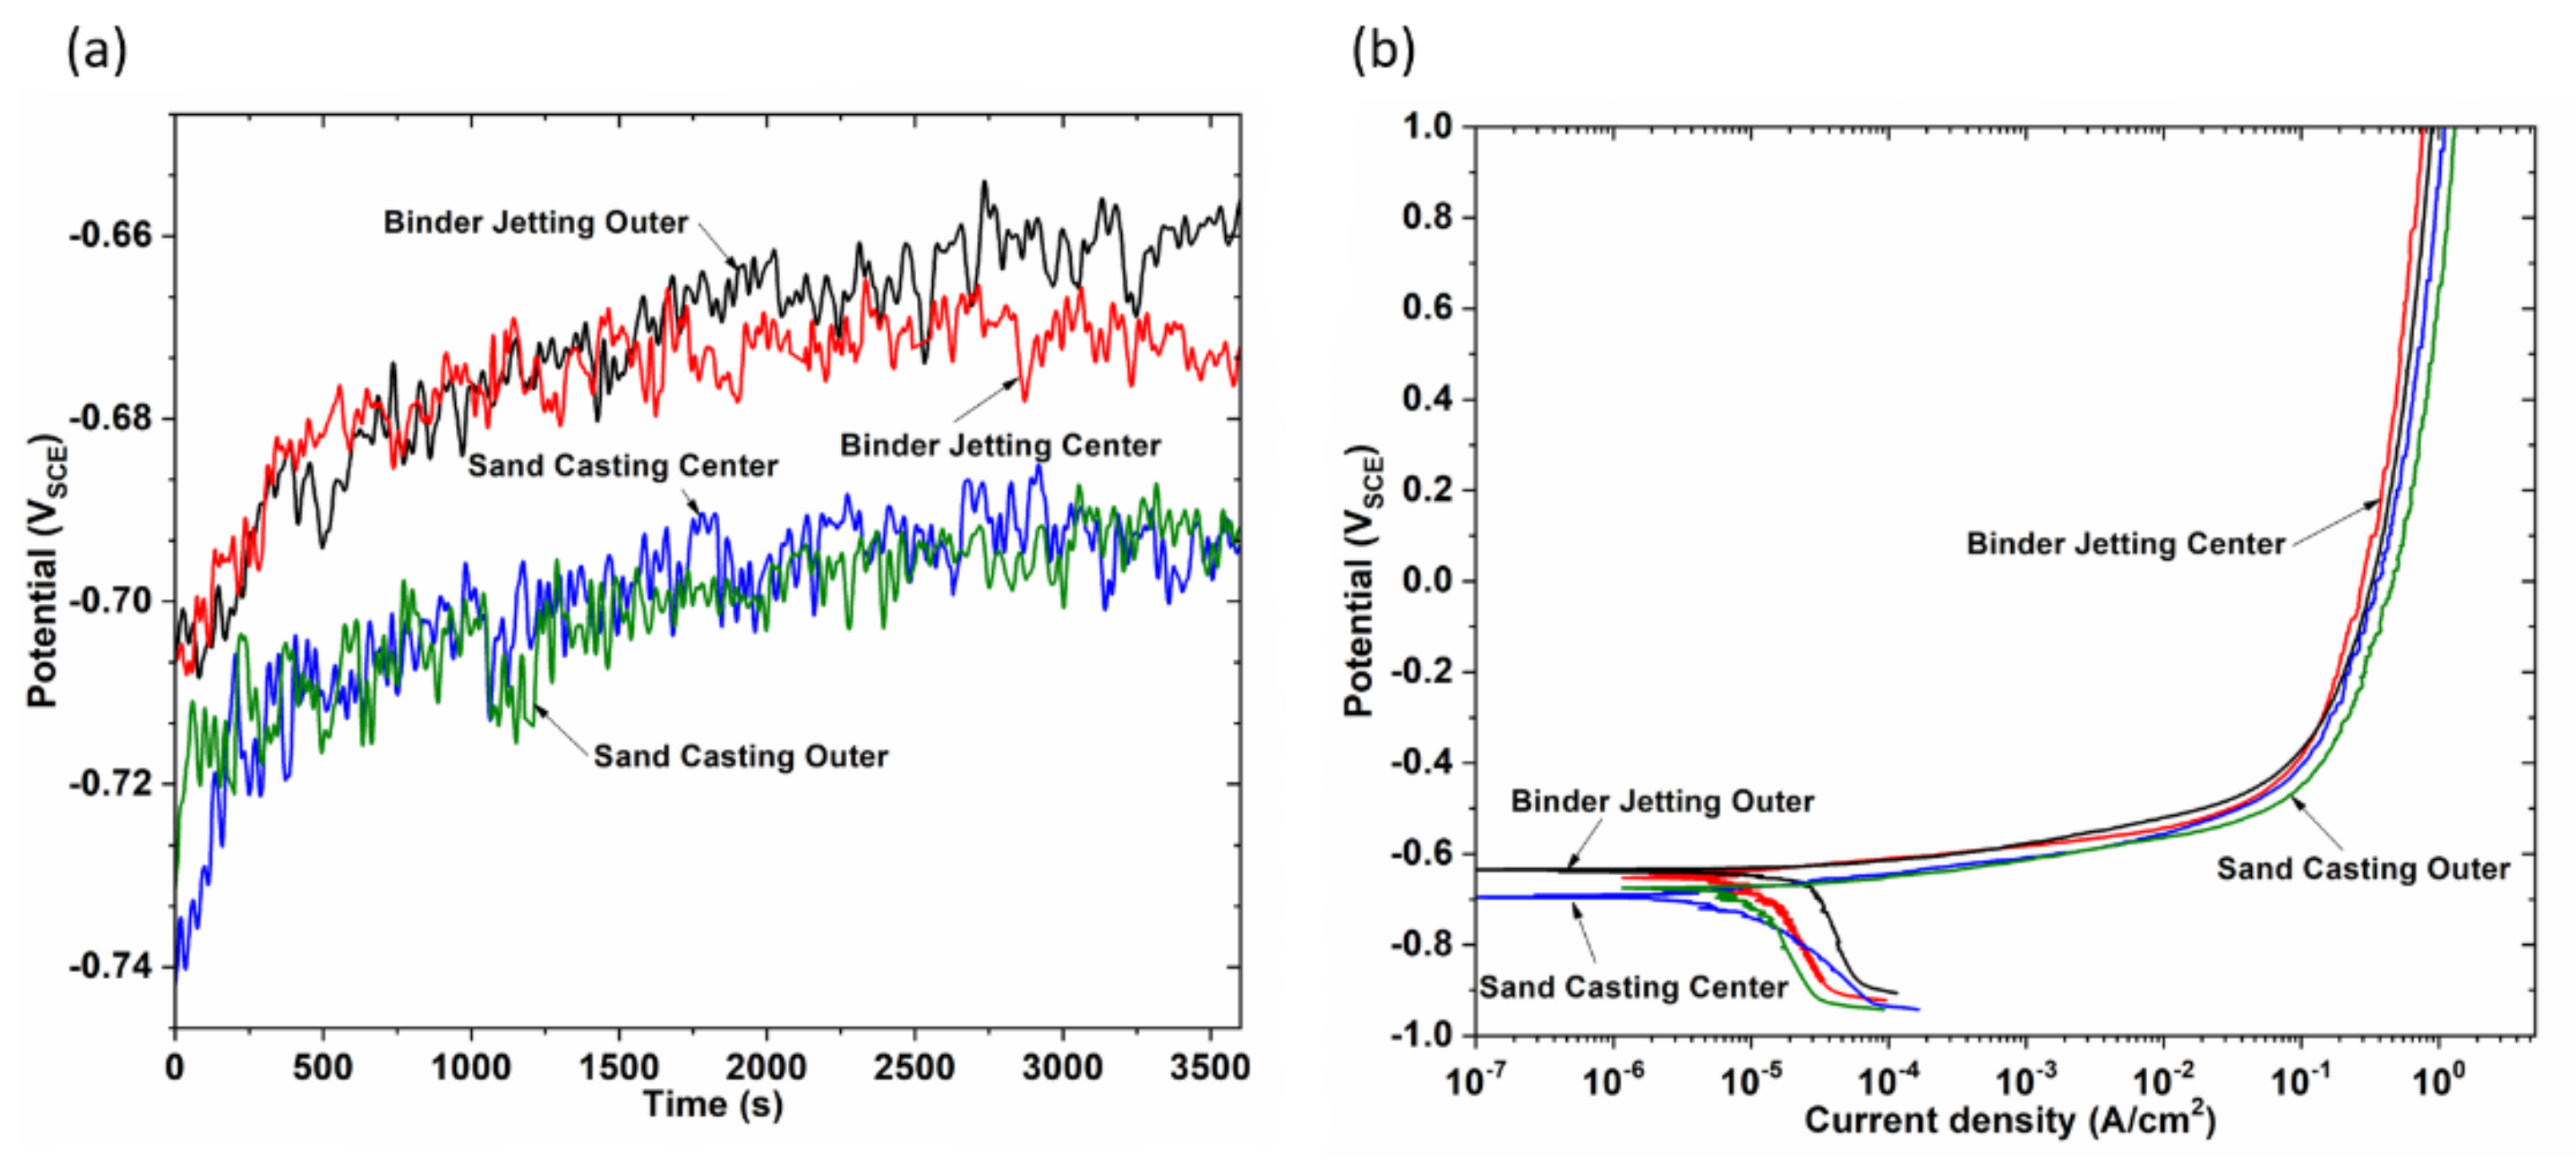
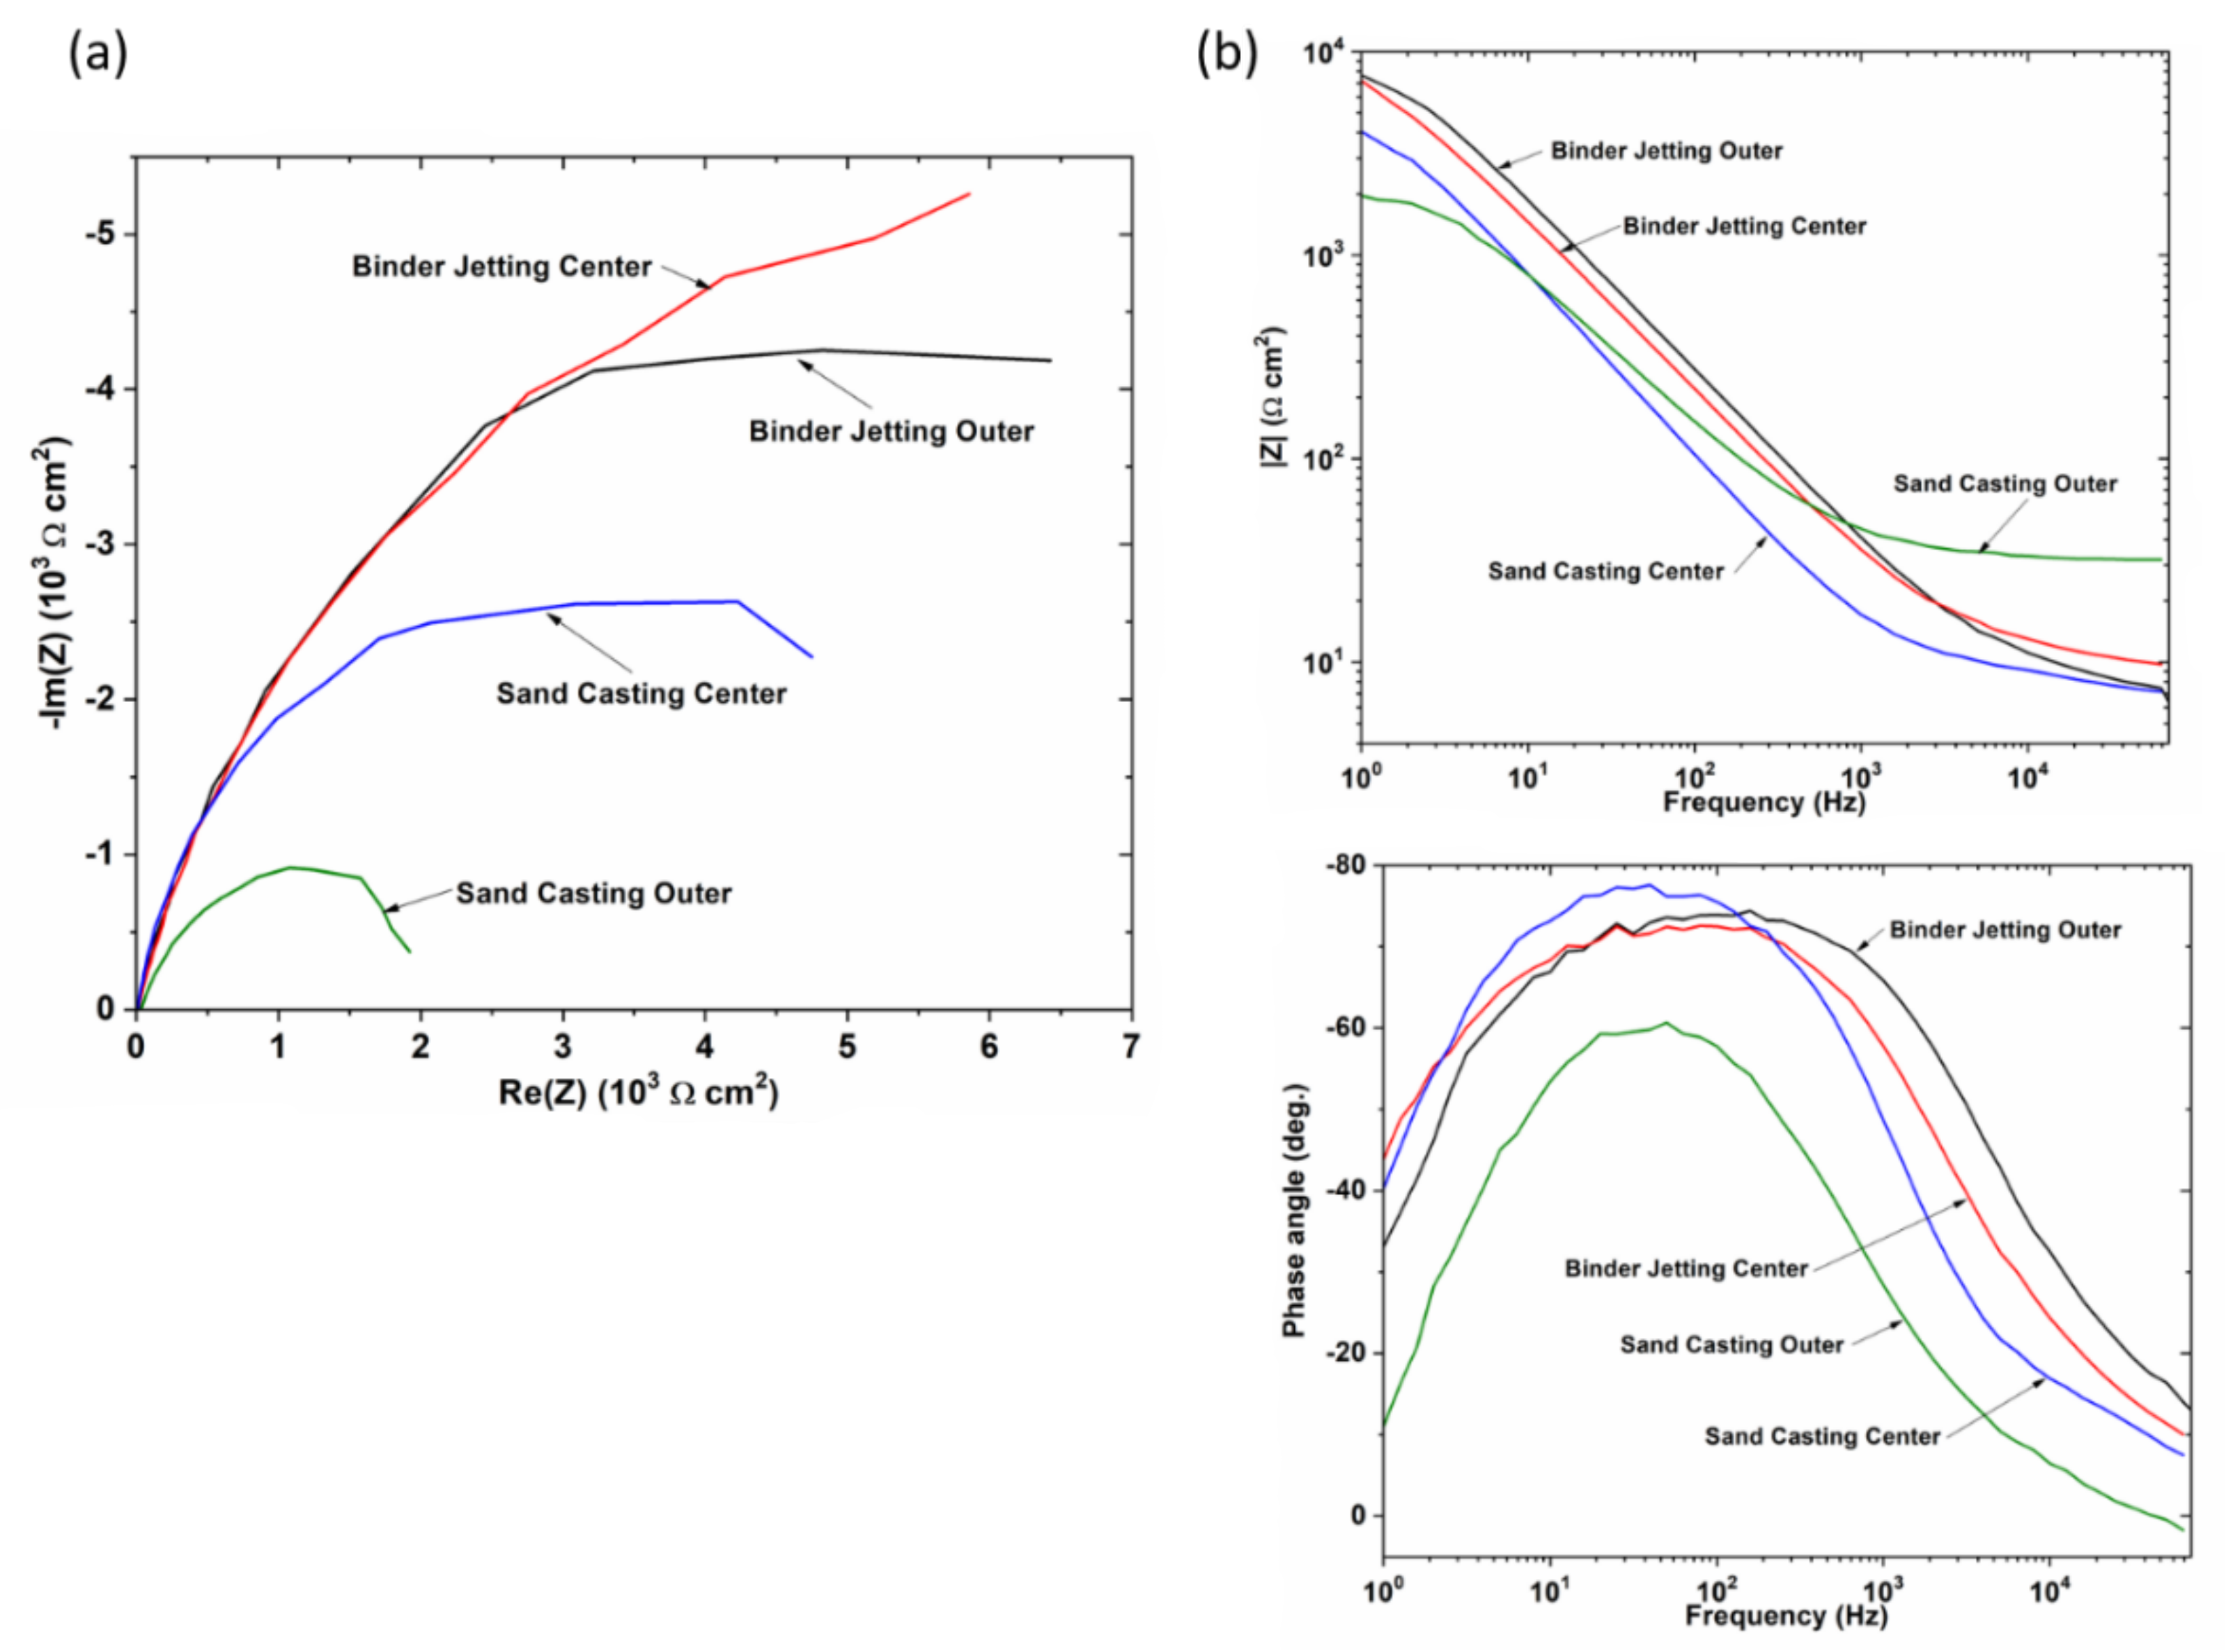
Al-Si-Cu alloys are passive materials, however, they show high susceptibility to pitting corrosion in chloride solution; this has been related to the presence of secondary phases because most of these particles are more noble than Al-matrix [
20]. These micro- galvanic cells cause the dissolution of the aluminum matrix.
Part of this secondary phase are Si particles. The low solubility of silicon in the aluminum matrix originates the precipitation of Si particles. The size, morphology, and distribution of these particles play an important role in the mechanical and corrosion behavior of Al-Si-Cu alloys [
21]. The cathodic behavior of Si within the aluminum-rich matrix acting as an anode results in the formation of micro-galvanic couples that cause localized corrosion [
22]. The influence of silicon morphology and its effect on the area ratio in galvanic corrosion has been analyzed by Tahamtan et al. [
23]. Thick flake Si particles with sharp edges that increase the cathode/anode ratio greatly increase the density of the corrosion stream [
24].
Also, the electrochemical properties of Al-Si-Cu alloys are affected by morphologies, type, and distribution of intermetallic phases that are, in turn, a function of alloy composition and cooling rate [
25,
26]. Intermetallic particles such as Al
2CuMg, and Mg
2Si, are anodic with respect to the Al matrix and preferably corrode with respect for the surrounding Al matrix [
27]. However, the particles of intermetallic phases such as Al
2Cu and especially the iron-rich phases (β-Al-Fe-Si and α-Al-Fe-Mn-Si) are mostly cathodic to the Al and cause the dissolution of surrounding eutectic Al matrix adjacent to these intermetallic phases [
28]. The iron content determines the type and morphology of these iron-rich intermetallic phases. The plate shape phase, such as βAl
5FeSi, is the most abundant, and the greater the amount of iron, the longer and wider the needles are. This phase is very hard and fragile and induces a high susceptibility to localized corrosion. The presence of manganese favors the “Chinese script” form, such as αAl
15(Fe,Mn)
3Si
2, which improves corrosion resistance compared with those that are manganese-free [
29,
30,
31].
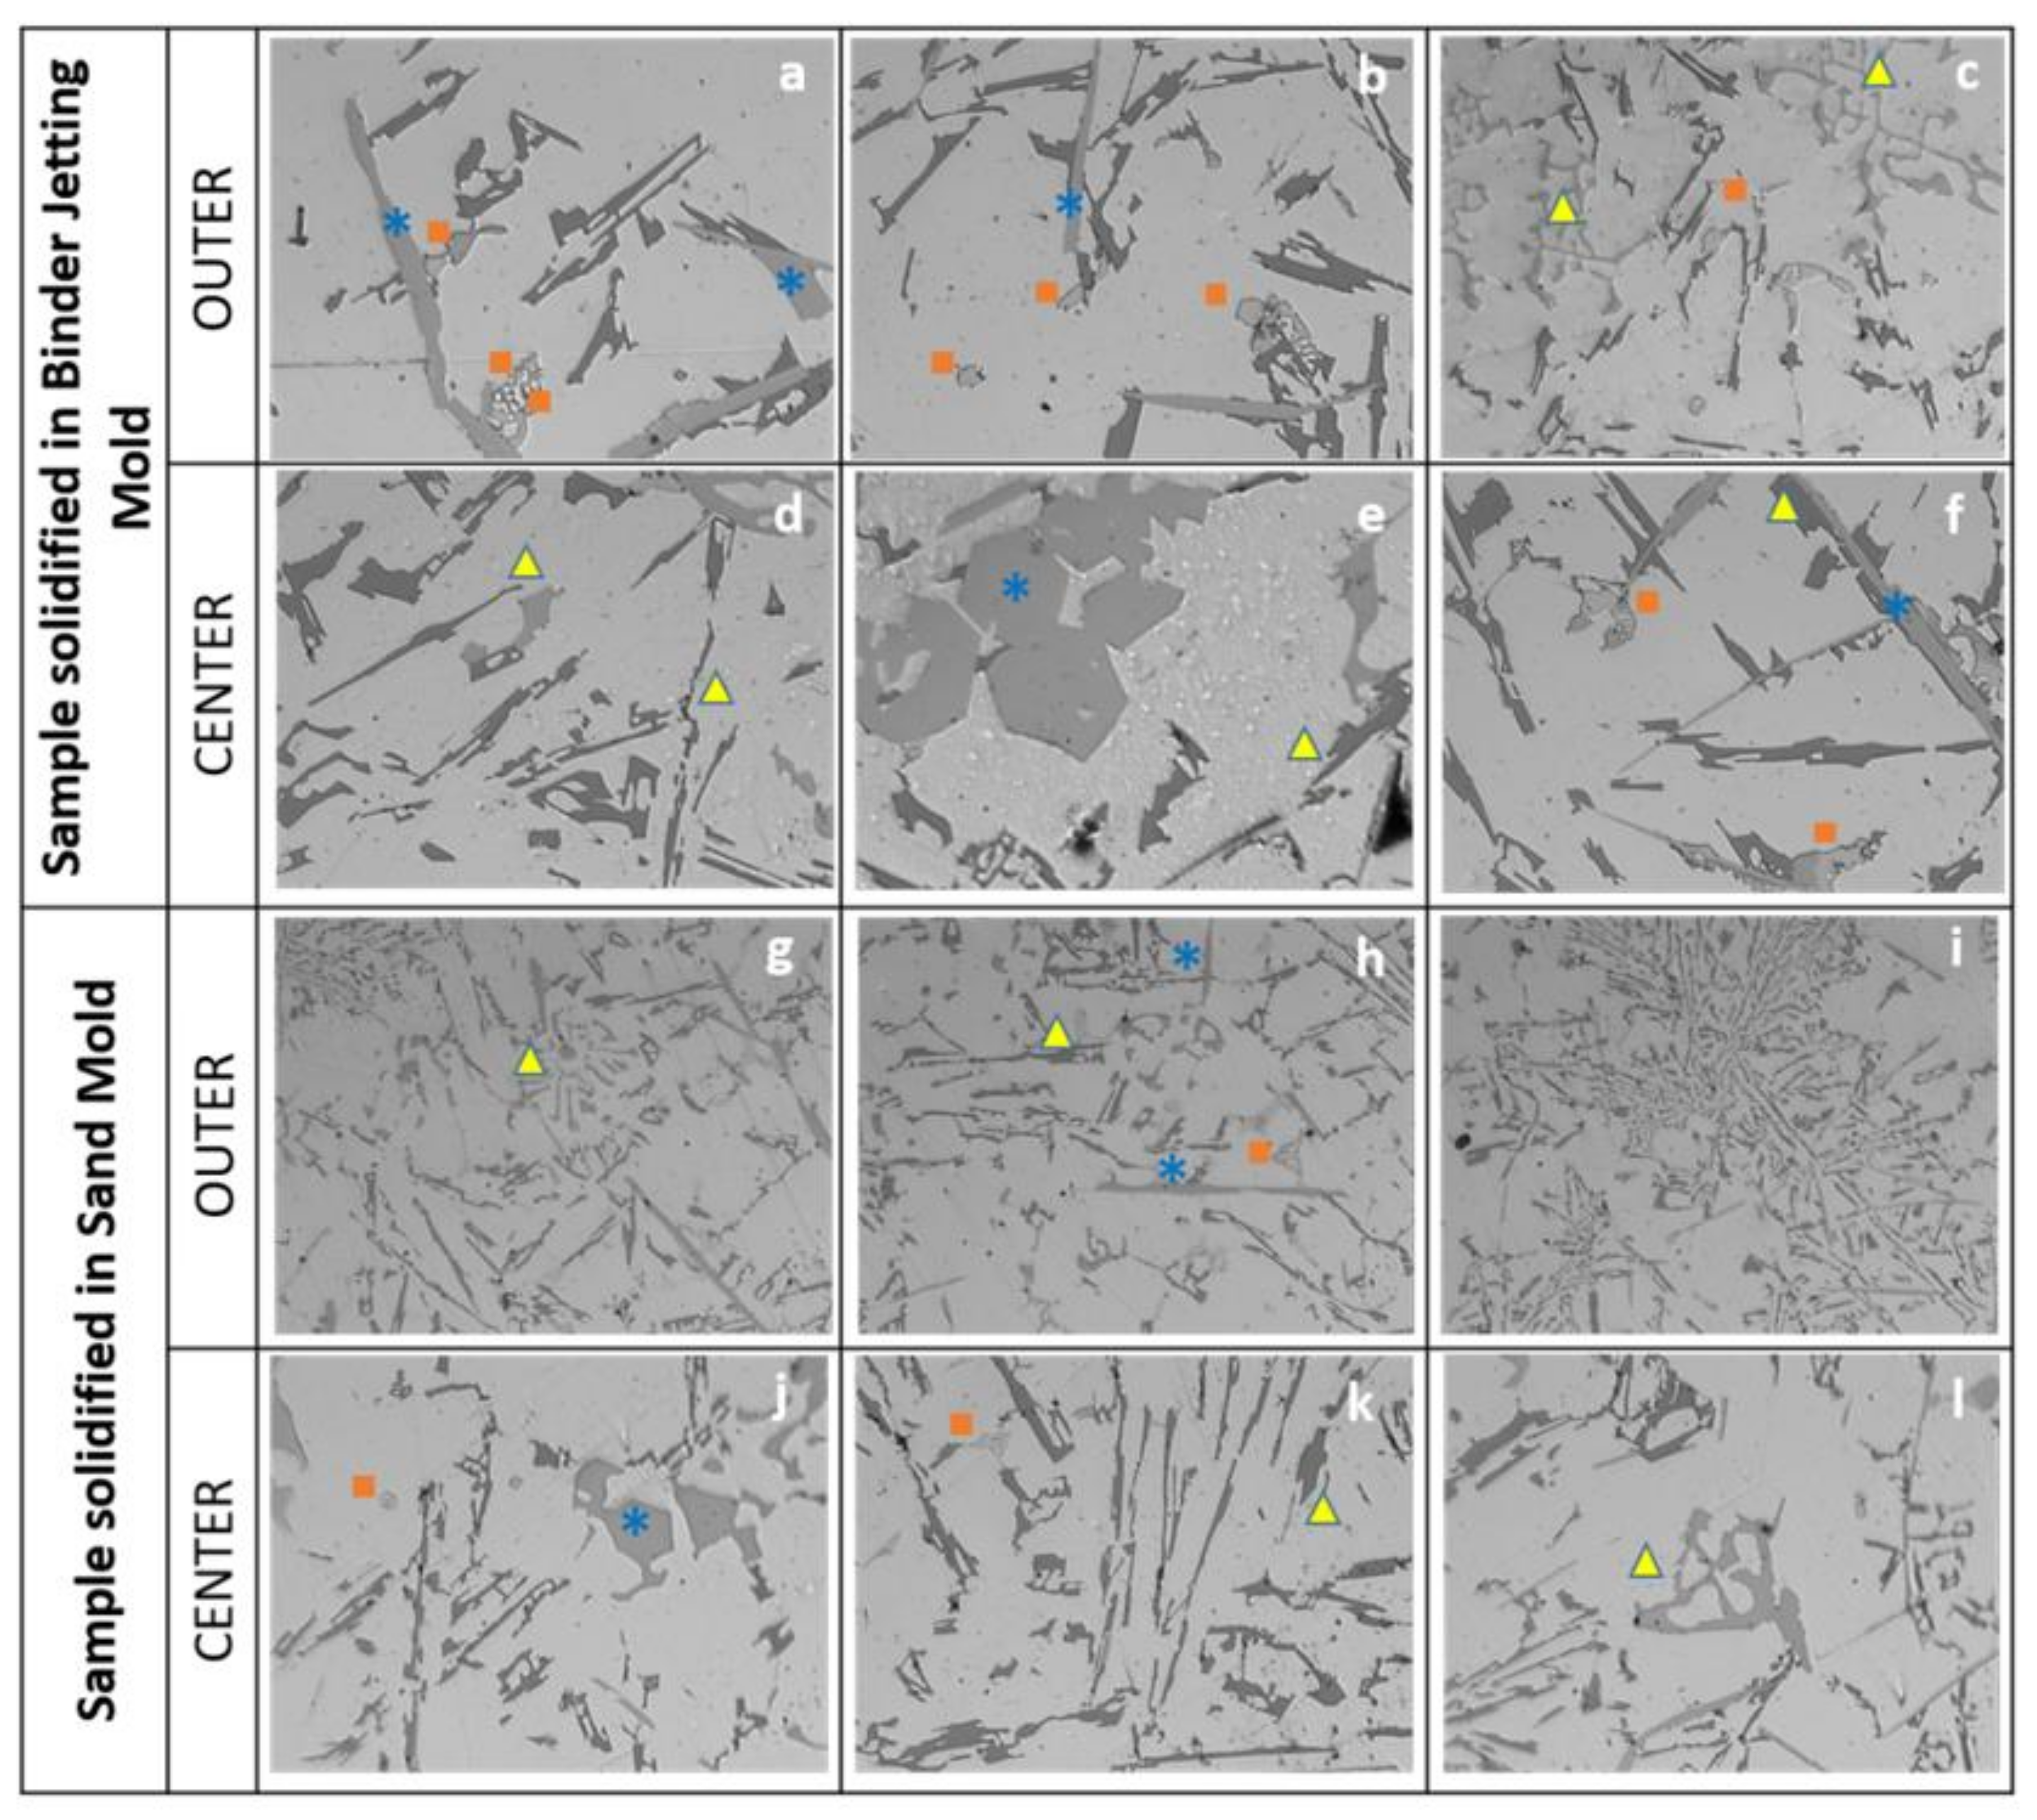
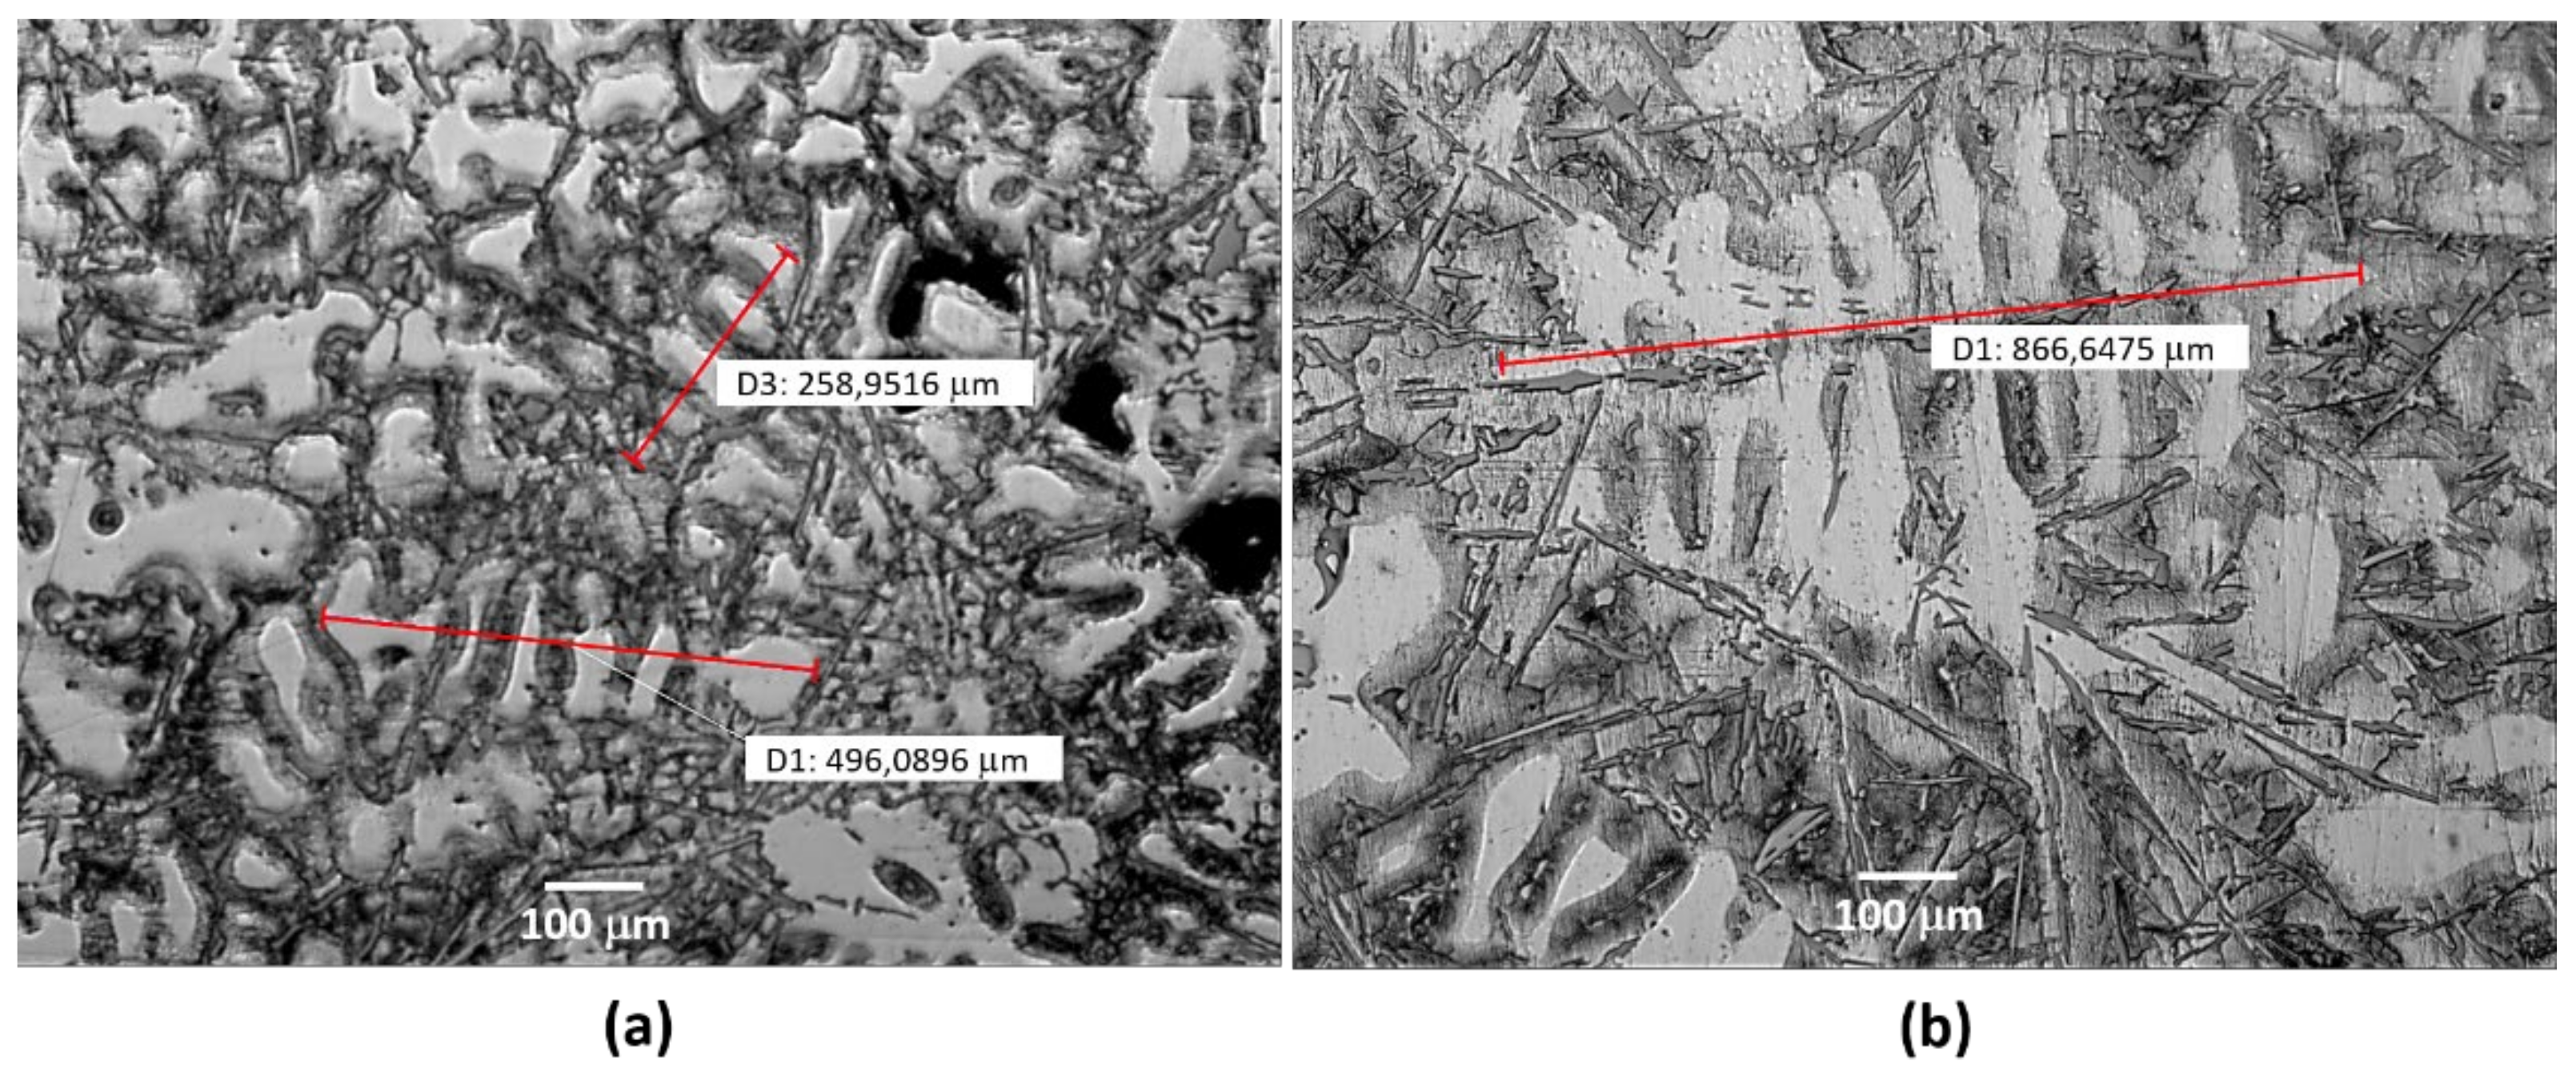
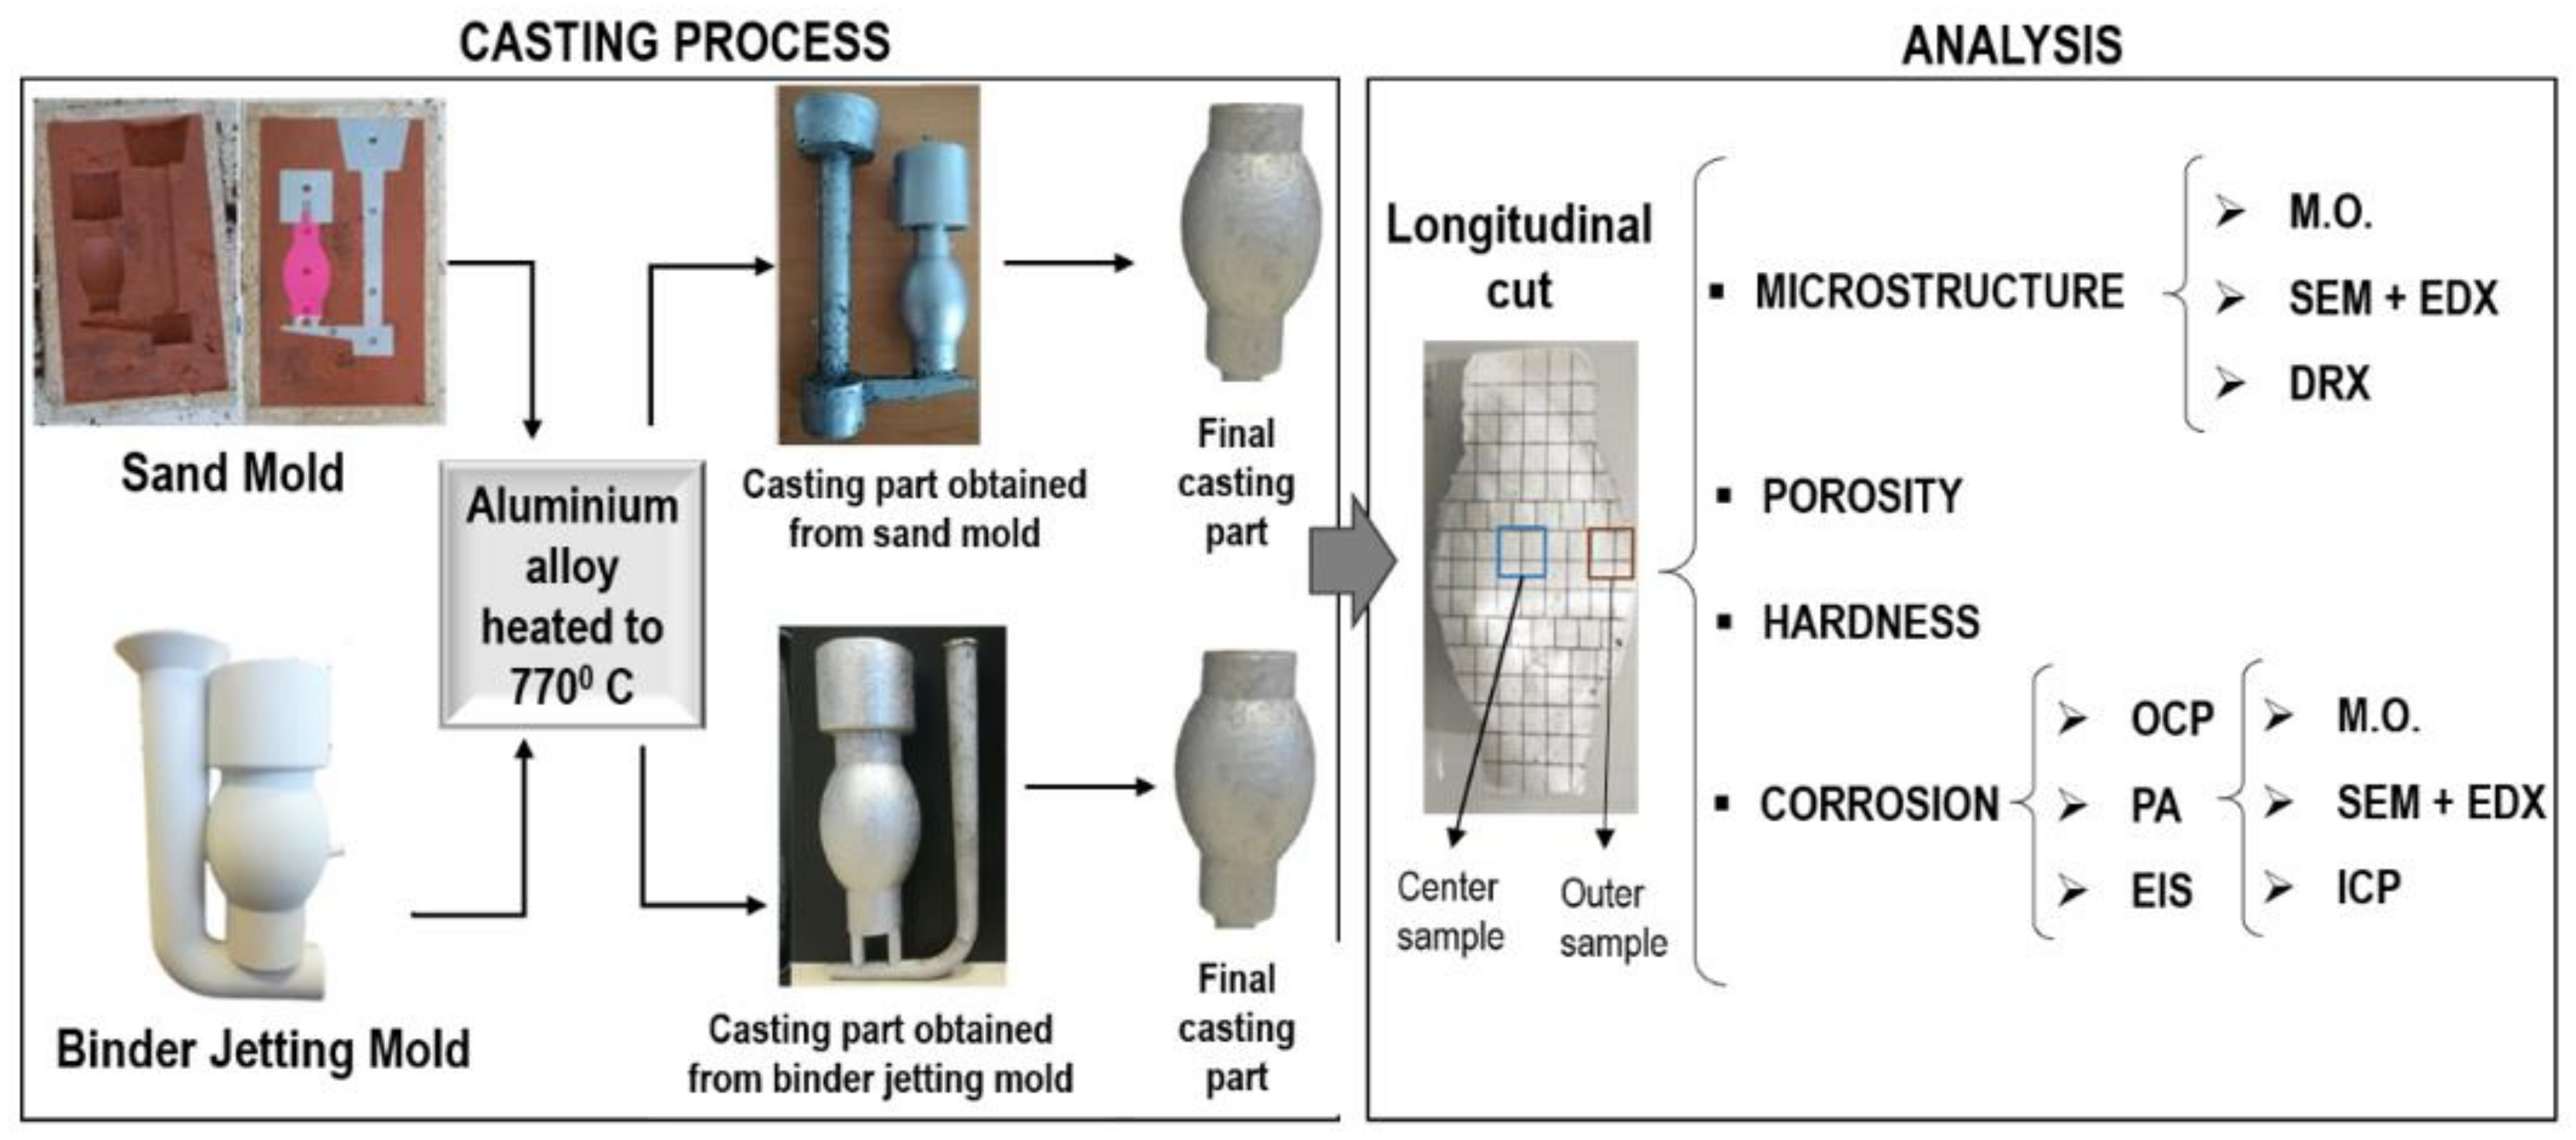
The studies at the microstructural level, mechanical properties and corrosion behavior of Al-Si alloys produced by the traditional sand casting process are known. However, little information on these aspects has been studied for castings using molds fabricated by additive manufacturing technology. This work aims to focus on this gap to investigate the microstructure and corrosion behavior of the AlSiCu alloy. For this purpose, the alloys were solidified in traditional sand molds and binder jetting molds.


 ,
, 

 Si phase;
  Al2Cu phase;
  Al-Fe-Si phase.
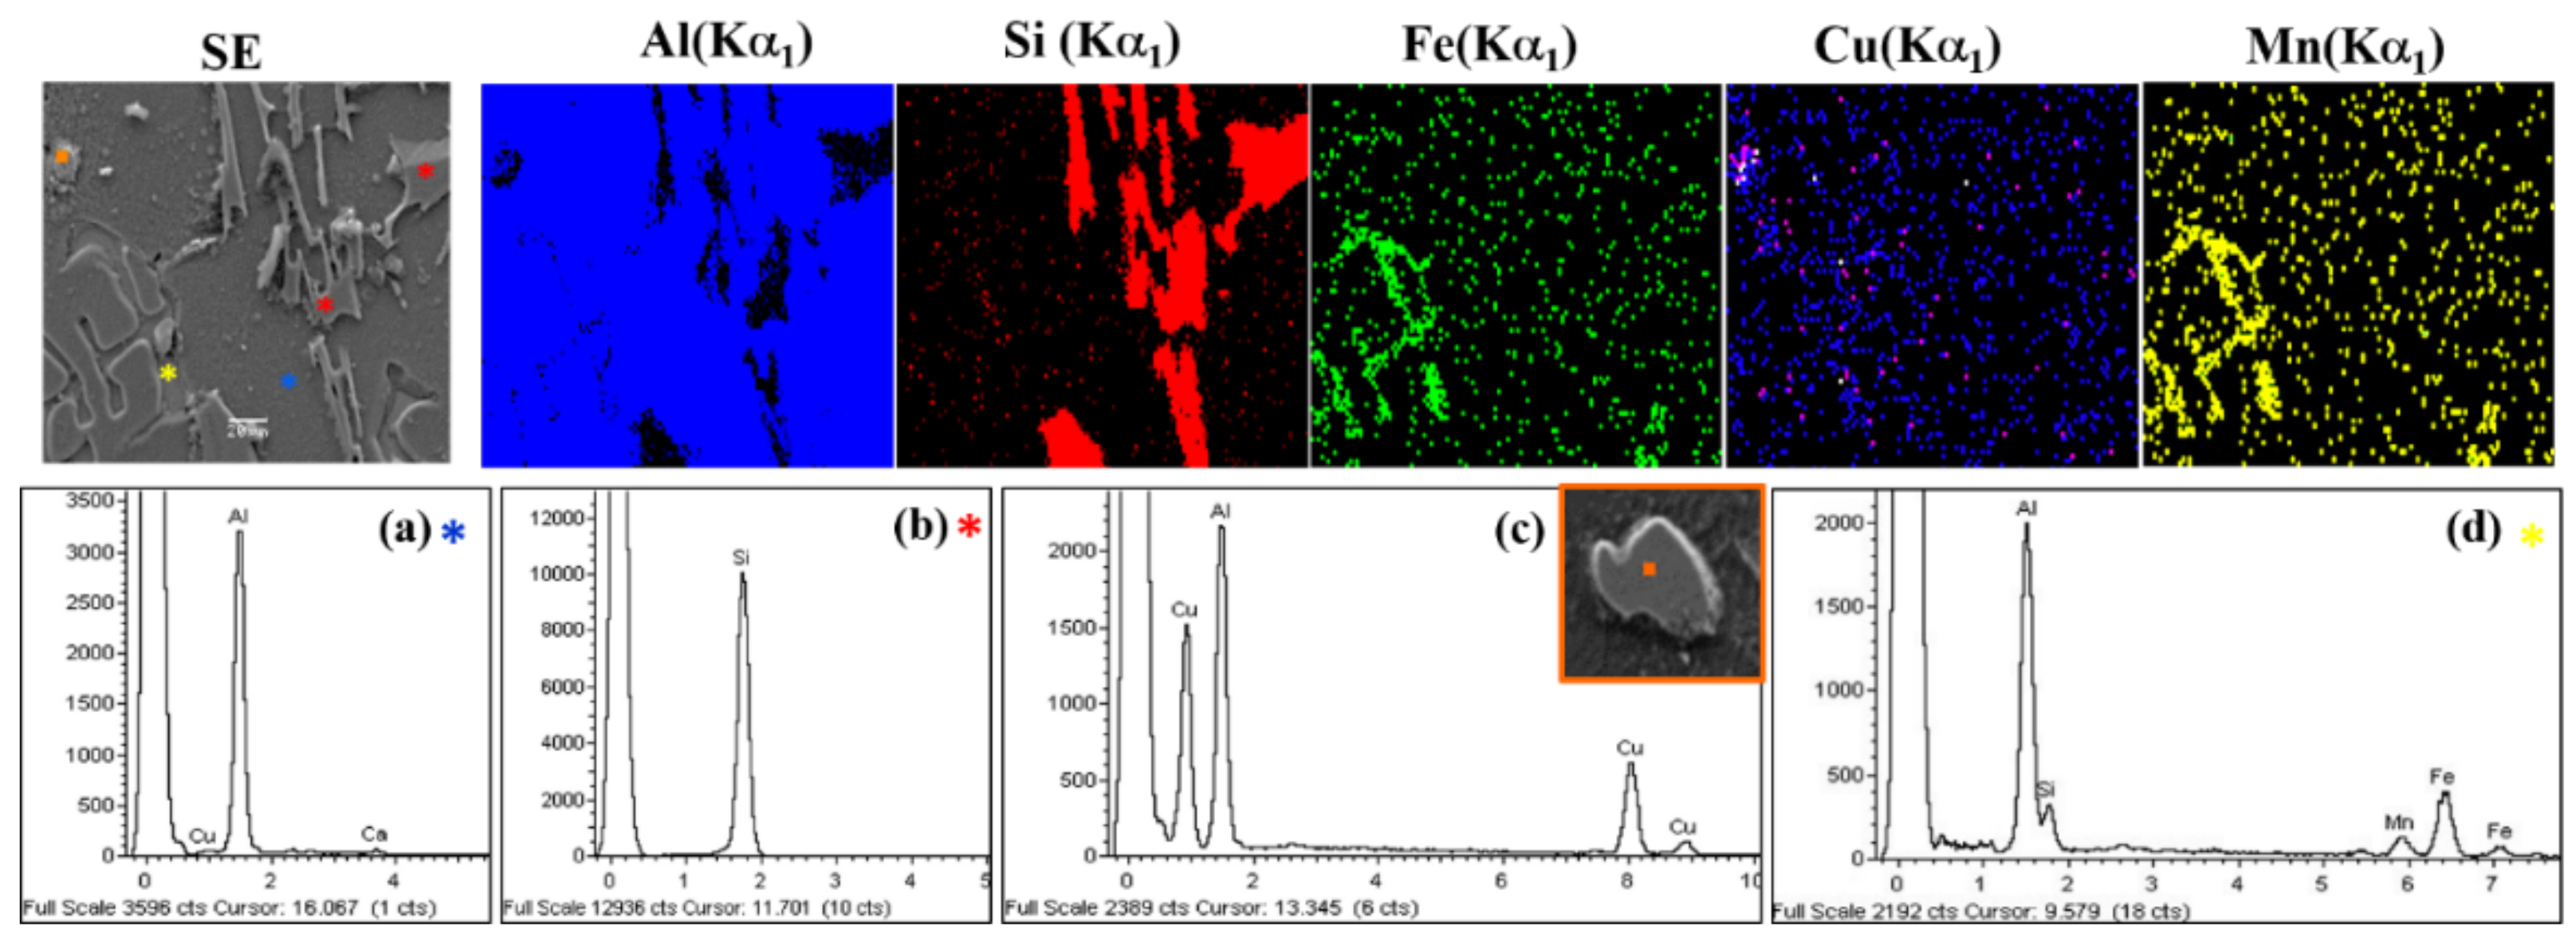
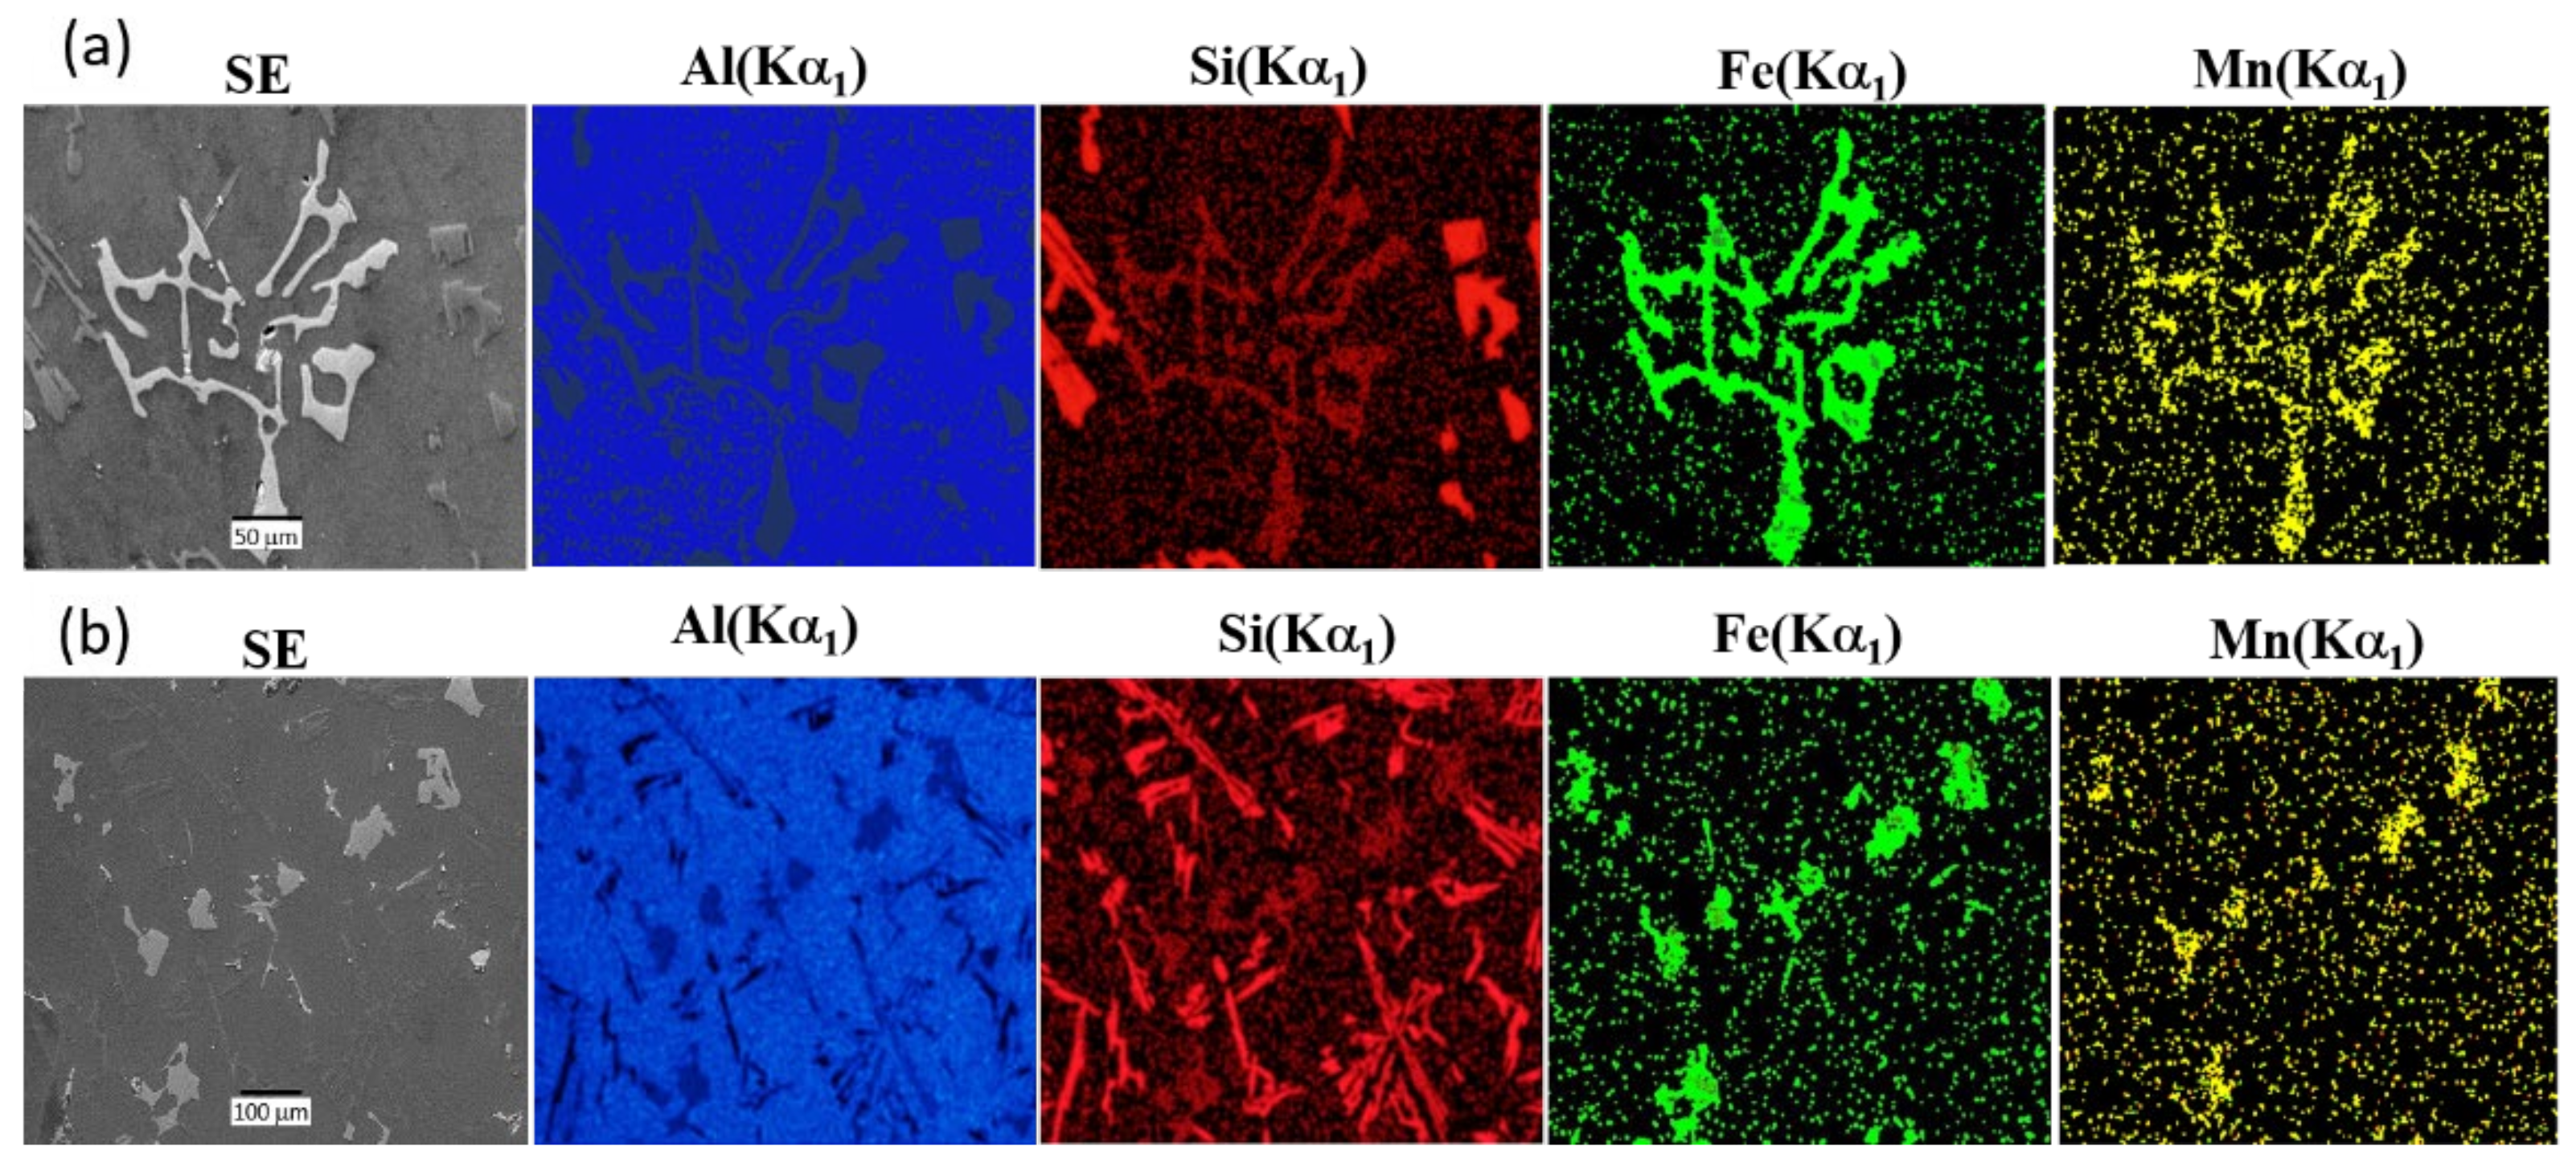
 Al;
Al;  Si;
Si;  Al2Cu;
  AlFeMn).


