Article

Degradation Analysis of Thin Mg-xAg Wires Using X-ray Near-Field Holotomography

1
Institute of Metallic Biomaterials, Helmholtz-Zentrum Hereon, Max–Planck–Str. 1, 21502 Geesthacht, Germany
2
Institute of Materials Physics, Helmholtz-Zentrum Hereon, Max–Planck–Str. 1, 21502 Geesthacht, Germany
3
CXNS—Center for X-ray and Nano Science, Deutsches Elektronen-Synchrotron DESY, Notkestraße 85, 22607 Hamburg, Germany
4
Helmholtz Imaging Platform, Deutsches Elektronen-Synchrotron DESY, Notkestraße 85, 22607 Hamburg, Germany
*
Authors to whom correspondence should be addressed.
These authors contributed equally as main authors to this work.
Metals 2021, 11(9), 1422; https://doi.org/10.3390/met11091422
Submission received: 21 July 2021 / Revised: 21 August 2021 / Accepted: 2 September 2021 / Published: 8 September 2021
(This article belongs to the Special Issue Development and Application of Biodegradable Metals)

Abstract

:
Magnesium–silver alloys are of high interest for the use as temporary bone implants due to their antibacterial properties in addition to biocompatibility and biodegradability. Thin wires in particular can be used for scaffolding, but the determination of their degradation rate and homogeneity using traditional methods is difficult. Therefore, we have employed 3D imaging using X-ray near-field holotomography with sub-micrometer resolution to study the degradation of thin (250 μm diameter) Mg-2Ag and Mg-6Ag wires. The wires were studied in two states, recrystallized and solution annealed to assess the influence of Ag content and precipitates on the degradation. Imaging was employed after degradation in Dulbecco’s modified Eagle’s medium and 10% fetal bovine serum after 1 to 7 days. At 3 days of immersion the degradation rates of both alloys in both states were similar, but at 7 days higher silver content and solution annealing lead to decreased degradation rates. The opposite was observed for the pitting factor. Overall, the standard deviation of the determined parameters was high, owing to the relatively small field of view during imaging and high degradation inhomogeneity of the samples. Nevertheless, Mg-6Ag in the solution annealed state emerges as a potential material for thin wire manufacturing for implants.

1. Introduction

Magnesium (Mg) is of high interest for the application as temporary implant material, due to its high biocompatibility and biodegradability [1]. Mg alloy implants are already in use for clinical applications in the form of bone screws or stents [2,3]. Additionally, their use as suture or splinting material is has been envisioned since the end of the 19th century [4,5]. However, the low ductility of Mg during bending limited its use for surgical applications [6]. The ductility of Mg can be improved by adapting the manufacturing technique or by alloying with appropriate elements, as summarized in the review of Alaneme and Okotete [7]. Utilizing silver (Ag) in Mg alloys, for example, can be used to improve the ductility [8] and additionally to add antibacterial properties [9], which is the ideal combination for an implant with high surface to volume ratio and demands for ductility during knotting. Mg wires are manufactured by hot extrusion [10] followed by cold drawing [5,11]. In order to achieve higher deformability of Mg wires, appropriate heat treatments and recrystallization with drawing steps are necessary. Using these techniques wire diameters close to human hair or 50 μ m have been produced [11].
The degradation rate of Mg alloys and the tailoring thereof is crucial for its use in the desired application. In Mg-Ag systems, the precipitation of Ag due to low temperature processing leads to an increase in the degradation rate and the homogeneity of the degradation process [9,12,13]. Similarly, higher contents of Ag have been shown to result in higher degradation rates [9,14]. By selecting the content of Ag accordingly, the degradation rate of the Mg-Ag system becomes controllable. For example, Estrin et al. [15] adjusted the degradation rate of Mg-Ag alloys to be cytotoxic to tumour cells in in vitro tests. Processing of rolled Mg-xAg (x = 6 and 8 wt.%) sheets above the solvus temperature also enabled limiting the degradation rate in physiological media to 0.5 mm/year after 7 days [13].
While the degradation rate of Mg alloys in vitro is traditionally measured using hydrogen evolution or weight loss over time [16], these methods can be imprecise when aiming to analyse the degradation of thin wires. Instead, high-resolution 3D imaging can be used to measure the volume loss, degradation rate and pitting behaviour of the material, the former of which in particular can be correlated to the material’s mechanical performance [17]. High-resolution synchrotron radiation-based X-ray micro computed tomography (SR μ CT) has previously been used to analyse the degradation behaviour of Mg implants, both in vitro and ex vivo [18]. However, at early degradation times, the degradation may not yet be visible in SR μ CT [19], which is limited in resolution to approx. 1 μ m. Therefore, higher resolution X-ray imaging techniques, such as transmission X-ray microscopy (TXM) and near-field holotomography (NFHT) should be utilized. For example, TXM was previously used to analyse the porosity of the degradation layer of pure Mg degraded in simulated body fluid at resolutions down to 40 nm [20]. However, TXM is still limited to field of views (FOVs) of less than 100 μ m. NFHT is capable of achieving similar resolutions [21], while at the same time enabling a flexible selection of the size of the FOV. This is due to NFHT being a coherent propagation-based phase contrast imaging technique that employs a divergent beam [22].
In this work, we are presenting an analysis of the degradation of thin Mg-xAg (x = 2 and 6 wt.%) wires at early immersion time points using NFHT. By studying two processing states, specifically recrystallized vs. solution annealed, we aim to assess the influence of Ag content and precipitates on the degradation process.

2. Materials and Methods

2.1. Magnesium Wires

Pure Mg (99.98%, MAGONTEC, Sydney, Australia) was melted under protective atmosphere of Ar with 3 vol.% SF 6 . Billets with 2 and 6 wt.% Ag (99.99%, ESG Edelmetall-Service GmbH & Co. KG, Rheinstetten, Germany) content were cast by using a modified permanent direct chill casting technique and homogenized for 8 h at 500 ° C prior to extrusion to ensure solid solution [8]. Four wires with diameter () of 1 mm were extruded from those billets with an extrusion ratio of 1:625 at 400 ° C and a ram speed of up to 0.2 mm/s [10]. Cold drawing followed with an area reduction of ≈20% per pass and a drawing speed of 0.25 m/s. After an initial steel drawing die, the 15 following dies had diamond cones to reduce iron contamination. The drawn wire was recrystallized after each pass at 425 ° C for 5 min to recover ductility while ensure solid solution. After the last drawing step to 0.2 mm, the wire coil was recrystallised below 400 ° C to form precipitates. One part of the samples was solid solution heat treated at 450 ° C for 2 h. The chemical composition of the cast billets from which the wires were produced is shown in Table 1.
The metallographic preparation consisted of careful grinding and polishing of embedded longitudinal wire pieces. The specimens were grinding with up to 2500 grit SiC paper at a speed of 80 rotations/min. Polishing was done with a mixture of diamond paste (1 μ m) and O.P.S (<0.05 μ m) (Oxide-Polishing-Suspension, Schmitz-Metallographie GmbH, Germany) hydrous suspension were used with at a speed of 80 r/min. Picric acid solution was used as etching agent [23]. The grain size was determined by linear intercept method with the average of at least three light microscope images (BX53M, Olympus, Japan). Twin boundaries were not considered. The scanning electron microscope (SEM) (TESCAN VEGA3-SB, Brno, Czech Republic) was used in the back scattered electron (BSE) mode to visualise Ag distribution and precipitation with 15 keV and a working distance of 15 mm.

2.2. In Vitro Degradation

Wire pieces of Mg-2Ag and Mg-6Ag in both processing states were punched out with a Mg tool, to obtain reproducible sheared wire ends without Fe contamination and a length of 8 mm. The pieces were then cleaned by sonication for 20 min in n-hexane, acetone, and undiluted ethanol and sterilized in 70% ethanol (all chemicals were purchased from Sigma-Aldrich Chemie GmbH, Munich, Germany). The degradation assays consisted of a single wire piece per well in a 96 well plate. Per well 0.3 mL of Dulbecco’s Modified Eagle Medium (DMEM; Life technologies, Darmstadt, Germany) supplemented with 10% fetal bovine serum (FBS; Fisher Scientific GmbH, Schwerte, Germany) was used. The samples were incubated under physiological conditions (5% CO 2 , 20% O 2 , 95% humidity, 37 ° C) for 1, 2, 3, and 7 days. The immersion medium was exchanged every two days.

2.3. Near-Field Holotomography

For mounting of the samples, polyether ether ketone pins were manufactured with a pointed tip. A 300 mm hole was drilled into the centre of the tip of the pins, into which the wires were inserted and fixed using blue light-curable X-ray transparent cementum. Imaging was performed at the nanotomography end-station of the P05 beamline at PETRA III, Deutsches Elektronensynchrotron (DESY), Hamburg, which is operated by Helmholtz-Zentrum Hereon. An X-ray energy of 11 keV was selected using a Si-111 double crystal monochomator, with a Δ E/E of 10 4 . A Fresnel zone plate (FZP) was used for the focussing of the beam as descripted in [24]. Order sorting apertures (OSA) were placed at the focal distance of 133 mm from the FZP to block its higher orders. NFHT was performed using two defocus distances, i.e., distances between the sample and the focus, which were set to 386 and 388 mm. The focus-to-detector distance was set to 19.661 m. The field of view was approximately 360 μ m. Sample rotation was performed continuously over 180 ° with an exposure time of 1.5 s and a speed of 0.055 ° · s 1 . Overall, imaging of one specimen required approximately 2 h. Phase retrieval was performed using an iterative projection algorithm [25]. The tomographic reconstruction was subsequently performed using a TomoPy pipeline [26]. The resulting voxel size of the reconstructed tomogram was 175.88 nm in all directions. As the effective focal size is 95 nm [24], the magnification limits the spatial resolution in this case.
Table 2 displays an overview of the number of performed tomographic scans per Mg alloy, treatment and degradation time. Due to the long imaging times, the study focused on imaging wires after 3 and 7 days of degradation and only few wires of early and initial time points could be imaged for comparison. For 7 days of immersion, three of the obtained tomograms of each alloy and treatment were taken from the same wire to assess the degradation homogeneity per wire.

2.4. Image Processing and Analysis

Initially, the reconstructed tomograms were binned by a factor of two to facilitate the segmentation. Using the watershed tool in Avizo 2020.2 (FEI SAS, Thermo Scientific, Bordeaux, France) the samples were then segmented into residual metal and background. The degradation layer was segmented as background. Any incorrectly identified regions were subsequently corrected manually. To ensure that the quantitative degradation parameters are calculated correctly, the segmented wires were registered to a perfect cylinder whose long axis coincided with the image z-direction. The registered segmented images were then loaded into Matlab R2020a (The Mathworks Inc., Natick, MA, USA) for a quantitative analysis. Based on the segmented metal volume of a non-degraded sample V 0 with surface A 0 and the residual metal volume of a degraded sample V t at time t, the degradation rate D R of the degraded sample was calculated as:
D R = V 0 V t A 0 t ,
with dimensions scaled to mm/year.
Additionally, the registered segmentation was radially resliced using Fiji/ImageJ [27] with an angular step size of 0.5° to enable the calculation of the pitting factor p f . This calculation was performed in Matlab according to:
p f = m a x ( r 0 r ϕ ) m e a n ( r 0 r ϕ ) ,
with r 0 the mean radius of a non-degraded wire and r ϕ the radius of the degraded wire at angular step ϕ { 0 ; 360 } . The radii were determined in the radially resliced volume by calculating the mean maximum voxel position in the radial direction for all angles and across the height of the specimen. Finally, Matlab was used to create plots and calculate correlations of the quantitative degradation parameters.

3. Results and Discussion

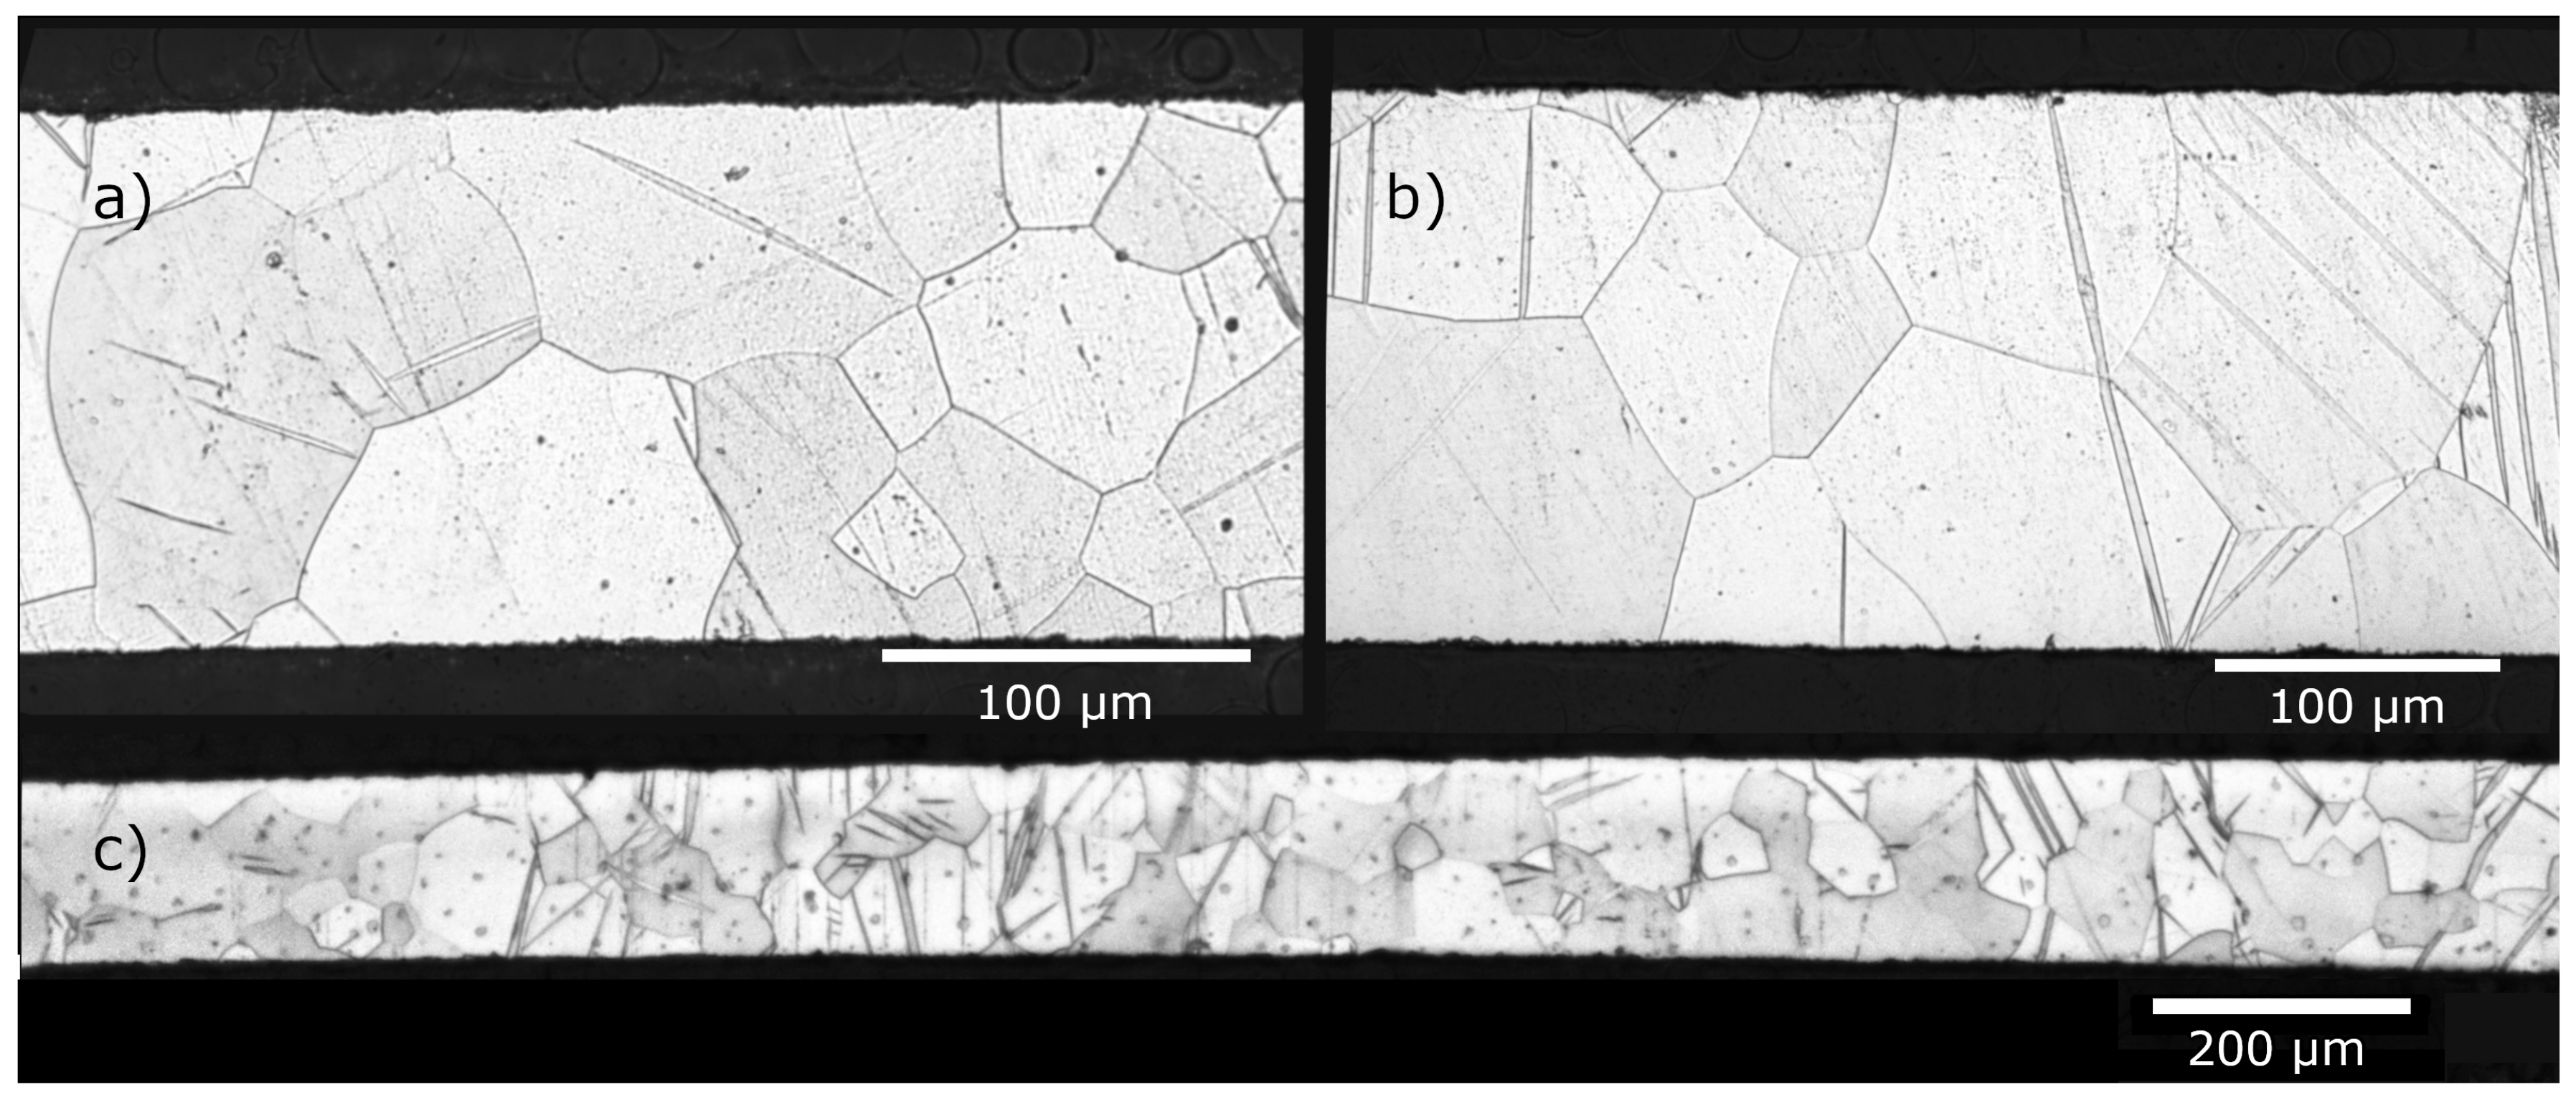
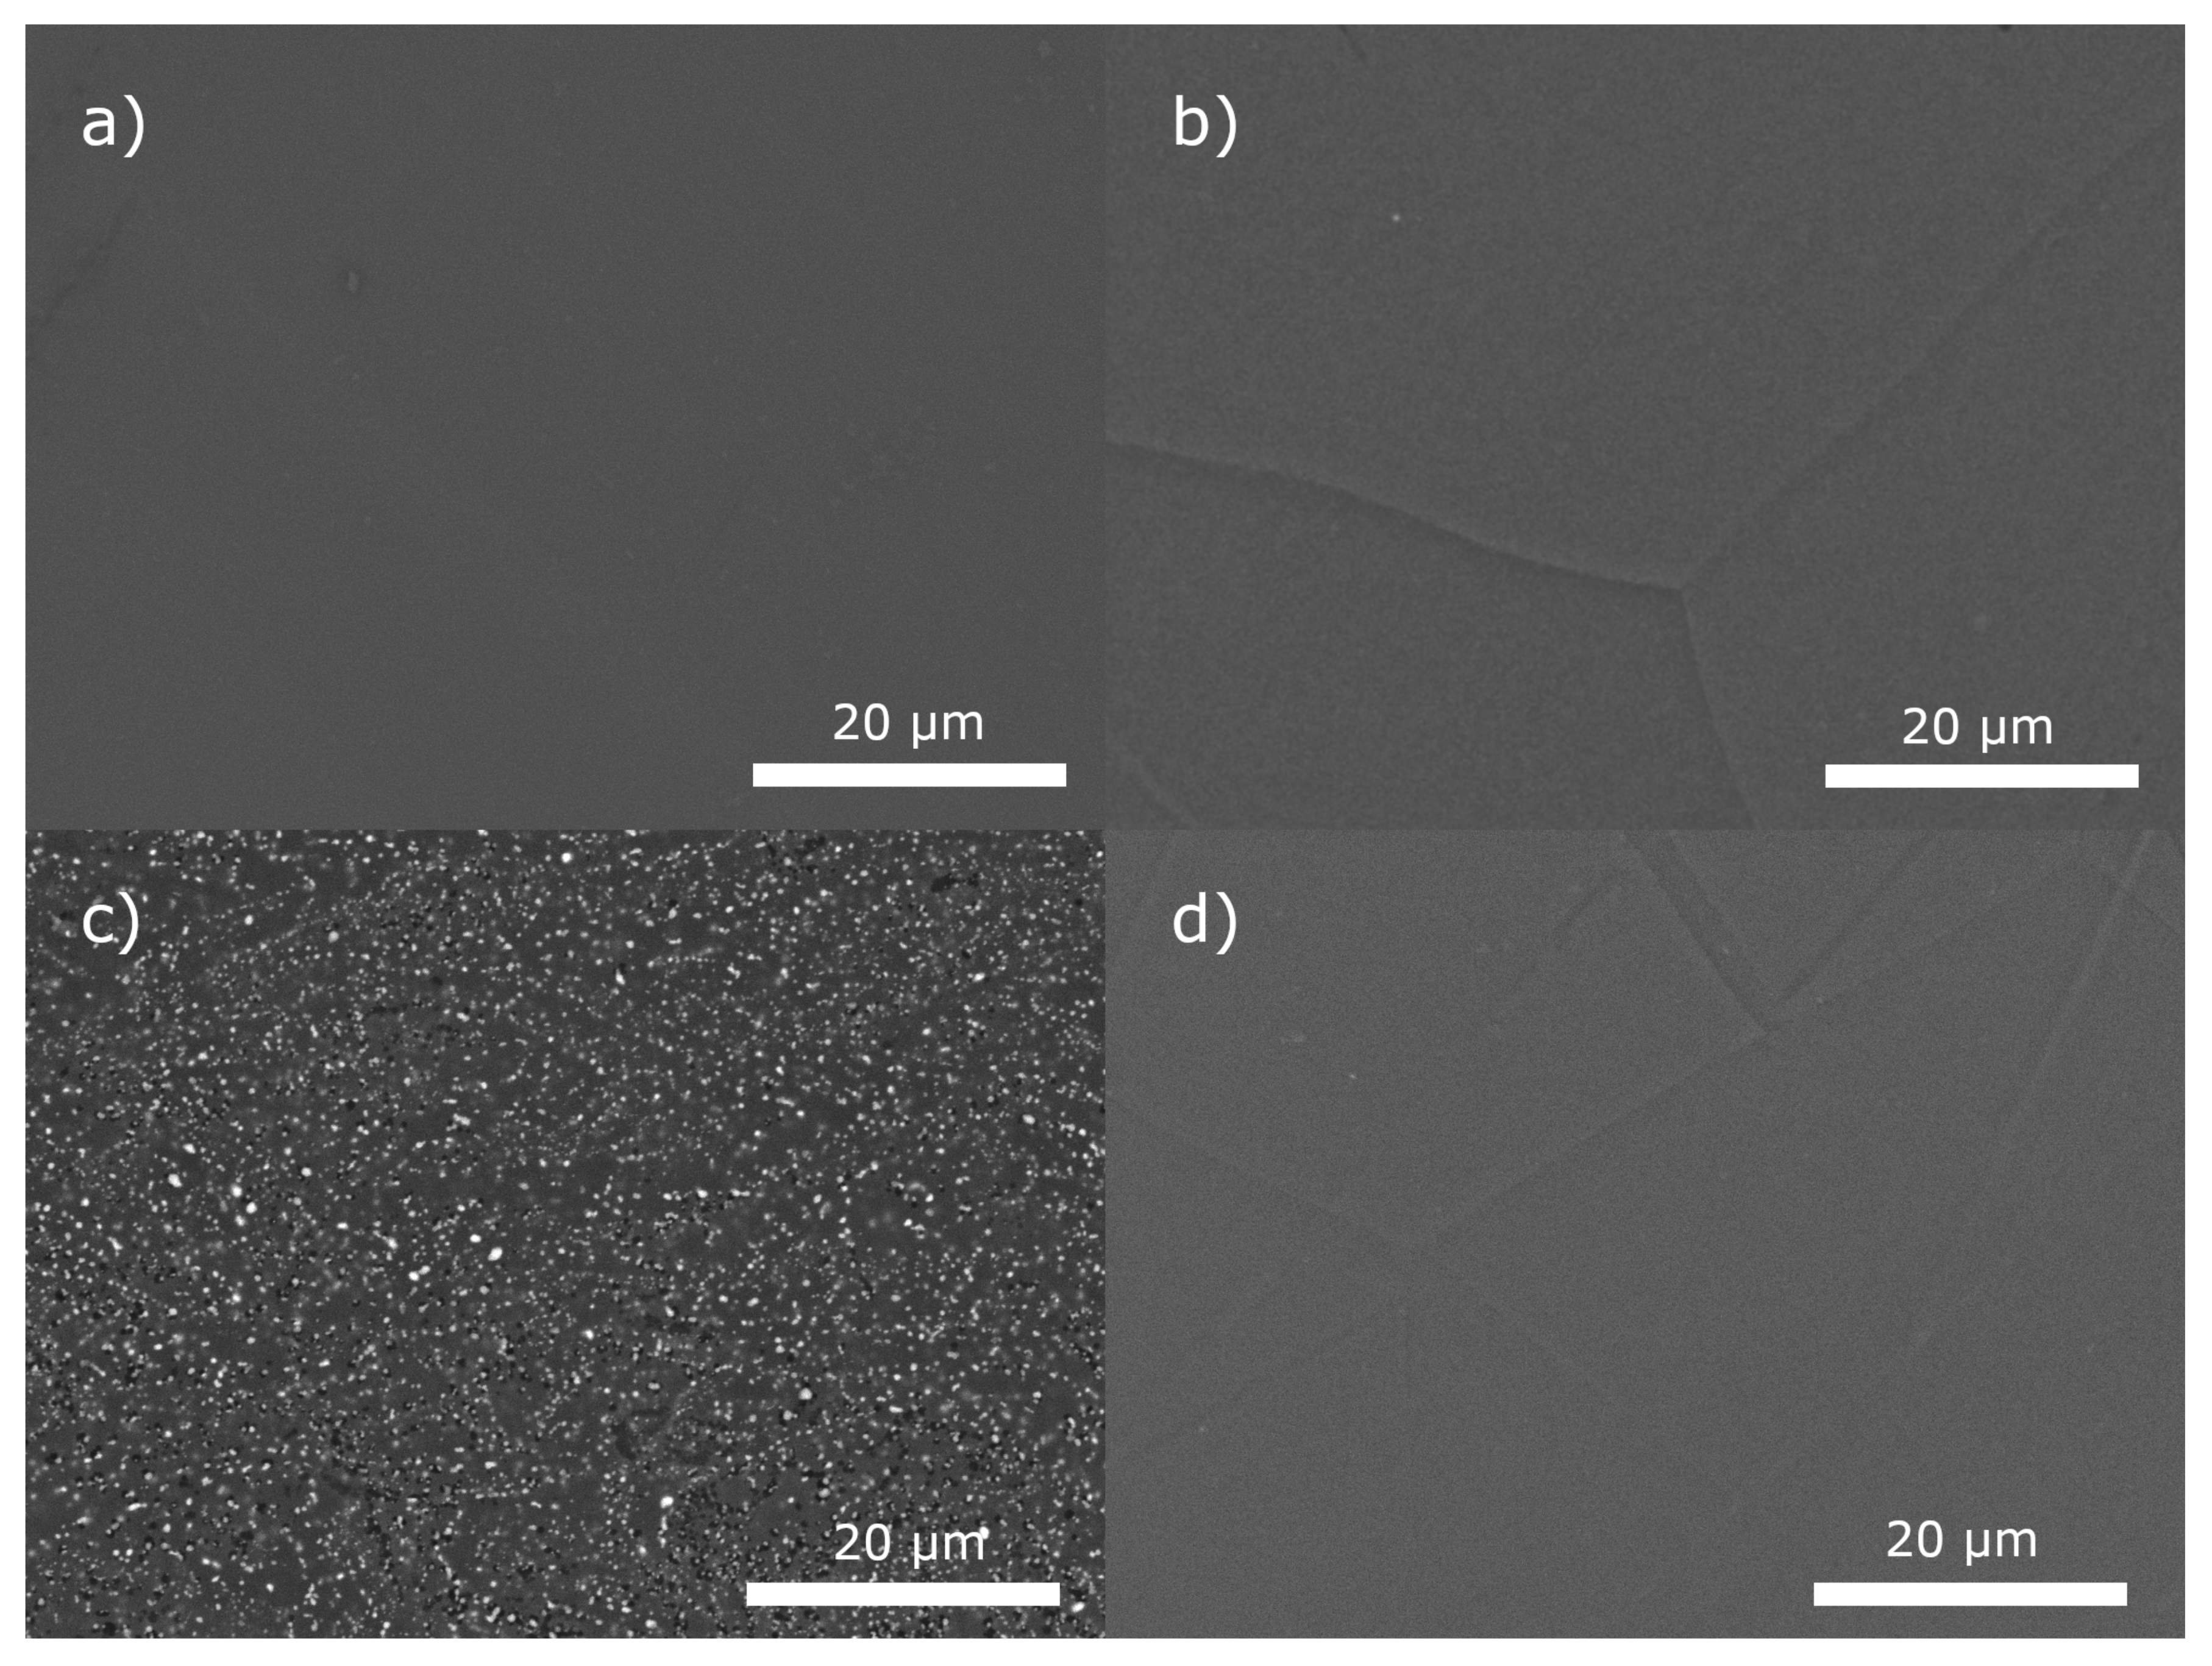
3.1. Material Analysis

The recrystallisation and solution heat treatment were selected to achieve different states in the Mg-Ag wires. Figure 1 shows SEM BSE images of the cross section of the wires with Ag concentrations of 2 and 6 wt.% respectively after recrystallisation and after solid solution annealing. Only in the case of the wire with 6 wt.% Ag in the recrystallised state, precipitates can be determined. They appear as bright areas in the SEM BSE micrographs separated from the Mg matrix. In all three other states a homogeneous distribution of elements were detected. The binary phase diagram of Mg and Ag simulated by Pandat™ 2017 with PanMagnesium 2017 thermodynamic database states full solubility of 2 wt.% above 380 ° C and of 6 wt.% above 420 ° C, with Mg 4 Ag as stable phase in equilibrium at lower temperatures [13,28]. This is in agreement with the microstructures in Figure 1 (a,b) and shows that the two heat treatments of Mg-2Ag always result in a supersaturated Mg solid solution without precipitates. The annealing temperature was 400 °C, so 420 °C was not exceeded and precipitates were not dissolved completely. In this state the phase Mg4Ag precipitates are thermodynamically stable in the phase diagram (Figure 1c). After the solution heat treatment, no more precipitates were detected here as well (Figure 1d). In other studies, precipitates of the stoichiometry Mg 54 Ag 17 have been reported in extruded and rolled material [9,13]. In as cast material, Ag rich precipitates were found distributed along the grain boundaries in a regular pattern. However, the SEM BSE analysis in Figure 1 shows precipitations in a finer distributions and not limited to grain boundaries.
Along with the annealing treatment and solution of the Ag precipitates, the grain size is affected and can be seen in Figure 2. The grain size was analysed using light microscopy on polished and etched cross sections of the wire and presented in Table 3. The cold drawn wire contains many crystallographic defects in the grains. These defects act as nuclei for new grains during recrystallisation. The new grains grow into defect rich neighbouring grains to minimize the overall energy. The grain size remains around 10 μ m in the recrystallisation treatment but growth accelerates during the solution annealing step. Despite the inhomogeneous grain size, no abnormal grain growth is visible after annealing. Increased Ag content shows more rapid grain growth and highest grain size after sol. annealing. Bian et al. reported a grain refinement and homogenisation of the microstructure with less abnormal grain growth as Ag content increases after solution annealing [28]. From this the authors hypothesized that the segregated solute Ag effectively reduces grain boundary mobility via solute drag effects. Our results do not support this hypothesis. A direct comparison may not be permissible as grain growth in the wire is limited and influenced by its diameter. For the samples in this study it rather supports the statement that no pronounced segregation or accumulation of Ag at grain boundaries occur throughout all samples.

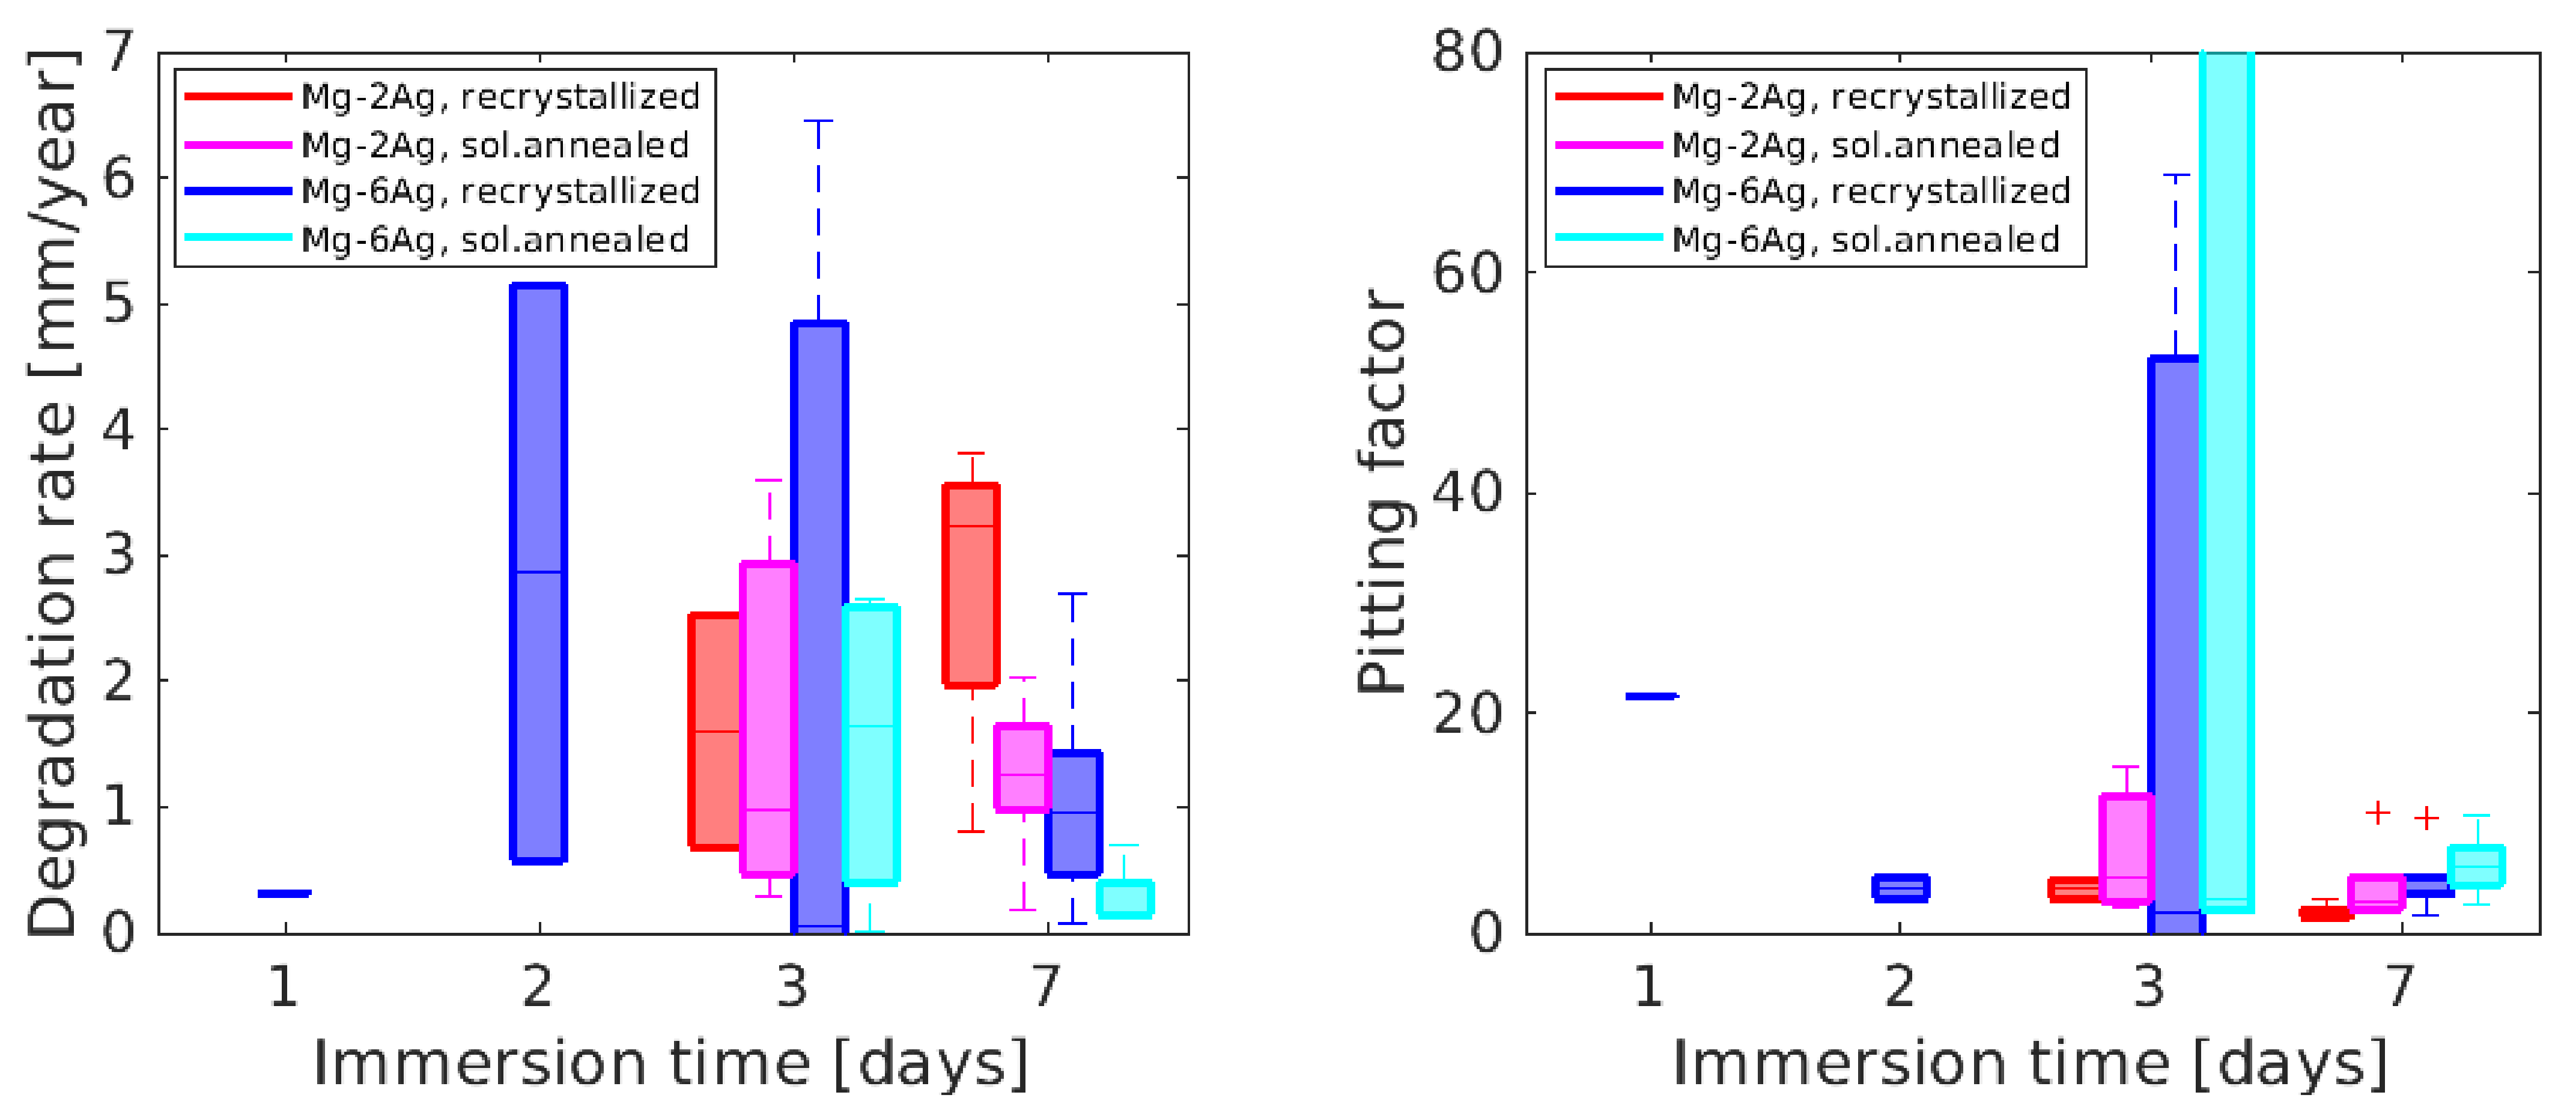
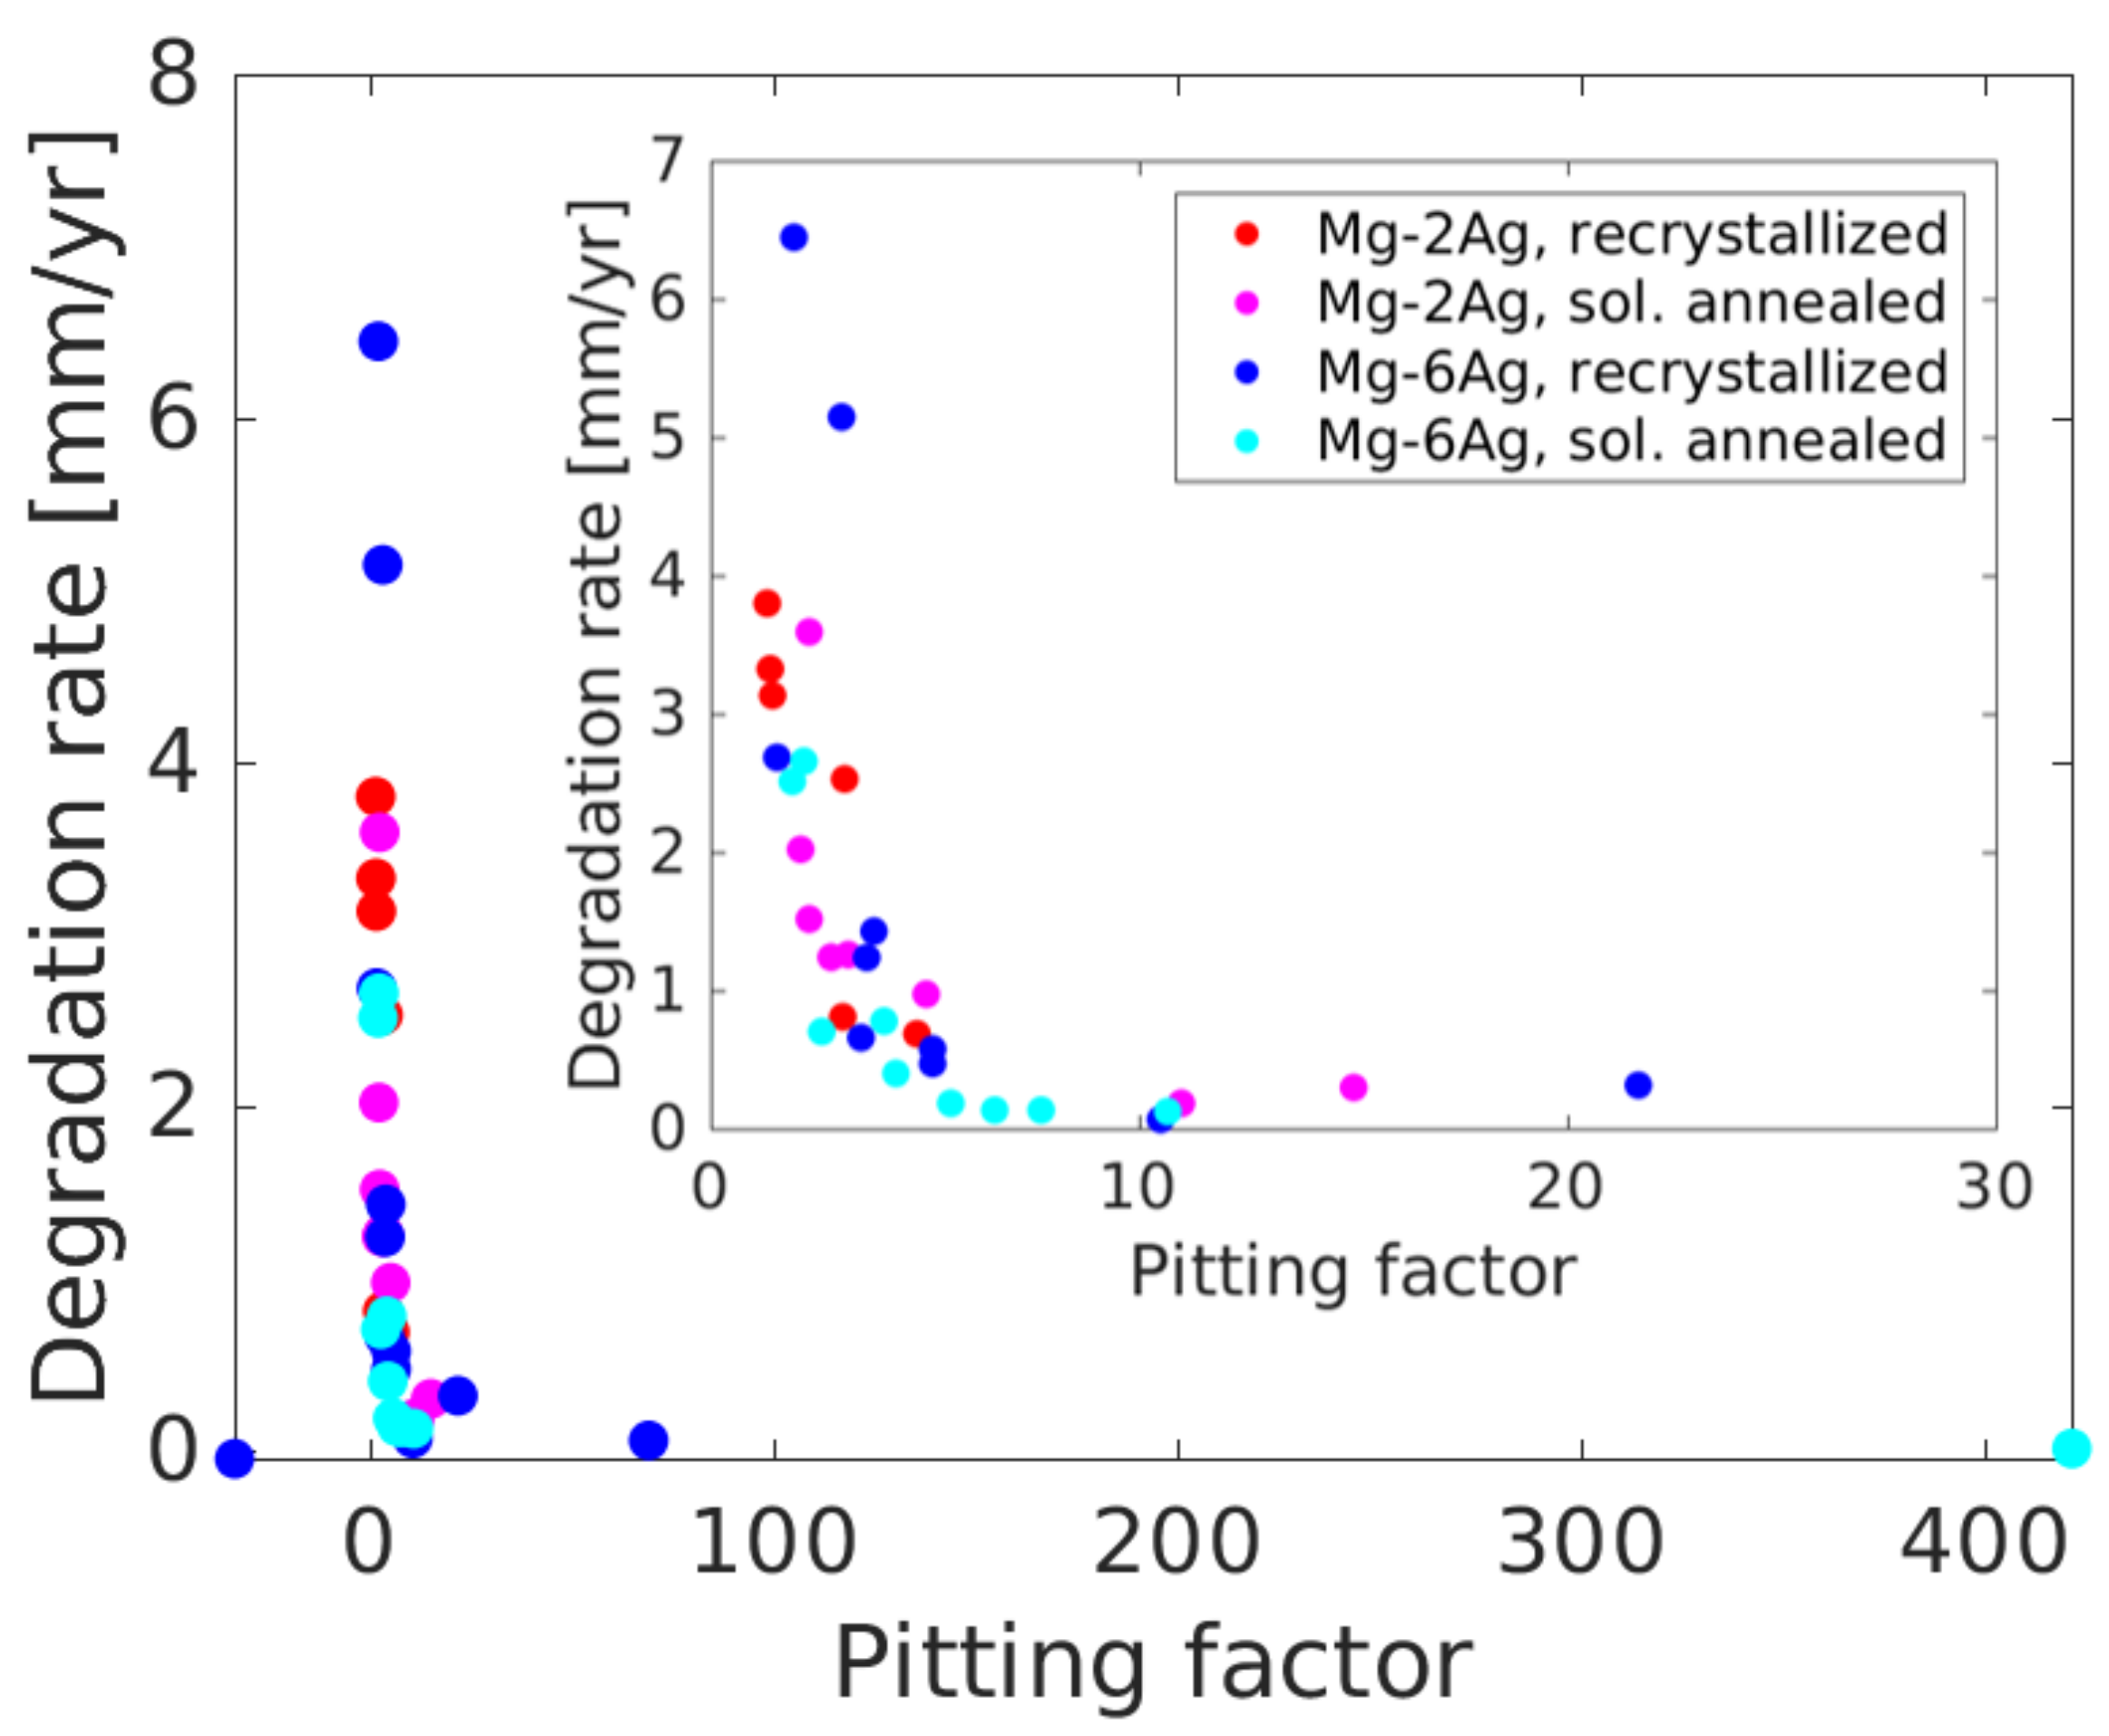
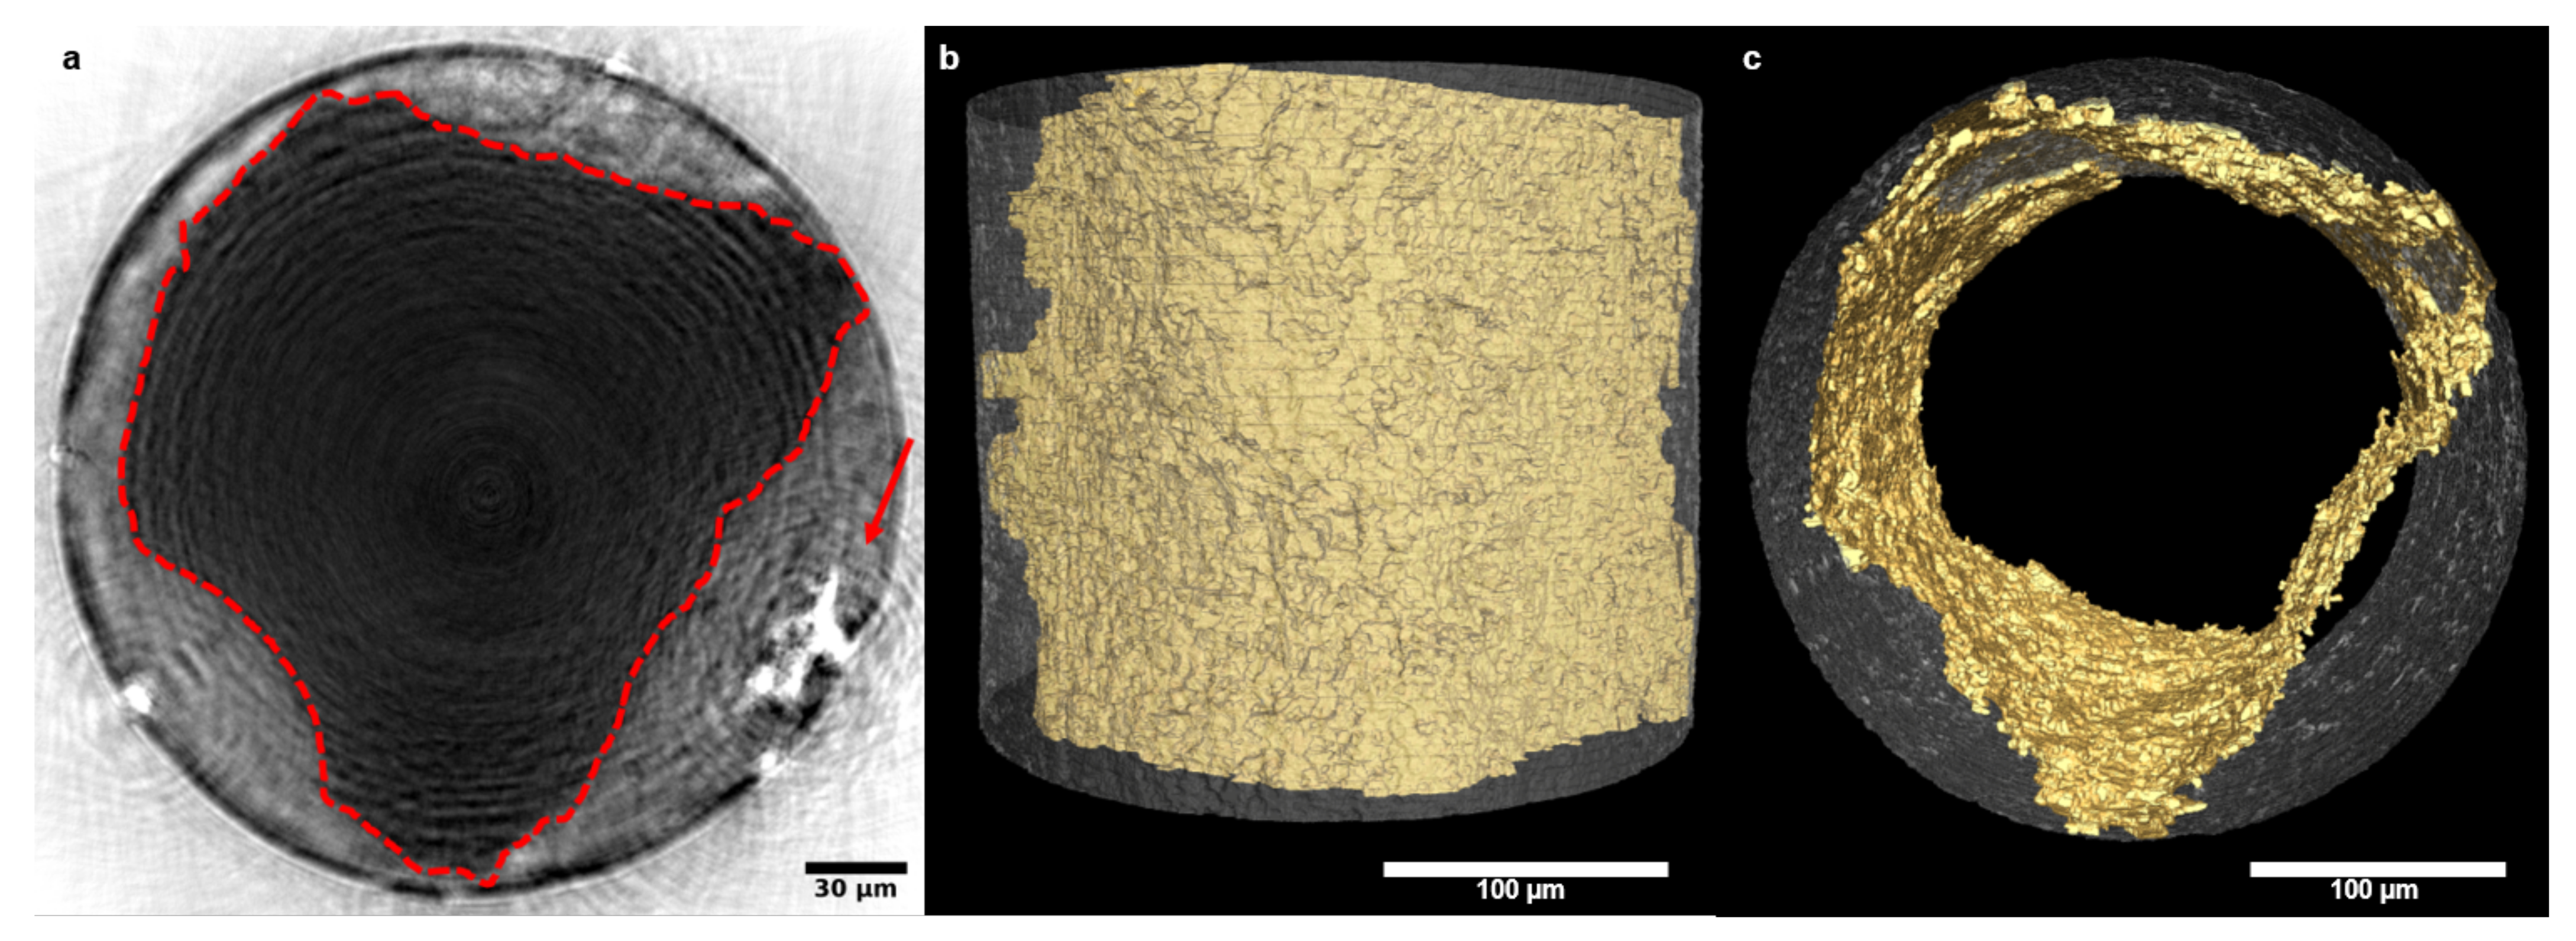
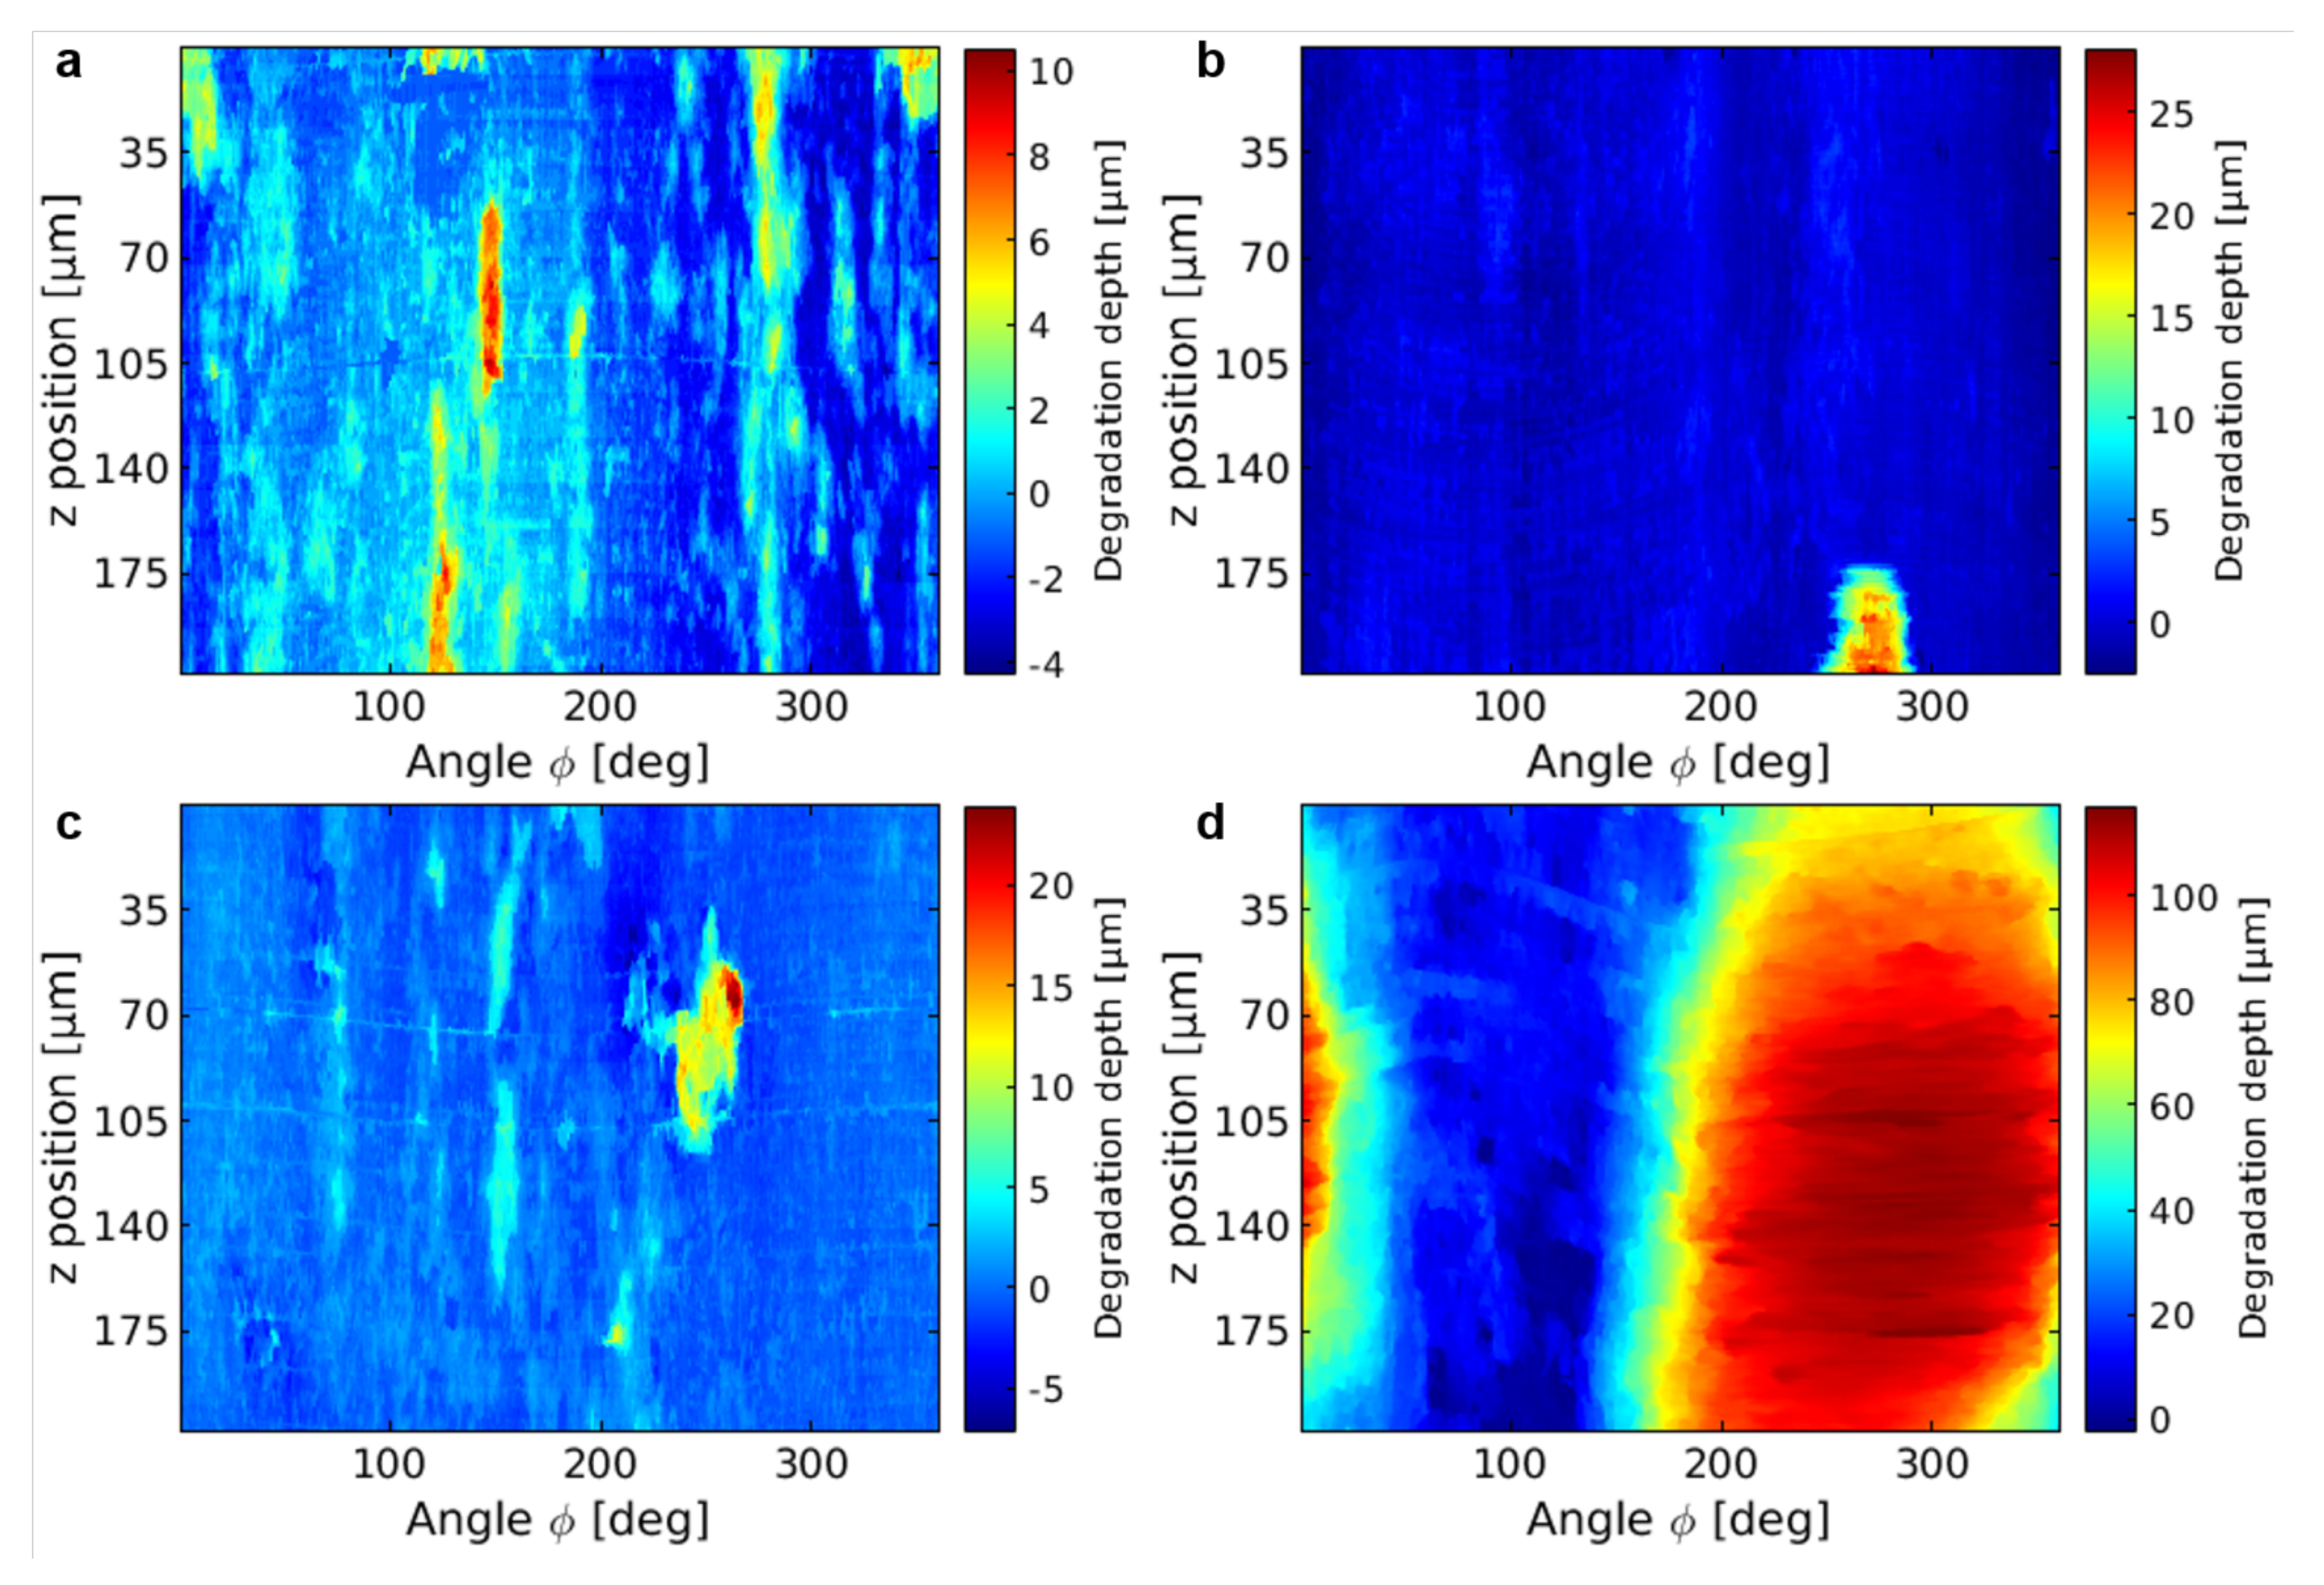
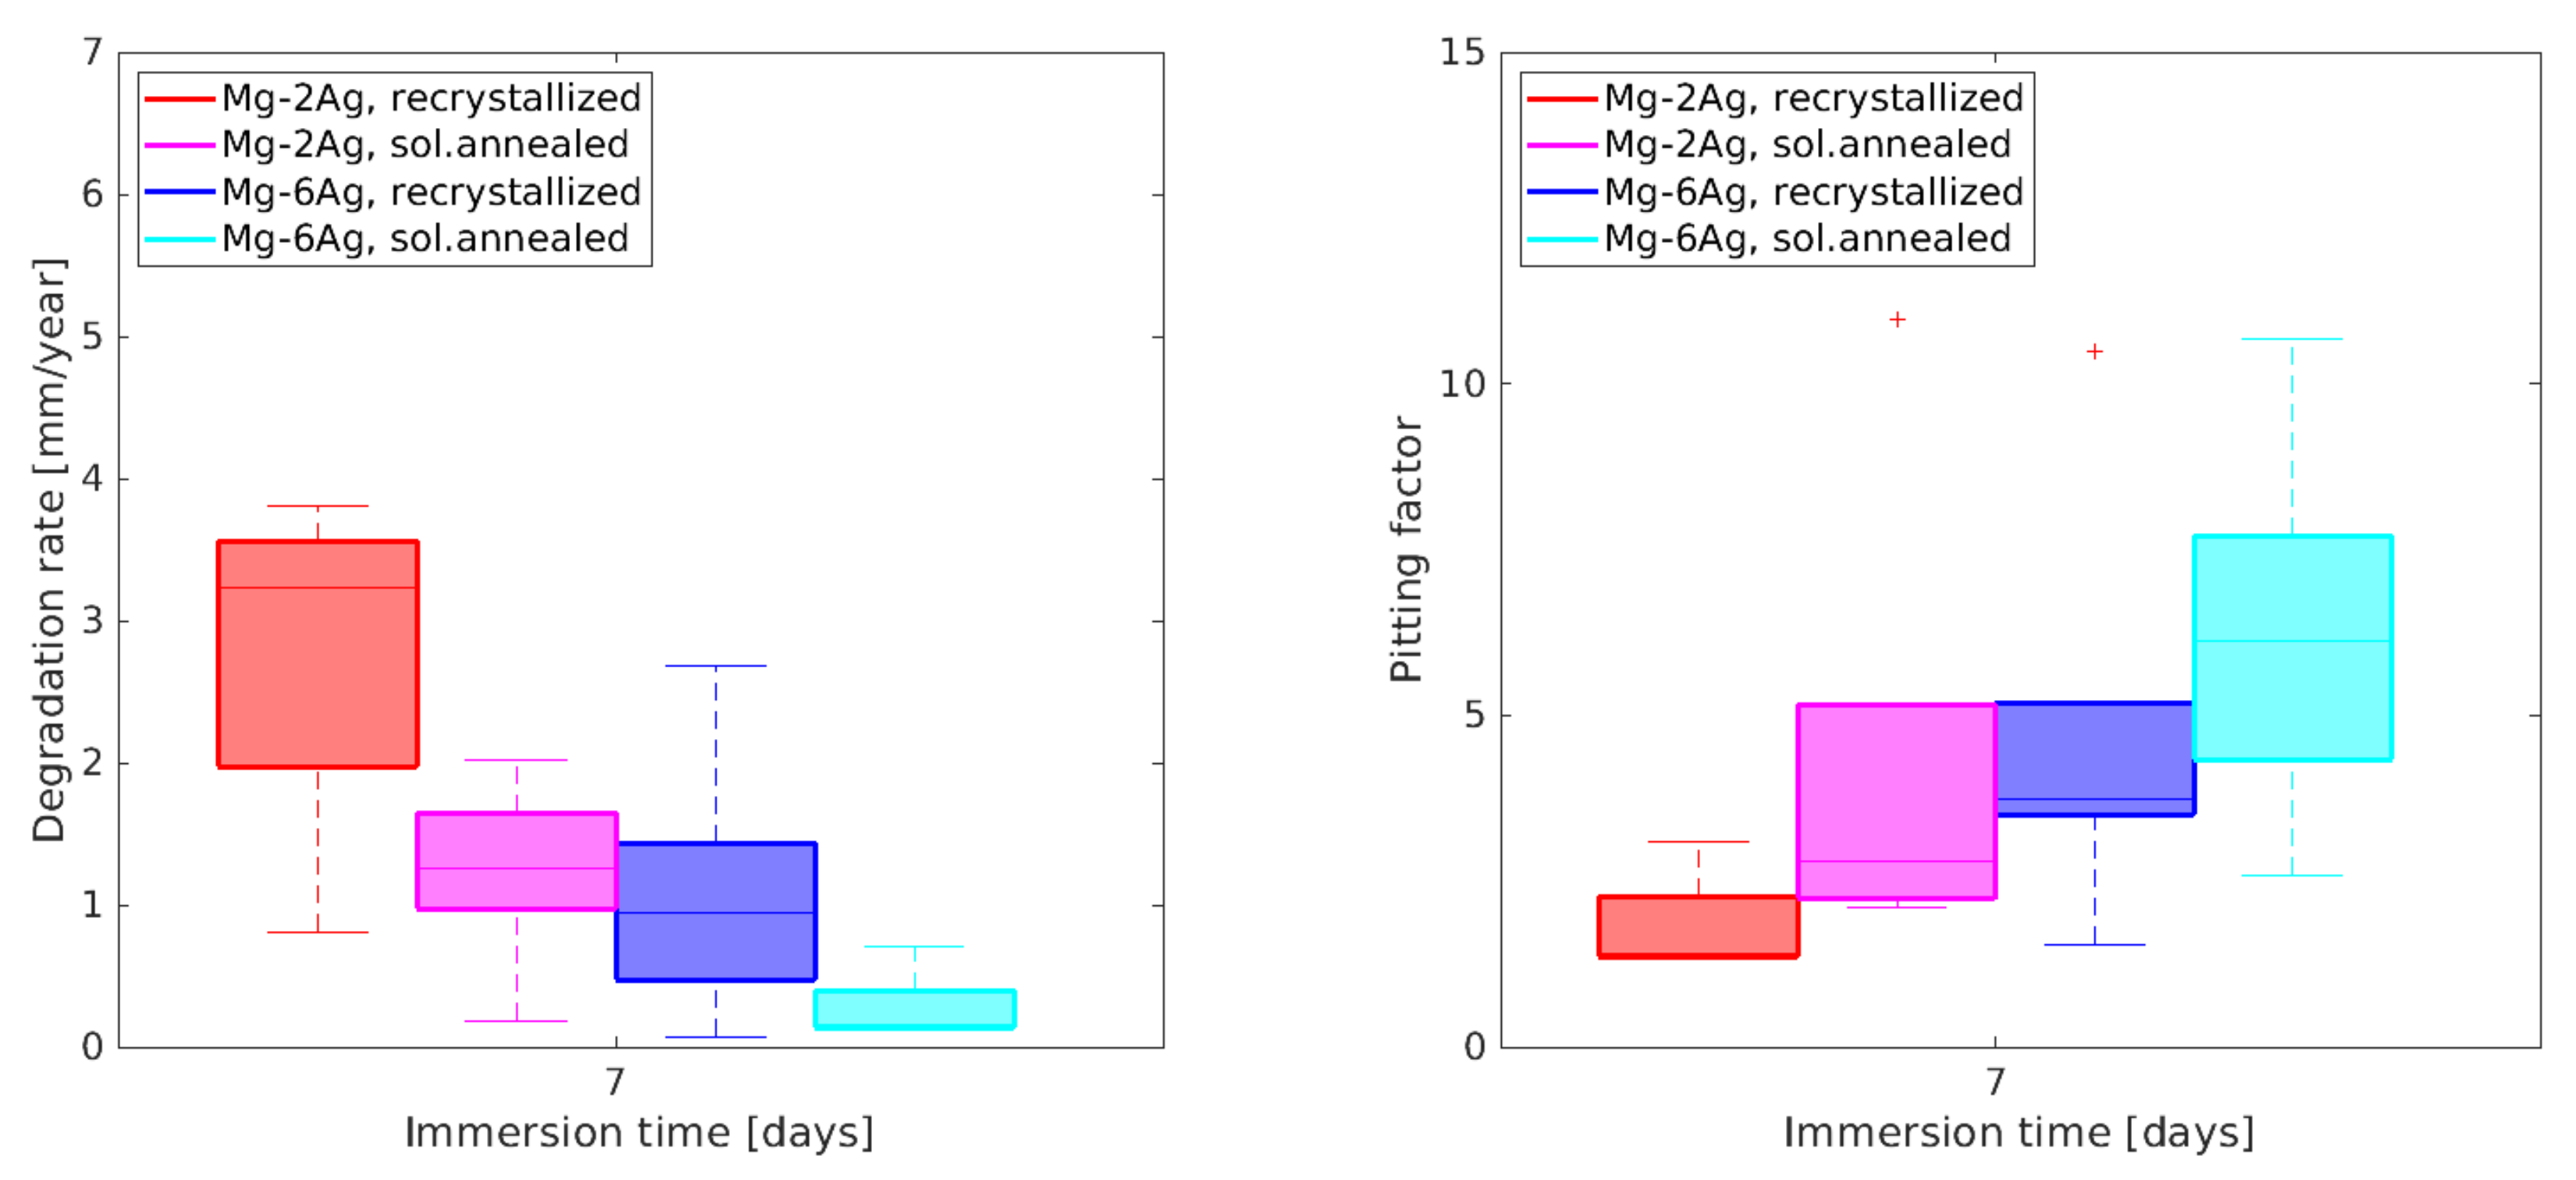
3.2. Degradation Analysis Based on NFHT

Figure 3 shows an example of a slice of a tomographic reconstruction of a solution annealed Mg-2Ag wire after 7 days of degradation, as well as two 3D renderings of the same wire superimposed with a rendering of a non-degraded wire. The degradation layer can be distinguished from the residual metal of the wire within the tomographic reconstruction. However, image artefacts are visible that arise from phase wrapping due to the strong phase shift at the selected photon energies. The phase shift is induced by the wire and in particular material clusters therein, which are expected to be Ag precipitates.
Figure 4 displays the degradation rate and pitting factor (mean ± standard deviation) for both alloys before and after solution annealing at all time points of degradation as determined using NFHT. The standard deviation of both parameters is large for all settings, making only a comparison of trends possible. For 1 day of immersion only one sample was measured; therefore, no standard deviation is shown. It appears that Mg-2Ag degrades faster than Mg-6Ag after 7 days both before and after solution annealing. Solution annealing has decreased the degradation rate for both alloys after 7 days. After three days this trend is not yet visible and there are no apparent differences between the alloys and the treatments. For recrystallized Mg-6Ag wires the data suggests an initial increase in degradation rate after one day, followed by a decrease over time. The pitting factor appears to decrease over time and higher Ag content leads to a higher pitting factor. Similarly, the solution annealing also tends to increases the pitting factor, although a clear correlation cannot be established due to the high standard deviation. The degradation rate and pitting factor of Mg-6Ag in the recrystallized state after three days is negative for one wire (−0.05 mm/yr and −33.6, respectively), as the mean radius of the degraded wire was larger than the mean radius of the non-degraded wires. This may be due to variances in the manufacturing process of the wire and very little degradation. In contrast, another recrystallized wire Mg-6Ag displays a very high pitting factor (68.9) after 3 days of degradation, thus leading to a very high variation in the values of pitting factor. The largest pitting factor (421.4) was observed for a solution annealed Mg-6Ag wire after 3 days of degradation. This was due to a very localized corrosion pit and overall little to no degradation. Figure A1 shows exemplary heat maps of the different degradation depths of the three mentioned outliers and a fourth wire with high degradation rate for visual support. To determine the degradation inhomogeneity within one sample, Figure A2 shows the degradation rate and pitting factor calculated from the one sample per alloy and treatment imaged at three height steps after 7 days of immersion. The numbers differ little from the numbers presented in Figure 4, showing that both inter-sample and intra-sample variability are high.
The observed trends are in part contrary to the results presented in the literature, which showed that higher Ag content leads to an increase in the degradation rate [9,12,14]. However, in agreement with previous studies, we have found that solution annealing lowers the degradation rate [9,14]. Differences in the degradation behaviour may be due to differences in the microstructure, as grain sizes in the recrystallized wires were similar for both Mg-2Ag and Mg-6Ag, while as-cast material used in the studies by Tie et al. showed greater grain sizes of 350 to 600 μ m, respectively, [12,14]. Moreover, Tie et al. utilized electrochemical corrosion resistance measurements for their analysis, which can only provide immediate measurements but fails to provide information on the longer term material behaviour. In agreement with the study by Estrin et al. [15], in which Mg-2Ag and Mg-4Ag after T4 treatment and following equal-channel angular pressing (ECAP) were studied, we find that at early time points (2 or 3 days) the degradation rate of the different alloys after heat treatment do not differ significantly. At the same time, ECAP, which reduces the grain size and increases the number of Mg 4 Ag precipitates, similar to the recrystallized state in this study, leads to higher degradation rates in Mg-4Ag than Mg-2Ag, which is in agreement with the trends observed here. After 7 days of immersion, the ECAP treated alloys had similar degradation rates, which agrees with the recrystallized wires in this study, while the T4 treated Mg-2Ag wires had lower degradation rates than Mg-4Ag, which is in contrast to results found here. In agreement with the Liu et al. [9] we find that higher Ag content appears to lead to a higher tendency for pitting corrosion after heat treatment.
Figure 5 shows the correlation between degradation rate and pitting factor, combined for all time points, with the inset displaying the results after removal of outliers. Larger pitting factors can be associated with lower degradation rates, while the lowest pitting factors are associated with larger degradation rates. Mg-6Ag in the recrystallized state shows the highest variation across both scales, while a lower amount of Ag and the solution annealing are limiting the variability of the parameters. This shows that in particular for Mg wires with a higher content of Ag, the solution annealing is a crucial processing step to control the degradation rate and degradation homogeneity.
The results show that NFHT is a useful method in analysing the degradation rate of thin Mg alloy wires, whose degradation at early time points could otherwise not be assessed. However, due to the relatively small FOV, several areas per sample and larger sample numbers need to be investigated to achieve lower variations in the degradation parameters in the future. Nevertheless, as shown in Figure A2, even the degradation inhomogeneity within one sample is high. Due to the long imaging times required for NFHT it may therefore be beneficial to utilize TXM in the future, which enables imaging within 15 minutes per tomogram [29], if sufficiently large FOVs or sufficiently small wire diameters can be achieved, respectively.

4. Conclusions

We have shown that X-ray near-field holotomography is a suitable method to study the degradation of Mg alloy wires with a field of view tailored to the wire size and sub-micrometer resolution. Overall, 40 wires were imaged, processed, and analysed for this study. The results of the study suggest that Mg-6Ag may be an interesting candidate for the use as an implant material due to a lower degradation rate after 7 days in combination with the potential for higher Ag release into the biological system.

Author Contributions

Conceptualization, B.Z.-P. and B.W.; methodology, B.Z.-P., J.H., and B.W.; formal analysis, A.W., S.M., K.I., and B.Z.-P.; material production, D.S. and S.M.; investigation, S.M., S.B., D.S., H.Ć., J.H., S.F., I.G., and B.Z.-P.; writing—original draft preparation, B.Z.-P., S.M., and B.W.; writing—review and editing, all authors; visualization, B.Z.-P. and S.M.; supervision, B.Z.-P., B.W., and R.W.-R. All authors have read and agreed to the published version of the manuscript.

Funding

The authors H.Ć. and K.I. acknowledge funding from the European Union’s Horizon 2020 research and innovation program under the Marie Skłodowska-Curie grant, agreement No 811226. The author D.S. acknowledges funding from the German Research Foundation (DFG, project number 404534760).

Institutional Review Board Statement

Not applicable.

Informed Consent Statement

Not applicable.

Data Availability Statement

Due to the size of the X-ray near-field holotomography datasets, all data is available only upon request to the corresponding authors.

Acknowledgments

We acknowledge provision of beamtime related to the proposal I-20191320 at the nanotomography end-station of beamline P05 at PETRA III at DESY, a member of the Helmholtz Association (HGF). This research was supported in part through the Maxwell computational resources operated at DESY.

Conflicts of Interest

The authors declare no conflict of interest. The funders had no role in the design of the study; in the collection, analyses, or interpretation of data; in the writing of the manuscript, or in the decision to publish the results.

Abbreviations

The following abbreviations are used in this manuscript:
SEMScanning electron microscopy
BSEBack-scattering electron
TXMTransmission X-ray microscopy
NFHTNear-field holotomography
FOVField-of-view
OSAOrder sorting aperture

Appendix A. Supplementary Figures

Figure A1. Exemplary heat maps of the localised degradation depth of four wires following radial reslicing. (a) displays the recrystallized Mg-6Ag wire after 3 days of immersion, which resulted in a negative degradation rate and pitting factor (−0.05 mm/yr and −33.6, respectively). (b) shows the wire with the highest pitting factor of 421.4, which was found for a solution annealed Mg-6Ag wire after 3 days of immersion, due to the low overall degradation. (c) displays a recrystallized Mg-6Ag wire after 3 days of immersion with low degradation rate (0.06 mm/yr) and high pitting factor (68.9). (d) shows a recrystallized Mg-6Ag wire after 3 days of immersion with high degradation rate (6.45 mm/yr) and lower pitting factor (1.9.)
Metals 11 01422 g0a1
Figure A2. Degradation rate and pitting factor of the one recrystallized and solution annealed Mg-2Ag and Mg-6Ag wire each after 7 days of immersion evaluated at three different heights displayed as boxplots. The boxplots show the median of the parameters as a line and the 25th and 75th percentiles. Outliers are plotted as +.
Metals 11 01422 g0a2

References

  1. Witte, F. The history of biodegradable magnesium implants: A review. Acta Biomater. 2010, 6, 1680–1692. [Google Scholar] [CrossRef]
  2. Seitz, J.M.; Lucas, A.; Kirschner, M. Magnesium-Based Compression Screws: A Novelty in the Clinical Use of Implants. JOM 2016, 68, 1177–1182. [Google Scholar] [CrossRef]
  3. Bennett, J.; Hemptinne, Q.D.; McCutcheon, K. Magmaris resorbable magnesium scaffold for the treatment of coronary heart disease: overview of its safety and efficacy. Expert Rev. Med. Devices 2019, 16, 757–769. [Google Scholar] [CrossRef] [PubMed]
  4. Huse, E.C. A New Ligature? Chic. Med. J. Exam. 1878, 38, 171–172. [Google Scholar]
  5. Seitz, J.M.; Utermöhlen, D.; Wulf, E.; Klose, C.; Bach, F.W. The Manufacture of Resorbable Suture Material from Magnesium—Drawing and Stranding of Thin Wires. Adv. Eng. Mater. 2011, 13, 1087–1095. [Google Scholar] [CrossRef]
  6. Rostock, P. Ist das Magnesium als Naht- und Sehienungsmaterialfiir Knochenoperationen geeignet? Arch. Orthop. Unf.-Chir. 1937, 38, 486–492. [Google Scholar] [CrossRef]
  7. Alaneme, K.; Okotete, E. Enhancing plastic deformability of Mg and its alloys—A review of traditional and nascent developments. J. Magnes. Alloy. 2017, 5, 460–475. [Google Scholar] [CrossRef]
  8. Wiese, B.; Willumeit-Römer, R.; Letzig, D.; Bohlen, J. Alloying effect of silver in magnesium on the development of microstructure and mechanical properties by indirect extrusion. J. Magnes. Alloy. 2021, 9, 112–122. [Google Scholar] [CrossRef]
  9. Liu, Z.; Schade, R.; Luthringer, B.; Hort, N.; Rothe, H.; Müller, S.; Liefeith, K.; Willumeit-Römer, R.; Feyerabend, F. Influence of the Microstructure and Silver Content on Degradation, Cytocompatibility, and Antibacterial Properties of Magnesium-Silver Alloys in Vitro. Oxidative Med. Cell. Longev. 2017, 2017. [Google Scholar] [CrossRef] [PubMed] [Green Version]
  10. Nienaber, M.; Yi, S.; Kainer, K.U.; Letzig, D.; Bohlen, J. On the Direct Extrusion of Magnesium Wires from Mg-Al-Zn Series Alloys. Metals 2020, 10, 1208. [Google Scholar] [CrossRef]
  11. Kustra, P.; Milenin, A.; Byrska-Wójcik, D.; Grydin, O.; Schaper, M. The process of ultra-fine wire drawing for magnesium alloy with the guaranteed restoration of ductility between passes. J. Mater. Process. Technol. 2017, 247, 234–242. [Google Scholar] [CrossRef]
  12. Tie, D.; Feyerabend, F.; Hort, N.; Hoeche, D.; Kainer, K.; Willumeit, R.; Mueller, W. In vitro mechanical and corrosion properties of biodegradable Mg-Ag alloys. Mater. Corros. 2014, 65, 569–576. [Google Scholar] [CrossRef]
  13. Liu, Z.; Feyerabend, F.; Bohlen, J.; Willumeit-Römer, R.; Letzig, D. Mechanical properties and degradation behavior of binary magnesium-silver alloy sheets. J. Phys. Chem. Solids 2019, 133, 142–150. [Google Scholar] [CrossRef]
  14. Tie, D.; Feyerabend, F.; Müller, W.D.; Schade, R.; Liefeith, K.; Kainer, K.; Willumeit, R. Antibacterial biodegradable Mg-Ag alloys. Eur. Cells Mater. 2013, 25, 284–298. [Google Scholar] [CrossRef] [PubMed]
  15. Estrin, Y.; Martynenko, N.; Anisimova, N.; Temralieva, D.; Kiselevskiy, M.; Serebryany, V.; Raab, G.; Straumal, B.; Wiese, B.; Willumeit-Römer, R.; et al. The effect of equal-channel angular pressing on the microstructure, the mechanical and corrosion properties and the anti-tumor activity of magnesium alloyed with silver. Materials 2019, 12, 3832. [Google Scholar] [CrossRef] [Green Version]
  16. Gonzalez, J.; Hou, R.Q.; Nidadavolu, E.P.S.; Willumeit-Römer, R.; Feyerabend, F. Magnesium degradation under physiological conditions—Best practice. Bioact. Mater. 2018, 3, 174–185. [Google Scholar] [CrossRef]
  17. van Gaalen, K.; Gremse, F.; Benn, F.; McHugh, P.E.; Kopp, A.; Vaughan, T.J. Automated ex-situ detection of pitting corrosion and its effect on the mechanical integrity of rare earth magnesium alloy—WE43. Bioact. Mater. 2021. [Google Scholar] [CrossRef]
  18. Zeller-Plumhoff, B.; Tolnai, D.; Wolff, M.; Greving, I.; Hort, N.; Willumeit-Römer, R. Utilizing Synchrotron Radiation for the Characterization of Biodegradable Magnesium Alloys—From Alloy Development to the Application as Implant Material. Adv. Eng. Mater. 2021, 2100197. [Google Scholar] [CrossRef]
  19. Zeller-Plumhoff, B.; Helmholz, H.; Feyerabend, F.; Dose, T.; Wilde, F.; Hipp, A.; Beckmann, F.; Willumeit-Römer, R.; Hammel, J.U. Quantitative characterization of degradation processes in situ by means of a bioreactor coupled flow chamber under physiological conditions using time-lapse SRµCT. Mater. Corros. 2018, 69, 298–306. [Google Scholar] [CrossRef]
  20. Zeller-Plumhoff, B.; Laipple, D.; Slominska, H.; Iskhakova, K.; Longo, E.; Hermann, A.; Flenner, S.; Greving, I.; Storm, M.; Willumeit-Römer, R. Evaluating the morphology of the degradation layer of pure magnesium via 3D imaging at resolutions below 40 nm. Bioact. Mater. 2021, 6, 4368–4376. [Google Scholar] [CrossRef]
  21. Bartels, M.; Krenkel, M.; Haber, J.; Wilke, R.N.; Salditt, T. X-ray holographic imaging of hydrated biological cells in solution. Phys. Rev. Lett. 2015, 114, 48103. [Google Scholar] [CrossRef] [PubMed] [Green Version]
  22. Cloetens, P.; Ludwig, W.; Baruchel, J.; Van Dyck, D.; Van Landuyt, J.; Guigay, J.P.; Schlenker, M. Holotomography: Quantitative phase tomography with micrometer resolution using hard synchrotron radiation x rays. Appl. Phys. Lett. 1999, 75, 2912–2914. [Google Scholar] [CrossRef] [Green Version]
  23. Kree, V.; Bohlen, J.; Letzig, D.; Kainer, K. The metallographical examination of magnesium alloys [Metallographische Gefügeuntersuchungen von Magnesiumlegierungen]. Prakt. Metallogr./Pract. Metallogr. 2004, 41, 233–246. [Google Scholar]
  24. Flenner, S.; Kubec, A.; David, C.; Storm, M.; Schaber, C.F.; Vollrath, F.; Müller, M.; Greving, I.; Hagemann, J. Hard X-ray nano-holotomography with a Fresnel zone plate. Opt. Express 2020, 28, 37514–37525. [Google Scholar] [CrossRef] [PubMed]
  25. Hagemann, J.; Töpperwien, M.; Salditt, T. Phase retrieval for near-field X-ray imaging beyond linearisation or compact support. Appl. Phys. Lett. 2018, 113, 041109. [Google Scholar] [CrossRef] [Green Version]
  26. Gürsoy, D.; De Carlo, F.; Xiao, X.; Jacobsen, C. TomoPy: A framework for the analysis of synchrotron tomographic data. Proc. Spie Int. Soc. Opt. Eng. 2014, 9212. [Google Scholar] [CrossRef] [Green Version]
  27. Schindelin, J.; Arganda-Carreras, I.; Frise, E.; Kaynig, V.; Longair, M.; Pietzsch, T.; Preibisch, S.; Rueden, C.; Saalfeld, S.; Schmid, B.; et al. Fiji: An open-source platform for biological-image analysis. Nat. Methods 2012, 9, 676–682. [Google Scholar] [CrossRef] [Green Version]
  28. Bian, M.; Huang, X.; Chino, Y. Microstructures and Mechanical Properties of Precipitation-Hardenable Magnesium-Silver-Calcium Alloy Sheets. Metals 2020, 10, 1632. [Google Scholar] [CrossRef]
  29. Flenner, S.; Storm, M.; Kubec, A.; Longo, E.; Döring, F.; Pelt, D.M.; David, C.; Müller, M.; Greving, I. Pushing the temporal resolution in absorption and Zernike phase contrast nanotomography: enabling fast in situ experiments. J. Synchrotron Radiat. 2020, 27, 1339–1346. [Google Scholar] [CrossRef]
Figure 1. SEM BSE images of the wire cross section of (a) Mg-2Ag recrystallized, (b) Mg-2Ag sol. annealed, (c) Mg-6Ag recrystallized, and (d) Mg-6Ag sol. annealed.
Metals 11 01422 g001
Figure 2. Micrographs of the annealed wire cross sections, (a) Mg-2Ag and (b) Mg-6Ag. A large number of twins is visible, which are introduced easily by bending especially in the annealed wires. (c) displays an overview of a larger part of the a Mg-2Ag wire for comparison.
Metals 11 01422 g002
Figure 3. (a) Slice through tomographic reconstruction of a solution annealed Mg-2Ag wire after 7 days of degradation. The degradation layer can clearly be distinguished from the residual metal (dashed red outline). The red arrow indicates a cluster of strongly phase shifting materials within the sample, potentially Ag precipitates, and resulting phase wrapping artefacts. (b,c) The 3D surface rendering of the residual metal of the degraded wire shown in (a) obtained after segmentation and superimposed with a semi-transparent surface rendering of a non-degraded wire in two orthogonal directions.
Metals 11 01422 g003
Figure 4. Degradation rate and pitting factor of Mg-2Ag and Mg-6Ag wires depending on the immersion time and treatment displayed as boxplots. The boxplots show the median of the parameters as a line and the 25th and 75th percentiles. Outliers are plotted as +.
Metals 11 01422 g004
Figure 5. Correlation between degradation rate and pitting factor for all alloys and treatments at all time points. The inset displays the correlation after removal of the outliers.
Metals 11 01422 g005
Table 1. Chemical compositions of all alloys analysed with atomic absorption spectroscopy for Ag and spark emission spectroscopy for Fe, Cu, and Ni, balance Mg, data from [8].
AlloyAg (wt.%)Fe (wt.%)Ni (wt.%)Cu (wt.%)
Mg-2Ag1.97 (±0.06)0.0027 (±0.0006)0.004 (±0.002)0.0013 (±0.005)
Mg-6Ag5.99 (±0.20)0.0016 (±0.0002)<0.00020.0004 (±0.001)
Table 2. Number of obtained tomograms per alloy, treatment, and degradation time.
Degradation
Time (Days)
Mg-2Ag
Recrystallized
Mg-2Ag sol.
Annealed
Mg-6Ag
Recrystallized
Mg-6Ag sol.
Annealed
011
11
22
34334
74566
Table 3. Grain size of wires determined by the linear intersect method.
AlloyRecrystallizedSolution Annealed
Mg-2Ag10 ± 1 μ m40 ± 5 μ m
Mg-6Ag11 ± 1 μ m61 ± 10 μ m
Publisher’s Note: MDPI stays neutral with regard to jurisdictional claims in published maps and institutional affiliations.

