Article

A New and Direct R-Value Measurement Method of Sheet Metal Based on Multi-Camera DIC System

1
Department of Mechanical Engineering, School of Engineering and Computer Science, Oakland University, Rochester, MI 48309, USA
2
College of Electrical and Information Engineering, Zhengzhou University of Light Industry, Zhengzhou 450002, China
*
Author to whom correspondence should be addressed.
Metals 2021, 11(9), 1401; https://doi.org/10.3390/met11091401
Submission received: 10 July 2021 / Revised: 28 August 2021 / Accepted: 2 September 2021 / Published: 4 September 2021
(This article belongs to the Special Issue Tube and Sheet Metal Forming Processes and Applications)

Abstract

:
More and more attention has been given in the field of mechanical engineering to a material’s R-value, a parameter that characterizes the ability of sheet metal to resist thickness strain. Conventional methods used to determine R-value are based on experiments and an assumption of constant volume. Because the thickness strain cannot be directly measured, the R-value is currently determined using experimentally measured strains in the width, and loading directions in combination with the constant volume assumption, to determine the thickness strain indirectly. This paper provides an alternative method for determining the R-value without any assumptions. This method is based on the use of a multi-camera DIC system to measure strains in three directions simultaneously. Two sets of stereo-vision DIC measurement systems, each comprised of two GigE cameras, are placed on the front and back sides of the sample. Use of the double-sided calibration strategy unifies the world coordinate system of the front and back DIC measurement systems to one coordinate system, allowing for the measurement of thickness strain and direct calculation of R-value. The Random Sample Consensus (RANSAC) algorithm is used to eliminate noise in the thickness strain data, resulting in a more accurate R-value measurement.

1. Introduction

The plastic strain ratio r is a parameter that indicates the ability of a sheet metal to resist thinning or thickening when subjected to either tensile or compressive forces in the plane of the sheet [1,2]. It has been used as an important parameter to evaluate the formability of automotive sheet metal. It is typically advantageous for the material to experience a minimal reduction in the area when subjected to a force; this means that it is a good drawing material with a high R-value. Therefore, an accurate measurement of R-value is of great significance to the study of the tensile and compressive properties of materials. Stickels [3] predicted the plastic-strain ratio of low-carbon steel sheets using the Young’s Modulus, while Ghosh [4] calculated the R-value of Al-Mg-Si alloy sheets based on crystal plasticity models. However, since the crystal structure of polycrystalline materials is often difficult to model accurately, the accuracy of the current theoretical estimates is not high [5,6]. Some scholars [7,8,9] employed laser-ultrasound resonance spectroscopy to measure the texture, thickness, and plastic strain ratio on-line. Although the laser-ultrasonic method has the advantages of being fast and non-destructive, the detection accuracy is greatly affected by the vibration of the tested strip and changes in the environment temperature. In some traditional R-value measurement methods [10,11], the thickness strain is calculated using length strain and width strain. The stated measurement methods are based on the assumption of constant volume, which states that the volume of the material will not change during the deformation process. However, some materials do not always follow the constant volume assumption, especially inside the necking band. This makes the exact determination of the R-value challenging [12]. Because of this, development of an experimental method for direct measurement of R-value becomes meaningful.
Digital Image Correlation (DIC), a non-contact measurement method, has achieved great success in the field of optical measurement and is still developing rapidly [13,14,15,16,17]. A first attempt to experimentally measure R-value using DIC was reported by Xie in 2017 [18]. Instead of observing the front surface of the sheet metal, this method observed the sheet metal at a 45-degree angle. As a result, both the front surface and the depth side of the sheet metal can be observed at the same time by two DIC cameras, and the three strains   ε 1 , ε 2 and ε 3 can be measured simultaneously. A shortcoming of this method is that the thickness strain can only be measured on the edge. Additionally, the edge needs to be cut, which will introduce a residual strain and ultimately affect the measurement results.
Thickness strain measurement at any point on the sheet metal surface using DIC was first reported by our lab at Oakland University together with Dantec-Dynamics GmbH, Germany [19]. This method was based on using multiple multi-camera DIC systems to measure strains in three directions simultaneously. Two sets of stereo vision DIC measurement systems, each consisting of two GigE cameras, were used in this method. One stereo vision DIC system was placed on the front side of the test sample, while the other system was placed on the back side of the sample. The use of the double-sided calibration strategy unified the world coordinate system of the front and back DIC measurement systems to one coordinate system, thus enabling the measurement of the thickness strain. This paper describes the use of this technology to measure the R-value directly without any assumptions. A tensile test of DP980 was conducted to directly measure the R-value. The theory of multi-camera DIC and the experimental setup will briefly be explained. Section 2 of this paper explains the DIC related theories, the two-sided calibration strategy, and the algorithms to smooth the thickness strain, while Section 3 presents the experimental setup and experimental process. The two R-value calculation methods will be presented, as well as the experimental results of DP980 and a comparison between the R-value determined through experimental results determined using the constant volume assumption. The potential and limitation of the method, as well as conclusions, will be discussed and presented in Section 4.

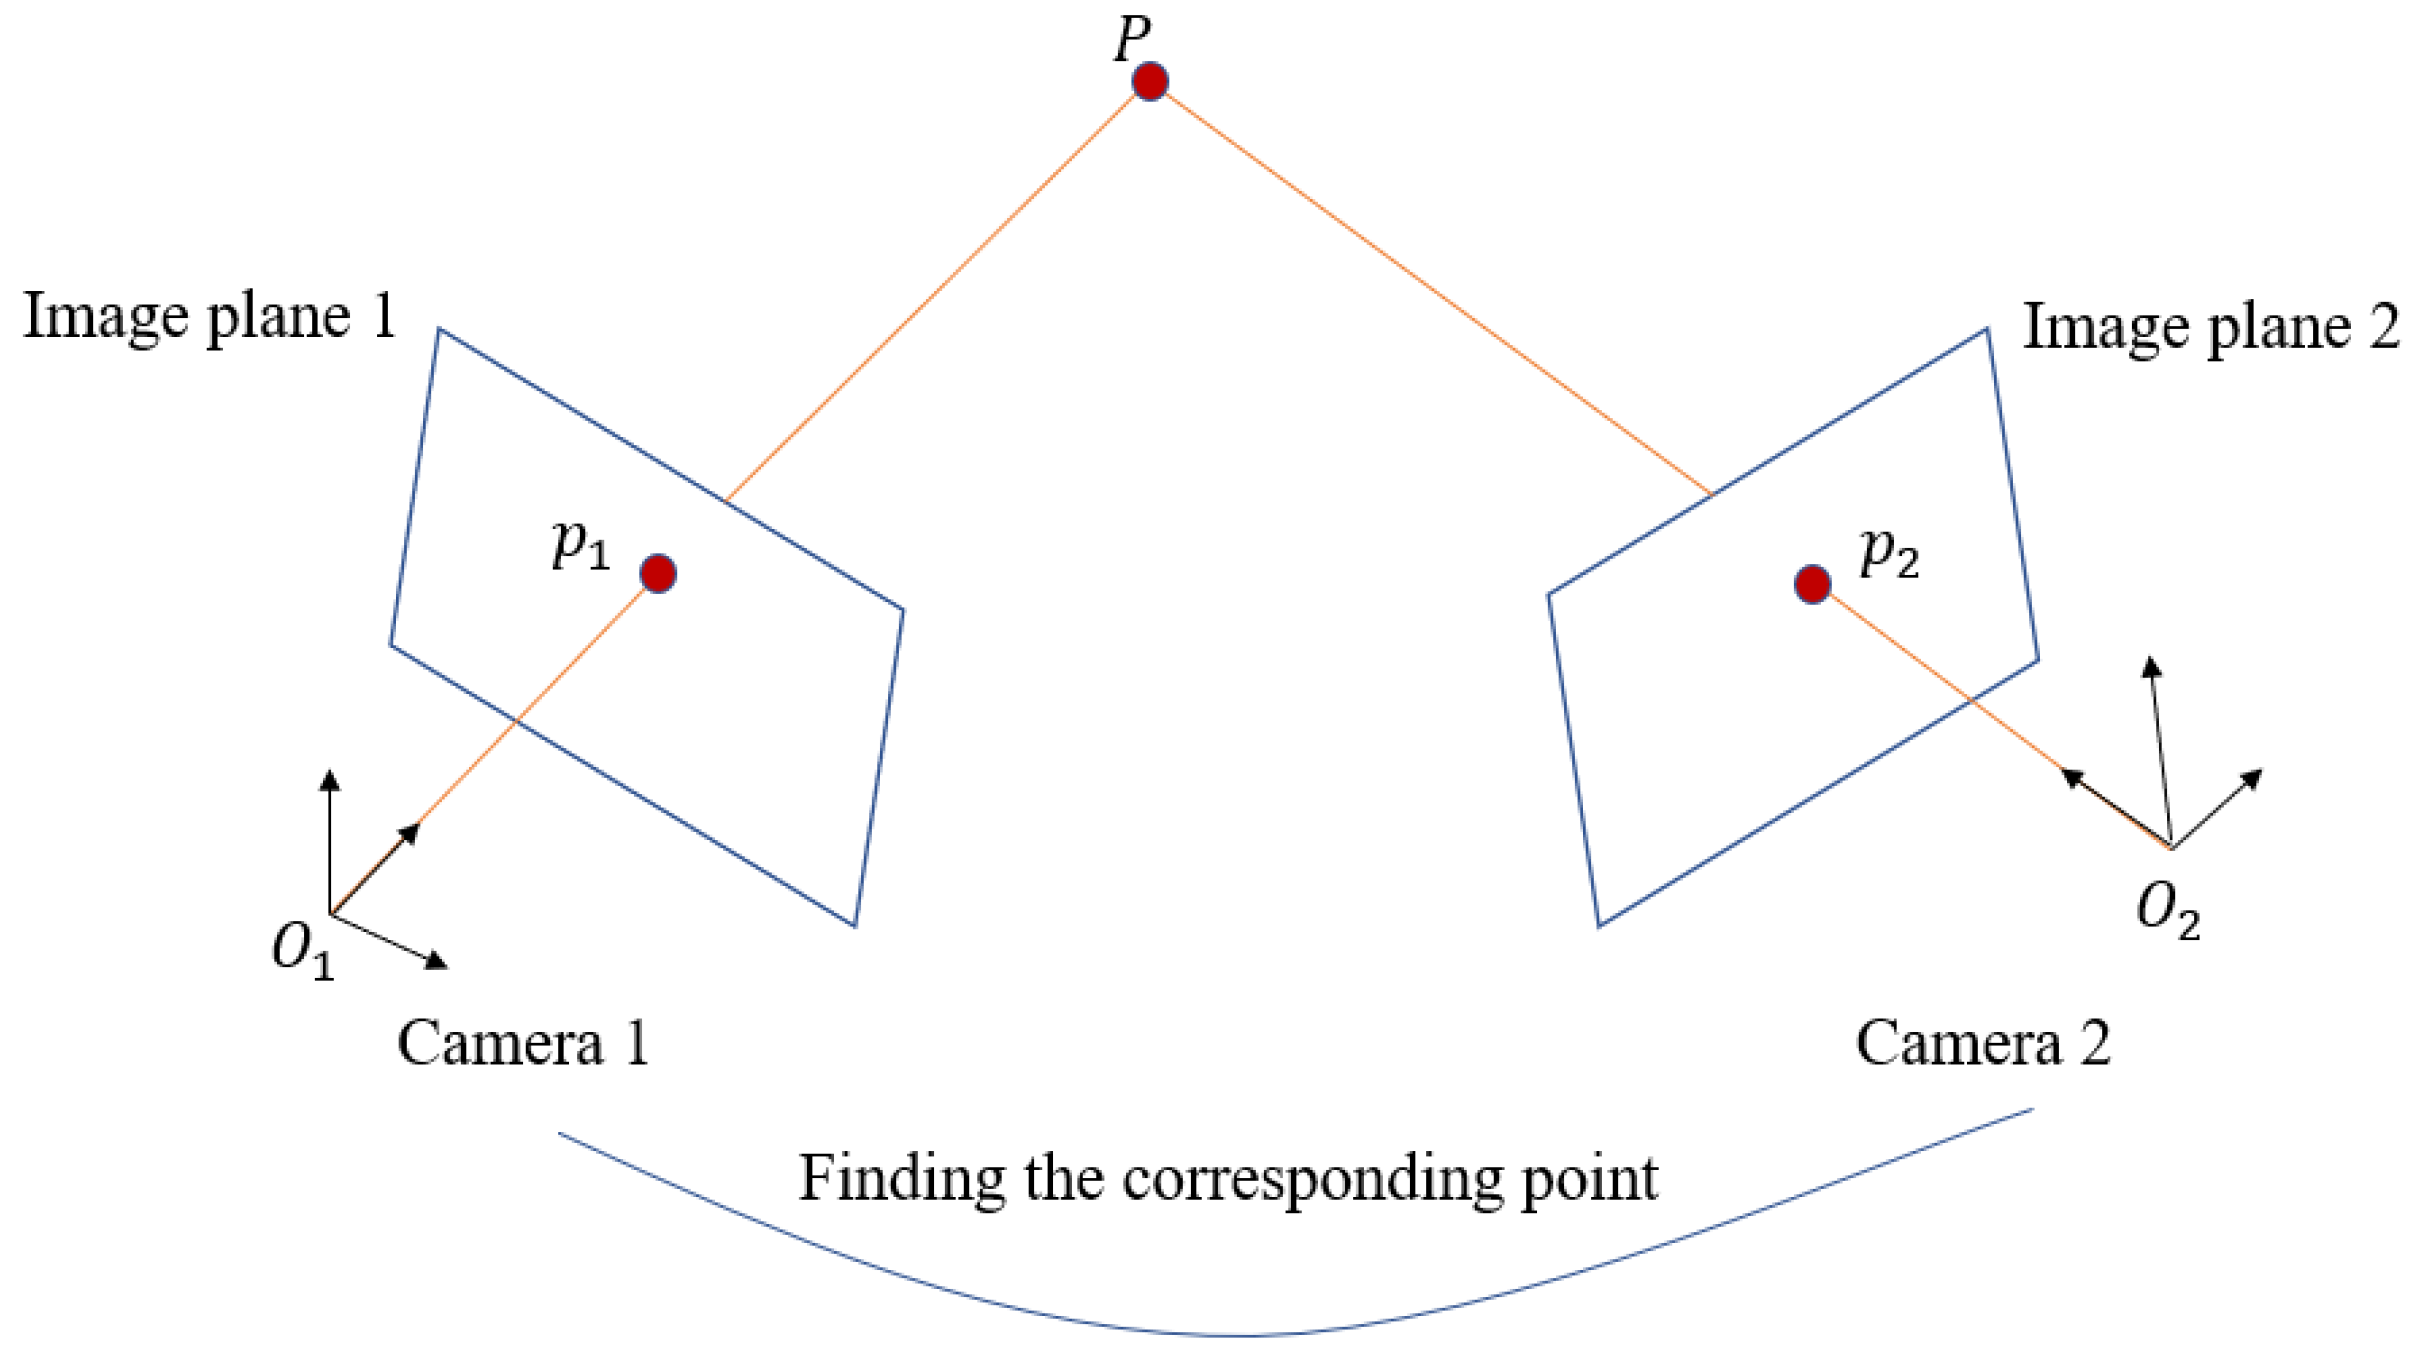
2. Fundamental of DIC
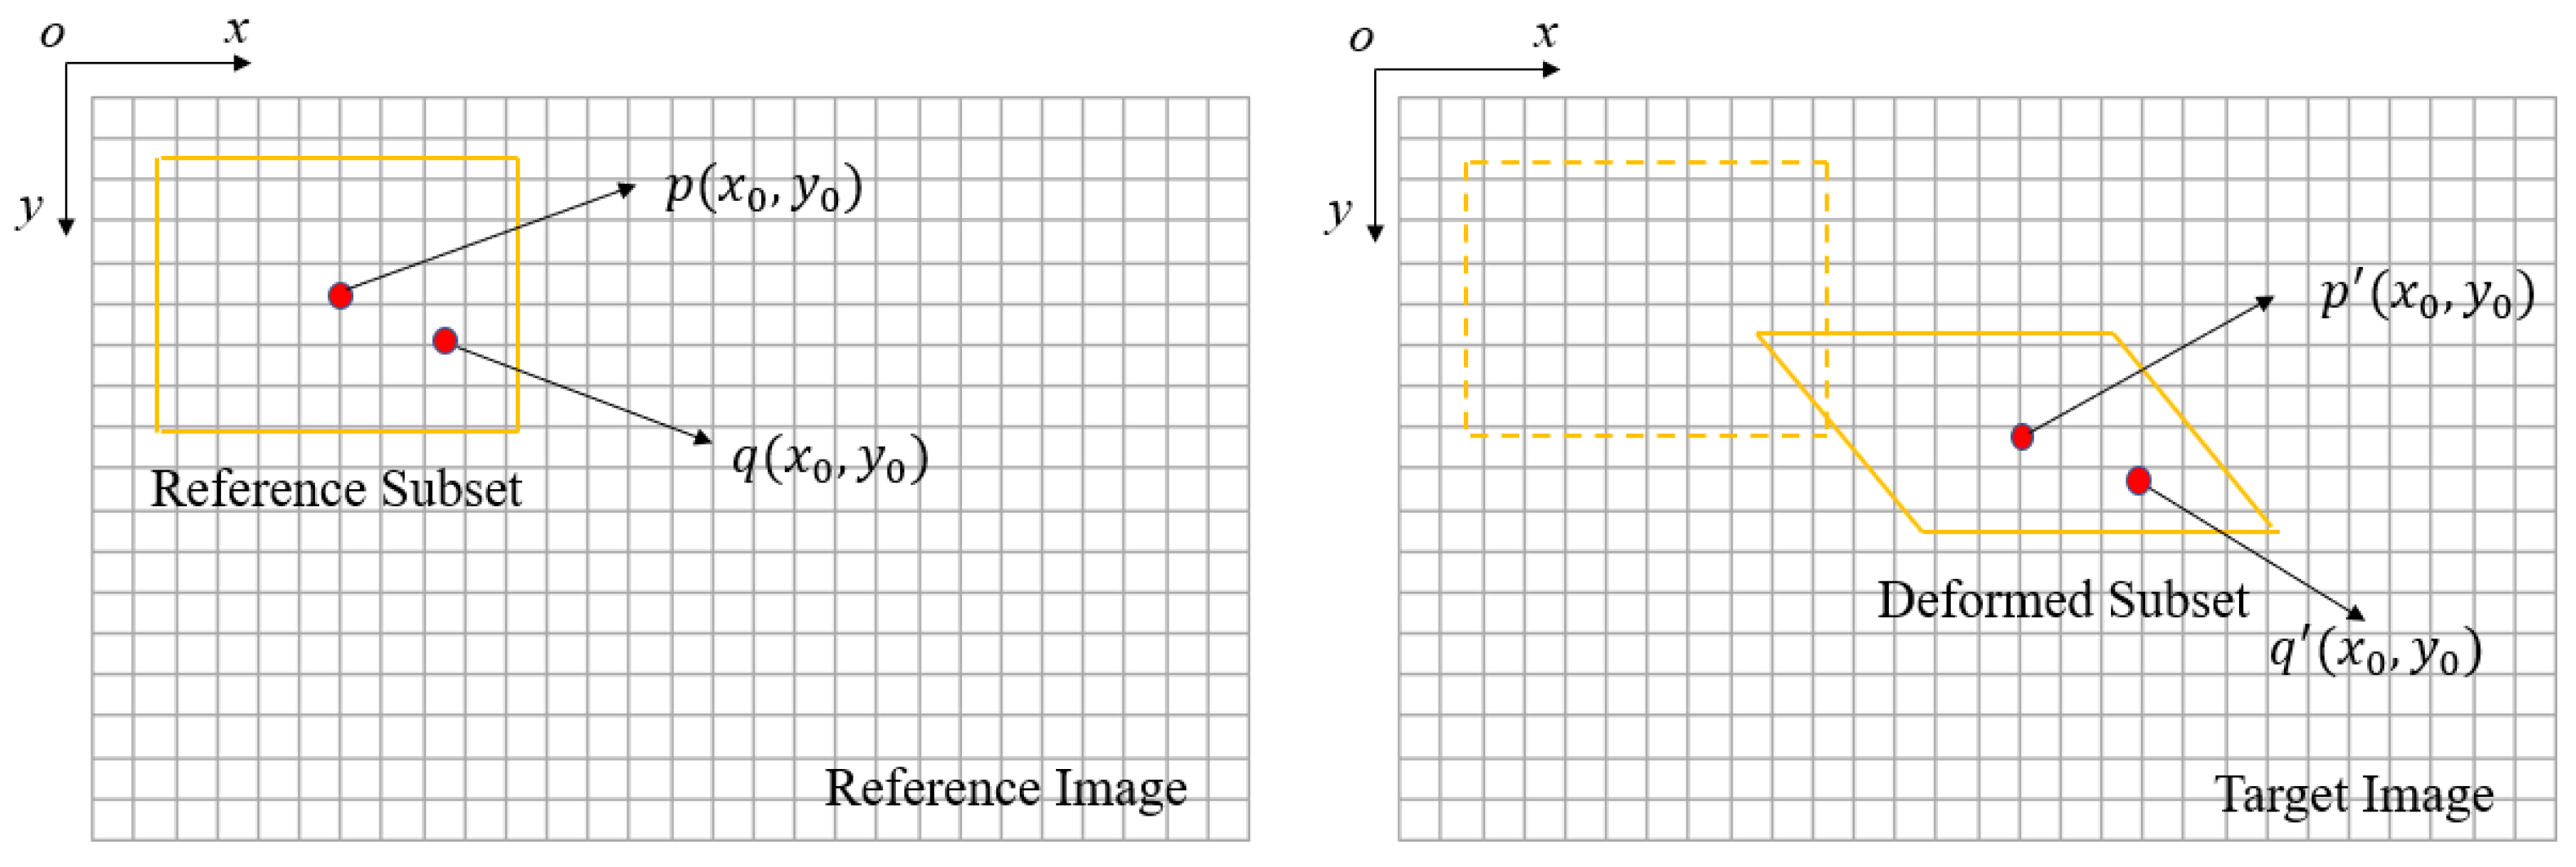
2.1. Basic Theory

The stereo vision system shown in Figure 1, or a two-camera system with different perspectives, plays an important role in the DIC measurement system. A space point p is recorded simultaneously by two cameras on the image plane with a different perspective. The points p1 and p2 on the image plane of the two cameras are then matched using the DIC matching algorithm, and the 3D coordinates of point p can be recovered based on the geometry of the stereo-vision system.
The core idea of the DIC method is to measure displacement and strain information on an object’s surface by matching and tracking feature points in the natural texture or artificial speckle pattern before and after deformation. The DIC matching process obtains the coordinate on the target image after deformation corresponding to a known coordinate position on the reference image taken before deformation. It is usually necessary to divide the image into multiple grids, or subsets, and the deformation of the subset is used to represent the deformation of the local area of the object. Figure 2 shows this principle. On the reference image, a rectangle with a size of (2M + 1) pixel × (2M + 1) pixel and point p ( x 0 , y 0 ) at the center is taken as the reference subset. A correlation function is then used to find a subset on the target image with a similar distribution to that of the reference subset. The subset with the largest correlation coefficient is considered the deformed subset. The sum squared difference correlation criterion (SSD) is commonly used to evaluate the similarity between subsets [20]. Assuming that the intensity distribution of the two facets is represented as F ( x , y ) and   G ( x , y ) , the SSD function has the following form:
C S S D =   F ( x , y ) × G ( x , y )

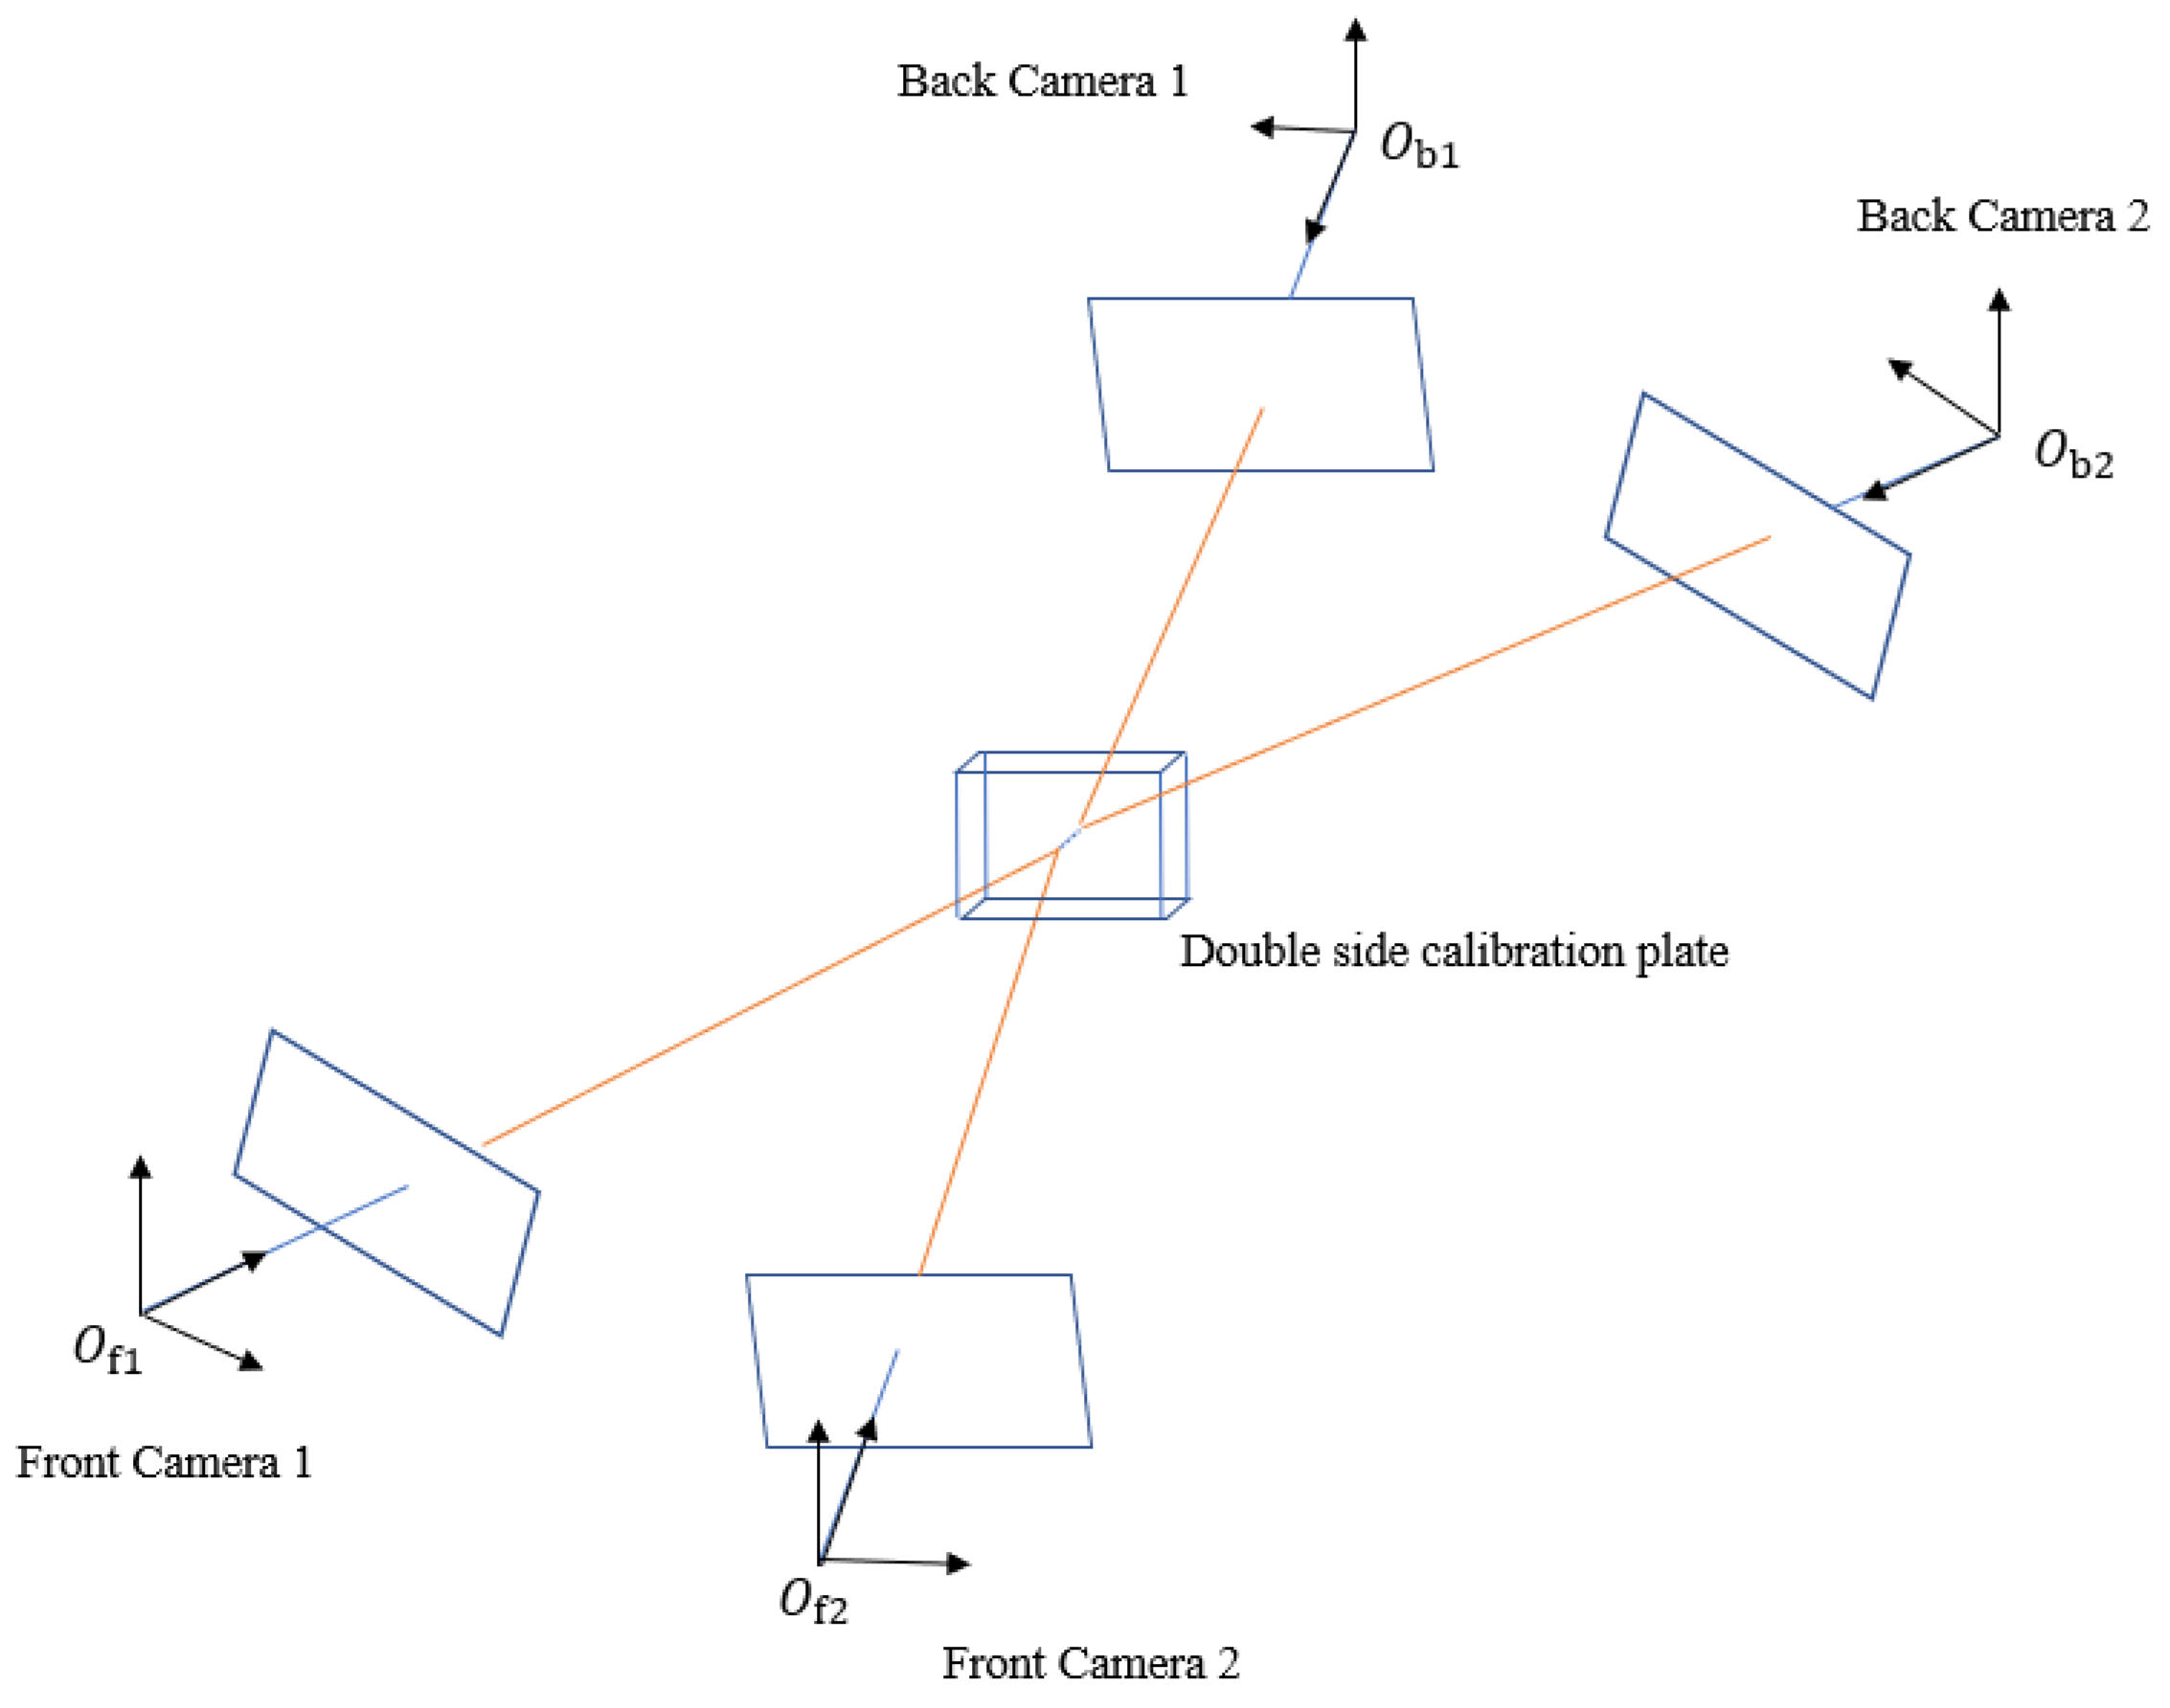
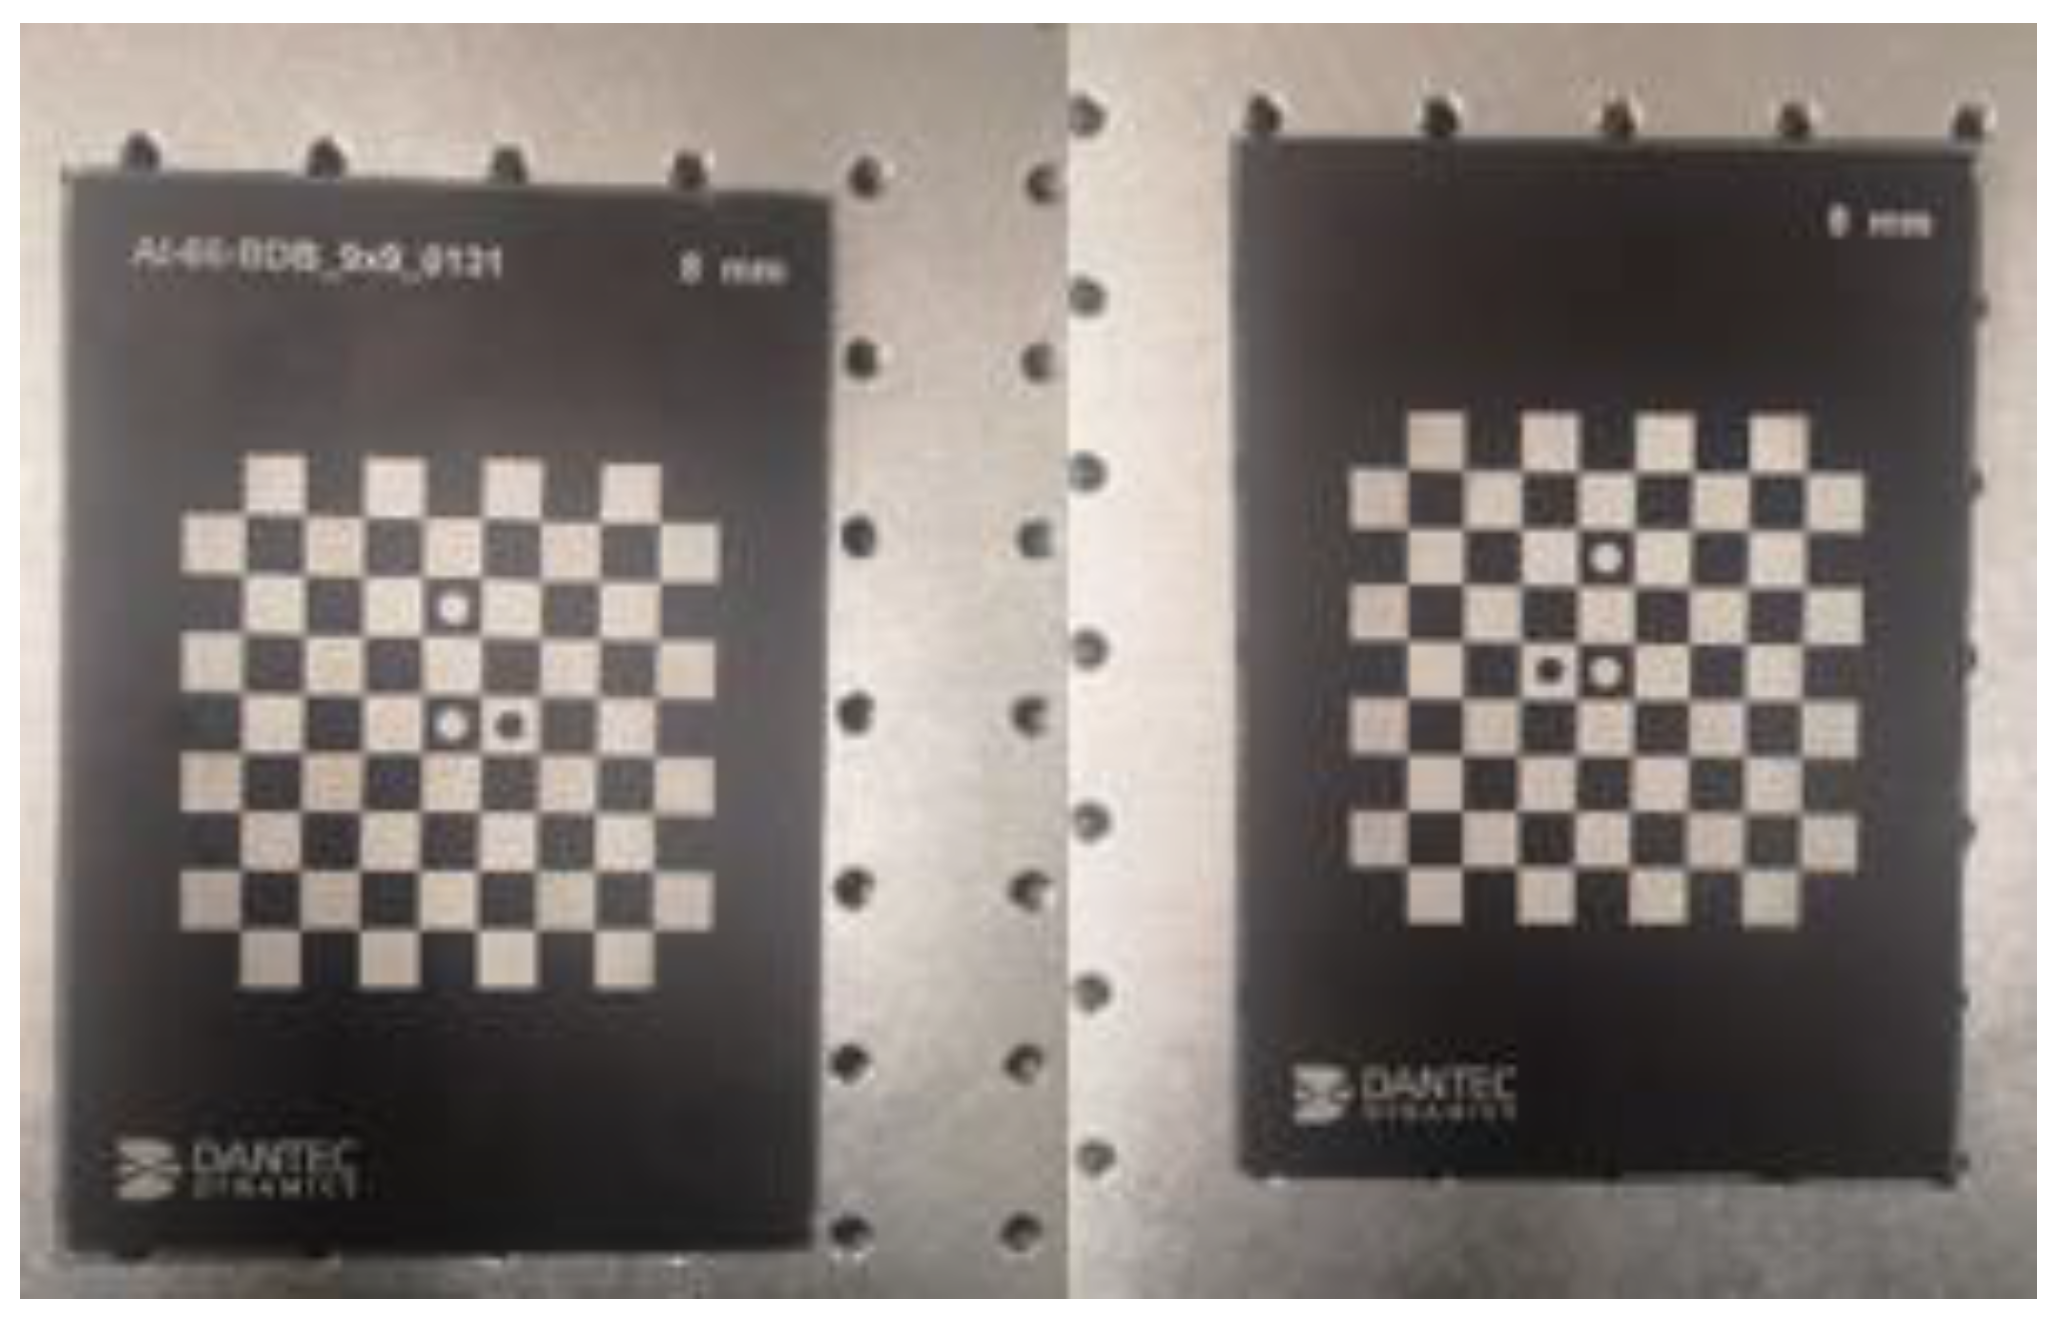
2.2. Double-Sided Calibration

Camera calibration plays an important role in DIC measurement, as its quality directly affects measurement accuracy. The principle of camera calibration is to establish the relationship between the position of the camera image pixel and the scene point position. According to the camera imaging model, the relationship between the image coordinate system and the world coordinate system is as follows [21]:
s m = A   [ r   t ]   M
where m ¯ = [ u , v , 1 ] T is the image homogeneous coordinate system, M ¯ = [ X , Y , Z , 1 ] T is the world homogeneous coordinate system,   s is the scale factor, A is the camera internal parameter matrix, and [ r   t ] is the camera external parameter matrix. Both the internal and external parameters of the camera can be calculated by Zhang’s calibration method [21].
The double-sided calibration strategy uses a double-sided calibration plate to calibrate the front and back dual-camera DIC systems simultaneously. The schematic of the double-sided calibration strategy is shown in Figure 3. Figure 3 shows two typical two-camera stereo vision subsystems, and these two subsystems are linked through calibration. Figure 4 shows the design of the calibration plate. The role of this calibration is to connect these two subsystems into one single global system. The world coordinate system of the front camera is taken as the reference global coordinate, and the back camera coordinate system is transformed to the reference global system. This transformation can be expressed as follows:
M = m w o r l d f r o n t = m w o r l d b a c k · T ω      T ω = [ 1 0 0 0 0 1 0 0 0 0 1 d 0 0 0 1 ]
In this equation, d is the thickness of the double-sided calibration plate.

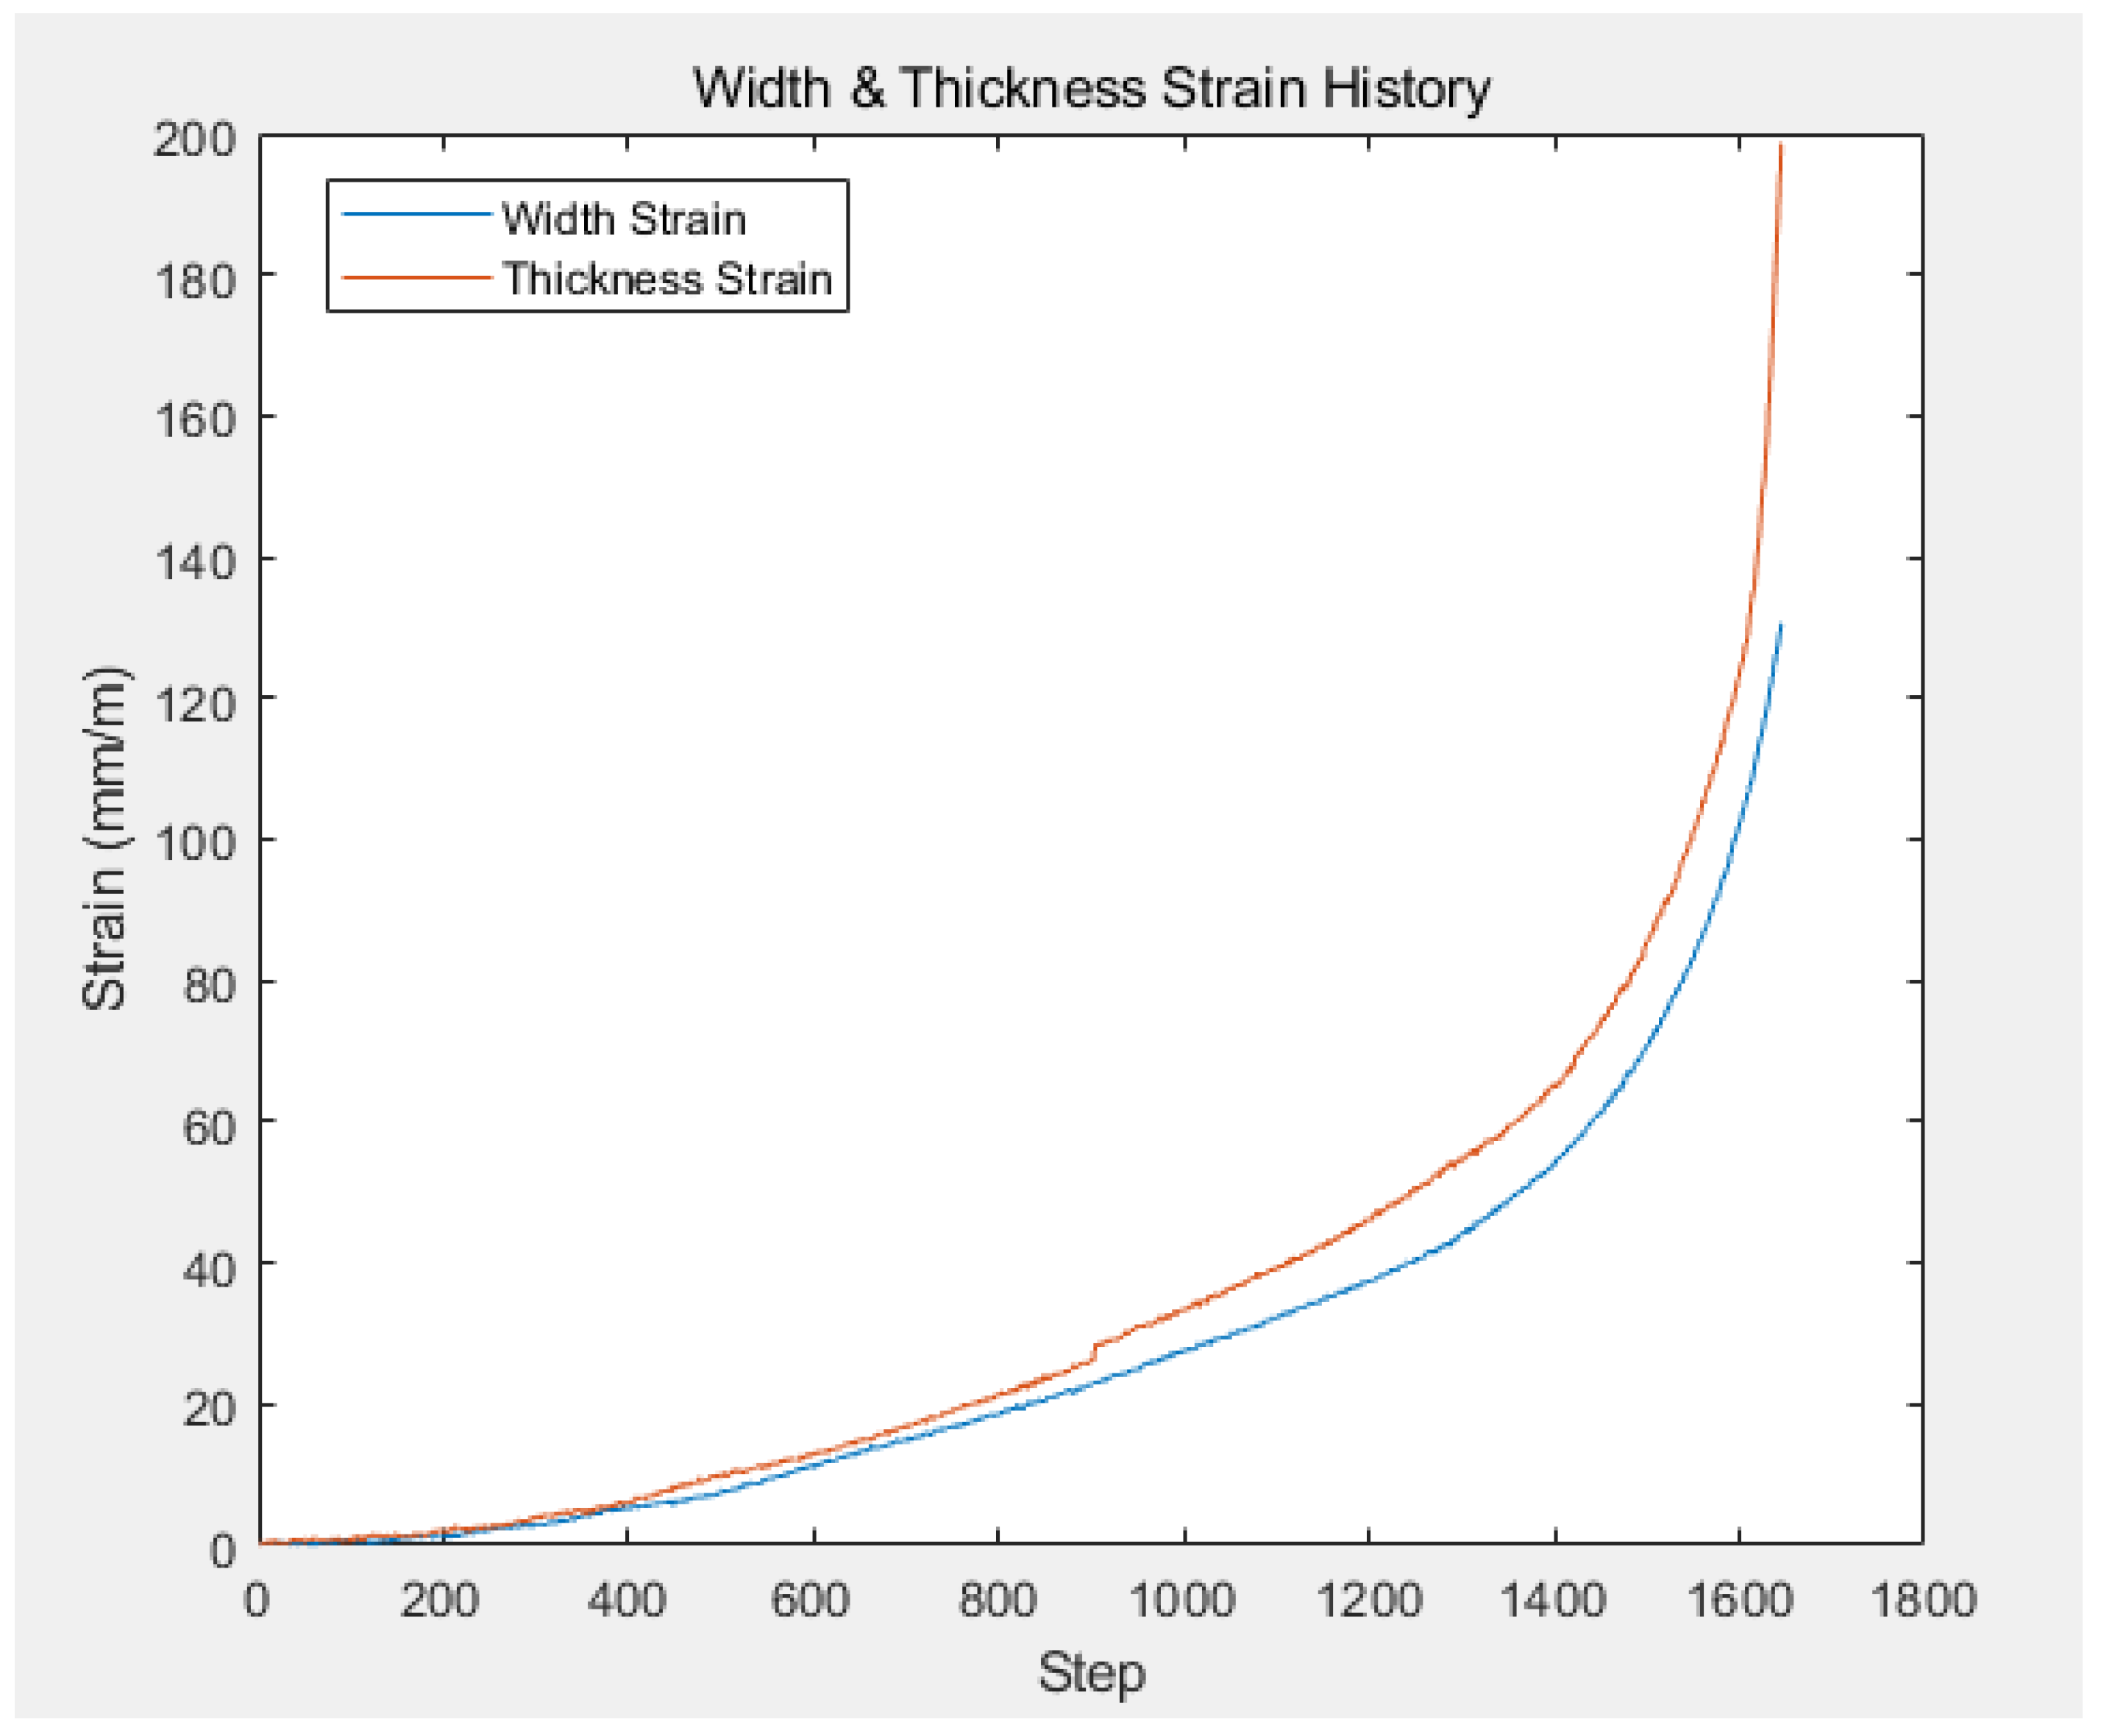
2.3. Optimized Thickness Strain Measurement

The measurement of the thickness strain is the core part of calculating the R-value. Li built a dual-camera DIC system on the front and back of the test piece to realize the non-destructive measurement of a sample’s thickness strain [19]. However, as Li wrote in [19], the strain measurement results contain noise, so it is necessary to remove the noise from the strain data. Since the thickness of the test sample is usually a few millimeters, the noise is amplified during the thickness strain measurement. Figure 5 shows the DP980 thickness strain history, where the x-axis represents the number of photos taken and the yellow circle indicates the noise data. Two smoothing algorithms, namely the Least squares algorithm and Random sample consensus (RANSAC) algorithm, were used to fit the curve and reduce noise. A comparison of the results using these two algorithms follows.

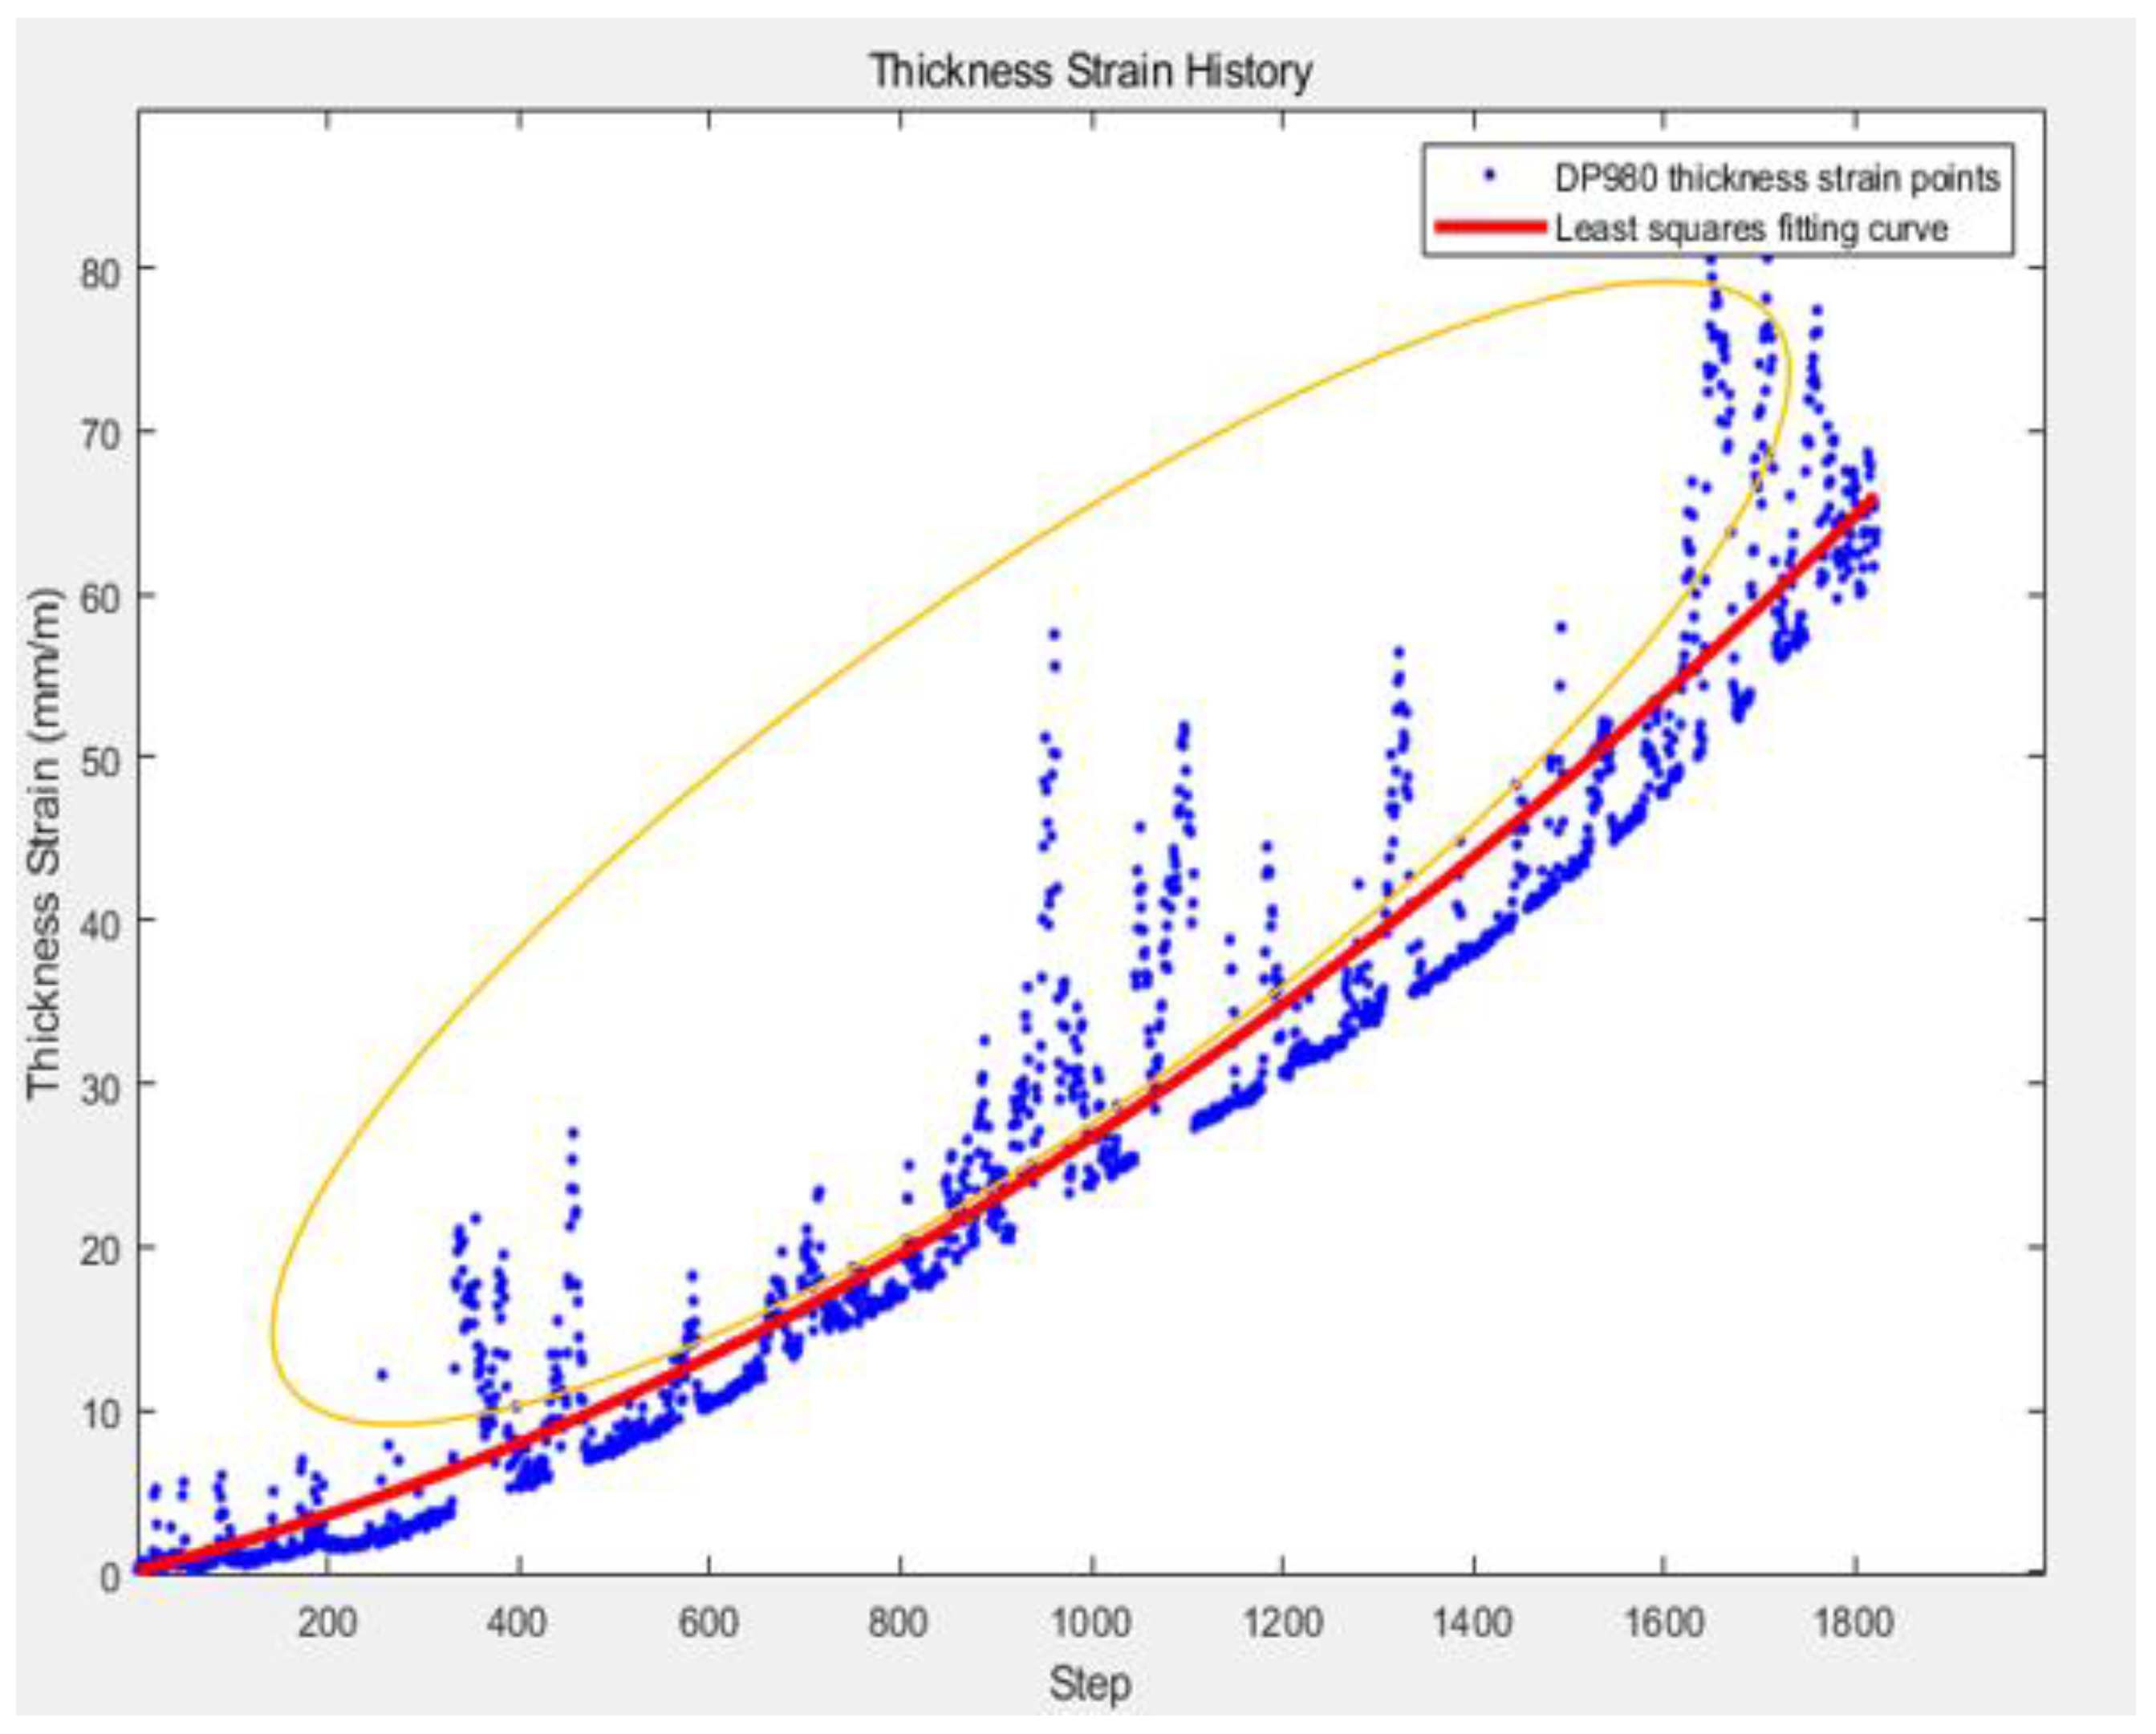
2.3.1. Least Squares Algorithm

The least squares method is the most common method used to solve curve fitting problems. The basic idea of the method is to minimize the sum of squares of the error to find the best function match for the data. In general, we can model the expected value of y as an nth degree polynomial, yielding the general polynomial regression model:
y = f ( x , α ) = α 0 + α 1 x + α 2 x 2 + α 3 x 3 + α n x n
where α = [ α 1 , α 2 , , α n ] is a parameter to be determined.
The objective function   L ( y , f ( x , α ) ) is minimized to find the optimal estimated value of the parameter α in the function f ( x , α ) for m given sets of data   ( x i , y i )   ( i = 1 , 2 , , m ) .
L ( y , f ( x , α ) ) = i = 1 m [ y i f ( x i , y i ) ] 2
The result using least squares fitting is shown in Figure 5 as a red curve. The red curve represents the results of quadratic polynomial fitting. Observation of Figure 5 indicates that the fitted curve shifts relative to the expected data. Because of this, the algorithm’s fitting results become inaccurate if the data contains a large amount of error or noise. This is the limitation of the least squares algorithm.

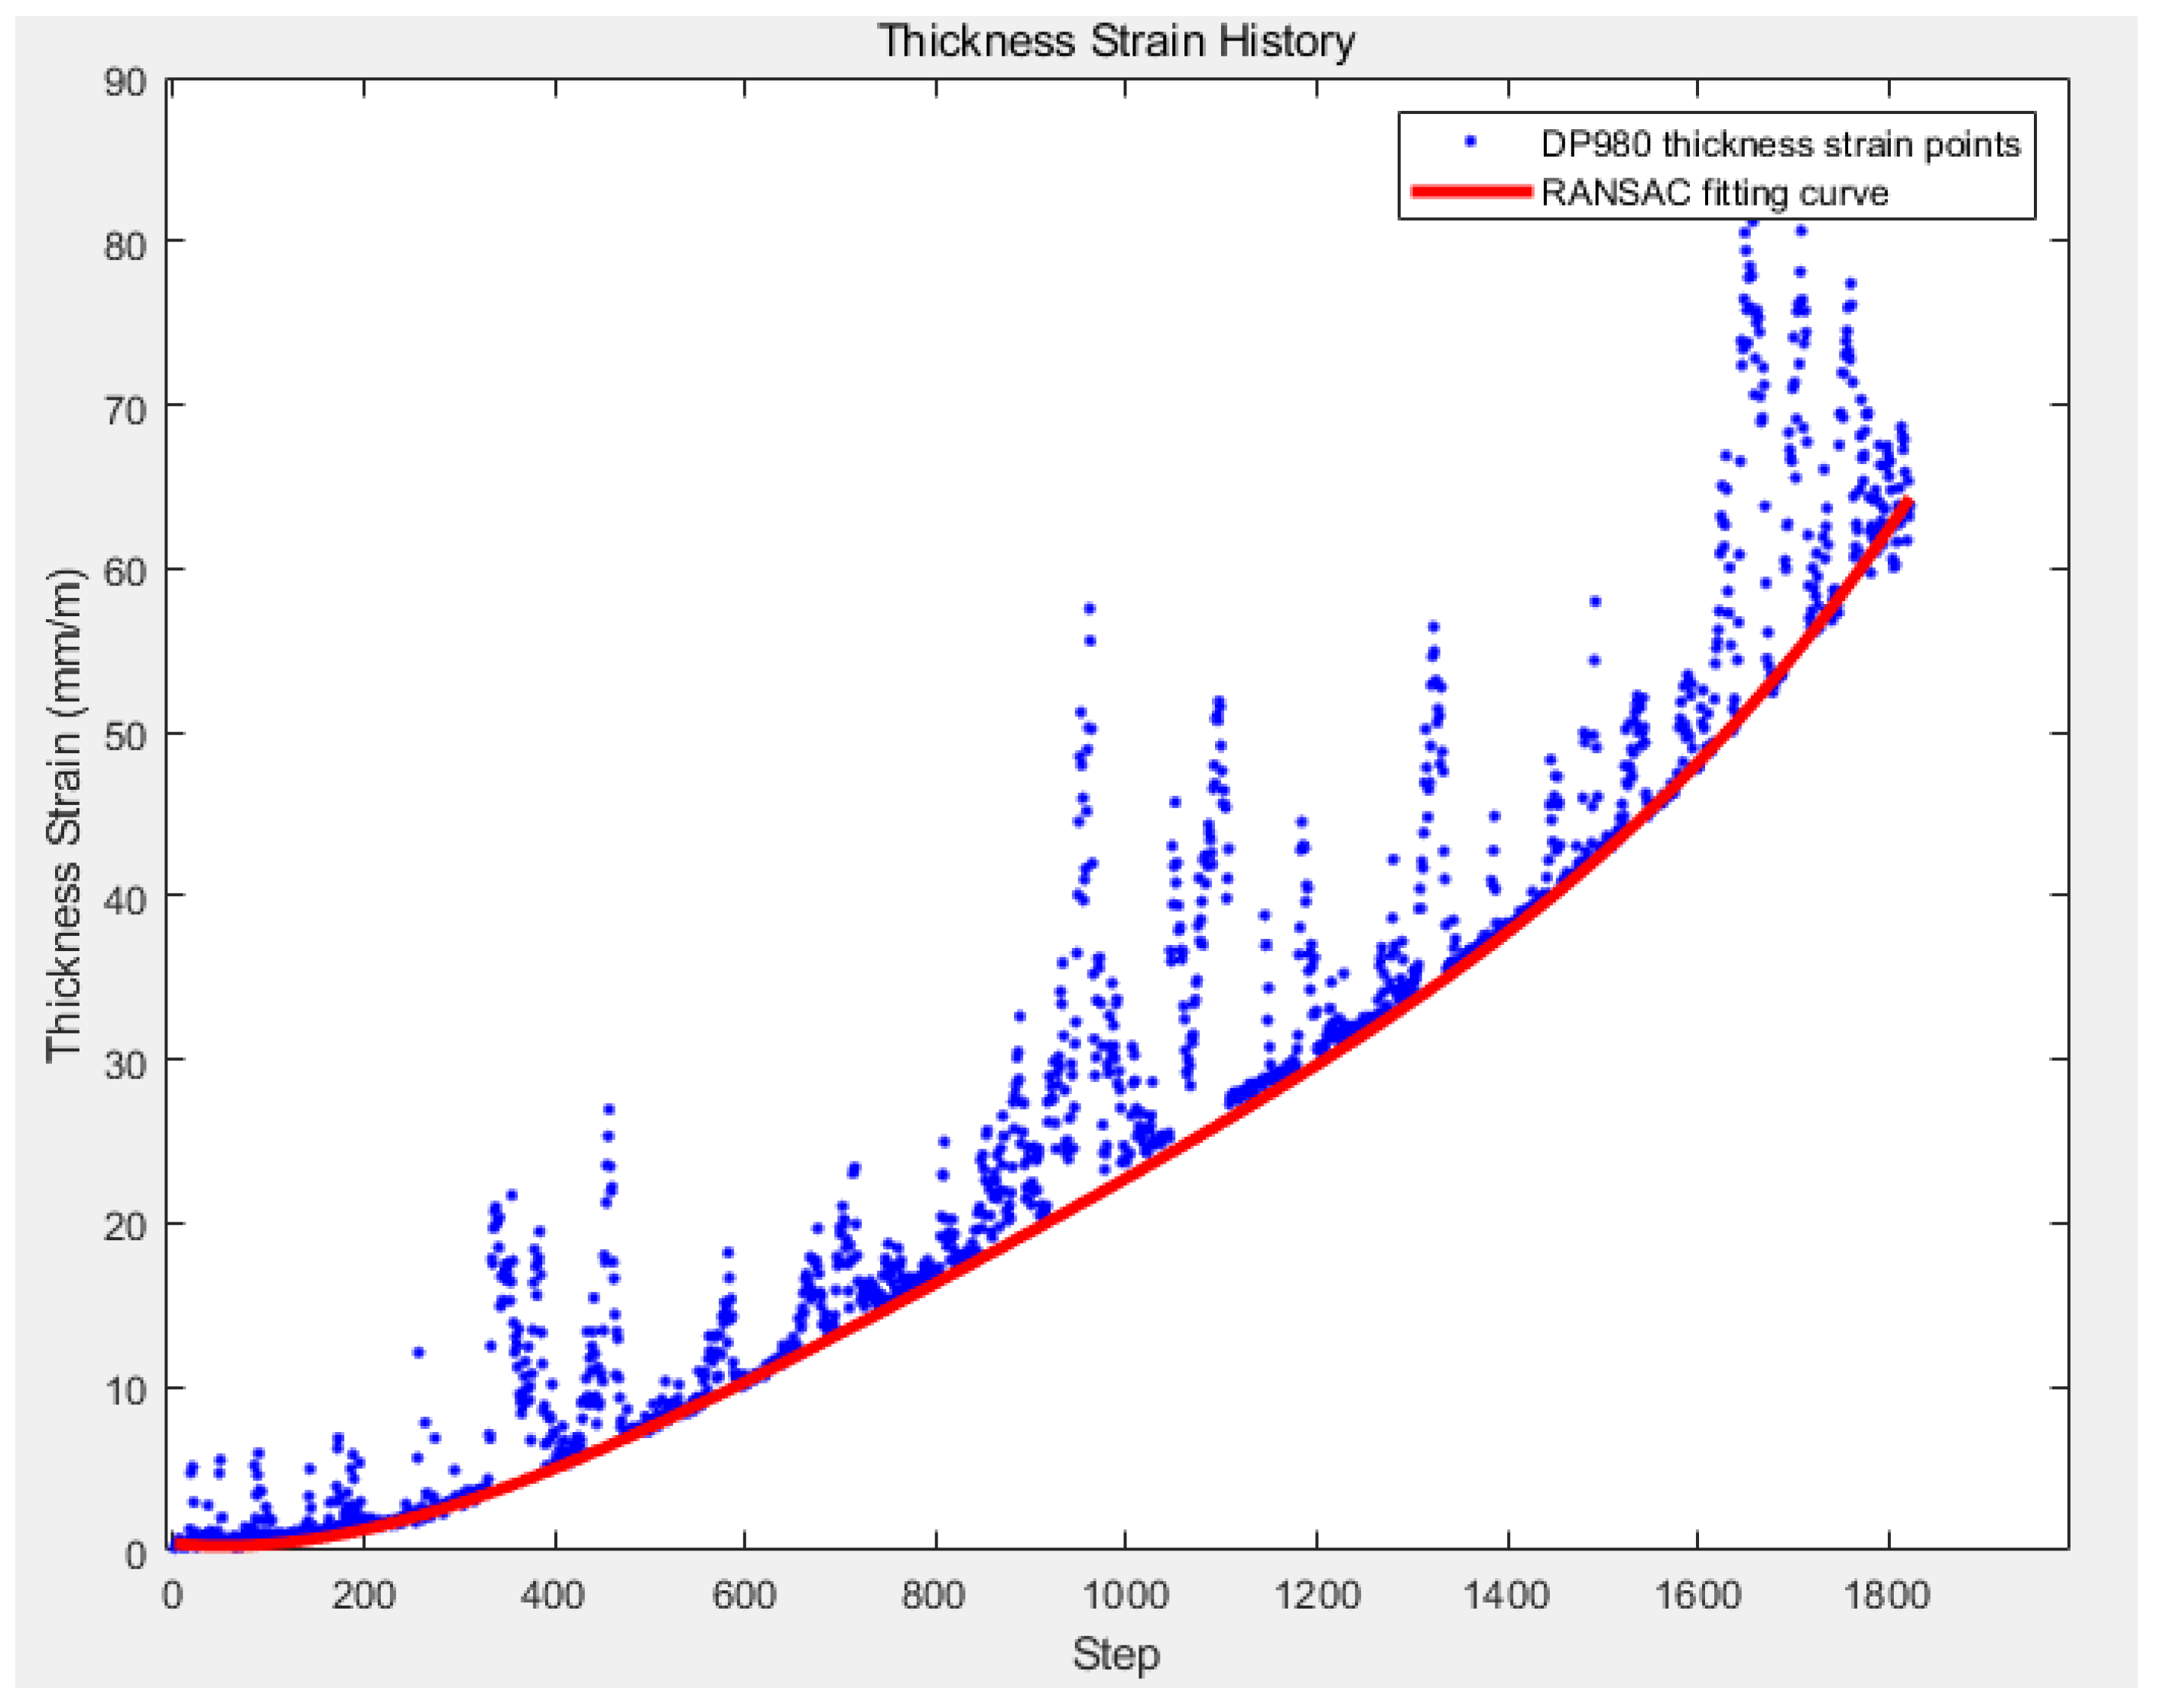
2.3.2. Random Sample Consensus (RANSAC) Algorithm

The RANSAC algorithm based on the iterative method was proposed by Fischler [22] to solve the problem of inaccurate solutions when using the least squares model on sample data with a large proportion of outliers. Song used the improved RANSAC algorithm to eliminate errors caused by high-temperature heat wave disturbances in DIC measurement [23]. This algorithm is able to classify data points as outliers or inliers and fit the mathematical model through inliers while ignoring outliers. The basic algorithm is summarized as follows:
  • Randomly select several points in the thickness-strain data to calculate the polynomial thickness-strain history model.
  • Set a preset tolerance value ε and calculate the number of data points that match the mathematical model in Step 1.
  • If the proportion of data points that meet the mathematical model in Step 2 exceeds the preset threshold τ, recalculate the thickness-strain history model to use these inliers and terminate the algorithm.
  • Otherwise, repeat Steps 1 to 3 K times.
The number of iterations K should be large enough to ensure that the probability p of at least one set of random samples not including outliers is greater than 0.99. Assuming that the probability that the data is selected as an inlier is a, then b = 1 − a is the probability of observing an outlier. The required number of iterations of the minimum number of points, denoted k, is calculated using the following function:
1 p = ( 1 a k ) K
K = log ( 1 p ) log ( 1 ( 1 b ) k )
Figure 6 shows that the RANSAC algorithm classifies the thickness strain data into inlier points and outlier points. The blue point set represent the inlier points, and the red circles represent the outlier point set. Using this method, the outlier points, or noisy data, can be ignored during fitting. The result of the RANSAC algorithm fitting is shown in Figure 7. It can be seen that the red fitting curve is fitted with inlier points as the data set. Compared with the least squares algorithm, it is hardly affected by noise in the data. This indicates that the RANSAC algorithm is effective and has important significance for the subsequent R-value calculation.

3. DP980 R-Value Determination

In this section, the R-value calculation method is reviewed first, followed by a discussion of the experimental setup and process. The composite material DP980 was used as the experimental sample. Finally, the experimental results are analyzed and discussed.

3.1. R-Value Calculation

The equation to calculate R-value is shown as Equation (8).
R = ε 2 ε 3  
where ε 2 , ε 3 represent the true width strain and true thickness strain, respectively.
For sheet metals, the R-value is usually determined from three different directions of in-plane loading (0°, 45°, 90° in the rolling direction) and the normal R-value is calculated using the following equation:
R = 1 4 ( R 0 + 2 R 45 + R 90 )

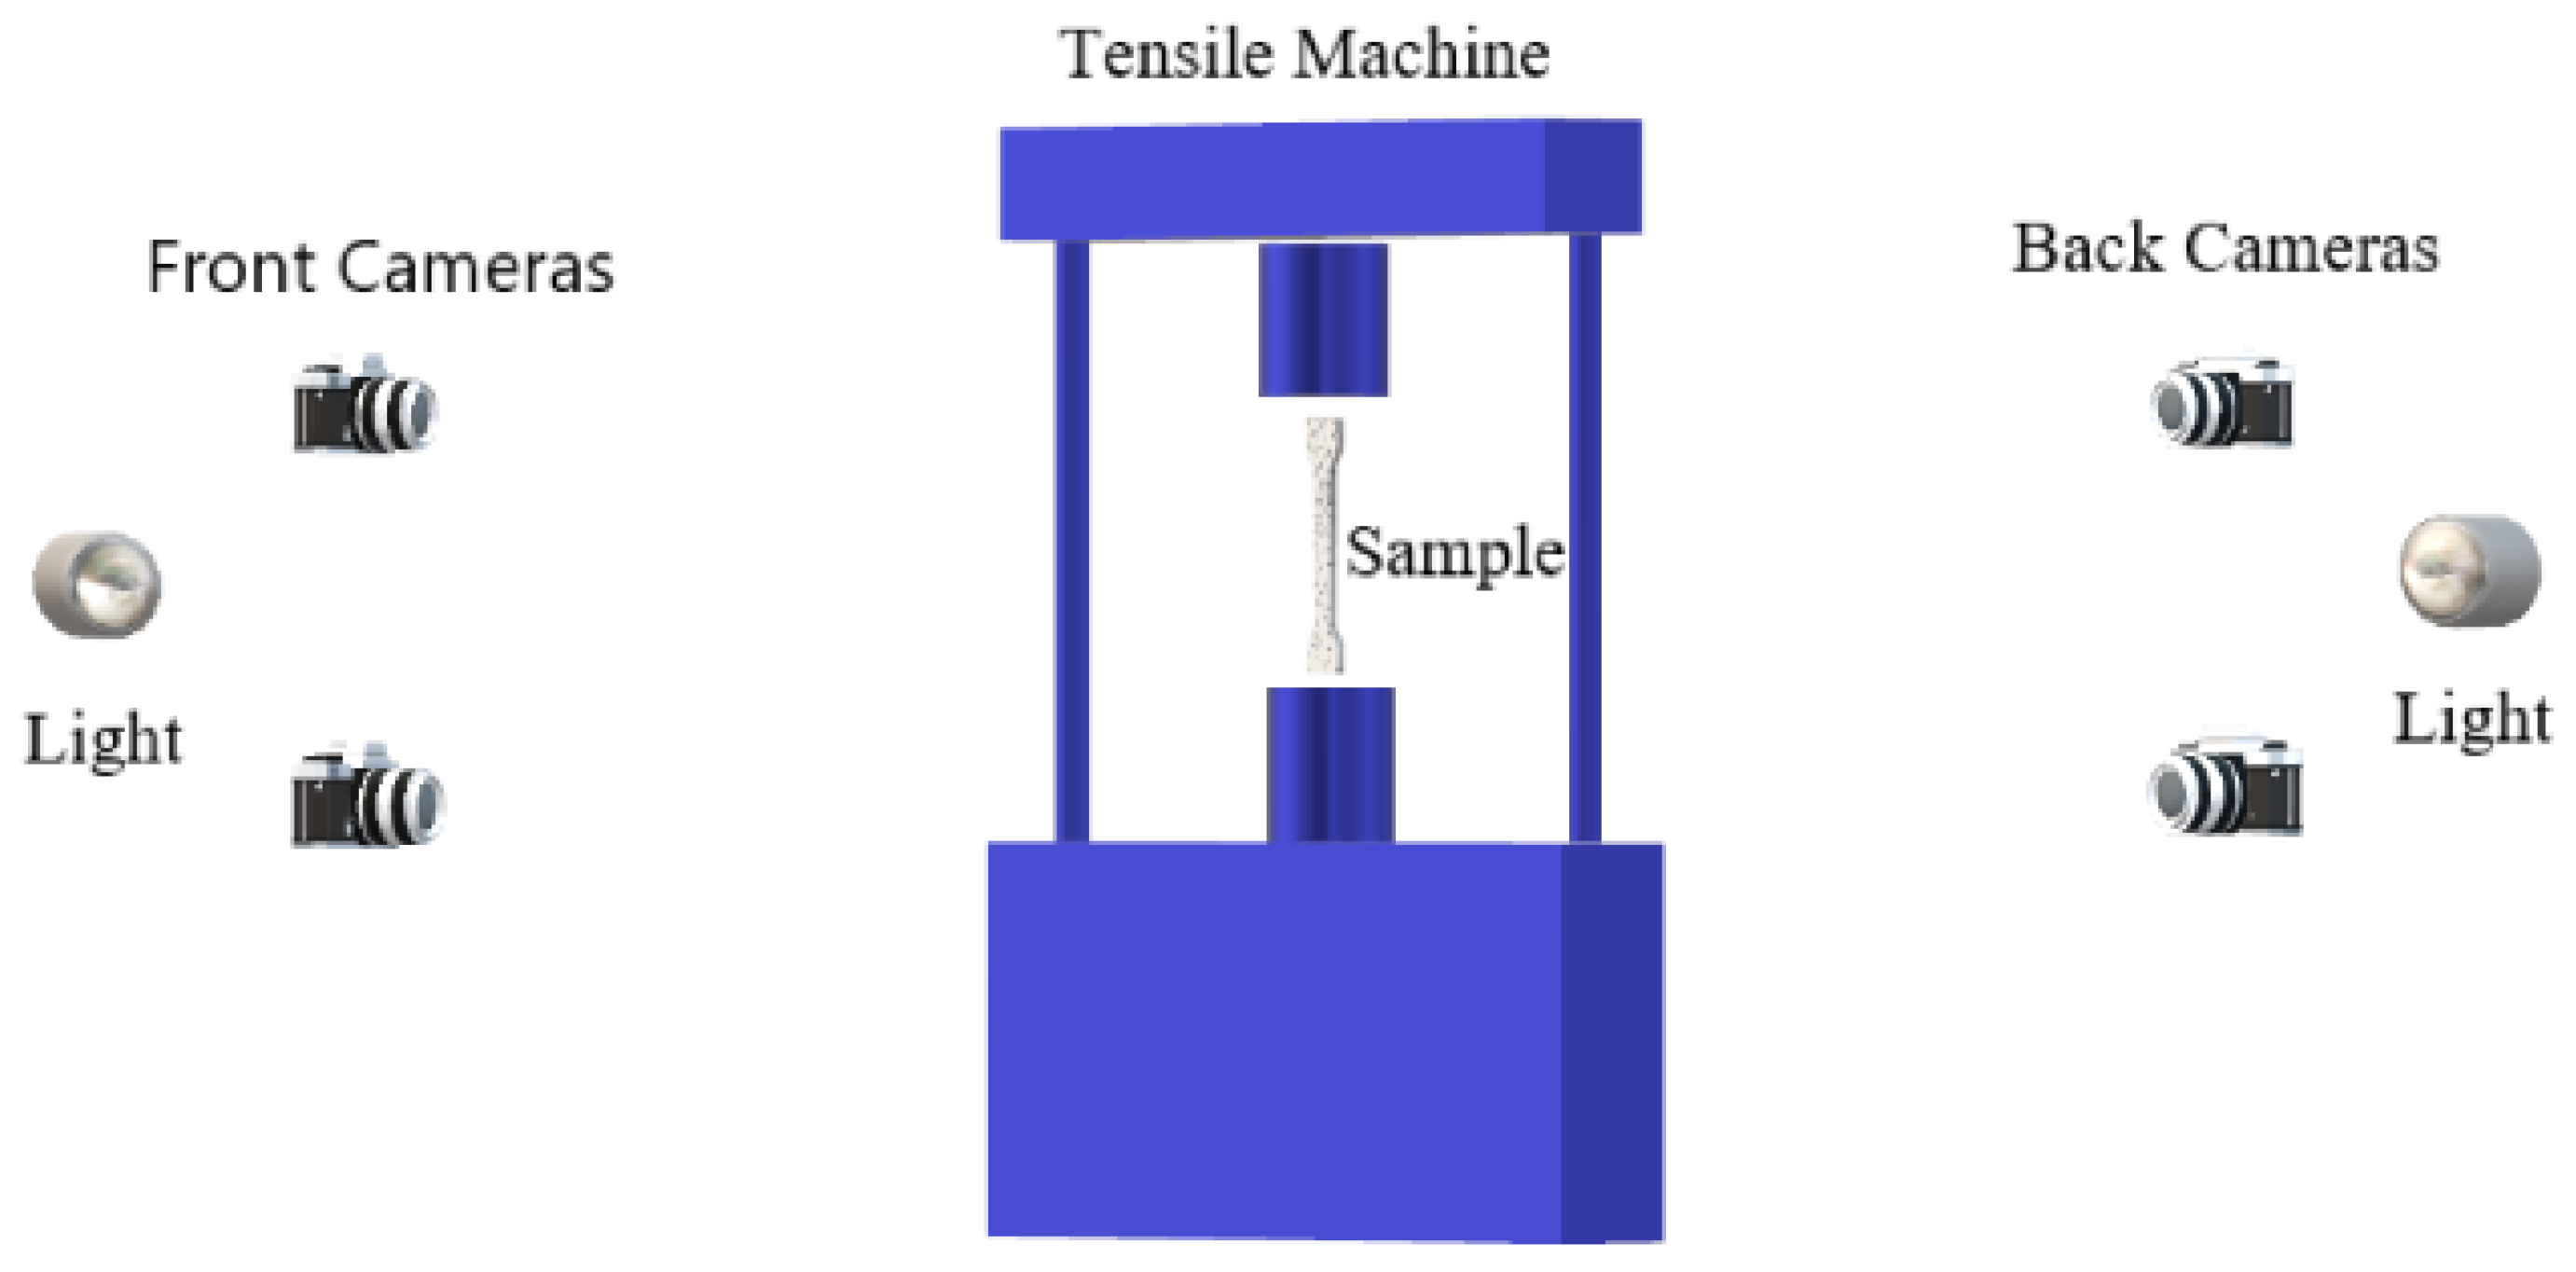
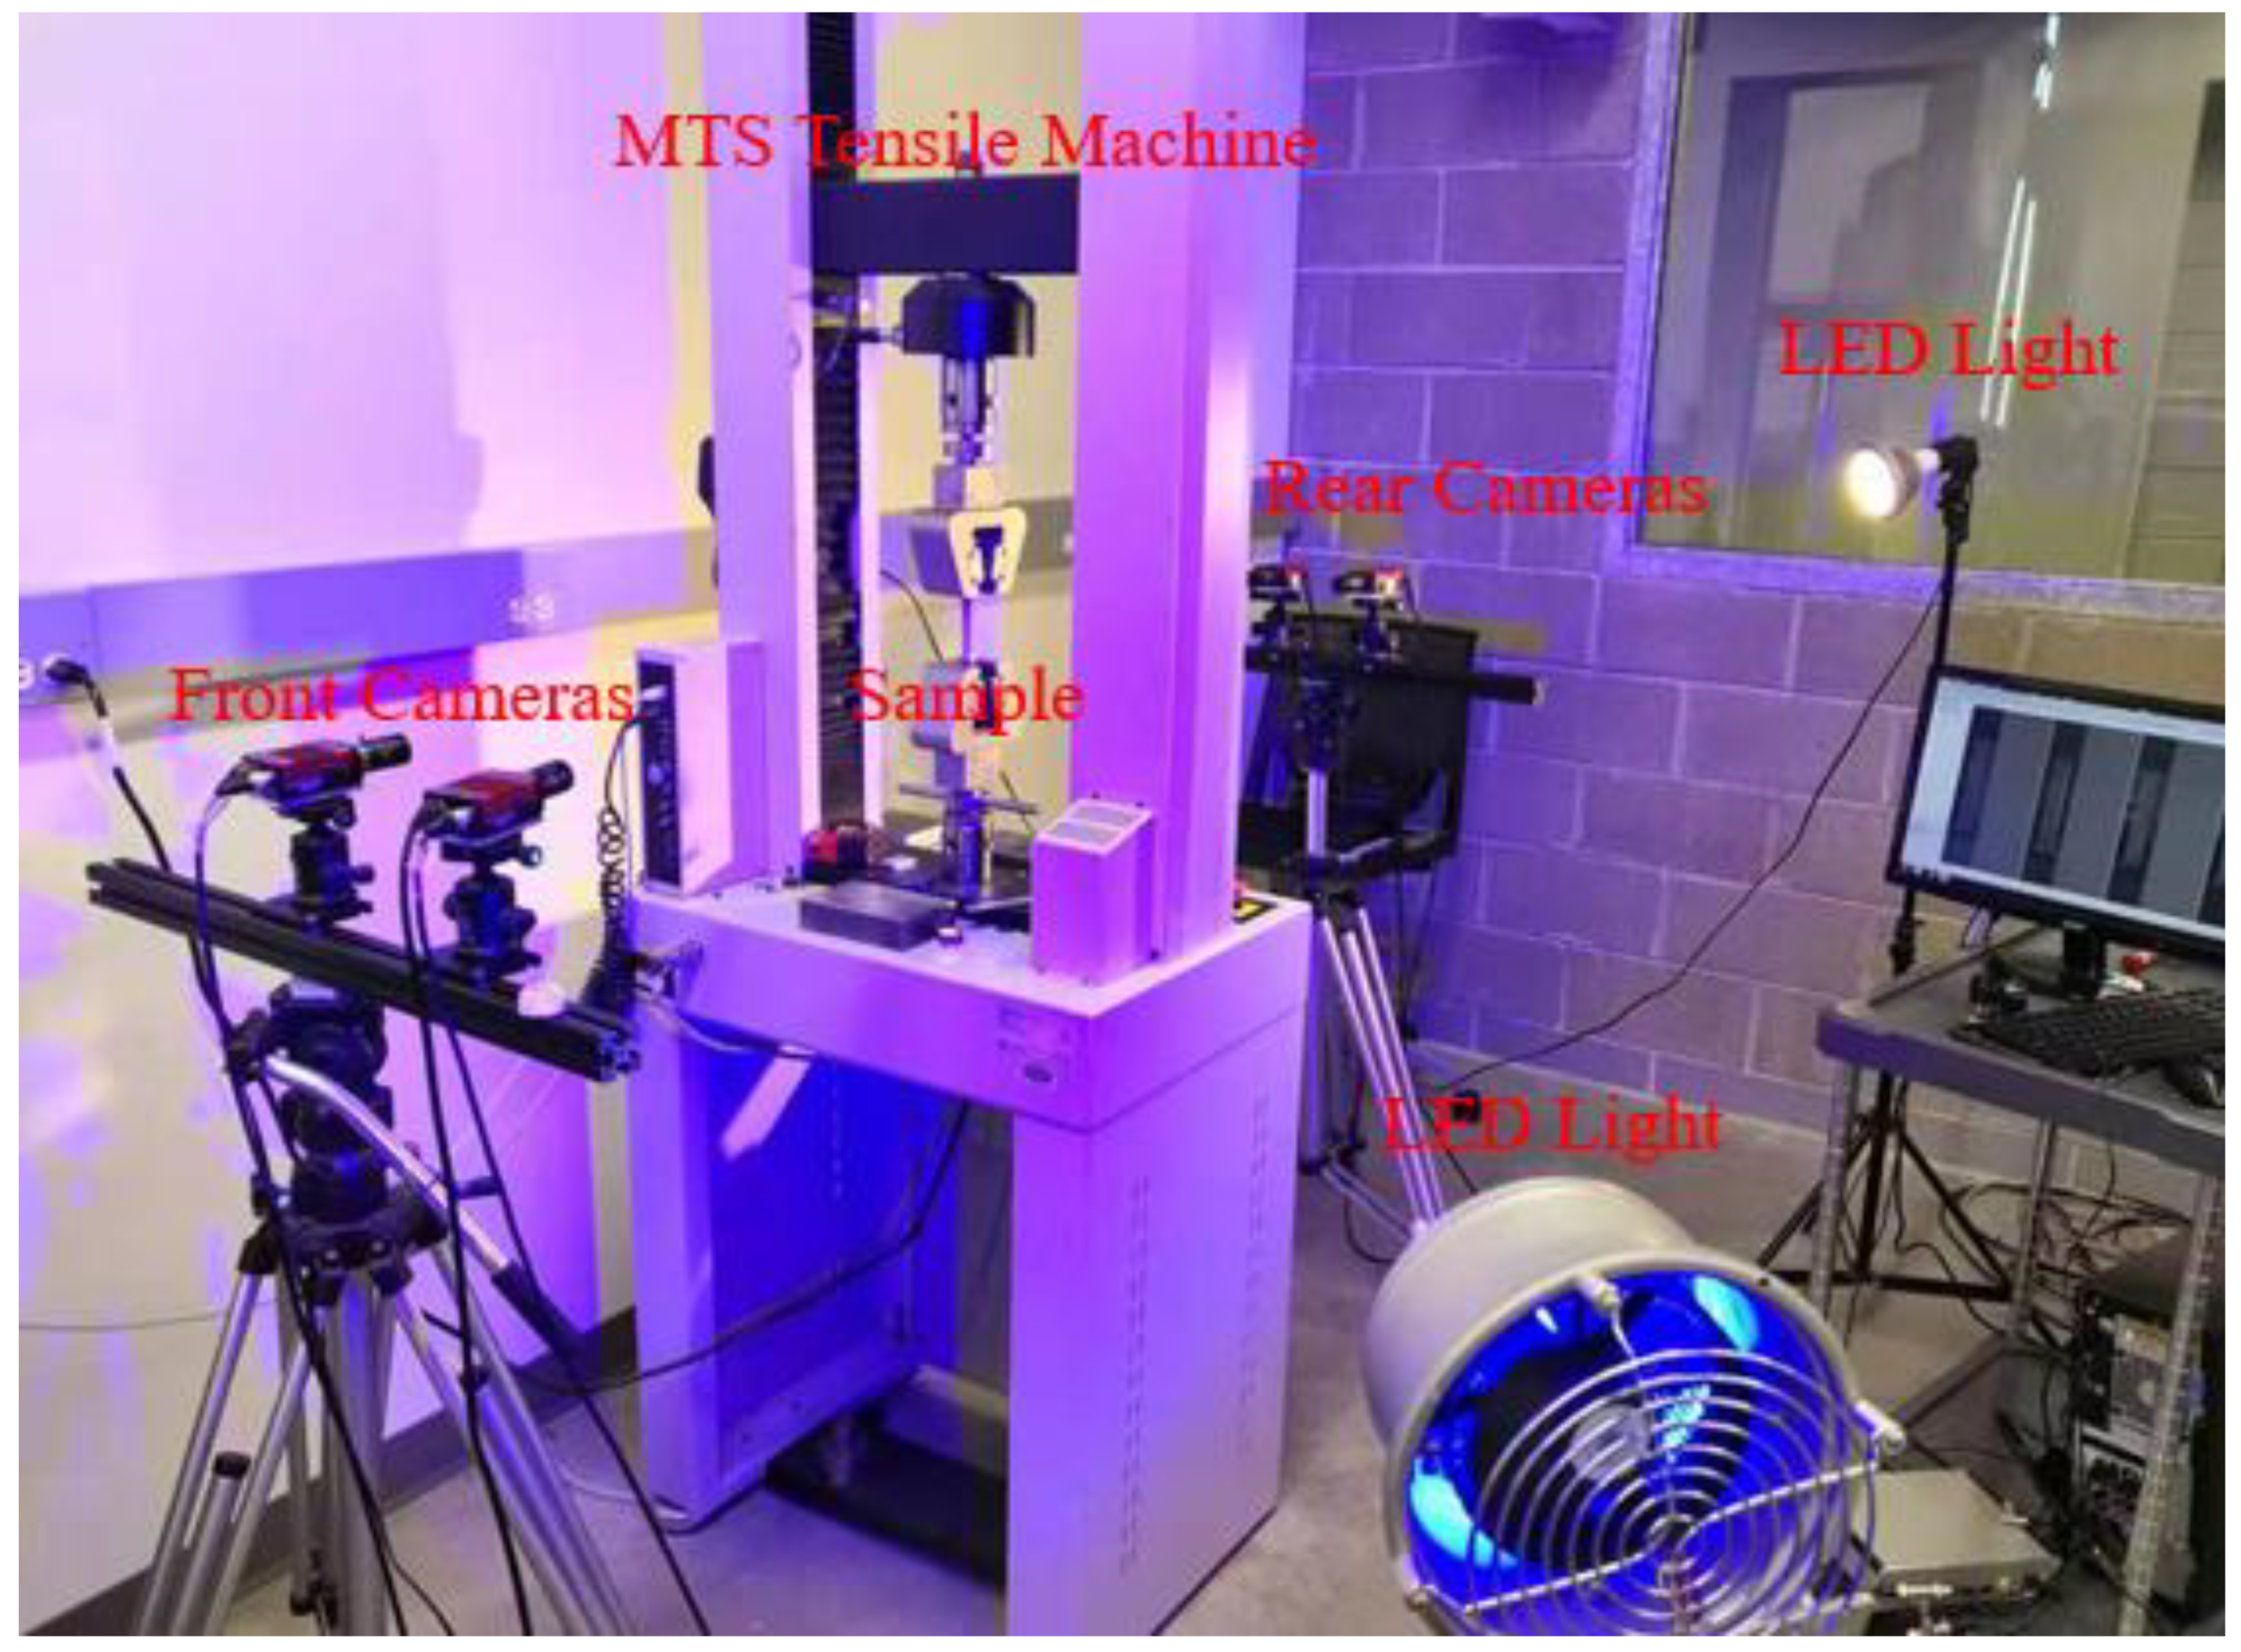
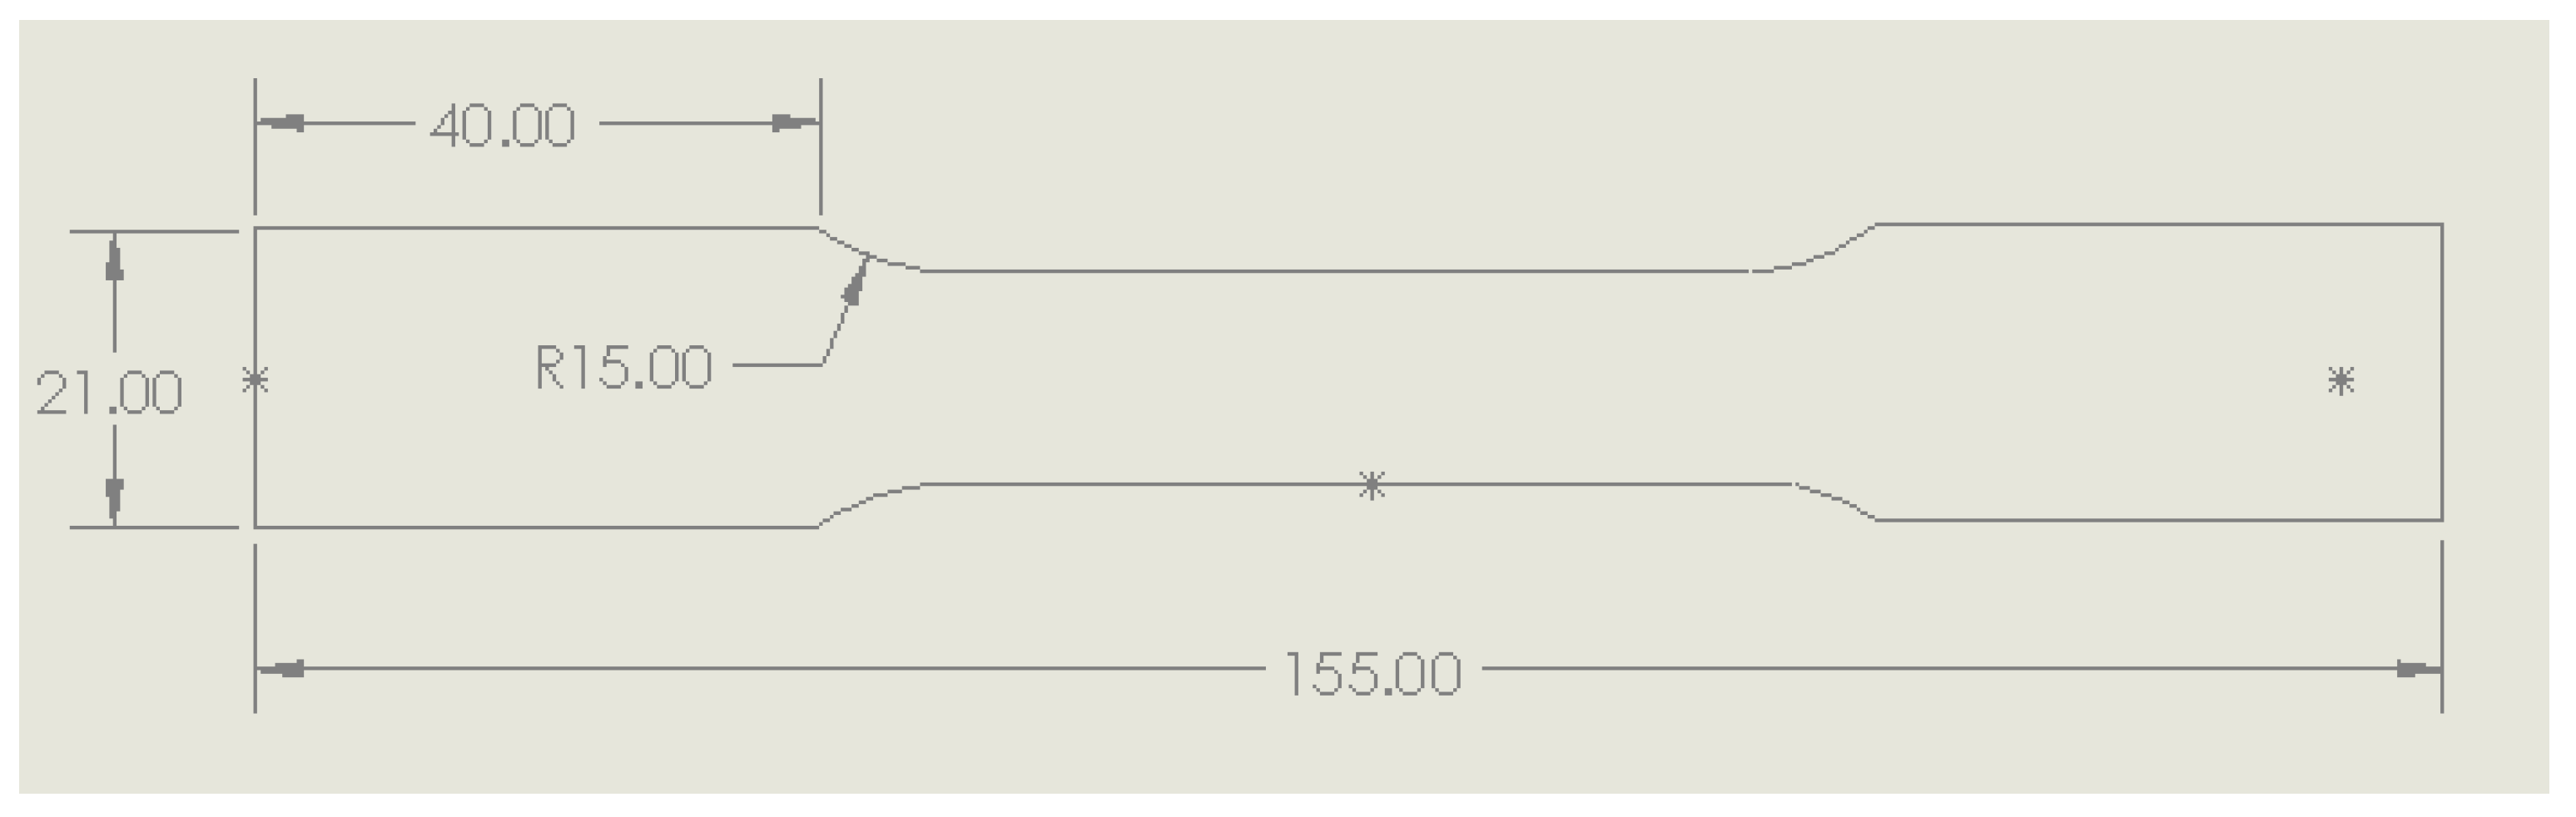
3.2. Experiment System

The experimental system is shown in Figure 8 and Figure 9. Four GigE cameras (maximum resolution 2752 × 2200) were used to form two independent DIC binocular measurement systems. One DIC system was placed in front of the test sample, while the other DIC system was placed behind the test sample. Two pairs of 50 mm fixed focus lenses were used to achieve a 20 mm × 20 mm field of view. The spatial resolution was 0.08 mm/pixel and the acquisition rate was 10 Hz. Two powerful LED lights provided sufficient illumination for the front and back DIC measurement systems. A 50 KN MTS tensile test machine was used to do the tensile test, and a 1 mm thick dog bone shape sample made from DP980 sheet metal was prepared for the test. The tensile speed was set at 3 mm/min. The slow tensile rate used for the test enabled more images to be taken before the sample cracked, thus providing more data to analyze. Figure 10 is a schematic diagram of this sample. Current limitations with this system include the cost of the cameras used for the DIC systems and the large amount of space required to accommodate the front and rear camera groups.

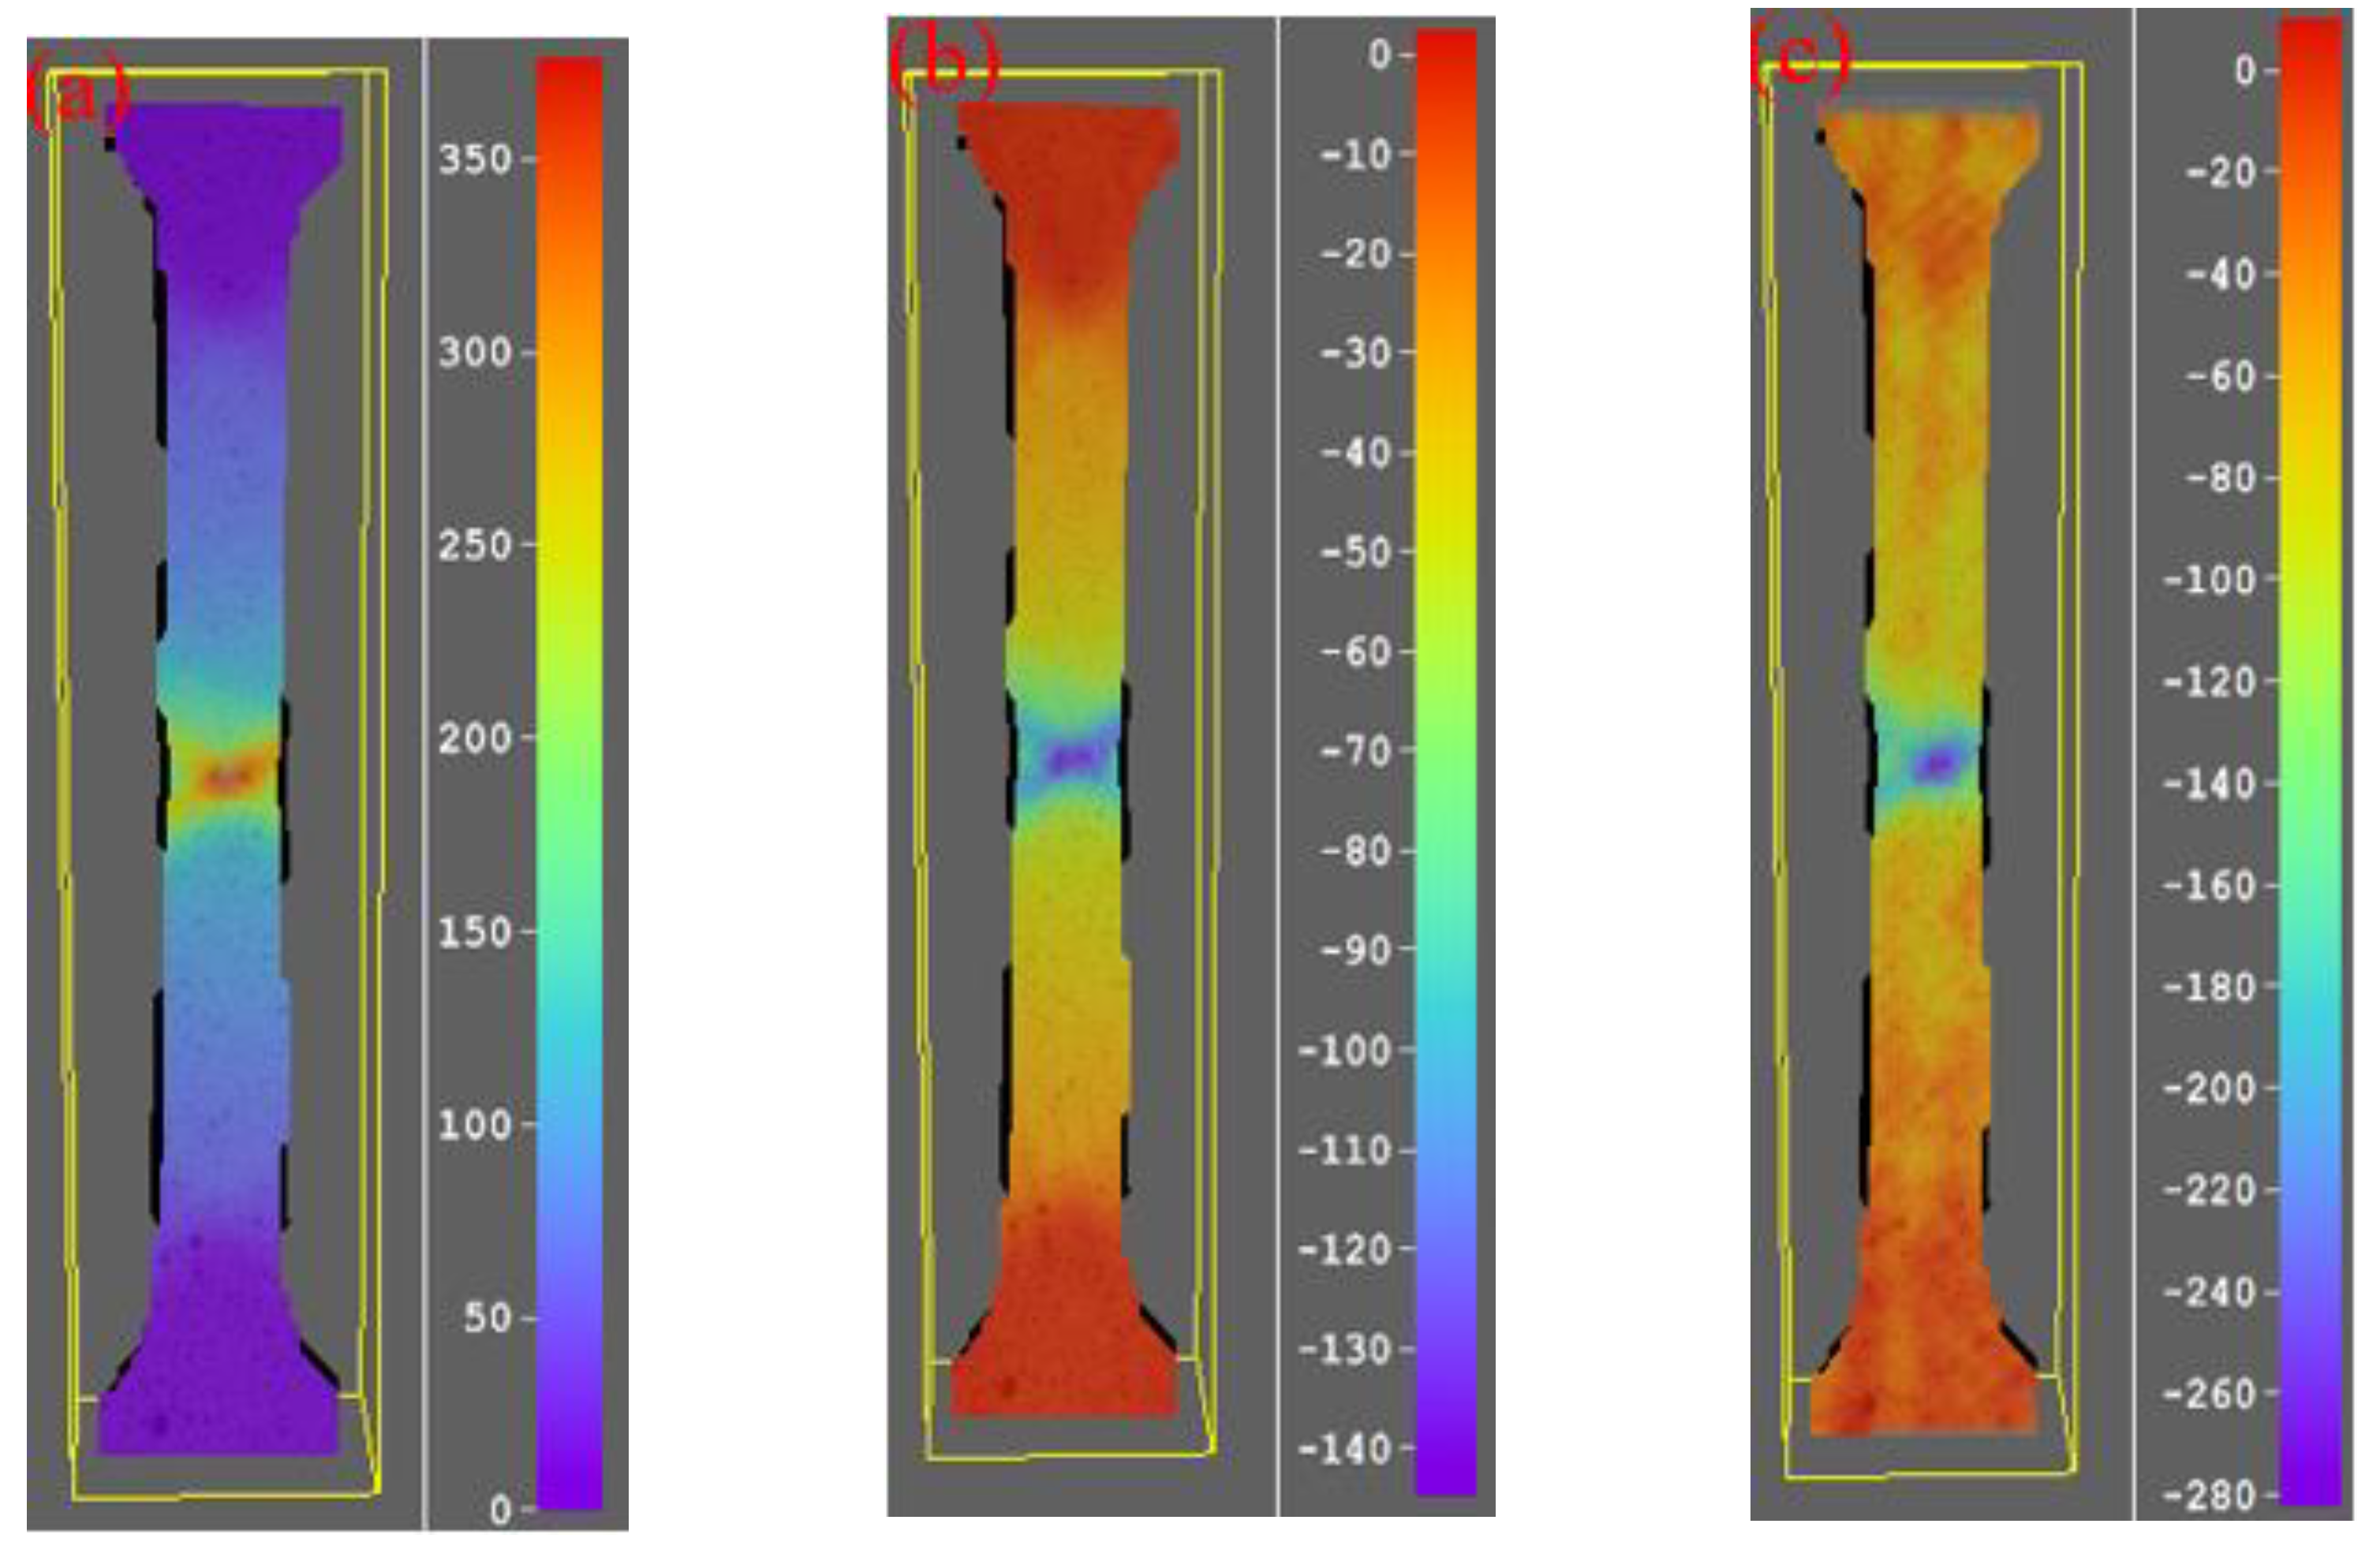
3.3. Experimental Results Analysis and Discussion

The 3D contour and strain distribution on the surfaces of the DP980 was obtained through DIC measurement. Figure 11 illustrates the simultaneous measurement results of length strain ( ε 1 ) map, width strain ( ε 2 ) map and thickness strain ( ε 3 ) map before fracture in the tensile test. The necking area, which is indicative of a strain concentration, is clearly visible.
R-value measurements were taken using two different methods, and these results were compared and analyzed. The first method is the traditional measurement, or indirect measurement, method based on the constant volume assumption. According to the assumption of constant volume, ε 1 +   ε 2 +   ε 3 = 0; thus, the thickness strain can be derived from measurements of the length and width strain:
ε 3 = ( ε 1 + ε 2 )
Based on the definition of R-value:
R = ε 2 ( ε 1 + ε 2 )
The other method used is the direct measurement method, or the direct thickness strain measurement method proposed in this paper. The calculation method is shown in Equation (8). Data in both the non-necking and necking area was selected for analysis to better show the difference between the two measurement methods.

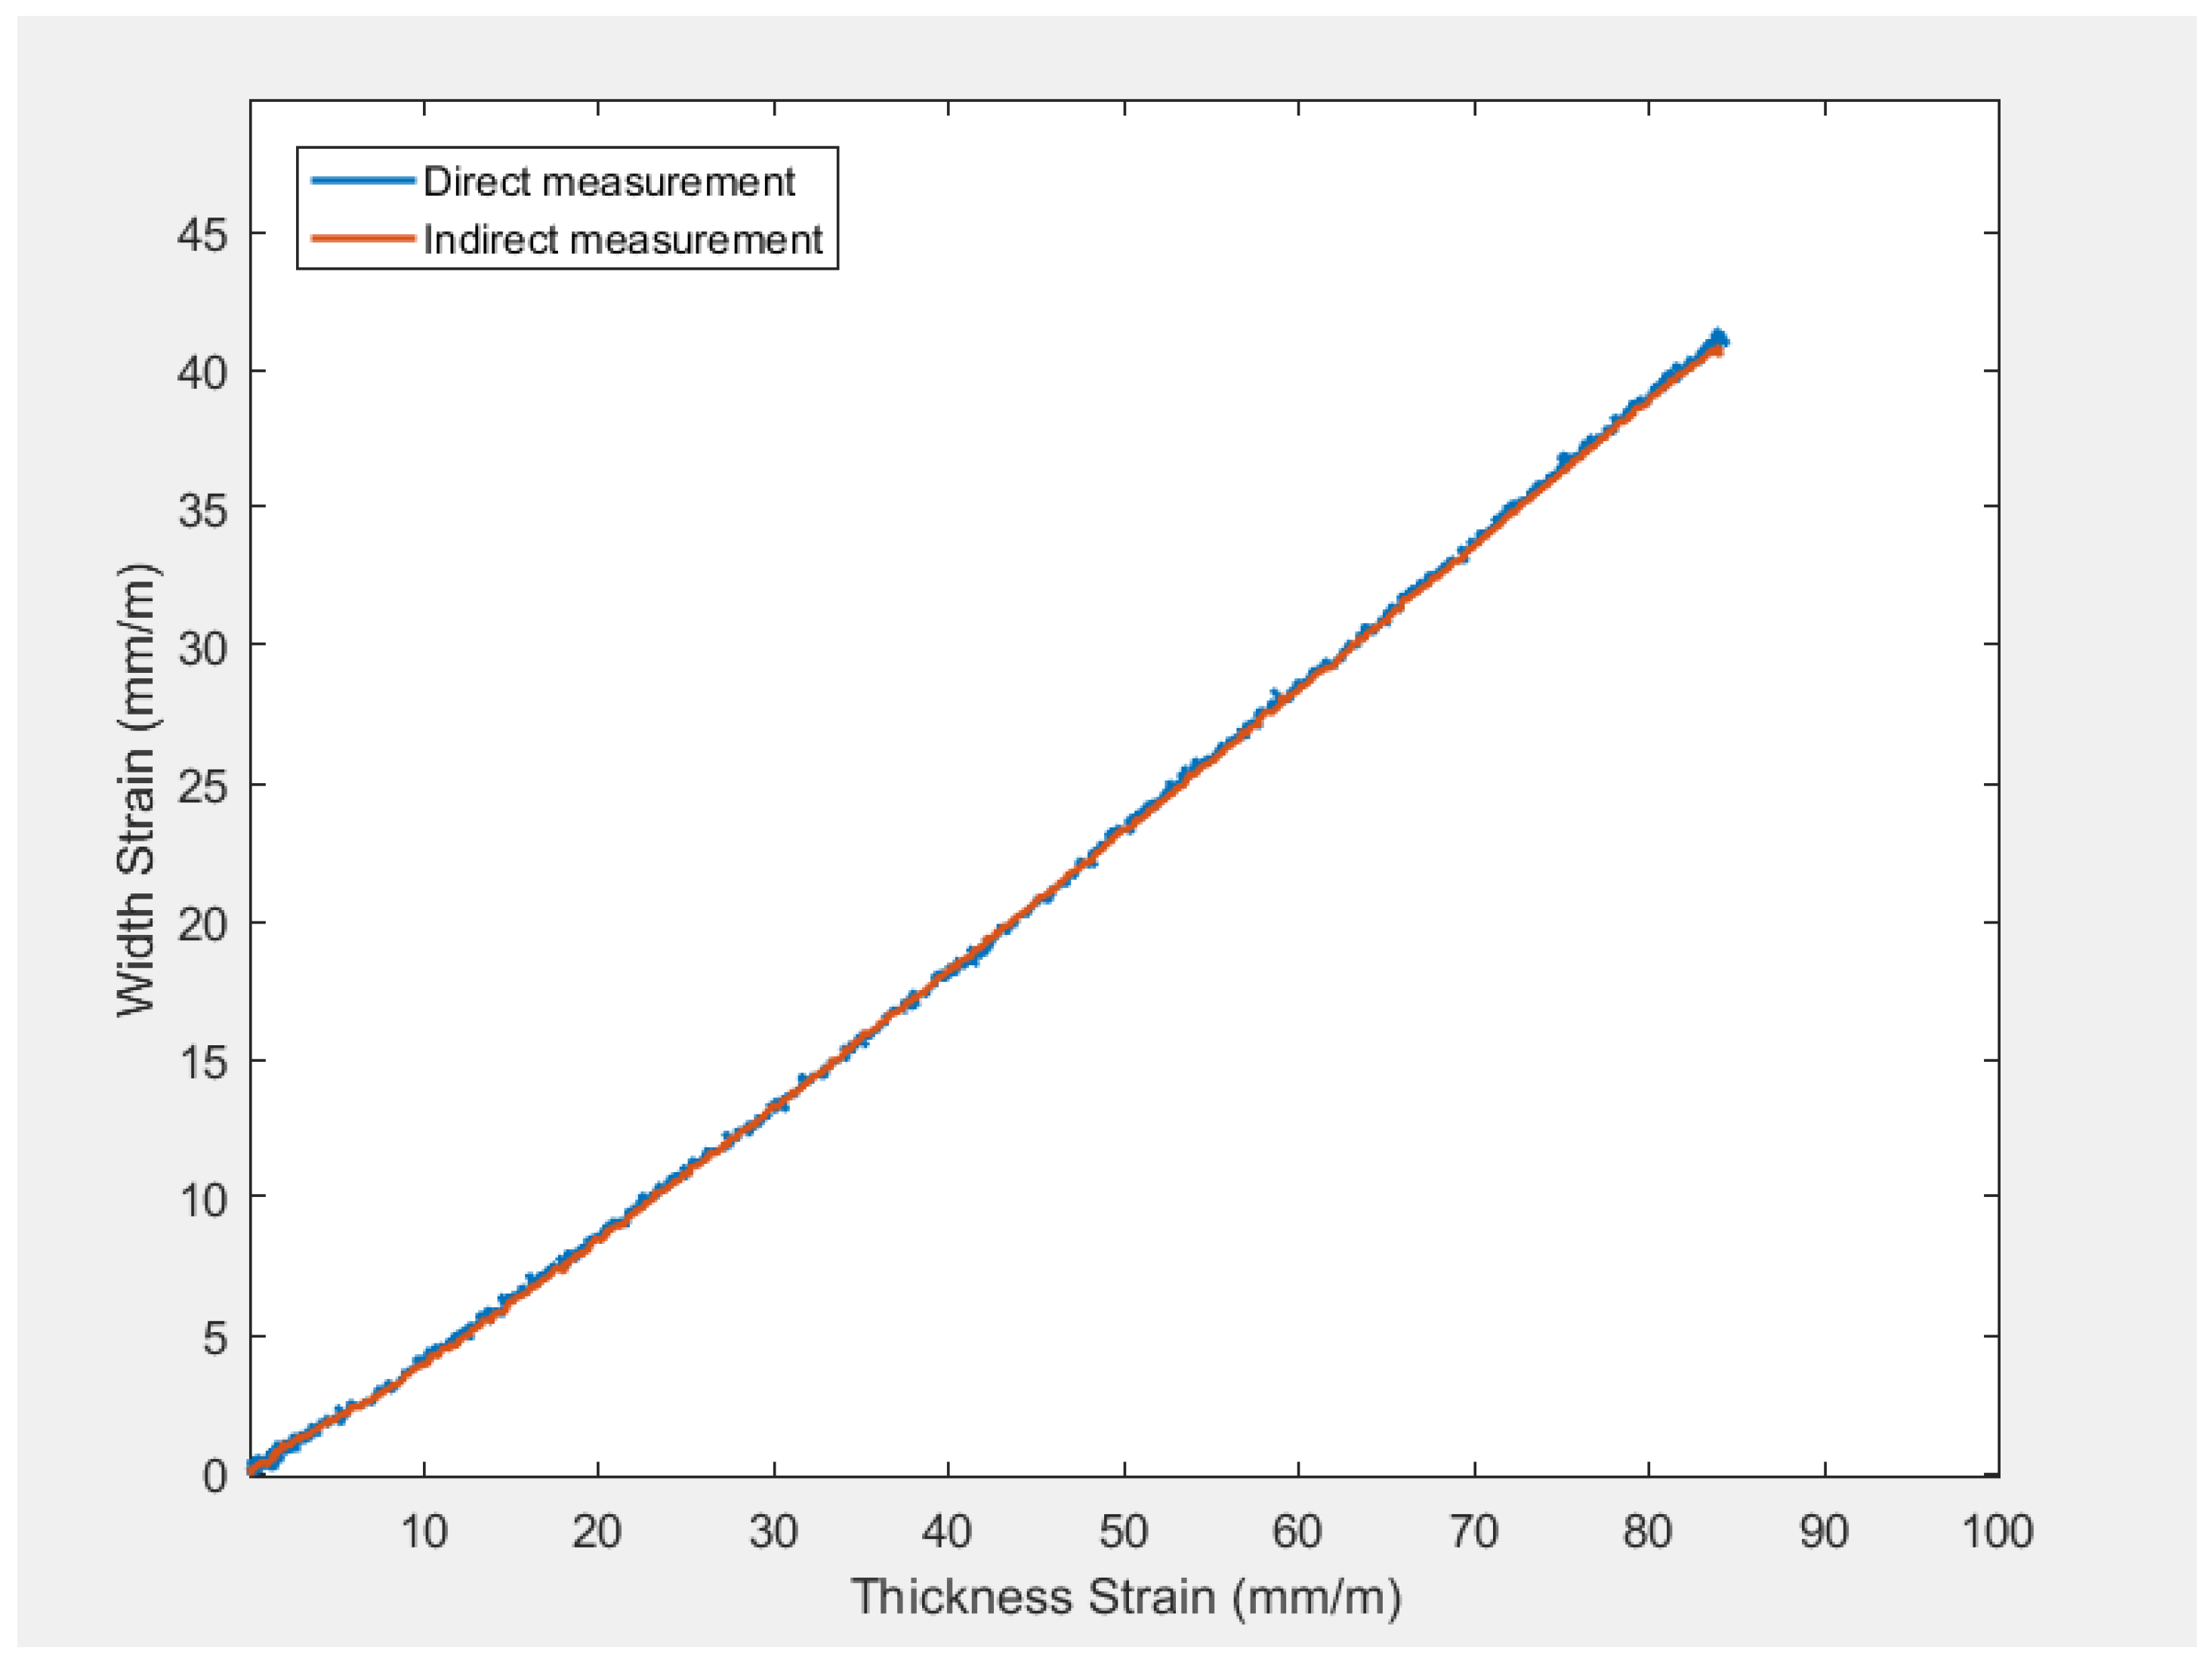
3.3.1. Non-Necking Area
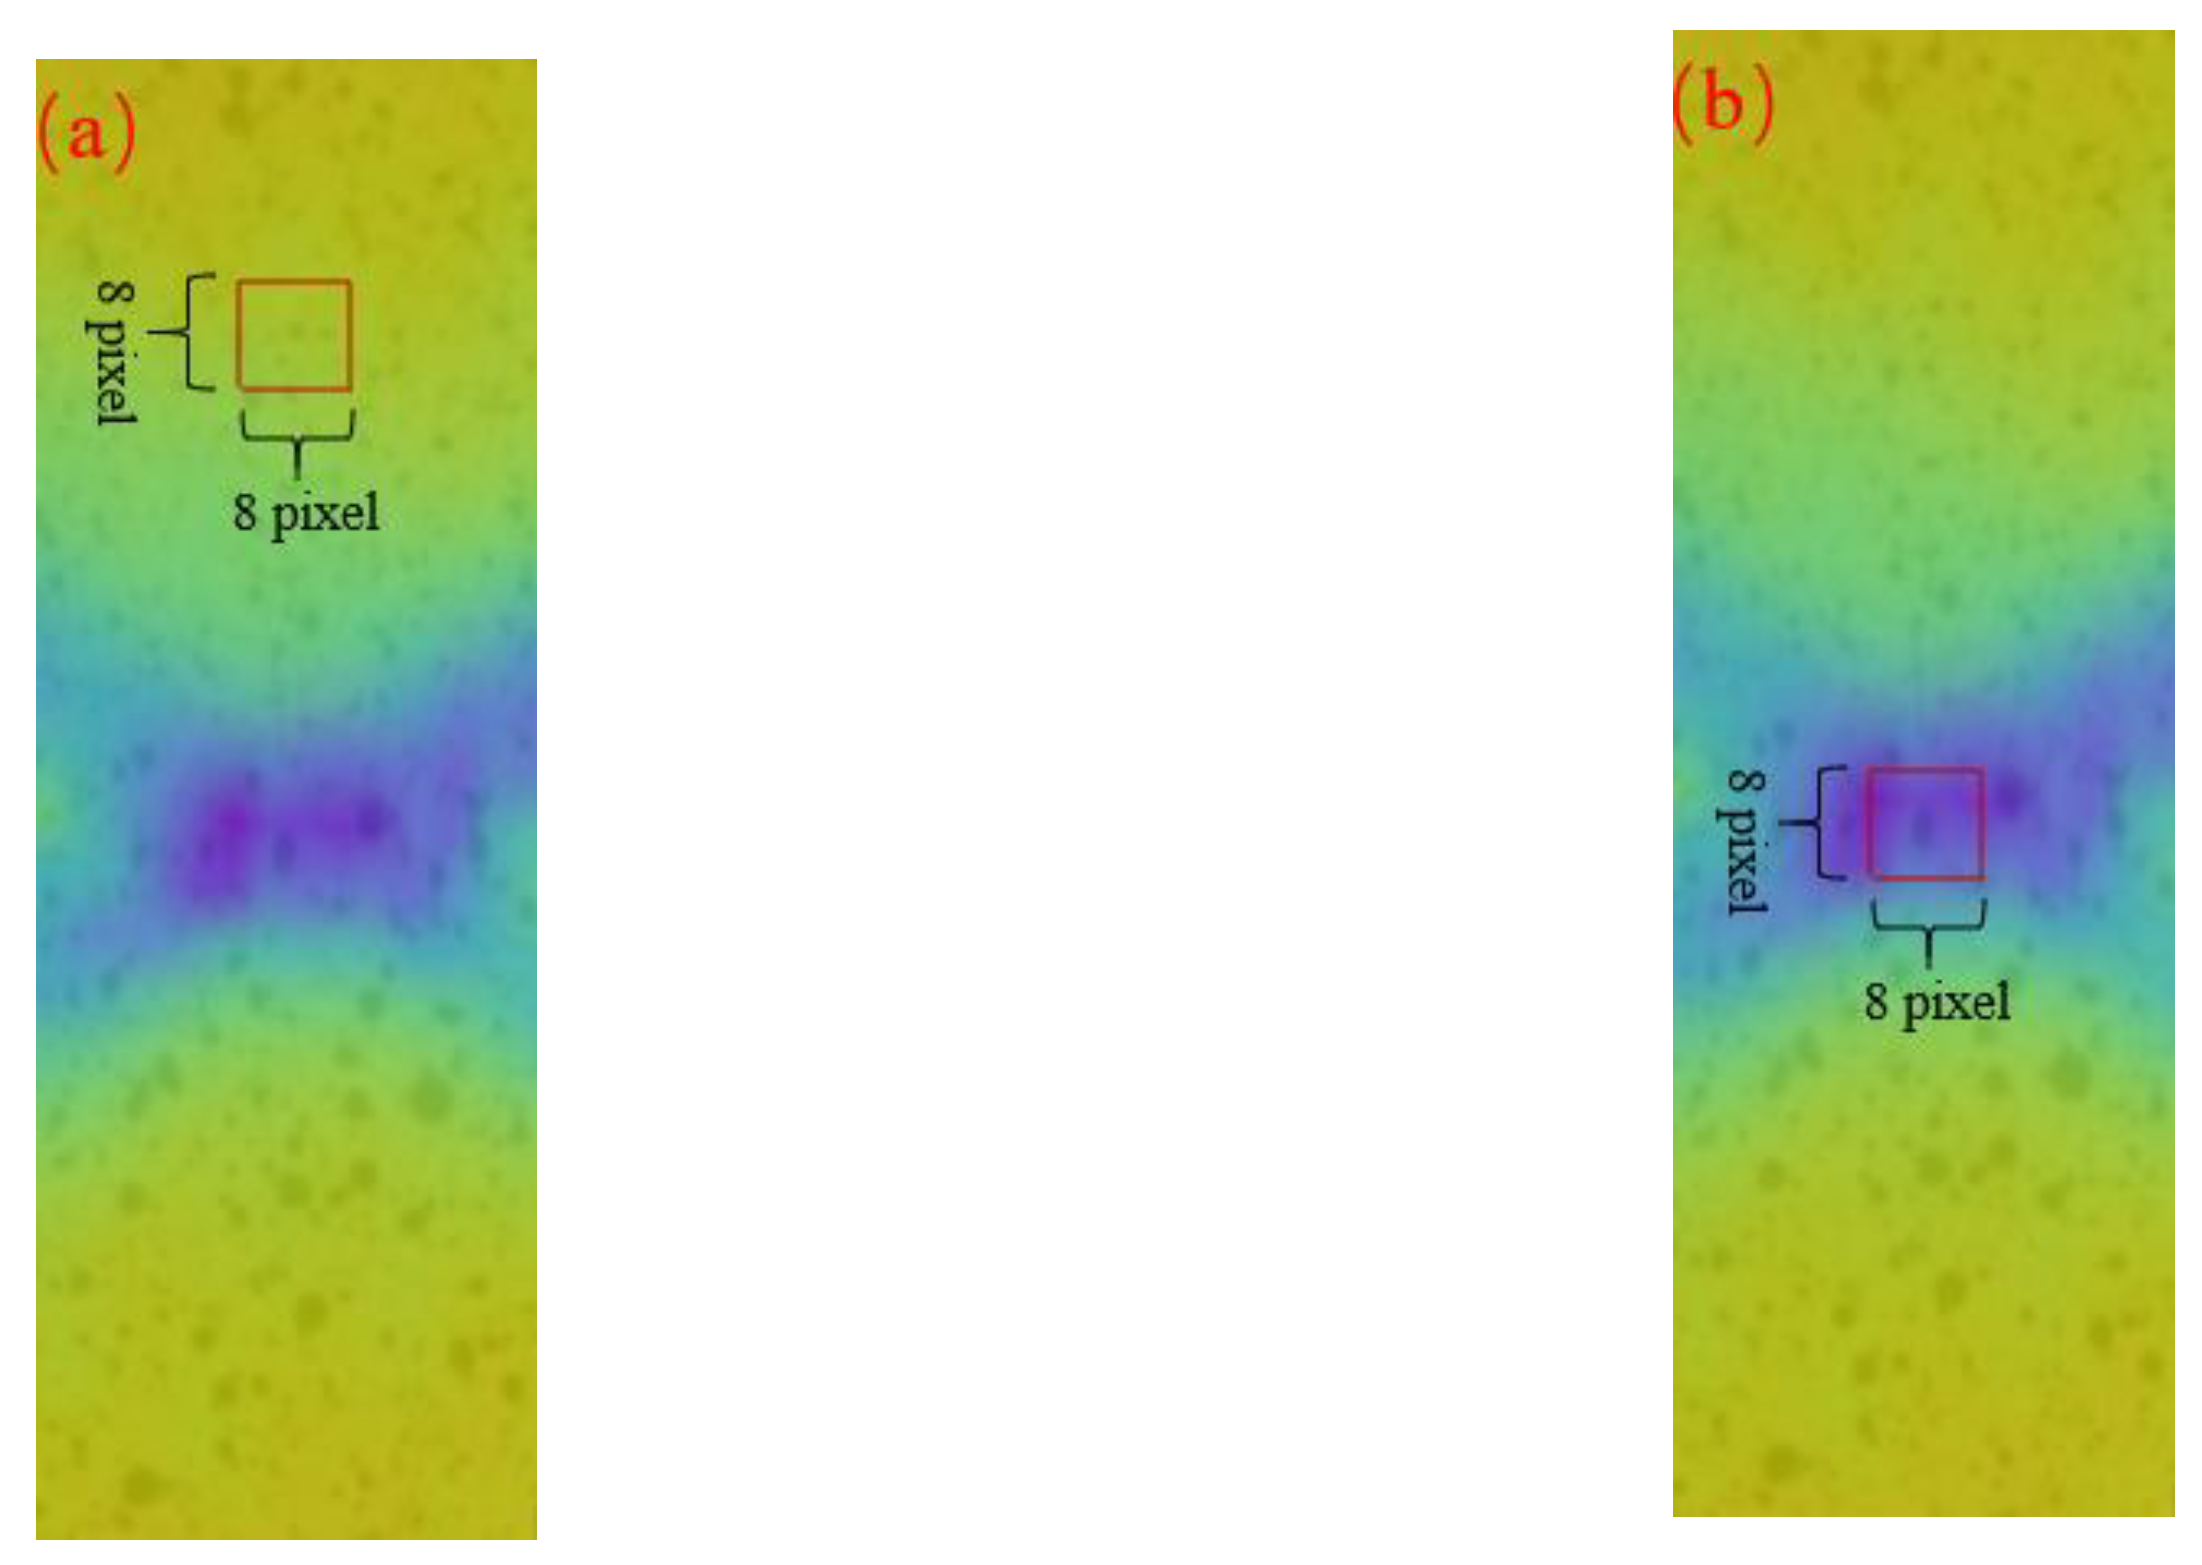
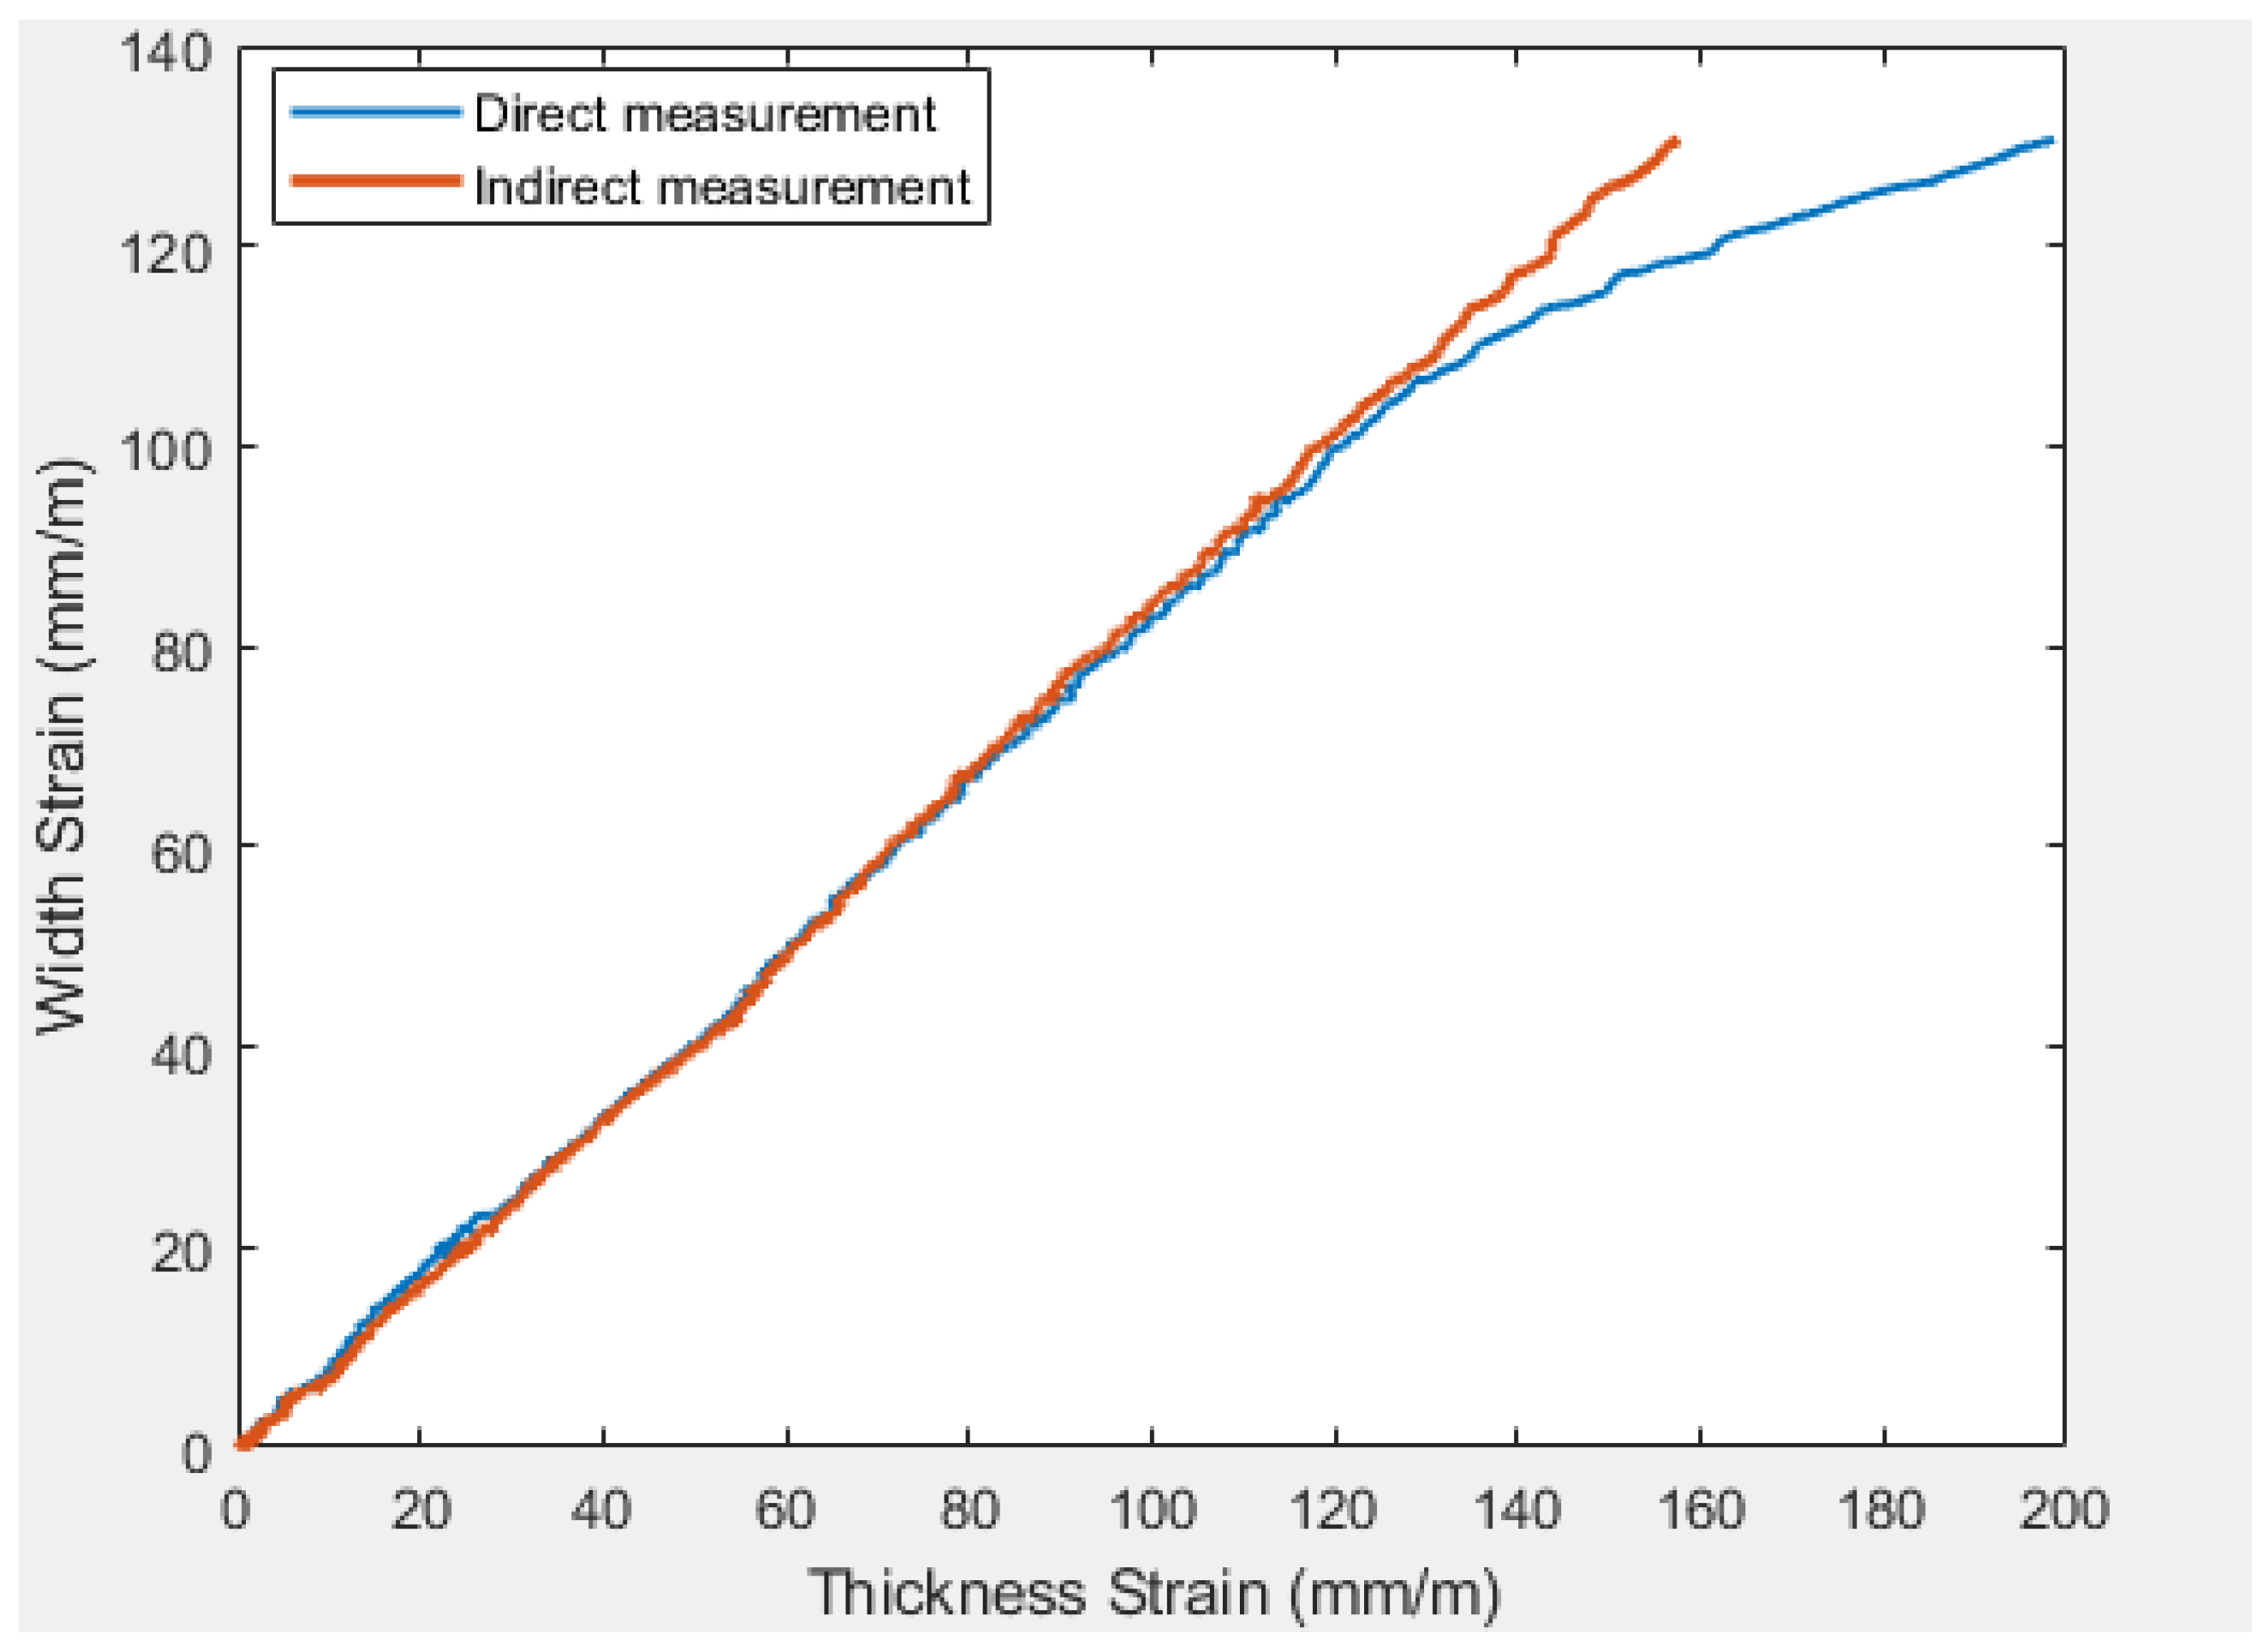
A square area of 8 × 8 pixels, as shown in Figure 12a, was selected instead of a single point in the non-necking area to reduce the influence of noise on the data. Each pixel represents 0.2 mm. The calculation results for the traditional and proposed methods are shown in Figure 13. According to the definition of R-value, the R-value for DP980 is equal to the slope of these two curves. It can be seen from the figure that the relationship between thickness strain and width strain is approximately linear, and the amount of noise in the data is low. Therefore, the least squares principle can be used to calculate the slope of the two curves. The directly measured R-value is 0.8546, while the indirectly measured R-value is 0.8656. Based on previous research of the properties of DP980 material, its R-value generally ranges between 0.7–1.0, depending on the material’s composition [24]. The results measured by both methods can be considered reasonable because they both fall within this range, and the difference in the results between the two methods is very small. Therefore, both methods are acceptable.

3.3.2. Necking Area

When necking occurs during a tensile test, a large amount of strain is disproportionately distributed in a central location of the material. As the deformation continues, the strain in the necking area continues to increase until the material ruptures. In the necking stage, the cross-sectional area of the material decreases drastically, while the strain in the thickness and width directions increases sharply. Figure 14 displays an example of the sharp strain increase that can occur during the necking stage.
An 8 × 8 pixel square area was selected in the necking area to obtain strain data, as shown in Figure 12b. Figure 15 illustrates the R-value measured by the two methods in the necking area. In the linear elastic deformation stage, the thickness strain is proportional to the width strain. The R-value at this time is a constant, and the results measured by the two methods are 0.8471 and 0.8526, respectively; these results are similar to those measured in the non-necked area. This shows that the material is uniformly distributed, stable in nature, and isotropic. When the width strain exceeds 60 mm/m, the strain value increases rapidly, and the material deformation enters the necking stage. It is worth noting that the direct method measurement curve no longer increases linearly; the growth rate reduces, and the R-value correspondingly becomes smaller. This shows that the ability of the material to resist strain in the thickness direction is reduced. Compared to the curve for the direct measurement method, the curve for the indirect measurement method remains linear in the early necking stage, and the R-value does not decrease significantly until the later necking stages. This result further confirms some researcher opinions that the material does not necessarily follow the constant volume assumption in the necking stage [12]. Therefore, the R-value measured by the direct measurement method is more reliable and accurate in the necking stage. It should be noted that some materials do follow the assumption of constant volume in the necking stage. The R-values for DP980 in the three rolling directions are displayed in Table 1. The R-values in the three rolling directions are very similar, indicating that the material has similar resistance to thickness deformation in different rolling directions.

3.4. Additional Verification Tests

Two additional materials were used for uniaxial tensile tests to verify the repeatability of the method proposed in this paper: aluminum alloy 6061 and a polymer material.

3.4.1. Aluminum Alloy 6061

A 3 mm thick dog-bone shaped aluminum alloy 6061 sample was utilized for a tensile test, and the test conditions were consistent with those used for DP980. The non-necking and necking areas were used to analyze the R-value of aluminum alloy 6061. Figure 16 and Figure 17 show the R-value curves of the non-necking area and the necking area using the direct measurement method and the indirect measurement method, respectively. All thickness strain data have been filtered using the RANSAC algorithm before plotting the R-value curves. It can be seen from the figures that the two measurement curves of the non-necking area are very close. The R-values obtained by fitting the two curves with least squares are 0.4895 and 0.4925, respectively. However, the data taken in the necking area shows the curves of the two measurement methods are different in the necking stage before fracture. The thickness strain of the direct measurement method increases more rapidly than that resulting from the indirect measurement method; thus, the R-value becomes smaller. The R-value curve change of this aluminum alloy 6061 based on direct measurement is similar to that of DP980. The constant volume assumption is no longer followed in the necking stage. The possible reason for this is that the crystal structure of the metal material is dislocated during the necking process.

3.4.2. Polymer

The R-value of the polymer material is measured in this section. A 2.5 mm thick dog-bone specimen was used for uniaxial tensile experiments. Since the polymer material is a typical brittle material, the material does not neck during the tensile test. Any rectangular area of 8 × 8 pixels on the material surface can be selected for R-value calculation. Figure 18 shows the R-value curves of the two measurement methods for this material. It can be found that the measurement results of the two methods are linearly increasing, but the growth rate is quite different. The R-value of the direct measurement is 0.3101, while the indirect measurement result is 0.2499. This states that the polymer material does not entirely follow the constant volume assumption in the tensile test. One possible explanation is the constant volume assumption is based on the crystal structure of metal materials, while polymers are composed of polymer compounds with complex structures and no longer follow the deformation conditions of metal materials.

4. Conclusions

A new R-value measurement method based on the use of two stereo-DIC systems has been presented in this paper. This method provides a new possibility for direct and simultaneous measurement of strains in the length, width, and thickness directions, thus allowing for direct measurement of the R-value. During the measurement process, it was found that DP980 and aluminum alloy 6061 do not follow the constant volume assumption in the necking stage. It was also found that a polymer material does not follow this assumption during the entire tensile test. The test results have certain significance for the research of different materials. Compared with the traditional R-value measurement method, this method has the advantages of direct measurement without assumption. The constant volume assumption has certain limitations, especially in the necking stage of material tensile deformation and polymer tensile deformation. Thus, the R-value obtained by the direct measurement method has more research value.
A main challenge to measuring strains in the third direction is that the strain data in this direction has more noise than other two strains due to the small value of the thickness. A standard DIC algorithm cannot be applied for such a measurement without using a special noise-removing algorithm, such as RANSAC presented in this paper. Some application limitations include the cost of four cameras and the large space requirement of the front and rear camera groups. Nevertheless, this paper provides an alternative method that directly measures R-value. The results for direct R-value measurement, as well as the comparison with the indirect R-value method, show that the method and the algorithm proposed is feasible and effective.
This paper has directly and indirectly measured the R-value of different materials, compared the results of the two measurement methods, and shown the accuracy of the direct measurement method. However, these measurement results are based on uniaxial tensile tests. Thus, it cannot completely reveal the reasons and limitations of the constant volume assumption. Future work may be necessary to study the microstructure of different materials before and after uniaxial tensile tests and determine the scope of application of the constant volume assumption through the analysis of the material microstructure.

Author Contributions

Conceptualization, S.F. and L.Y.; methodology, S.F., X.Z., B.Z.; validation, S.F., G.Z. and B.Z.; formal analysis, B.G.; investigation, G.Z.; resources, S.F., X.Z., B.Z.; data curation, S.F., G.Z.; writing—original draft preparation, S.F.; writing—review and editing, L.Y.; visualization, S.F., G.Z.; supervision, L.Y.; project administration, L.Y. All authors have read and agreed to the published version of the manuscript.

Funding

This research received no external funding.

Institutional Review Board Statement

Not applicable.

Informed Consent Statement

Not applicable.

Data Availability Statement

Data sharing not applicable.

Acknowledgments

The authors would like to express their sincere thanks to Bernard Sia, who made careful correction of the manuscript as well as the English.

Conflicts of Interest

The authors declare no conflict of interest.

References

  1. ASTM. E517–00. Standard Test Method for Plastic Strain Ratio R for Sheet Metal; American Society for Testing and Materials: West Conshohocken, PA, USA, 2006. [Google Scholar]
  2. Lankford, W.T.; Snyder, S.C.; Bausher, J.A. New criteria for predicting the press performance of deep drawing sheets. Trans. Am. Soc. Met. 1950, 42, 1197–1232. [Google Scholar]
  3. Stickels, C.; Mould, P. The use of Young’s modulus for predicting the plastic-strain ratio of low-carbon steel sheets. Metall. Mater. Trans. B 1970, 1, 1303–1312. [Google Scholar] [CrossRef]
  4. Ghosh, M.; Miroux, A.; Kestens, L. Correlating r-value and through thickness texture in Al–Mg–Si alloy sheets. J. Alloys Compd. 2015, 619, 585–591. [Google Scholar] [CrossRef]
  5. Moreau, A.; Lévesque, D.; Lord, M.; Dubois, M.; Monchalin, J.-P.; Padioleau, C.; Bussière, J. On-line measurement of texture, thickness and plastic strain ratio using laser-ultrasound resonance spectroscopy. Ultrasonics 2002, 40, 1047–1056. [Google Scholar] [CrossRef]
  6. Huang, M.; Cheng, H. Determination of all elastic and plastic parameters for sheets of cubic metals only by uniaxial tension tests. Eur. J. Mech. A/Solids 2015, 49, 539–547. [Google Scholar] [CrossRef]
  7. Bo, W.; Chen, X.-H.; Pan, F.-S.; Mao, J.-J.; Yong, F. Effects of cold rolling and heat treatment on microstructure and mechanical properties of AA 5052 aluminum alloy. Trans. Nonferrous Met. Soc. China 2015, 25, 2481–2489. [Google Scholar]
  8. Seiner, H.; Bodnárová, L.; Sedlák, P.; Janeček, M.; Srba, O.; Král, R.; Landa, M. Application of ultrasonic methods to determine elastic anisotropy of polycrystalline copper processed by equal-channel angular pressing. Acta Mater. 2010, 58, 235–247. [Google Scholar] [CrossRef]
  9. Mao, W.; Ma, Q.; Feng, H.; Chen, C.; Li, J. On-line determination technology on Lankford parameter of deep drawing aluminum sheets. Chin. J. Nonferrous Met. 2006, 16, 1149. [Google Scholar]
  10. Huh, J.; Kim, Y.; Huh, H. Measurement of R-values at intermediate strain rates using a digital speckle extensometry. In Dynamic Behavior of Materials; Springer: Cham, Switzerland, 2011; Volume 1, pp. 317–322. [Google Scholar]
  11. Esmaeilizadeh, R.; Khalili, K.; Mohammadsadeghi, B.; Arabi, H. Simulated and experimental investigation of stretch sheet forming of commercial AA1200 aluminum alloy. Trans. Nonferrous Met. Soc. China 2014, 24, 484–490. [Google Scholar] [CrossRef]
  12. Xie, X.; Li, J.; Sia, B.; Bai, T.; Siebert, T.; Yang, L. An experimental validation of volume conservation assumption for aluminum alloy sheet metal using digital image correlation method. J. Strain Anal. Eng. Des. 2017, 52, 24–29. [Google Scholar] [CrossRef]
  13. Chu, T.; Ranson, W.; Sutton, M.A. Applications of digital-image-correlation techniques to experimental mechanics. Exp. Mech. 1985, 25, 232–244. [Google Scholar] [CrossRef]
  14. Chen, X.; Xu, N.; Yang, L.; Xiang, D. High temperature displacement and strain measurement using a monochromatic light illuminated stereo digital image correlation system. Meas. Sci. Technol. 2012, 23, 125603. [Google Scholar] [CrossRef]
  15. Helm, J.D.; McNeill, S.R.; Sutton, M.A. Improved three-dimensional image correlation for surface displacement measurement. Opt. Eng. 1996, 35, 1911–1920. [Google Scholar] [CrossRef]
  16. Chen, F.; Chen, X.; Xie, X.; Feng, X.; Yang, L. Full-field 3D measurement using multi-camera digital image correlation system. Opt. Lasers Eng. 2013, 51, 1044–1052. [Google Scholar] [CrossRef]
  17. Li, J.; Dan, X.; Xu, W.; Wang, Y.; Yang, G.; Yang, L. 3D digital image correlation using single color camera pseudo-stereo system. Opt. Laser Technol. 2017, 95, 1–7. [Google Scholar] [CrossRef]
  18. Xie, X.; Li, J.; Zhang, B.; Sia, B.; Yang, L. Direct measurement of R value for aluminum alloy sheet metal using digital image correlation. In International Digital Imaging Correlation Society; Springer: Cham, Switzerland, 2017; pp. 89–94. [Google Scholar]
  19. Li, J.; Xie, X.; Yang, G.; Zhang, B.; Siebert, T.; Yang, L. Whole-field thickness strain measurement using multiple camera digital image correlation system. Opt. Lasers Eng. 2017, 90, 19–25. [Google Scholar] [CrossRef]
  20. Vendroux, G.; Knauss, W. Submicron deformation field measurements: Part 2. Improved digital image correlation. Exp. Mech. 1998, 38, 86–92. [Google Scholar] [CrossRef]
  21. Zhang, Z. A flexible new technique for camera calibration. IEEE Trans. Pattern Anal. Mach. Intell. 2000, 22, 1330–1334. [Google Scholar] [CrossRef] [Green Version]
  22. Fischler, M.A.; Bolles, R.C. Random sample consensus: A paradigm for model fitting with applications to image analysis and automated cartography. Commun. ACM 1981, 24, 381–395. [Google Scholar] [CrossRef]
  23. Song, J.; Yang, J.; Liu, F.; Lu, K. High temperature strain measurement method by combining digital image correlation of laser speckle and improved RANSAC smoothing algorithm. Opt. Lasers Eng. 2018, 111, 8–18. [Google Scholar] [CrossRef]
  24. Li, Q.; Zhang, H.; Chen, F.; Xu, D.; Sui, D.; Cui, Z. Study on the plastic anisotropy of advanced high strength steel sheet: Experiments and microstructure-based crystal plasticity modeling. Int. J. Mech. Sci. 2020, 176, 105569. [Google Scholar] [CrossRef]
Figure 1. Schematic of stereo-vision system.
Metals 11 01401 g001
Figure 2. Basic principle of digital image correlation.
Metals 11 01401 g002
Figure 3. Schematic of double-sided calibration strategy.
Metals 11 01401 g003
Figure 4. Double side calibration plate (front and back side).
Metals 11 01401 g004
Figure 5. DP980 thickness strain fitted by least squares algorithm.
Metals 11 01401 g005
Figure 6. Thickness strain data is classified inlier and outlier.
Metals 11 01401 g006
Figure 7. Fitting curve by RANSAC algorithm.
Metals 11 01401 g007
Figure 8. Schematic diagram of the experimental system.
Metals 11 01401 g008
Figure 9. Experimental set-up of the R-value measurement.
Metals 11 01401 g009
Figure 10. The schematic diagram of DP 980.
Metals 11 01401 g010
Figure 11. Full field strain distribution of sample surface measured by DIC system: (a) distribution of length strain; (b) distribution of width strain; (c) distribution of thickness strain.
Metals 11 01401 g011
Figure 12. Calculation area of R-value: (a) Non-necking area; (b) Necking area.
Metals 11 01401 g012
Figure 13. The R-value curve by two different measurement methods in the non-necking area.
Metals 11 01401 g013
Figure 14. Width and Thickness strain history.
Metals 11 01401 g014
Figure 15. The R-value curve by two different measurement methods in the necking area.
Metals 11 01401 g015
Figure 16. R-value curves of aluminum alloy 6061 in the non-necking area.
Metals 11 01401 g016
Figure 17. R-value curves of aluminum alloy 6061 in the necking area.
Metals 11 01401 g017
Figure 18. R-value curves of polymer.
Metals 11 01401 g018
Table 1. R-value of DP980 in different rolling direction.
Rolling DirectionR-Value
0.8656
45°0.8734
90°0.8853
Sheet Metal0.8749
Publisher’s Note: MDPI stays neutral with regard to jurisdictional claims in published maps and institutional affiliations.

