Article

Element Distribution and Its Induced Peritectic Reaction during Solidification of Ti-Al-Nb Alloys

1
School of Materials Science and Engineering, Yangtze Normal University, Chongqing 408100, China
2
State Key Laboratory for Advanced Metals and Materials, University of Science and Technology Beijing, Beijing 100083, China
*
Author to whom correspondence should be addressed.
Metals 2021, 11(9), 1386; https://doi.org/10.3390/met11091386
Submission received: 23 July 2021 / Revised: 28 August 2021 / Accepted: 30 August 2021 / Published: 31 August 2021

Abstract

:
The element distribution and the microstructures of directionally solidified ingots of Ti-45Al-8Nb and Ti-46Al-8Nb alloys were studied by scanning electron microscope (SEM) and electron probe microanalyzer (EPMA) equipped with wavelength-dispersive X-ray spectroscope (WDS). At high solidification rates, e.g., more than 50 μm/s, the ingot solidified in columnar β dendrites, while at low solidification rates, e.g., less than 30 μm/s, the solidification path changed from initial β solidification to L + β→α peritectic solidification, forming cellular dendrites with the β phase matrix surrounded by the α phase. The difference of Ti content in dendritic arms and interdendritic regions was not pronounced. The composition segregation was mainly caused by the mutual conversion of Al and Nb contents. Therefore, it was difficult to distinguish the variation of Ti in microstructure by EPMA-WDS map and line profiles. The composition of the peritectic α phase was different from that of the α phase transformed directly from the β phase. The Al content of the former was about 1 at% higher than that of the latter, while the Nb content was about 1 at% lower. The change of solidification path in the final solidified part resulted from the more severe segregation caused by slow solidification.

1. Introduction

TiAl alloys have a high melting point, high specific modulus, excellent oxidation resistance, creep resistance, and combustion resistance [1,2]. The density of TiAl alloys is about half that of nickel-based superalloys. Thus, TiAl alloys are lightweight and heat resistant materials which can replace the superalloys in the temperature range of 650–800 ℃ [3]. The representative TiAl alloys, Ti-48Al-2Nb-2Cr alloy and Ti-43.5Al-4Nb-1Mo-0.1B alloy (all compositions in this paper are given in atomic percentage), were used in many aero-engines [3,4]. The Nb element increases oxidation resistance, melting point, and high temperature strength of TiAl alloys, thus high Nb containing TiAl alloys are expected to be used at higher service temperatures [5,6,7,8].
The solidification path of high Nb containing TiAl alloys is different from that of traditional TiAl alloys because Nb expands the β phase region and compacts the α phase region [9]. In the meantime, Nb segregation occurs in the alloy, resulting in the formation of the β0 phase with B2 structure and the ω phase with B82 structure [10]. The Al element is the solute in α and β phases, therefore, its distribution behavior during solidification is affected by the solidification rate. The solute distribution behavior may, in turn, influence the solidification path. Finally, the solidification rate has an effect on the composition and the microstructure of the alloy. Therefore, to develop casting and subsequent heat treatment processes, it is essential to study the distribution behavior of Al and Nb elements and the corresponding effects on the solidification microstructure of high Nb containing TiAl alloys.
Our group reported on the effect of solidification rate on the microstructure and the composition segregation in high Nb containing TiAl alloys. The increase of solidification rate leads to the decrease of the dendrite arm spacing in the directionally solidified microstructure and the extent of Al and Nb segregation [11,12]. This paper is a follow-up to the above works, mainly focusing on the nonequilibrium peritectic α phase and its formation mechanism as well as the element distribution in different microconstituents.

2. Materials and Methods

The 1 kg button ingots with nominal compositions of Ti-45Al-8Nb and Ti-46Al-8Nb were prepared by nonconsumable arc melting (tungsten electrode) of the high purity elements. The actual compositions measured by electron probe microanalyzer were Ti-44.92Al-8.01Nb and Ti-45.89Al-8.02Nb, respectively. Many Φ 6.8 mm × 100 mm rods were cut from the button ingots by electric discharge machining (EDM) as stocks. The rod was inserted in a Φ 8 × 126 mm dense cylindrical alumina crucible and mounted in a modified Bridgman-type apparatus. To prevent the reaction of the stock and the crucible, a 0.3 mm thick layer of yttria was covered in the inner of the crucible. The stock was melted by induction heating at 1600 °C, and the temperature gradient of the melt near the solid–liquid interface was maintained at 4.2 k/mm. The solidification of the Ti-45Al-8Nb alloy was performed with the withdrawing rates of 10, 30, 50, 100, 200, and 400 μm/s, respectively, and that of the Ti-46Al-8Nb alloy with the withdrawing rate of 30 μm/s. After a solidification length of 30–50 mm, the ingot was quenched by pulling rapidly into a liquid metal reservoir of 20 °C to capture the morphologies of the dendrites. The detailed preparation processes of the ingots are described in Reference [12].
The solidified ingots were cut longitudinally and transversely by EDM to prepare metallographic samples by grinding with SiC papers to 2000 grit followed by mechanically polishing with a 0.5 μm diamond polishing paste. The microstructures at the region that had just solidified completely were examined using a Zeiss SUPRA 55 field emission scanning electron microscope (SEM, Carl Zeiss AG, Jena, Germany) and JEOL JXA-8100 and JEOL JXA-8230 electron probe microanalyzers (EPMA, JEOL Ltd., Akishima, Tokyo, Japan) equipped with wavelength-dispersive X-ray spectroscope (WDS). All images were obtained using the backscattered electron (BSE) mode. EPMA-WDS plane scan and line scan analyses were performed on the Ti-45Al-8Nb alloy. Line scan analysis and composition measurement at different points were performed on the Ti-46Al-8Nb alloy to characterize the element distribution in the microstructure. The phase information of the ingots was analyzed by a D/max-2500/PC X-ray diffractometer (XRD, Rigaku Co., Akishima-shi, Tokyo, Japan).

3. Results and Discussion

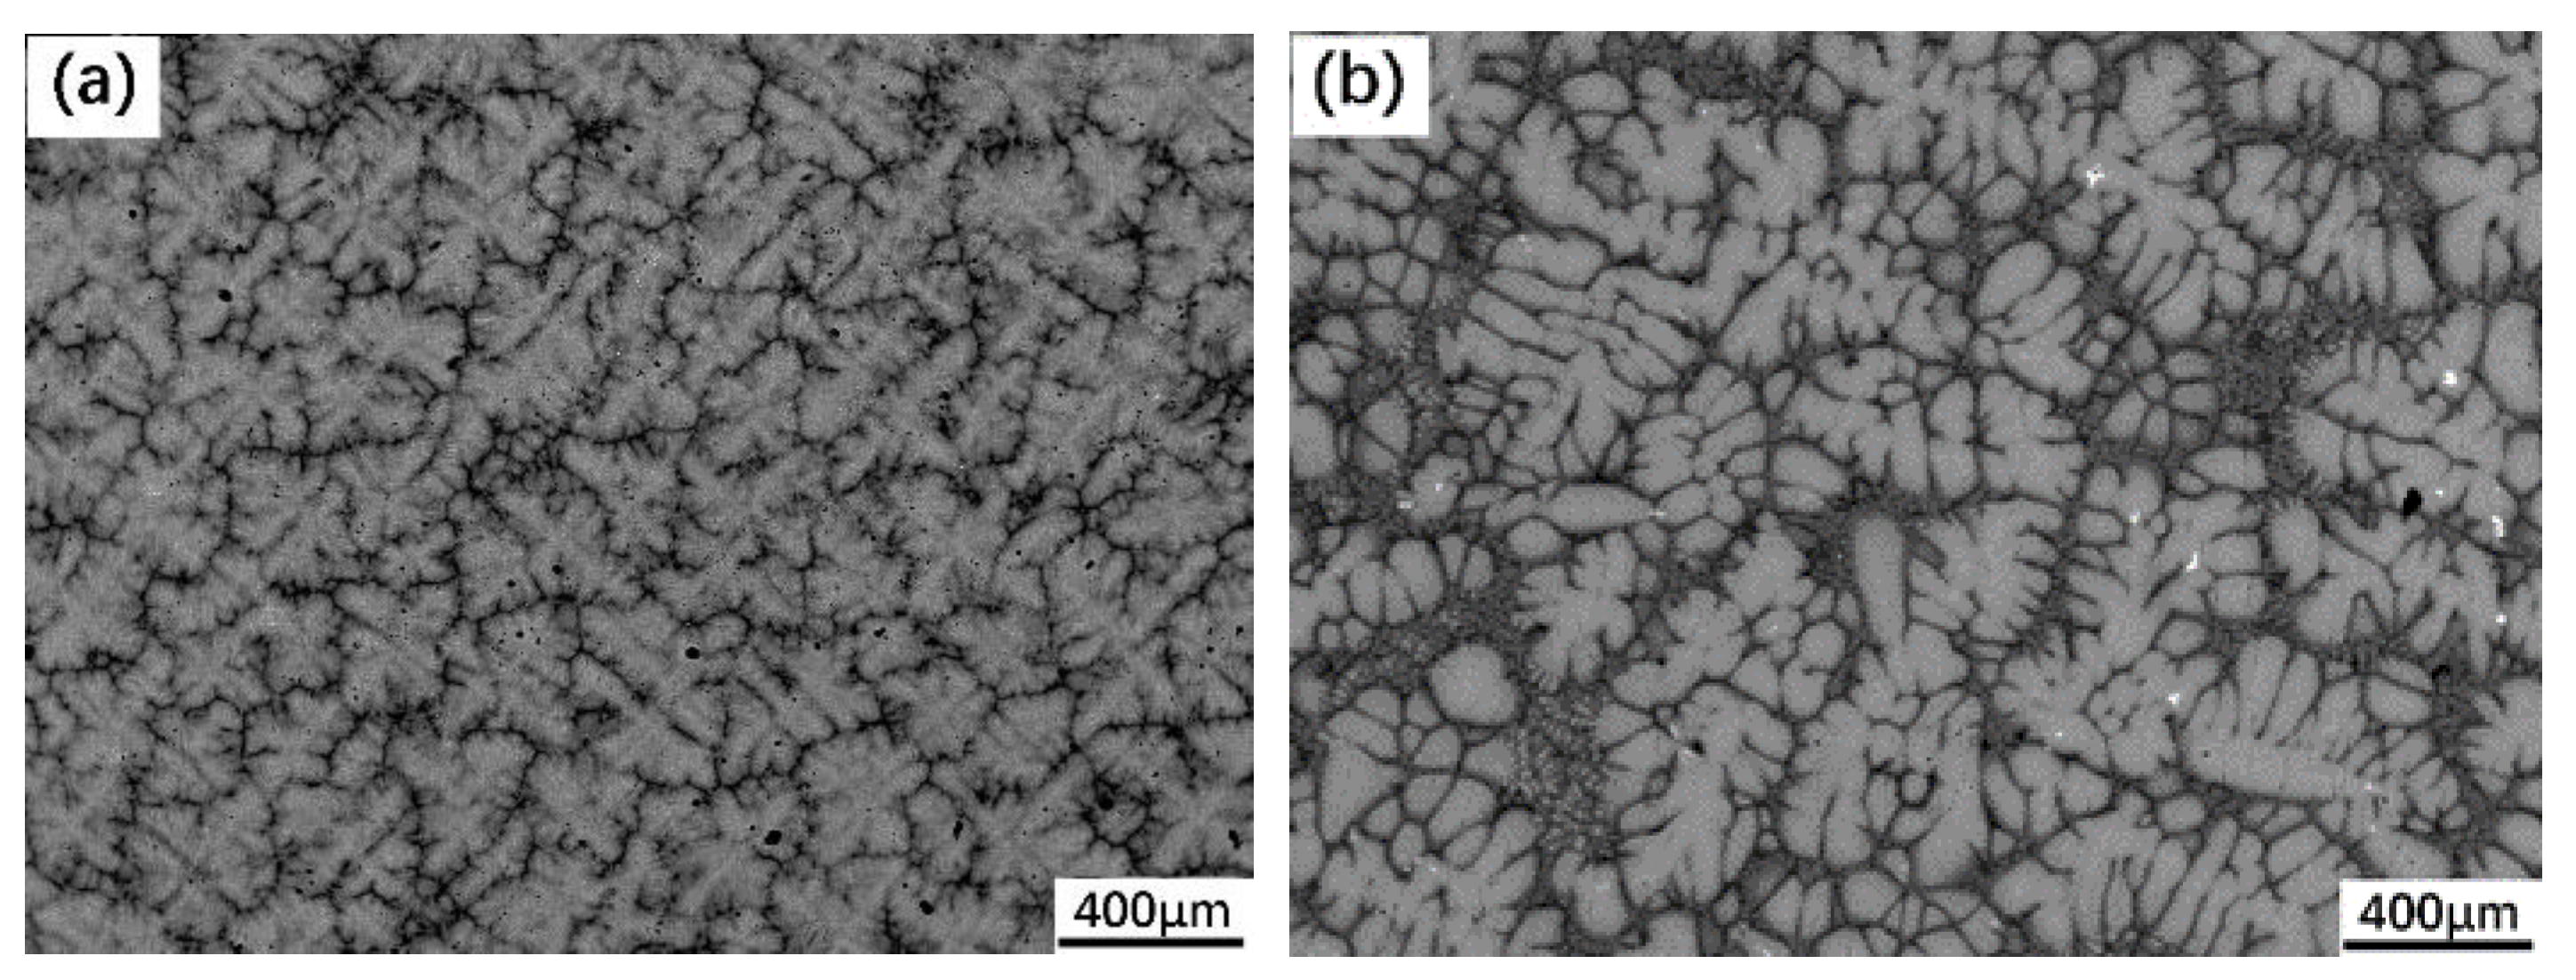
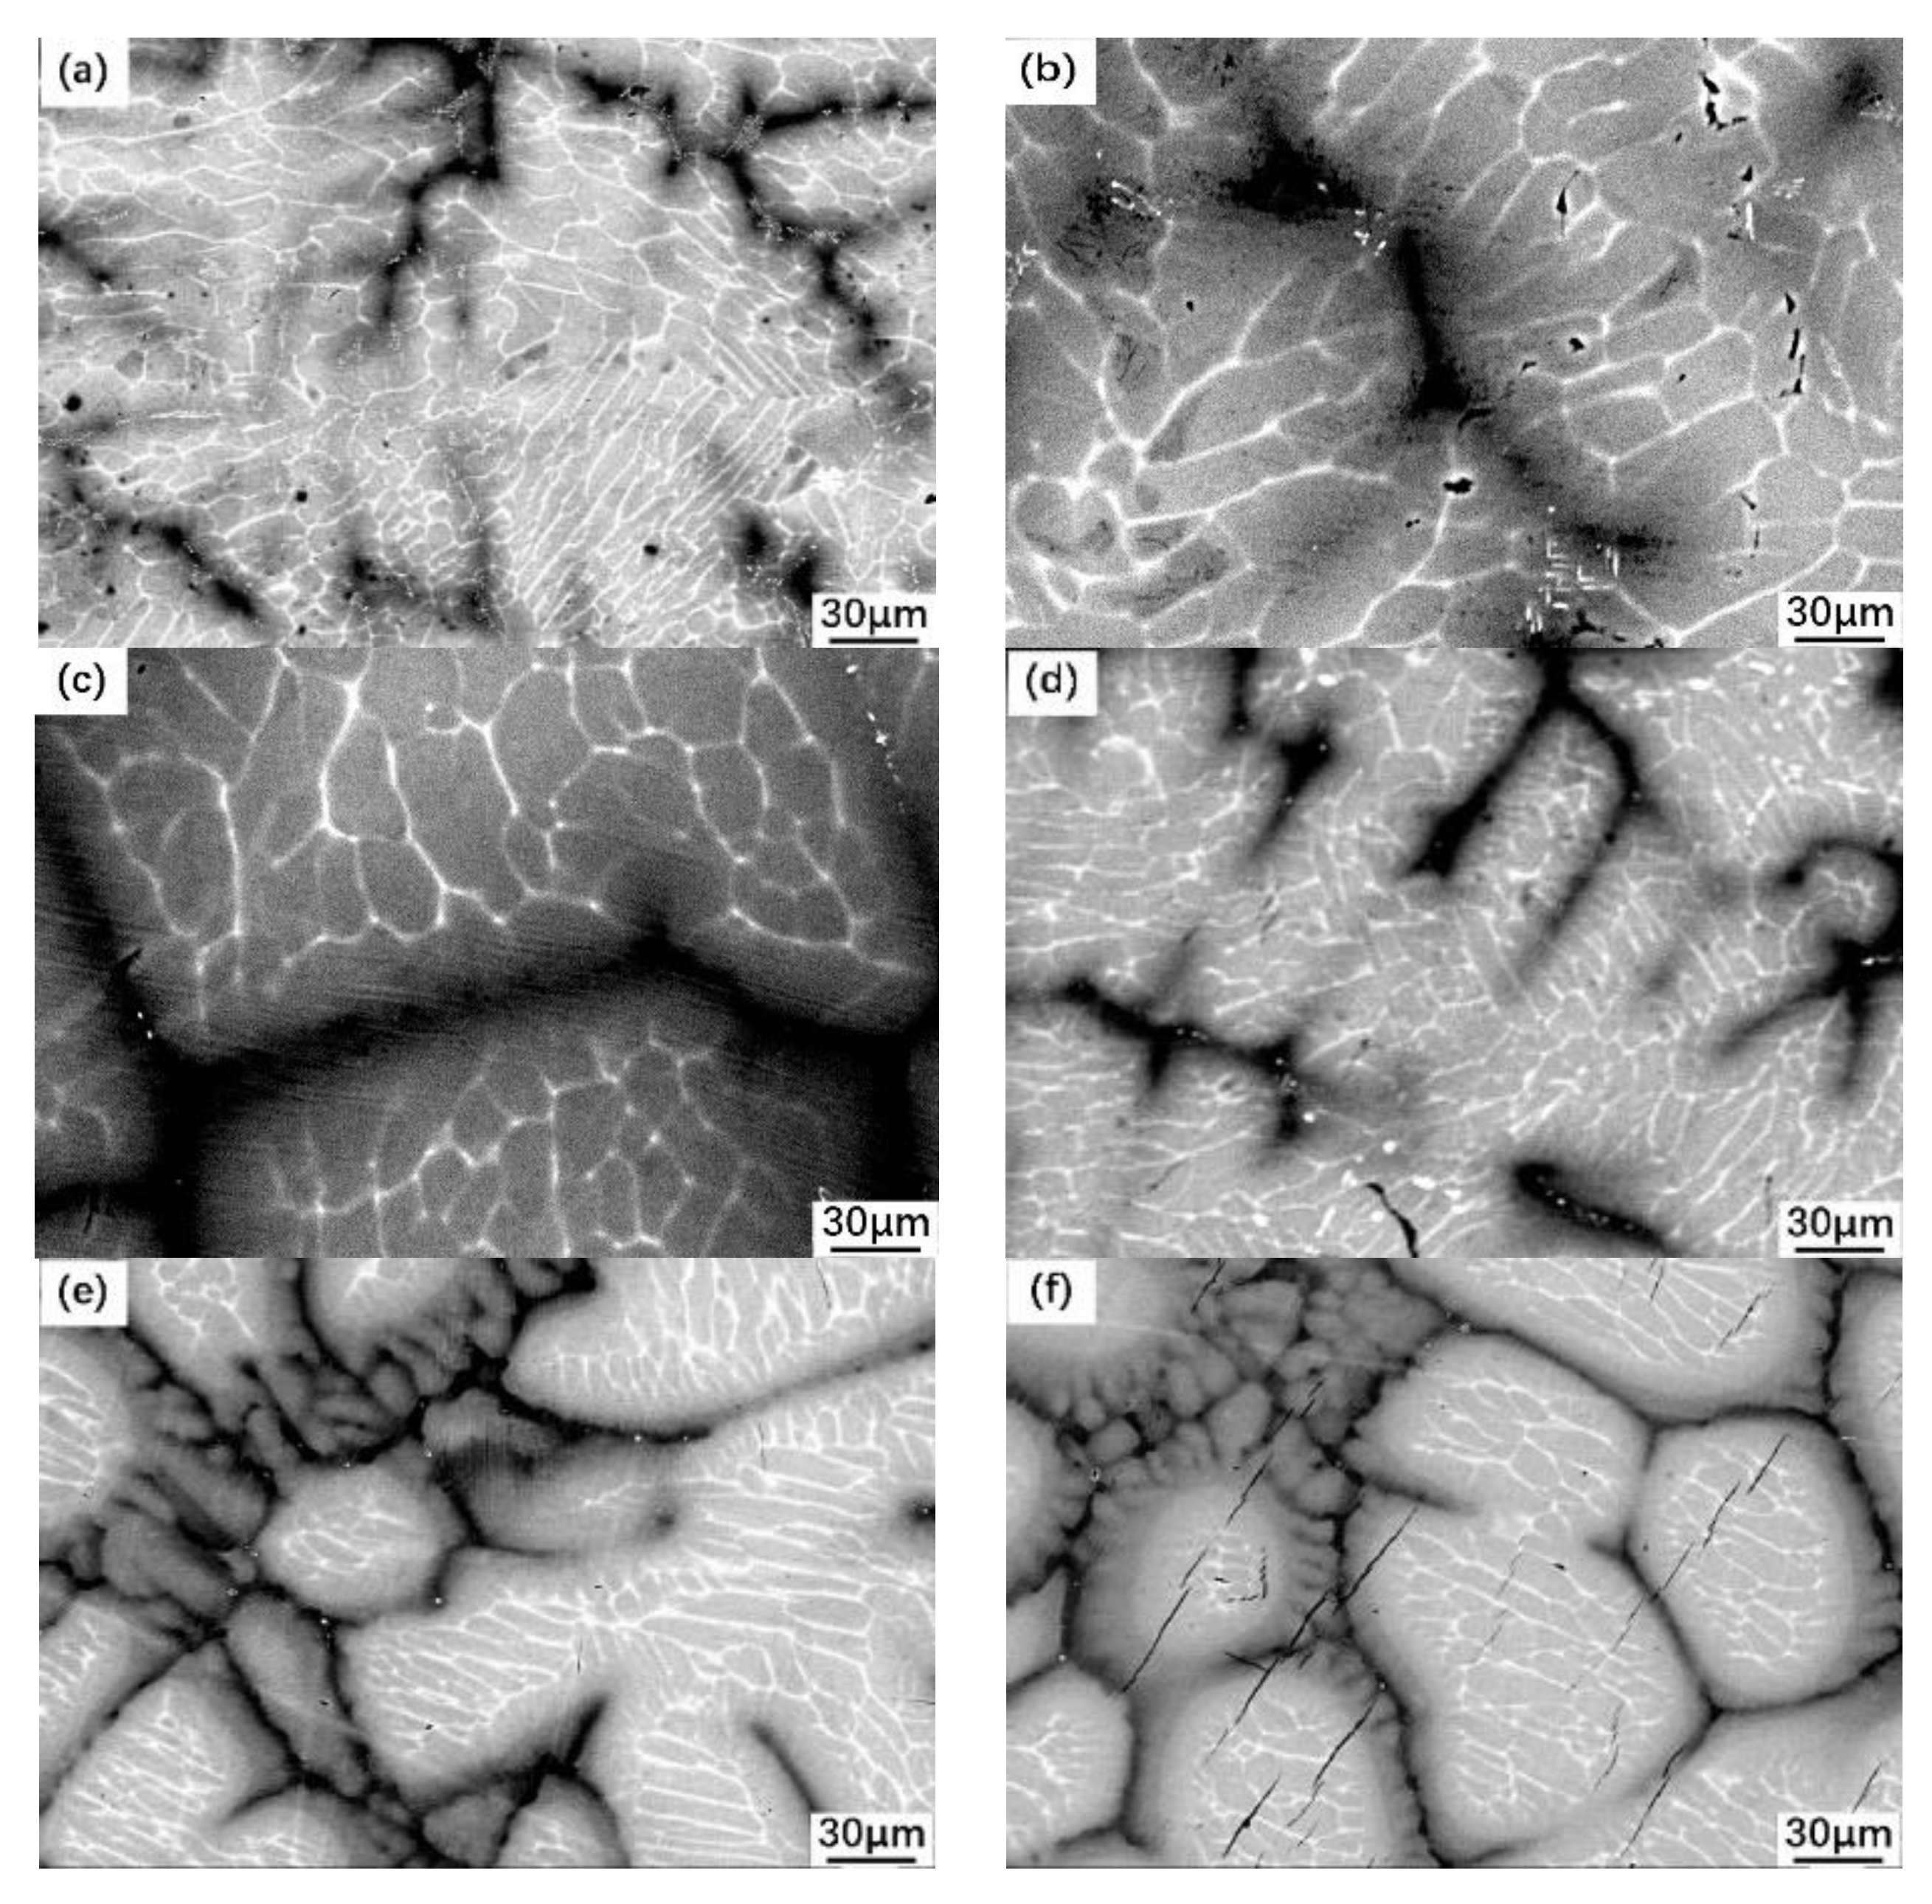
3.1. Peritectic a Phase in Solidificaiton Microstructures

Figure 1 shows EPMA-BSE images of the cross-section microstructures of the Ti-45Al-8Nb alloy ingots solidified at rates of 200 μm/s and 30 μm/s. The ingots solidified at all the rates were dendritic structures. The characteristics of dendrite were more obvious at the high solidification rate for its developed dendrites (Figure 1a), and the structure obtained at the low rate was close to cellular dendrite (Figure 1b). The angle between the secondary dendrite arms was 90°, indicating that the primary solidification phase of the alloy was the β phase with the body-centered cubic lattice. This was consistent with the microstructure predicted by the phase diagrams. The dendrite arm spacing decreased with the increase of solidification rate. Statistic results show that the values of primary dendrite arm spacing of the six ingots were 430 μm, 380 μm, 266 μm, 250 μm, 156 μm, and 128 μm, respectively.
In BSE images, interdendritic zones show black contrast, indicating a high Al content. At this point, detailed characterization is shown in Section 3.2. At higher magnification, a network of fine curves with white contrast could be seen within the dendrites, showing a high Nb or/and Ti content (Figure 2). This was the result of solute distribution during β to α phase transformation. New α grains rich in Al nucleated and grew in β dendrites in a Burgers orientation, i.e., (0001)α//{110}β and <11-20>α//<111>β. Nb is a β forming element and should be poor in the α phase. Thus, the boundaries of α grains were rich in Ti and Nb, forming the white contrast network. Although the β0 phase formed in these regions, it was not detected by XRD spectra in the samples solidified at all rates due to the relatively small volume content. The XRD spectra of the ingots solidified at 400 μm/s and 10 m/s, representing the highest and the lowest solidification rates, are shown in Figure 3. The β0 phase was identified by transmission electron microscopy, which was reported in our previous work [11]. However, the microstructure solidified at lower rates of 30 μm/s and 10 μm/s shows that the contrast of the outermost rim of the dendrite was between those of the dendritic matrix and the interdendritic zone (Figure 2e,f). This indicates that the Al content in the rim of the dendrite was higher than that in the dendritic interior. At high magnification, the rim of the dendrite solidified at a lower rate, which showed a lamellar structure with the same orientation, and no white network existed inside (Figure 4). Therefore, it can be concluded that the rim of the dendrite was the original α phase without undergoing β to α phase transformation.
The microstructure above indicates that, at a slow solidification rate, the β dendrite began to solidify; however, in the final solidification stage, a certain amount of the α phase formed around the initial β dendrite by the L + β→α peritectic reaction. For the dendrites solidified at a cooling rate of 10 μm/s, the thickness of the peritectic reaction α (denoted by αP) layer was 4.2–23 μm, and the volume fraction of the αp was 34%; for the dendrites solidified at a cooling rate of 30 μm/s, the corresponding values were 4.2–22.6 μm and 25%, respectively. The volume fraction of αp decreased with the increase of the solidification rate, such that when the solidification rate was higher than 50 μm/s, no αp could be clearly discerned. The calculated and measured equilibrium phase diagrams shows that there was no peritectic reaction during equilibrium solidification of Ti-45Al-8Nb and Ti-46Al-8Nb alloys [9,13]. The present results show that the solidification path of the final liquid varied with the solidification rate. With the decrease of solidification rate, the solidification path changed from β solidification to β solidification followed by L+β→α peritectic solidification. This is consistent with the results obtained by Hu et al. on the solidification of Ti-48Al-8Nb alloy [14].

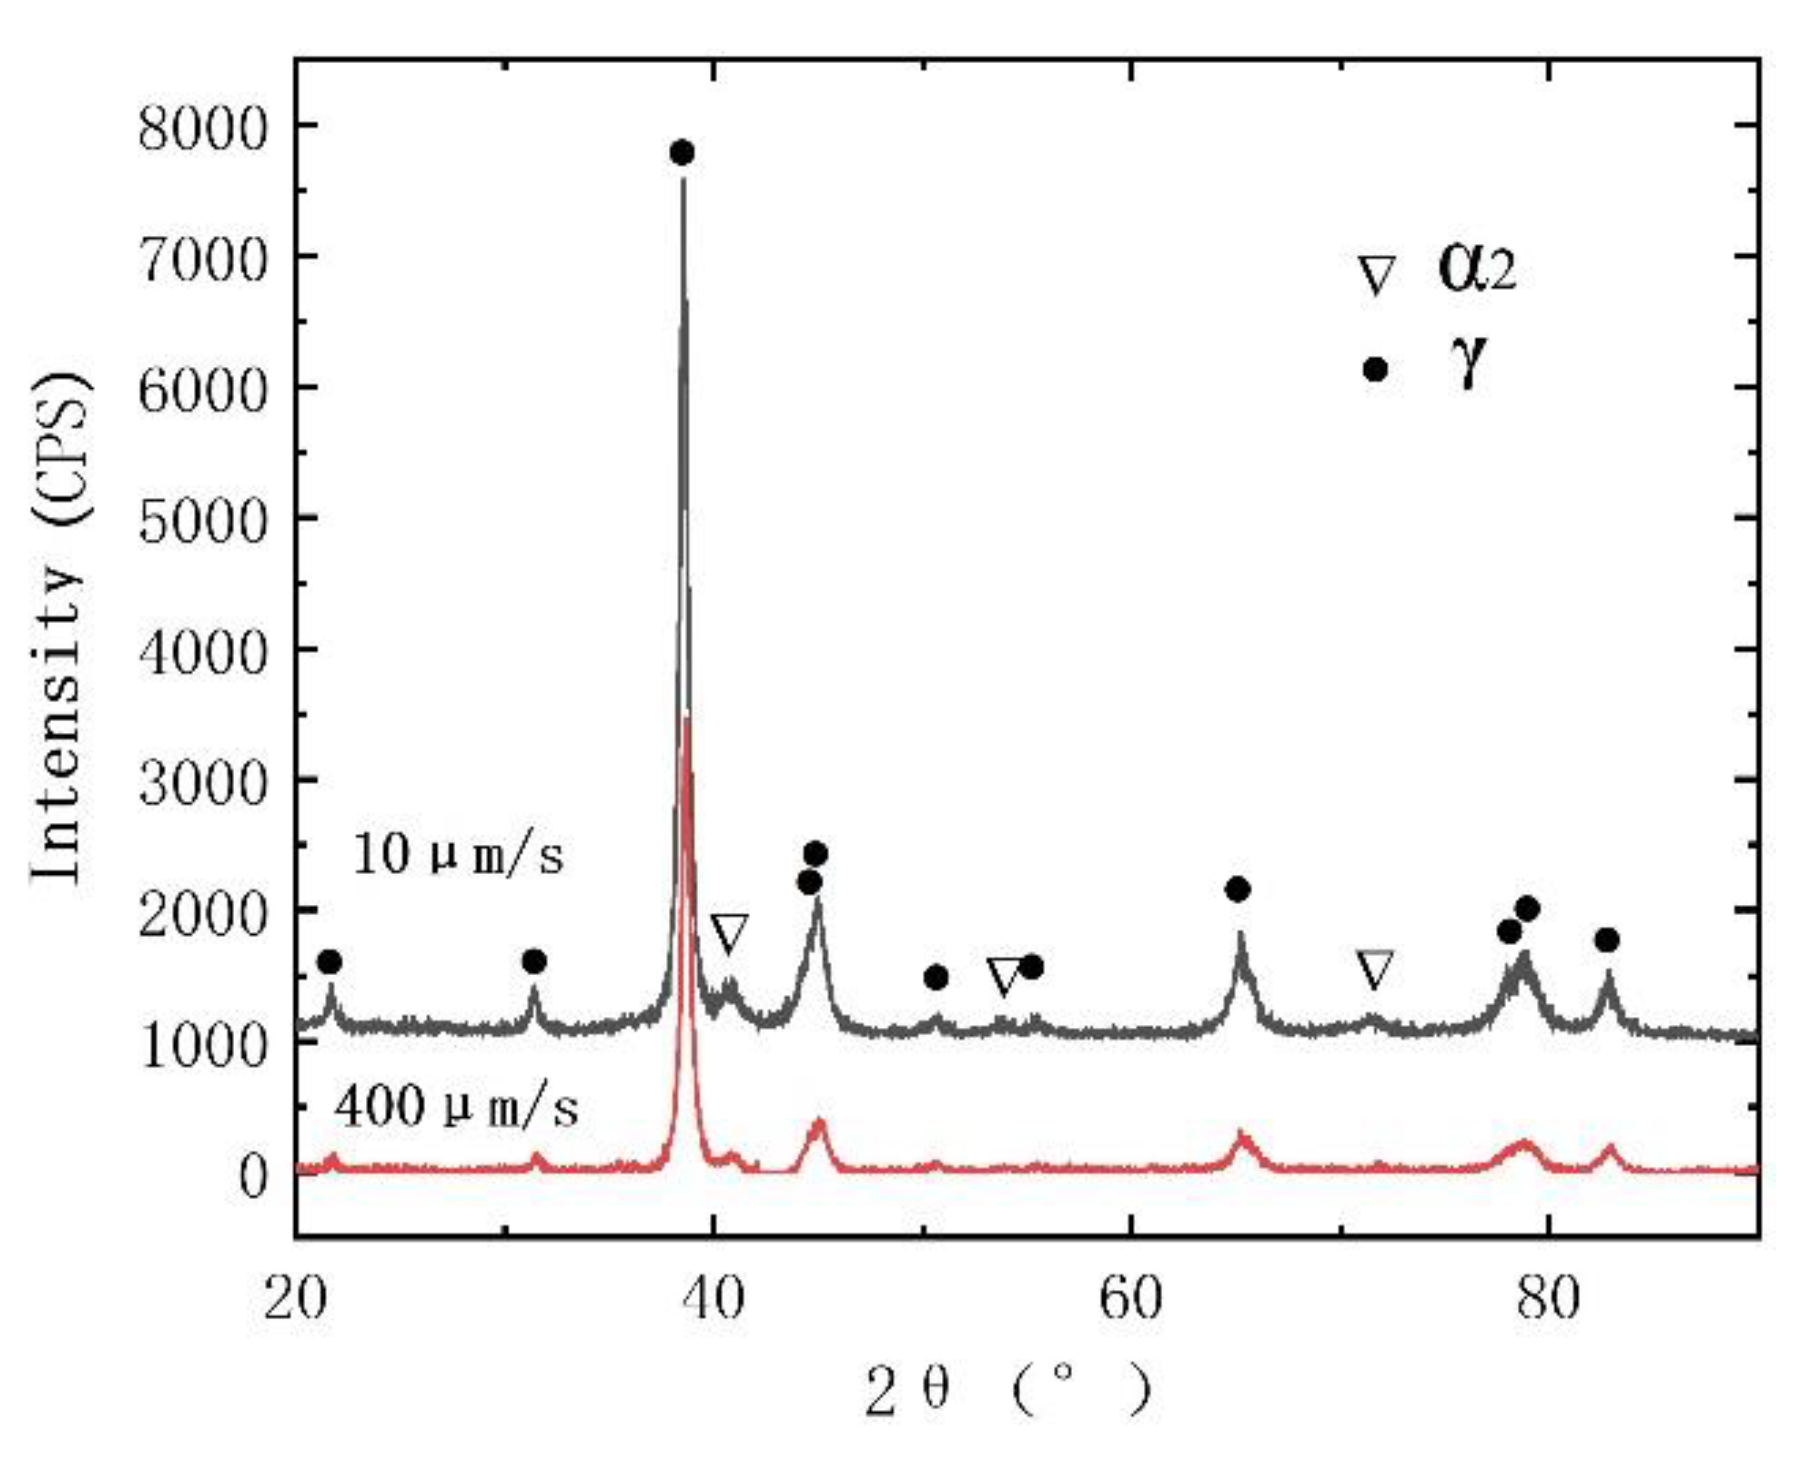
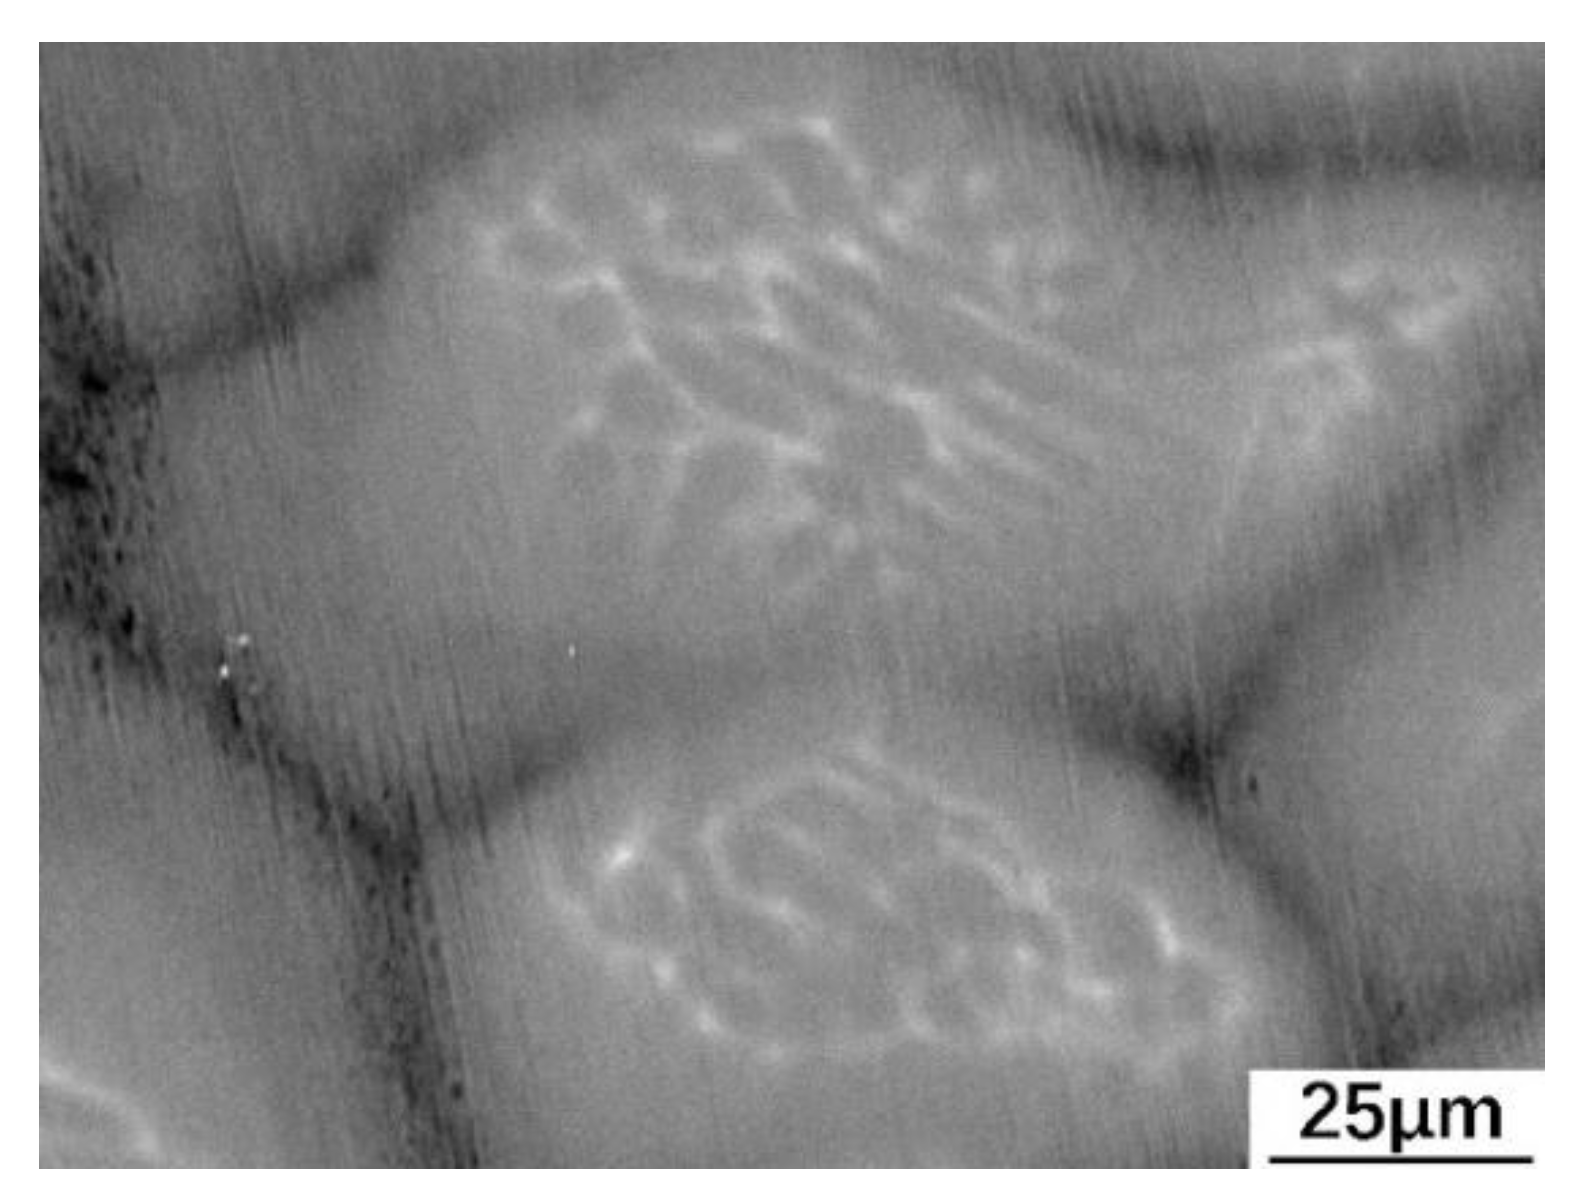
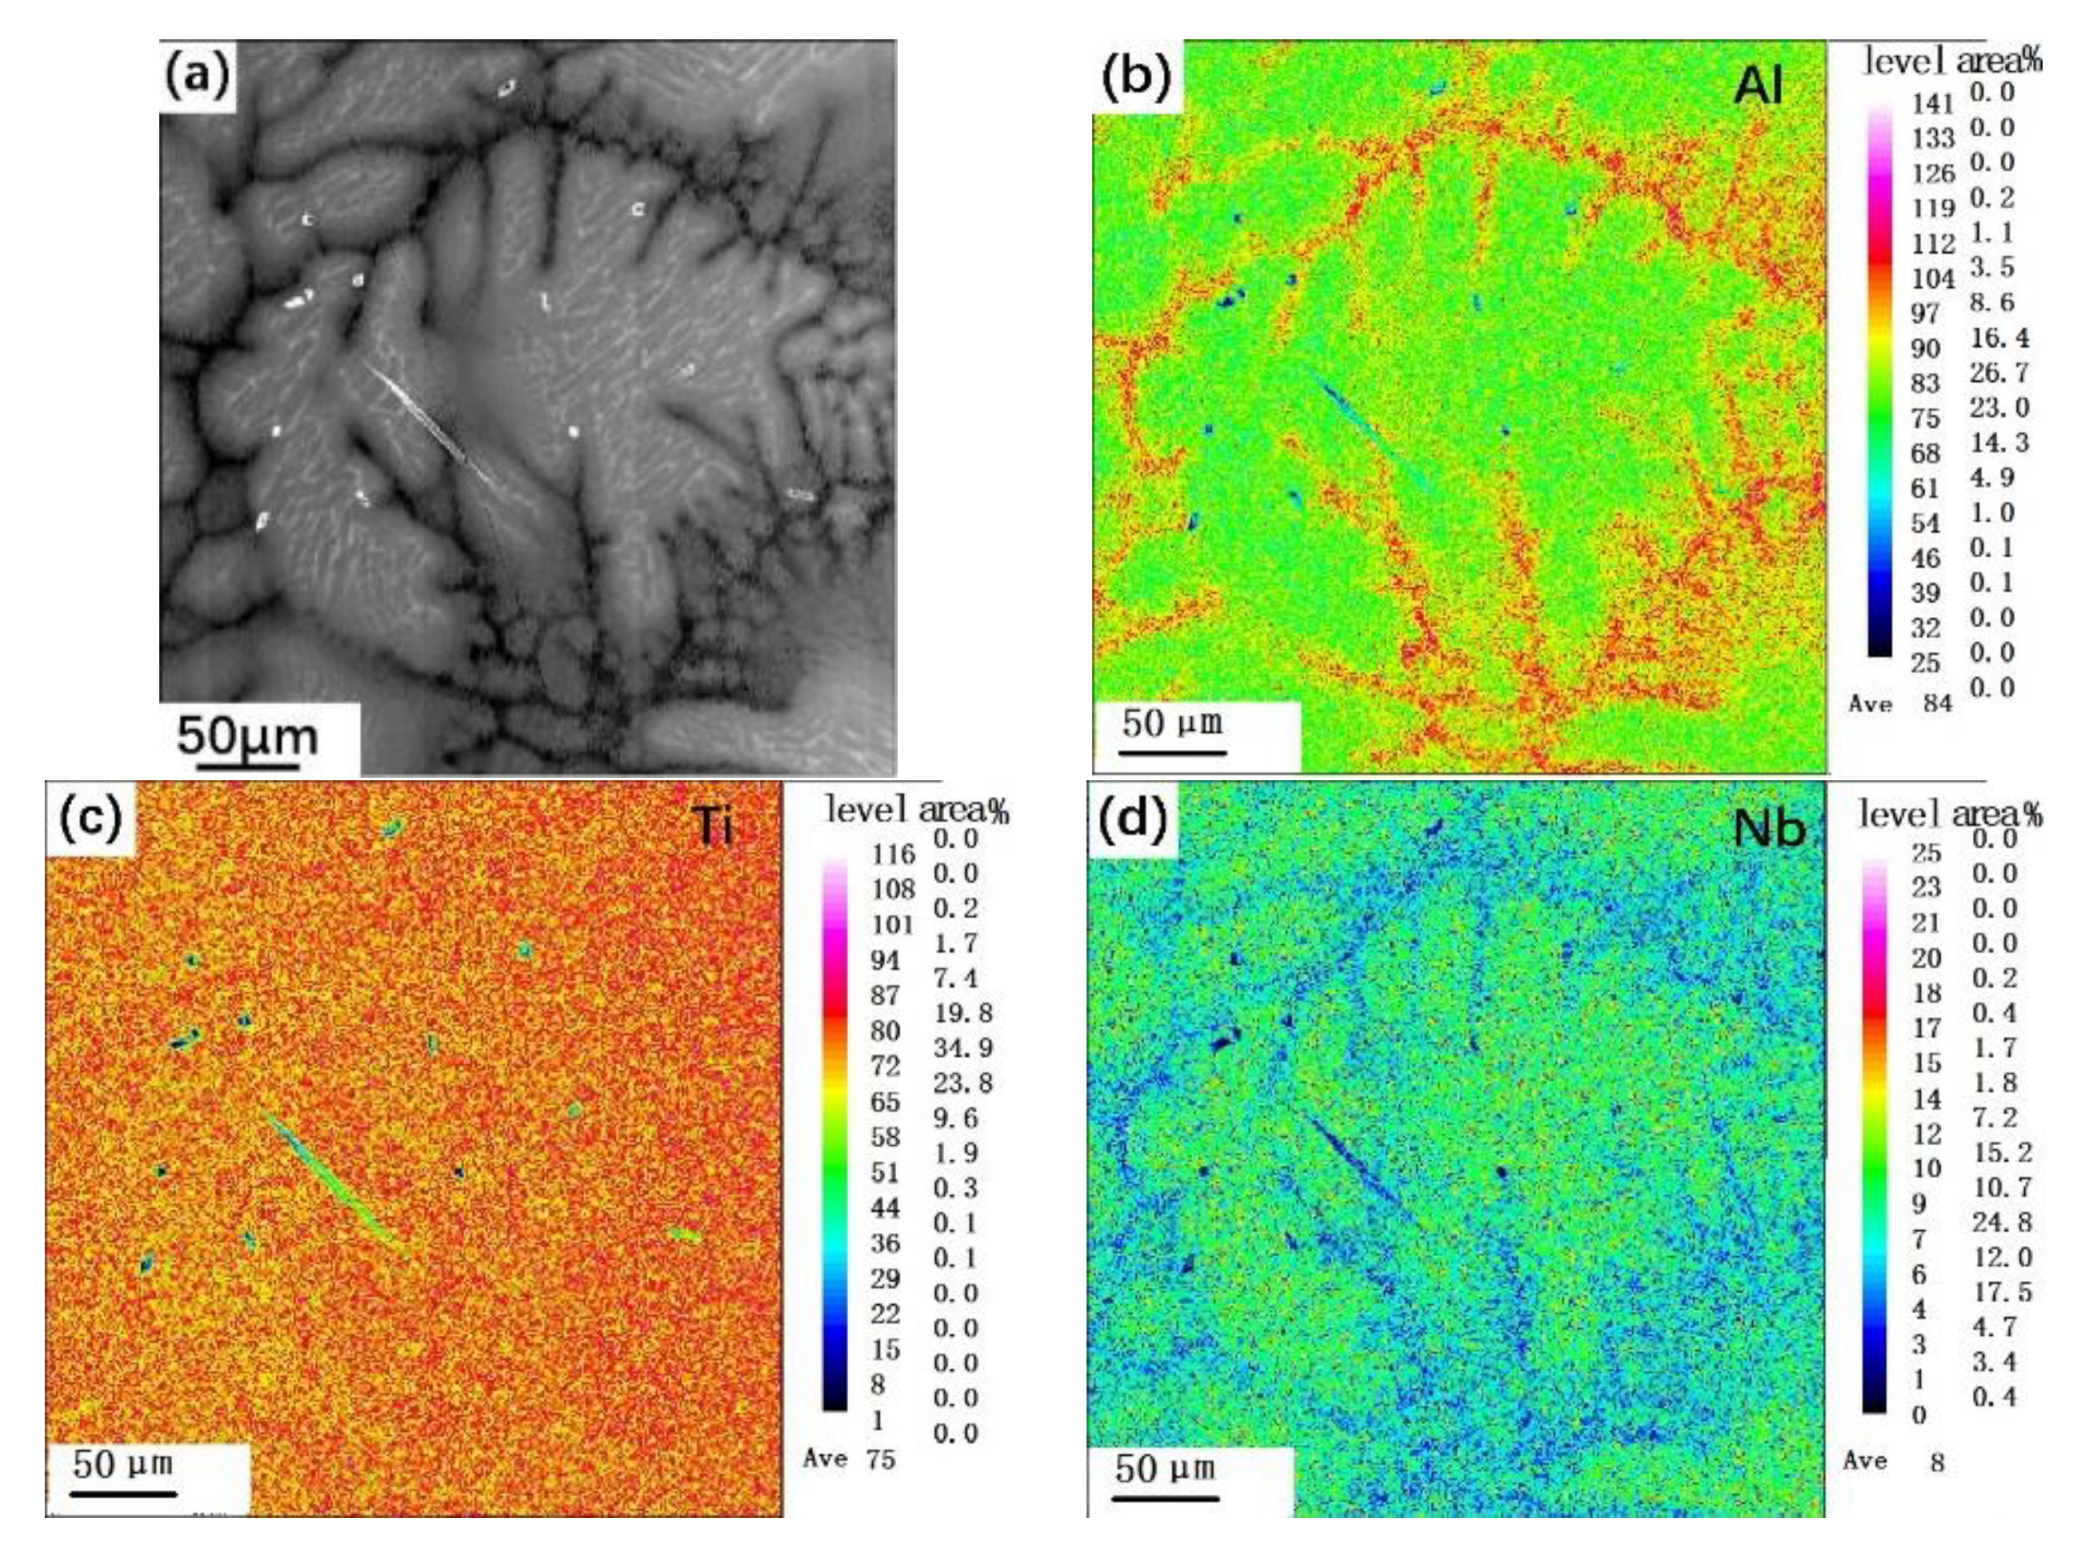
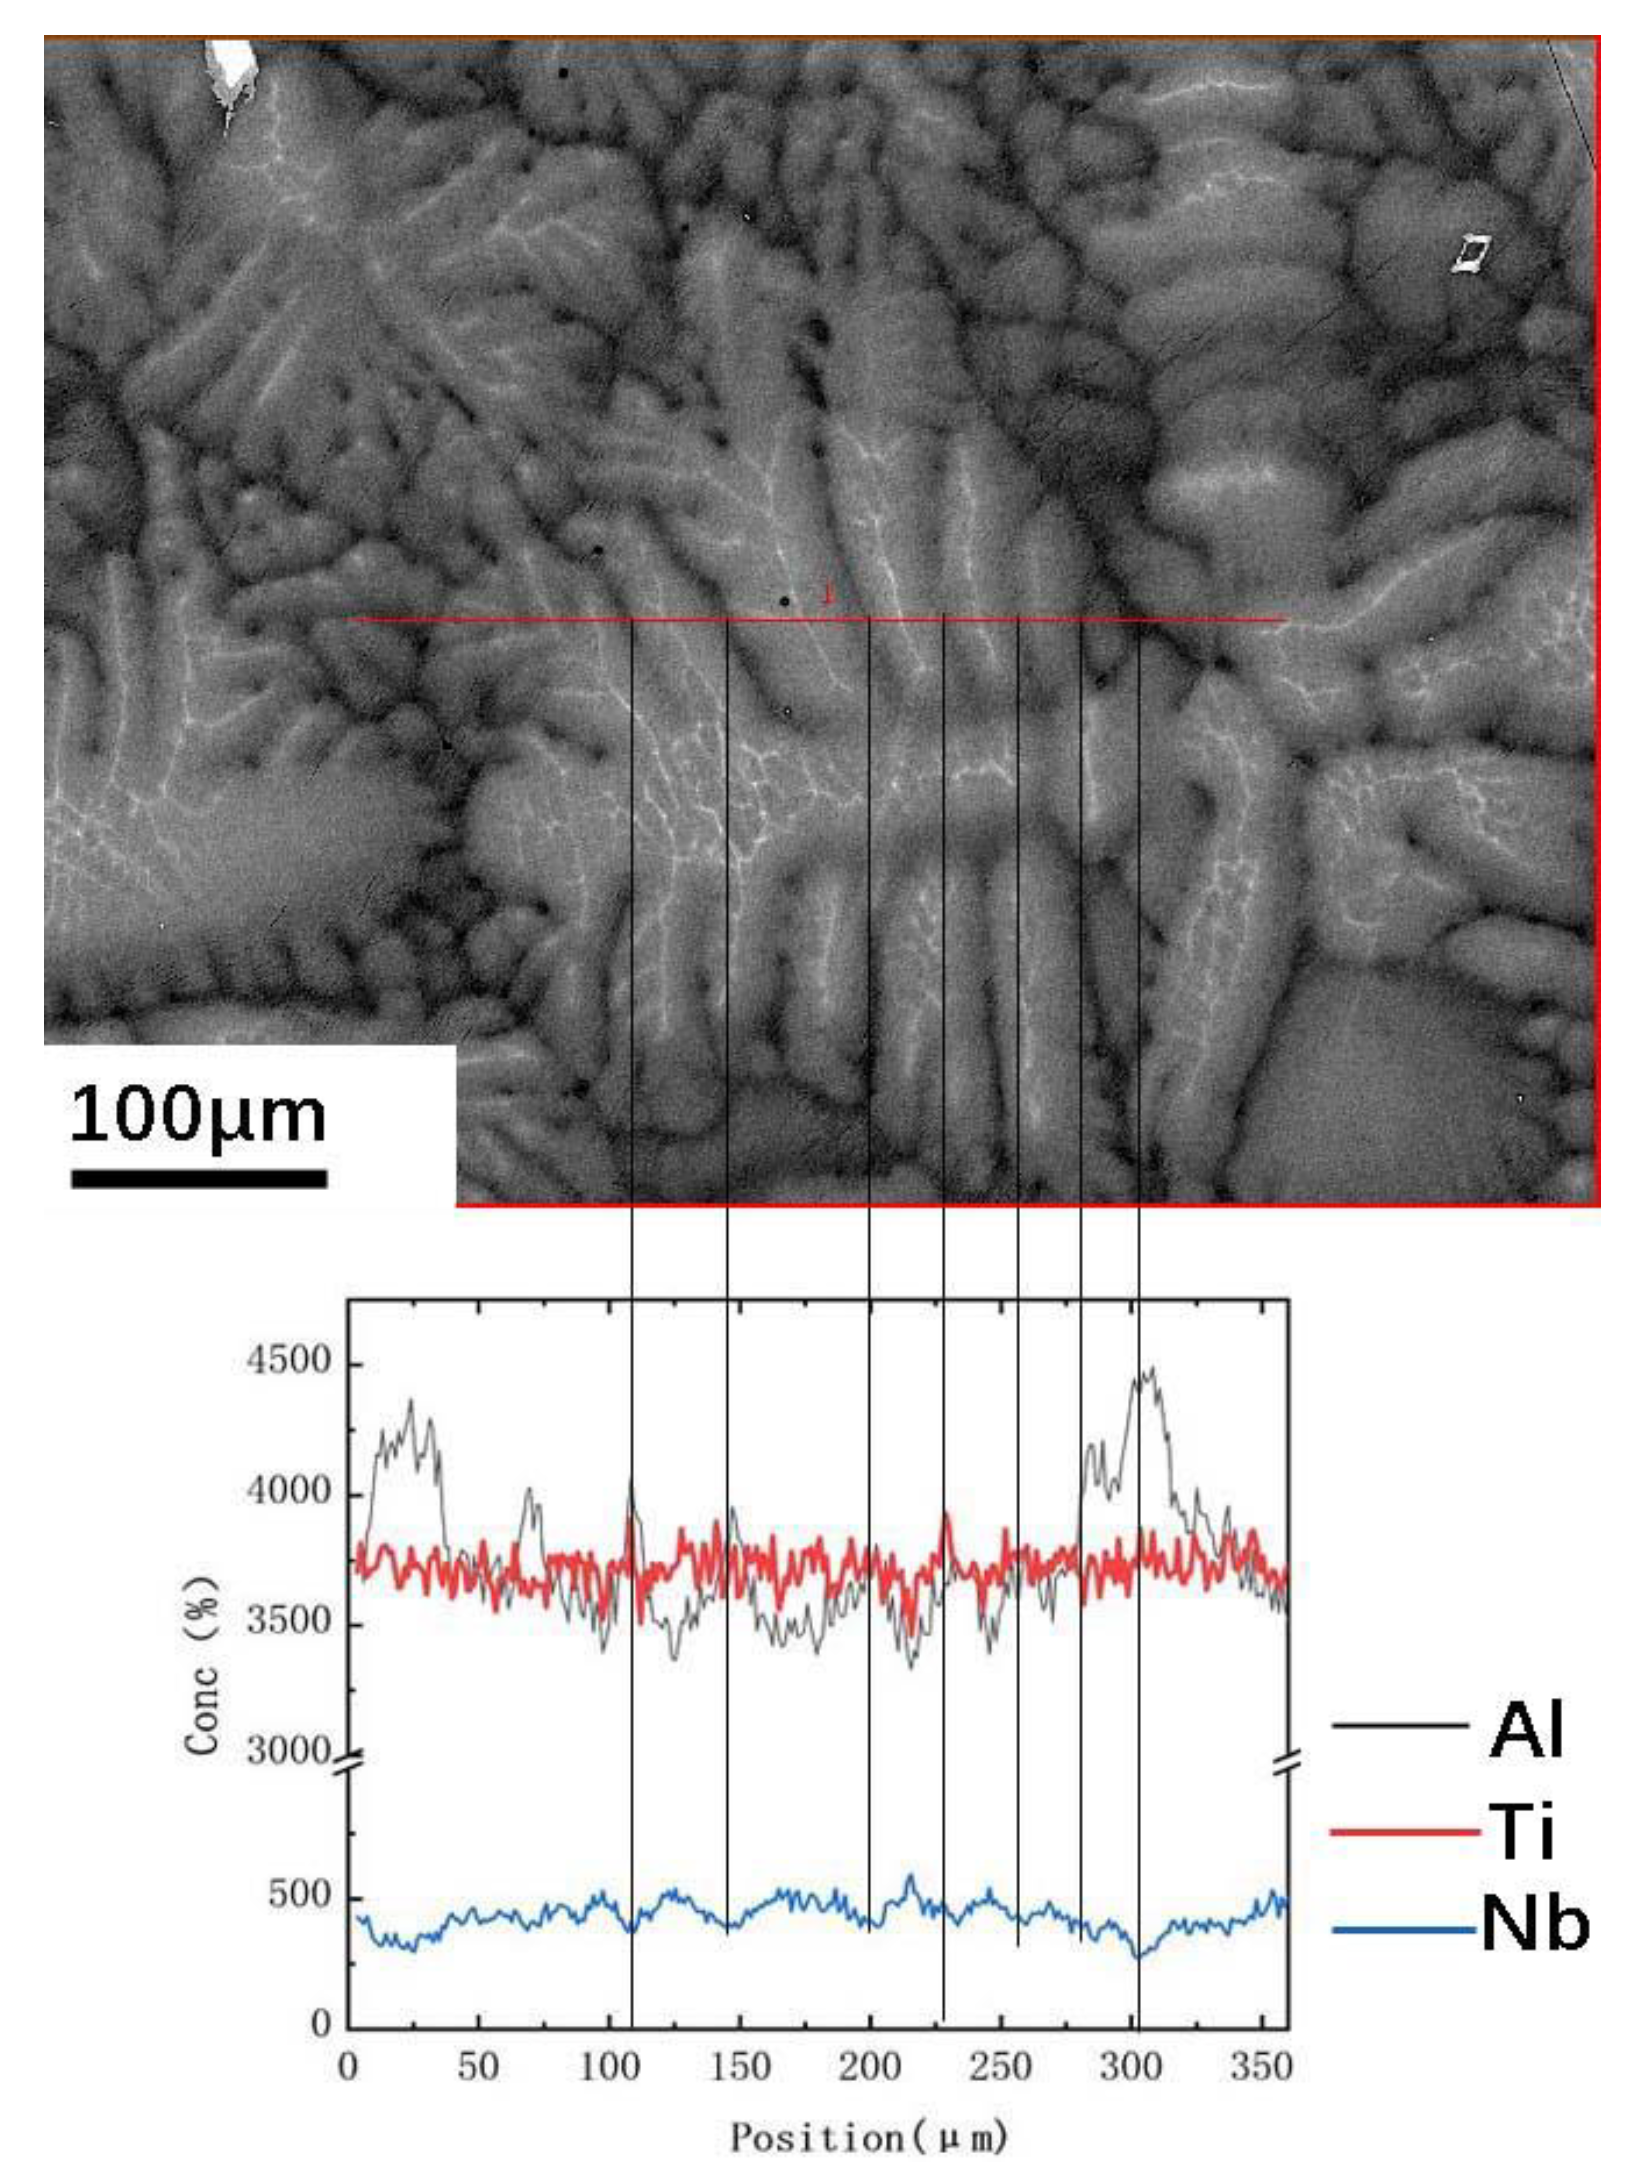
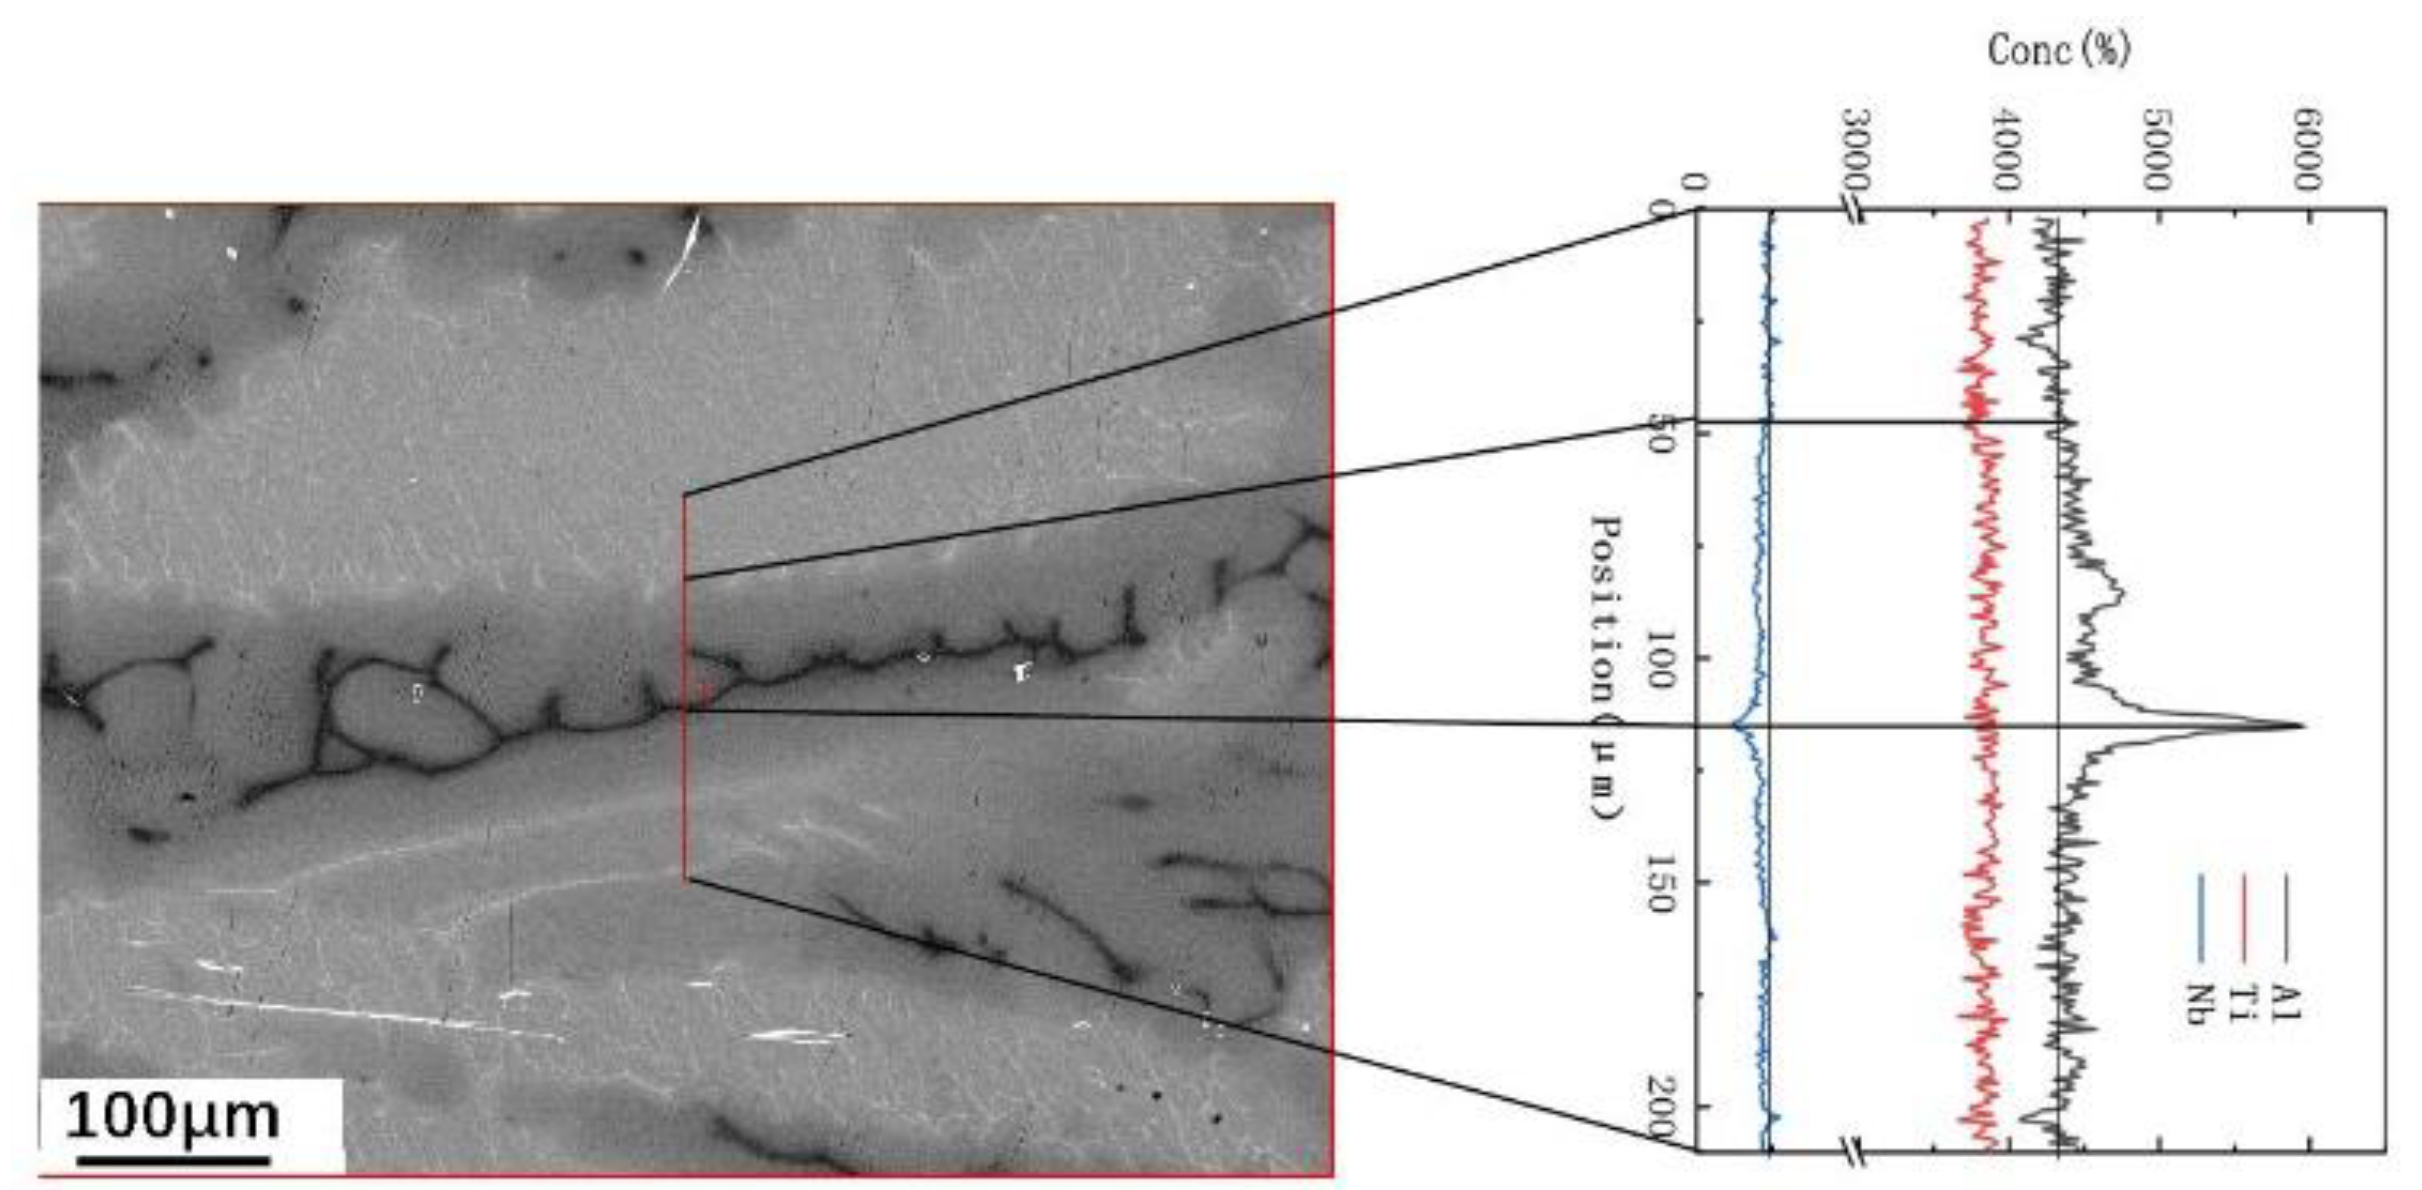
3.2. Distribution of Elements in Peritectic a Phase

Figure 5 shows the distribution of Ti, Al, and Nb in the Ti-45Al-8Nb alloy solidified at 30 μm/s. The difference in composition between the αββ stands for the α phase that directly transformed from β), the β in the dendrite matrix, the αp in the rim of the dendritic arms, and the interdendritic region mainly comes from the fluctuation of Al and Nb. Al was enriched around the interdendritic region, while Nb was rich in the dendrites. This was consistent with the tendency shown by atomic contrast in BSE images. However, it was difficult to distinguish the Ti distribution in the whole field of view. The same results were obtained by the EPMA-WDS line scan analysis. The line profiles of Al, Ti, and Nb concentrations across the tertiary dendrite arms of the Ti-45Al-8Nb alloy are shown in Figure 6. It can also be seen that the composition difference between the interdendritic region and the dendritic arms was obvious, that is, the former was rich in Al and poor in Nb. The Al content was the lowest in the spine of a dendritic arm and increased from the spine to the interdendritic region. The tendency of Nb distribution was the opposite. The reasons and the mechanisms of this phenomenon are revealed in Section 3.3.
The microstructure of the Ti-46Al-8Nb alloy solidified at 30 μm/s with more αp phase was also analyzed by EPMA-WDS line scan analysis to reveal the composition difference between the αp and the αβ phases. The line profiles of Ti, Al, and Nb concentrations in αβ, αP, and the interdendritic zone are shown in Figure 7. In addition to the high Al content in the interdendritic region, it was also obvious that the Nb content in αβ was higher than that in αP. However, the distribution trend of Al content was the opposite in the two microconstituents. Similarly, there was no obvious change of Ti between different parts of the dendrite.
The compositions of 22 points on a line, 63 μm long, across the three regions were quantitatively collected to determine the element distribution in the interdendritic, the αp and the αβ regions. The position and the composition of each point are shown in Figure 8. Points 1–7 were located in the initial dendrite (αβ). It can be seen that the Nb content of these seven points was higher than the actual content 8.02 at%, ranging from 8.13 at% to 8.52 at%. The Al content was 45.11–45.75 at%, which was slightly lower than the actual content 45.89 at%. The Ti content was 45.91–46.36 at%, fluctuating around the actual component 46.09 at%. Points 9–19 were located in the αP phase. The distribution of Nb and Al was relatively uniform in the whole αP. Compared with αβ, the content of Nb in αP was lower, varying from 7.23 at% to 7.72 at%, while the content of Al was higher, varying from 45.94 at% to 46.97 at%. The content of Ti ranged from 46.02 at% to 46.59 at%, showing little difference between these two kinds of α phases. Points 21 and 22 were clearly in the interdendritic region. In this case, Al, Ti, and Nb contents were significantly different from those in dendrite arms. The lowest content of Ti was 42.97 at%, the lowest content of Nb was 5.15 at%, and the highest content of Al was 51.88 at%. In this region, the compositions of Ti, Al, and Nb fluctuated by 6.6%, 12.8%, and 35.6% of their nominal compositions, respectively. On the whole line, the total fluctuation values of Ti, Al, and Nb were 3.39 at%, 6.77 at%, and 3.37 at%, respectively. In terms of absolute value, the fluctuation of Al content was the largest, while the fluctuations of Ti and Nb content were close, but the fluctuation ranges of Ti, Al, and Nb were 7.4%, 14.7%, and 42.1% of their nominal composition, respectively. Therefore, the change of Ti was not obvious in the element line profiles and the element maps.
From the composition analysis in this section and the microstructure analysis in Section 3.1, we can confirm that the composition difference between the β phase in the dendrite and the α phase at its rim was mainly due to the difference of Al and Nb, while the content of Ti in both phases was almost constant. The Nb-rich regions tended to remain as the β phase and become the β0 phase at room temperature [15], while the Al-rich regions formed the α phase either through β→α transformation or through L + β→α peritectic reaction and then became lamellar colonies composed of γ and α2 at room temperature. Such lamellar colonies are predominant in the alloys studied (Figure 3 and Figure 4), and their volume fraction, size, and distribution determine the mechanical properties of the alloys [16,17].

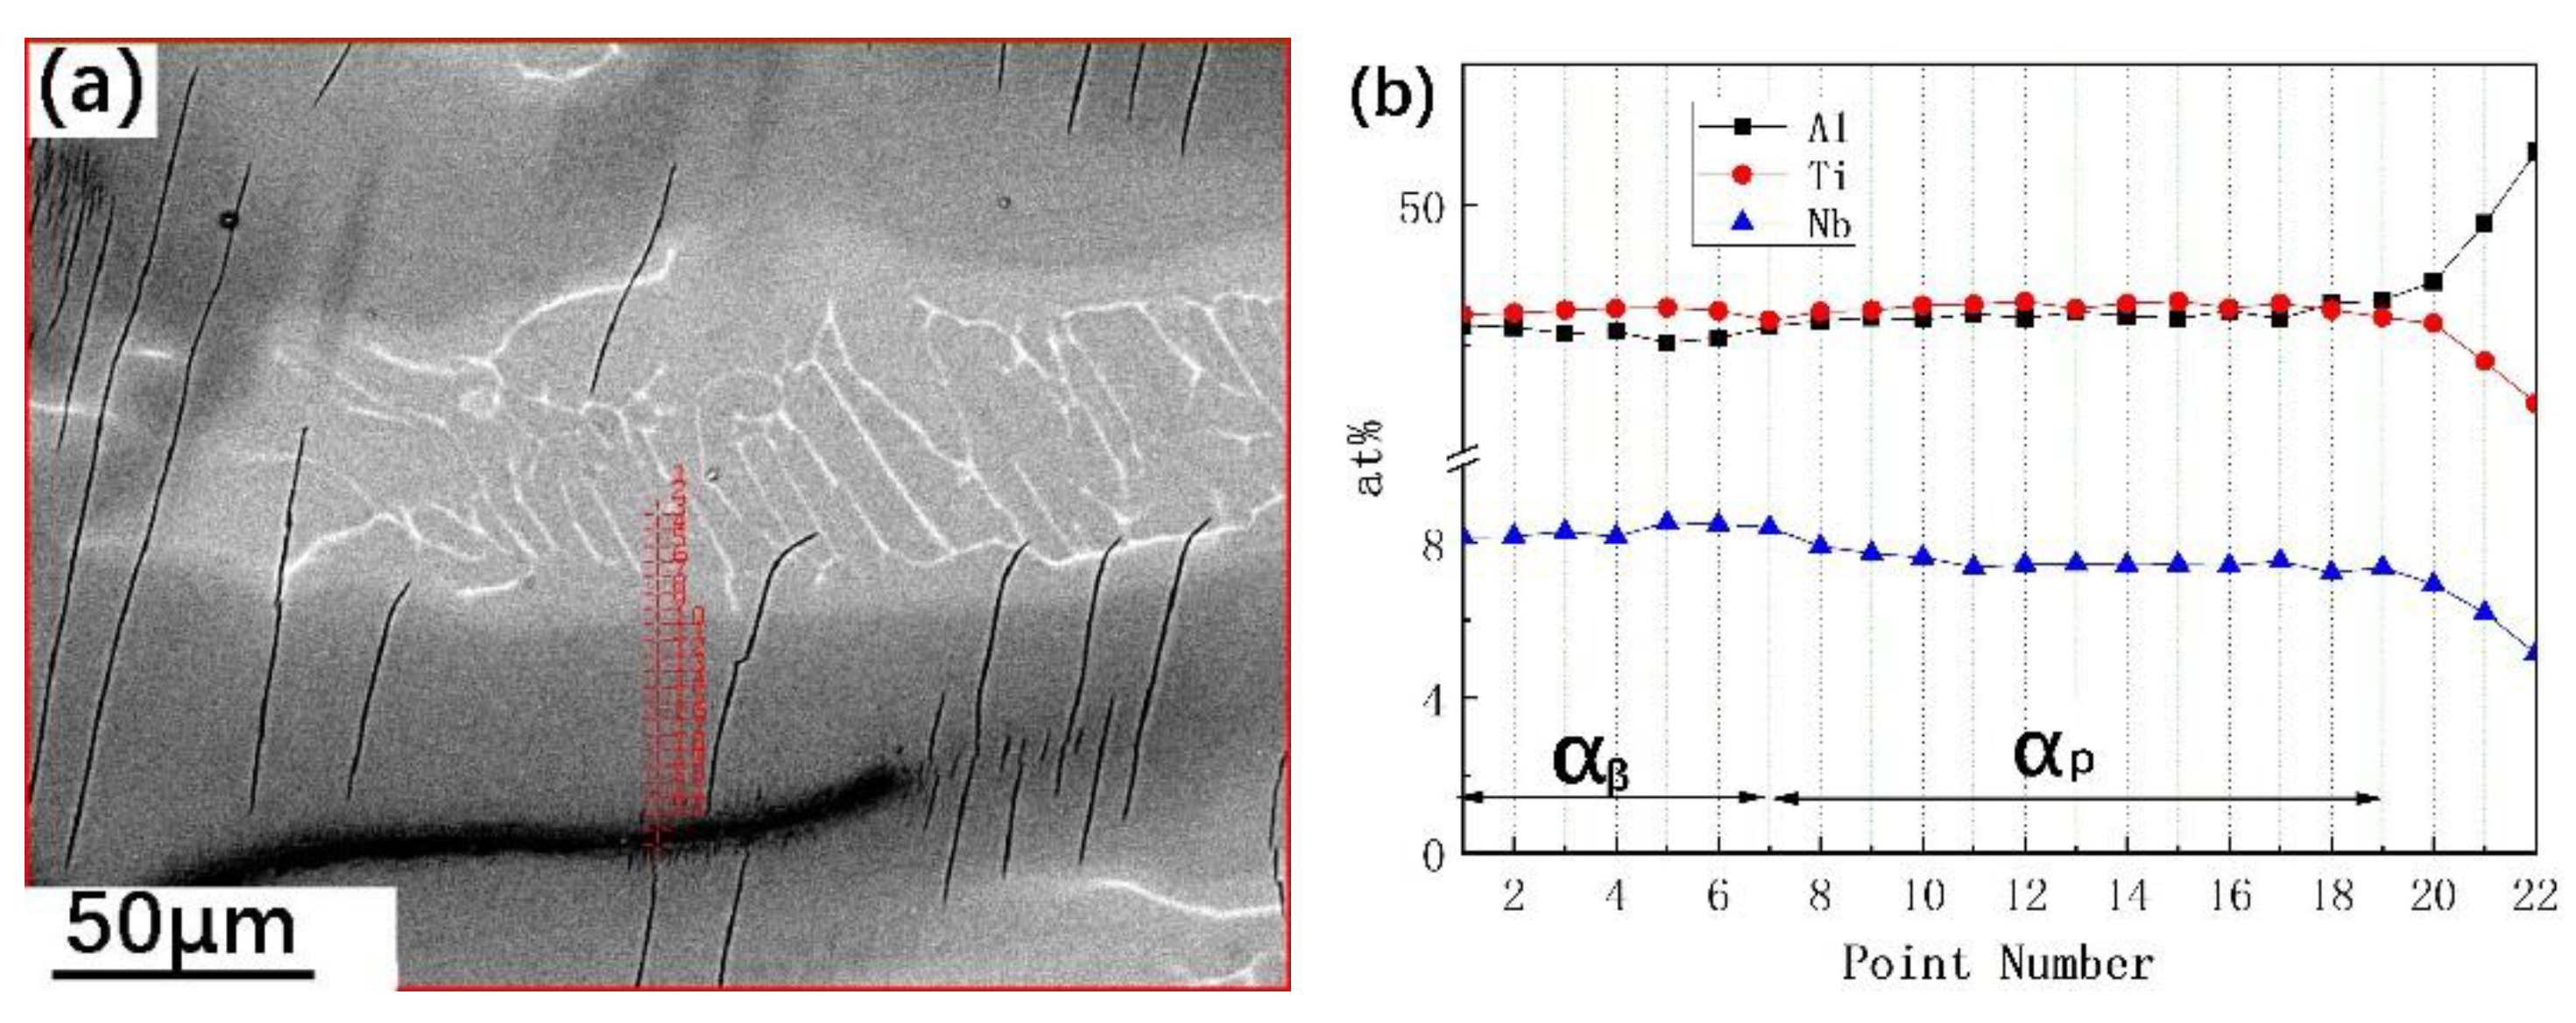
3.3. Effect of Element Distribution on the Peritectic Reaction

For the studied alloys, the change of solidification path in the final solidification zone was caused by solute segregation. If there was no segregation of Al, or if the Al content in liquid phase was less than the peritectic reaction region, the liquid phase should have solidified by the β dendrite. Many α grains then would form within the β phase by obeying the Burgers orientation relationship. This is the morphology that most of the dendrite microstructures appeared as. However, segregation of Al between dendrites led to the composition of the liquid phase in the final solidified part, reaching L + β→α peritectic reaction. Therefore, a peritectic reaction occurred between the rim of the β dendrite and the liquid phase to form a layer of α surrounding β. It is well known that the localized solute enrichments often give rise to the formation of interdendritic eutectic structure in a eutectic alloy system for the alloy with a composition less than the solid solubility limit [18]. In this work, the reason for the occurrence of the peritectic phase in the alloy with non-peritectic composition was the same. The non-equilibrium transformations resulting in the peritectic phase were also found in the Zr-0.8wt%Al alloy beyond the peritectic reaction region because of a zirconium depletion of the melt ahead of the advancing dendritic growth front [19].
The reason for the formation of the αp phase in the Ti-45Al-8Nb alloy is illustrated by the 8 at% Nb containing Ti-Al pseudo-binary phase diagram (Figure 9). Figure 9b is an enlargement and an exaggeration of the region within the red box in Figure 9a. If the alloy solidified in equilibrium, the solid phase β would have formed at the S' point, and with the decrease of temperature, the composition of the β phase would have readjusted along the solidus S'A. When reaching B point, the liquid phase completely transformed into the β solid phase with a composition of Ti-45Al-8Nb. However, the actual average component of the β phase might have changed along the S'A' line because the solute in the dendrite could not diffuse evenly and completely during solidification. When the peritectic reaction temperature was reached, the alloy composition fell into the peritectic reaction region, such as the peritectic line extended to PA', and intersected the line of alloy composition at B', thus the alloy underwent L + β→α peritectic reaction. Moreover, due to the enrichment of Al in the final solidified liquid phase, the actual composition of the liquid was closer to the original peritectic reaction region, as shown by the dashed vertical line in Figure 9b. The lack of Nb content in this zone also induced its corresponding peritectic reaction region to move towards the lower Al side. This was evident when comparing the thin dotted line (Ti-Al binary phase diagram without Nb) in Figure 9a with the corresponding solid line. Johnson et al. reported that a 1 at% Nb decrease in Nb containing TiAl alloy could lead to the phase region moving 0.2 at%–0.3 at% to the Ti side [20]. This also synergistically caused the residual liquid phase to be located in the peritectic reaction region. Therefore, although the actual solidification situation is very complex, the nonequilibrium solidification and its resultant Al and Nb segregation generally result in peritectic solidification in high Nb containing TiAl alloys that theoretically do not have a peritectic solidification. From Figure 9, it is not difficult to understand why more αP phase appears in the Ti-46Al-8Nb alloy.
Generally speaking, a slow solidification rate is beneficial to the equilibrium solidification of the alloy, while a high solidification rate leads to the solidification path deviating from equilibrium. High solidification rates and short solidification times make the diffusion of solute elements in dendrites less adequate. Therefore, with the increase of solidification rate, the solute segregation may become more pronounced. However, we measured the Al distribution in the ingots with different solidification rates and found an opposite trend [11]. With the decrease of solidification rate, the Al content in the final solidified zone was higher, i.e., the extent of segregation was more severe for the ingot with a low solidification rate. Therefore, a peritectic reaction is likely to occur in the ingots with low solidification rate.
For the above anomalies, it can be attributed that the influence of dendritic size and morphology on Al segregation is more significant than that of diffusion time. During solidification, the morphology of dendrites affects the liquid fluidity in the solid–liquid two phase region. The fluidity is proportional to the permeability coefficient (K) of the liquid phase. H. Ishida et al. claimed:
K = g L 2 λ 2 2 8 π τ 3
where g L is the volume fraction of the liquid phase, λ2 is the secondary dendrite arm spacing, and τ is the tortuosity coefficient [21]. With the increase of solidification rate, the spacing of the secondary dendrite arms becomes smaller, and the tertiary dendrite arms become more developed, resulting in the increase of τ of solidification structure and the decrease of liquid fluidity. Through the phase field simulation, H. Ishida et al. found that the permeability coefficient of an alloy cooling at 100 K/s was lower than that cooling at 50 K/s in an Fe-C alloy. They believed that, in order to reduce the segregation of the alloy, it was necessary to reduce the permeability of the mushy zone. For the present study, the fluidity of the final solidified interdendritic liquid phase was very large in the ingots with lower cooling rates, and the solute was easy to concentrate in the interdendritic zone and thus led to more severe segregation. Meanwhile, strong accumulation of the solute in the liquid at the solid–liquid interface accelerated the back-diffusion in the solid for the large solute gradient, thus increasing the solid concentration. This further reduced the segregation of the interdendritic zone and was more effective for the high rate solidified ingot with finer dendritic arms. Additionally, small dendrite arms were less likely to expel a higher amount of solute than large dendrite arms because of the smaller total solute content in the local area.

4. Conclusions

By analyzing the microstructures and the compositions of the directionally solidified ingots of Ti-45Al-8Nb and Ti-46Al-8Nb alloys, the following conclusions are drawn:
(1) For the TiAl alloys containing Al content less than the L + α→β pertectic reaction region, the final solidified part produces the peritectic α phase under slow rate solidification. The change of the solidification path is caused by compositional segregation. The slower the solidification rate is, the more severe the compositional segregation is, and the more volume fraction of the peritectic α phase will be produced.
(2) In high Nb containing TiAl alloys, there is little difference in the Ti content between different parts of the dendrites, and the segregation is mainly caused by Nb and Al. The composition of the peritectic α phase is different from that of the α phase transformed from the β phase. The Al content of the former is about 1 at% higher than that of the latter, while the Nb content is about 1at% lower than that of the latter.

Author Contributions

X.X.: Conceptualization, methodology, funding acquisition, writing original manuscript. J.L.: design guide, writing assistance, funding acquisition. C.X.: investigation. Y.L.: design guide, writing assistance. All authors have read and agreed to the published version of the manuscript.

Funding

This research was supported by the State Key Laboratory for Advanced Metals and Materials, University of Science and Technology Beijing (2018-ZD02), and the National Natural Science Foundation of China (no. 51831001). The work was also supported by the Yangtze Normal University talent introduction research project (2017KYQD30).

Institutional Review Board Statement

Not applicable.

Informed Consent Statement

Not applicable.

Data Availability Statement

The data used in this article are presented in the manuscript.

Conflicts of Interest

The authors declare no conflict of interest.

References

  1. Appel, F.; Paul, J.D.H.; Oehring, M. Gamma Titanium Aluminide Alloys: Science and Technology; Wiley-VCH Verlag GmbH and Co. KGaA: Weinheim, Germany, 2011; pp. 1–3. [Google Scholar]
  2. Pflumm, R.; Friedle, S.; Schütze, M. Oxidation protection of γ-TiAl-based alloys-A review. Intermetallics 2015, 56, 1–14. [Google Scholar] [CrossRef]
  3. Kim, Y.W.; Kim, S.L. Advances in gammalloy materials-processes-application technology: Successes, dilemmas, and future. JOM 2018, 70, 553–560. [Google Scholar] [CrossRef] [Green Version]
  4. Bewlay, B.P.; Weimer, M.; Kelly, T.; Suzuki, A.; Subramanian, P.R. The science, technology, and implementation of TiAl alloys in commercial aircraft engines. Mater. Res. Soc. Symp. Proc. 2013, 1516, 49–57. [Google Scholar] [CrossRef]
  5. Witusiewicz, V.T.; Bondar, A.A.; Hecht, U.; Rex, S.; Velikanova, T.Y. The Al-B-Nb-Ti system: III. Thermodynamic re-evaluation of the constituent binary system Al-Ti. J. Alloys. Compd. 2008, 456, 64–77. [Google Scholar] [CrossRef]
  6. Lin, J.P.; Zhao, L.L.; Li, G.Y.; Zhang, L.Q.; Song, X.P.; Ye, F.; Chen, G.L. Effect of Nb on oxidation behavior of high Nb containing TiAl alloys. Intermetallics 2011, 19, 131–136. [Google Scholar] [CrossRef]
  7. Lin, J.P.; Xu, X.J.; Wang, Y.L.; He, S.F.; Zhang, Y.; Song, X.P.; Chen, G.L. High temperature deformation behaviors of a high Nb containing TiAl alloy. Intermetallics 2007, 15, 668–674. [Google Scholar] [CrossRef]
  8. Gao, S.; Xu, X.; Shen, Z.; Ye, T.; Xu, S.; Lin, J. Microstructure and properties of forged plasma arc melted pilot ingot of Ti-45Al-8.5Nb-(W, B, Y) alloy. Mater. Sci. Eng. A 2016, 677, 89–96. [Google Scholar] [CrossRef]
  9. Chen, G.L.; Xu, X.J.; Teng, Z.K.; Wang, Y.L.; Lin, J.P. Microsegregation in high Nb containing TiAl alloy ingots beyond laboratory scale. Intermetallics 2007, 15, 625–631. [Google Scholar] [CrossRef]
  10. Song, L.; Zhang, L.Q.; Xu, X.J.; Sun, J.; Lin, J.P. Omega phase in as-cast high-Nb-containing TiAl alloy. Scr. Mater. 2013, 68, 929–932. [Google Scholar] [CrossRef]
  11. Xu, X.; Song, L.; Jin, X.; Han, D.; Wang, X.; Lin, J. Microstructure and microsegregation of directionally solidified Ti-45Al-8Nb alloy with different solidification rates. Rare Met. 2016, 35, 70–76. [Google Scholar] [CrossRef]
  12. Xu, X.; Hu, R.; Lin, J.; Guo, J. Evolution of Microstructure and Microsegregation of Ti-45Al-8Nb Alloy during Directional Solidification. Adv. Mater. Sci. Eng. 2018, 2018, 1713835. [Google Scholar] [CrossRef] [Green Version]
  13. Witusiewicz, V.T.; Bondar, A.A.; Hecht, U.; Velikanova, T.Y. The Al–B–Nb–Ti system: IV. Experimental study and thermodynamic re-evaluation of the binary Al-Nb and ternary Al-Nb-Ti systems. J. Alloys Compd. 2009, 472, 133–161. [Google Scholar] [CrossRef]
  14. He, T.; Hu, R.; Yang, J.; Fu, H. Phase selection and solidification path transition of Ti–48Al–xNb alloys with different cooling rates. Rare Met. 2017, 1–8. [Google Scholar] [CrossRef]
  15. Clemens, H.; Mayer, S. Design, processing, microstructure, properties, and applications of advanced intermetallic TiAl alloys. Adv. Eng. Mater. 2013, 15, 191–215. [Google Scholar] [CrossRef]
  16. Niu, H.Z.; Chen, X.J.; Chen, Y.F.; Zhao, S.; Liu, G.H.; Zhang, D.L. Microstructural stability, phase transformation and mechanical properties of a fully-lamellar microstructure of a Mo-modified high-Nb γ-TiAl alloy. Mater. Sci. Eng. A 2020, 748, 139313. [Google Scholar] [CrossRef]
  17. Imayev, V.; Oleneva, T.; Imayev, R.; Christ, H.-J.; Fecht, H.-J. Microstructure and mechanical properties of low and heavy alloyed γ-TiAl + α2-Ti3Al based alloys subjected to different treatments. Intermetallics 2012, 26, 91–97. [Google Scholar] [CrossRef]
  18. Liu, Y.L.; Kang, S.B. Solidification and segregation of Al-Mg alloys and influence of alloy and influence of alloy composition and cooling rate. Mat. Sci. Tech. 1997, 13, 331–336. [Google Scholar] [CrossRef]
  19. Ses, E.; Billdal, H. Non-equilibrium solidification of hyperperitetic Al-Zr alloys. Acta Metal. 1977, 25, 1031–1037. [Google Scholar]
  20. Johnson, D.R.; Inui, H.; Muto, S.; Omiya, Y.; Yamanaka, T. Microstructural development during directional solidification of α-seeded TiAl alloys. Acta Metal. 2006, 54, 1077–1085. [Google Scholar] [CrossRef]
  21. Ishida, H.; Natsume, Y.; Ohsasa, K. Characterization of dendrite morphology for evaluating interdendritic fluidity based on phase-field simulation. ISIJ Int. 2009, 49, 37–43. [Google Scholar] [CrossRef] [Green Version]
Figure 1. Microstructures of cross-section of the ingots solidified at 200 μm/s (a) and 30 μm/s (b).
Metals 11 01386 g001
Figure 2. The dendrites solidified at different rates: (a) 400 μm/s; (b) 200 μm/s; (c) 100 μm/s; (d) 50 μm/s; (e) 30 μm/s; (f) 10 μm/s.
Metals 11 01386 g002
Figure 3. XRD patterns of Ti-45Al-8Nb alloy solidified at 400 μm/s and 10 μm/s.
Metals 11 01386 g003
Figure 4. The rim of the dendrite of Ti-45Al-8Nb alloy solidified at 30 μm/s.
Metals 11 01386 g004
Figure 5. EPMA-BSE image (a) and compositional maps for Al (b), Ti (c), and Nb (d) of Ti-45Al-8Nb alloy solidified at 30 μm/s.
Metals 11 01386 g005
Figure 6. Line profiles of Al, Ti, and Nb concentrations across the tertiary dendrite arms of Ti-45Al-8Nb alloy solidified at 30 μm/s.
Metals 11 01386 g006
Figure 7. Line profiles of Al, Ti, and Nb concentrations across the primary dendrite arm of Ti-46Al-8Nb alloy solidified at 30 μm/s.
Metals 11 01386 g007
Figure 8. Element content of each microconstituent in the Ti-46Al-8Nb alloy solidified at 30 μm/s: (a) morphology of dendrites and the location of test points; (b) compositions of the points.
Metals 11 01386 g008
Figure 9. The 8 at% Nb containing Ti-Al quasi-phase diagram (a) and an enlargement of the region within the red box (b), which is distorted for illustrative purposes, reproduced from [9], with permission of Elsevier 2007.
Metals 11 01386 g009
Publisher’s Note: MDPI stays neutral with regard to jurisdictional claims in published maps and institutional affiliations.

