Article

Relative Density Measurement of PBF-Manufactured 316L and AlSi10Mg Samples via Eddy Current Testing

1
Inspire AG, Innovation Center for Additive Manufacturing Switzerland (ICAMS), Fürstenlandstrasse 122, 9014 St. Gallen, Switzerland
2
Swiss Federal Institute of Technology, ETH Zurich, Institute of Machine Tools and Manufacturing (IWF), Leonhardstrasse 21, 8092 Zurich, Switzerland
3
Sensima Inspection SARL, 2 Route Cité Ouest, 1196 Gland, Switzerland
*
Author to whom correspondence should be addressed.
Metals 2021, 11(9), 1376; https://doi.org/10.3390/met11091376
Submission received: 2 August 2021 / Revised: 25 August 2021 / Accepted: 26 August 2021 / Published: 31 August 2021

Abstract

:
Powder bed fusion (PBF) is the most commonly used additive manufacturing process for fabricating complex metal parts via the layer-wise melting of powder. Despite the tremendous recent technological development of PBF, manufactured parts still lack consistent quality in terms of part properties such as dimensional accuracy, surface roughness, or relative density. In addition to process-inherent variability, this is mainly owing to a knowledge gap in the understanding of process influences and the inability to adequately control them during part production. Eddy current testing (ECT) is a well-established nondestructive testing technique primarily used to detect near-surface defects and measure material properties such as electrical conductivity in metal parts. Hence, it is an appropriate technology for the layer-wise measuring of the material properties of the fused material in PBF. This study evaluates ECT’s potential as a novel in situ monitoring technology for relative part density in PBF. Parts made from SS316L and AlSi10Mg with different densities are manufactured on a PBF machine. These parts are subsequently measured using ECT, as well as the resulting signals correlated with the relative part density. The results indicate a statistically significant and strong correlation (316L: r(8) = 0.998, p < 0.001, AlSi10Mg: r(8) = 0.992, p < 0.001) between relative part density and the ECT signal component, which is mainly affected by the electrical conductivity of the part. The results indicate that ECT has the potential to evolve into an effective technology for the layer-wise measuring of relative part density during the PBF process.

1. Introduction

In the last decade, additive manufacturing technologies have evolved from rapid prototyping to established manufacturing technologies that are increasingly used in industrial production. Powder bed fusion (PBF) is the most commonly used additive manufacturing process for fabricating metal parts, and has evolved to a state-of-the-art technology adopted in various industrial fields such as aerospace, medical, defence, as well as tool, and mould making [1,2]. The PBF process is characterized by the layer-wise melting of a powder bed using a laser beam; hence it enables the direct manufacturing of complex-shaped parts. Despite the tremendous recent technological development of PBF, Debroy et al. [3] identified the lack of consistent part quality as a major challenge impeding the wider commercial adoption of PBF. Part quality is mainly characterized by mechanical properties such as Young’s modulus, and part properties such as dimensional accuracy, surface roughness, and relative density [4]. Process-inherent variability, a remaining knowledge gap in understanding the influences on part quality, and the inability to adequately control these influences during part production are the main reasons for inconsistent part quality [3]. In situ process monitoring technologies are expected to play a major role in obtaining consistent part quality in the future by improving the repeatability of the process as stated by Debroy et al. [3]. The majority of in situ monitoring technologies available today focus on monitoring the melt pool shape, size, or temperature [4,5,6,7,8,9,10,11]. Melt pool monitoring could be a reasonable choice for real-time controlling process parameters, such as laser power, which can help to avoid pore formation owing to local overheating of the melt pool [12]. However, owing to the nature of the PBF process, each solidified layer is remolten at least once. Hence, initially present defects can be healed, as determined by Ulbricht et al. [13], and new ones introduced during the layer remelting. Therefore, only the material integrity of the layer after remelting is relevant for the quality of the part. Although, there have been attempts to spatially map defects via melt pool monitoring [6,14], the detection of defects, which were not artificially introduced, lacks reliability. Owing to the inability to reliably monitor the part quality during production, the part certification for industrial use still requires a brute force approach, which involves time-consuming and expensive material tests such as CT scanning [3].
Eddy current testing (ECT) is a standardized nondestructive testing technique [15] that is adopted in various industries to control and certify the quality of electrically conductive parts. ECT can detect surface and near-surface defects such as cracks [16], as well as measure material properties such as electrical conductivity [17]. The industrial application of ECT to PBF remains limited to the quality control of parts during post-processing [18]. This limits the testable area of the part to the region near the surface. In contrast, integrating ECT into the PBF process cycle enables the layer-wise measurement of previously fused layers that provides quality information on the entire part volume after finishing the build cycle. Therefore, the ability of ECT to measure surface and near-surface defects fits well into the layer-wise build process in PBF. Available studies on ECT as a monitoring technology for PBF are summarized as follows: Todorov et al. [19] developed and patented a sensor array and method [20] and integrated it into a laboratory PBF machine. The system was tested in situ on parts with artificially introduced defects such as notches and regions of unfused material, being able to detect these defects. The authors claim that the regions of unfused material with sizes of 10 × 3 × 0.12 mm3 and 10 × 3 × 0.044 mm3 are good representations of lack of fusion in PBF. However, research on defect formation in PBF suggests that lack of fusion pores are often smaller than 100 μm in diameter [3]. Ehlers et al. [21] developed a sensor array using giant magnetoresistance (GMR) sensors and studied the capability of the system to detect artificially introduced surface defects in a wrought sample and in a PBF-manufactured sample both made from 316L stainless steel. However, the majority of defects in PBF-manufactued parts are located below the surface [22]. Both of the study presented by Todorov et al. [19] and Ehlers et al. [21] used parts with artificially introduced defects to demonstrate the capability of their ECT systems falling short of providing evidence that real defects caused during the PBF process can be detected reliably. In contrast to detecting individual defects, measuring the porosity of a certain part volume, including regions beyond the remelting zone, is an alternative approach to monitoring the process and part quality. Eisenbarth et al. [23] adopted ECT to identify unique keys designed by introducing porosity in 316L samples by adjusting the process parameters on an industrial PBF machine. However, the authors did not achieve the required sensitivity to distinguish between all different PBF samples sufficiently well and did not compare the ECT results to the relative sample density. Obatron et al. [24] studied ECT’s ability to distinguish between PBF-manufactured lattice structures with different overall densities by measuring the electrical conductivity of the lattice. Hippert [25] used a similar approach correlating the electrical conductivity of the sample with its relative density. However, Hippert used samples with large artificially introduced holes and could only distinguish between samples with a density difference of 4% relative density. Nevertheless, the approach of Hippert and Obaton et al. is promising if sufficiently small relative part density differences in PBF-manufactured parts can be measured.
In this study, the feasibility of ECT to measure relative part density variations owing to defects caused by the PBF process is evaluated. The prerequisite is that the electrical conductivity which can be measured by ECT is sufficiently correlated with the relative part density. To investigate this, parts made from AlSi10Mg and 316L stainless steel are manufactured on a PBF machine with varied process parameters to create different densities caused by lack of fusion and keyhole. The parts are subsequently measured using ECT and the results correlated with the relative part density.

2. Materials and Methods

2.1. Part Production

One cuboid part per scan speed with a size of 25 × 30 × 10 mm3 was manufactured using a Concept Laser M2 PBF machine (Concept Laser GmbH, Lichtenfels, Germany) with the process parameters presented in Table 1. An additional cube per scan speed with a size of 10 × 10 × 10 mm3 was fabricated in close proximity to the cuboid parts to study the pore distribution and the melt pool shape. Gas atomized PBF powders by the Carpenter Technology Corporation were used with particle size distributions of 15–45 µm (316L) and 10–60 µm (AlSi10Mg). All parts were fabricated on a 1-mm thick support structure onto 245 × 245-mm2 build plates and afterwards removed by wire cutting.

2.2. Part Characterization

The relative part density of the cuboid parts was measured via the Archimedes method, utilizing an AE200 balance with the measuring unit AB33360 (Mettler Toledo Inc., Columbus, OH, USA). The cubes were cut perpendicular to the scan direction of the top layer, embedded in epoxy resin, ground using SiC grinding paper (320, 600 and 1200 grit sizes), and polished up to 0.5 μm using SiO2 suspension. Images showing the porosity in the cross sections were taken at 50× magnification using a DM6 optical microscope (Leica Microsystems GmbH, Wetzlar, Germany). To reveal the melt pool boundaries, the 316L parts were etched in V2A etchant at 60 °C for 60 s, and the AlSi10Mg parts were etched in NaOH at room temperature for 12 s. The melt pools were subsequently characterized using the aforementioned optical microscope.

2.3. Eddy Current Testing

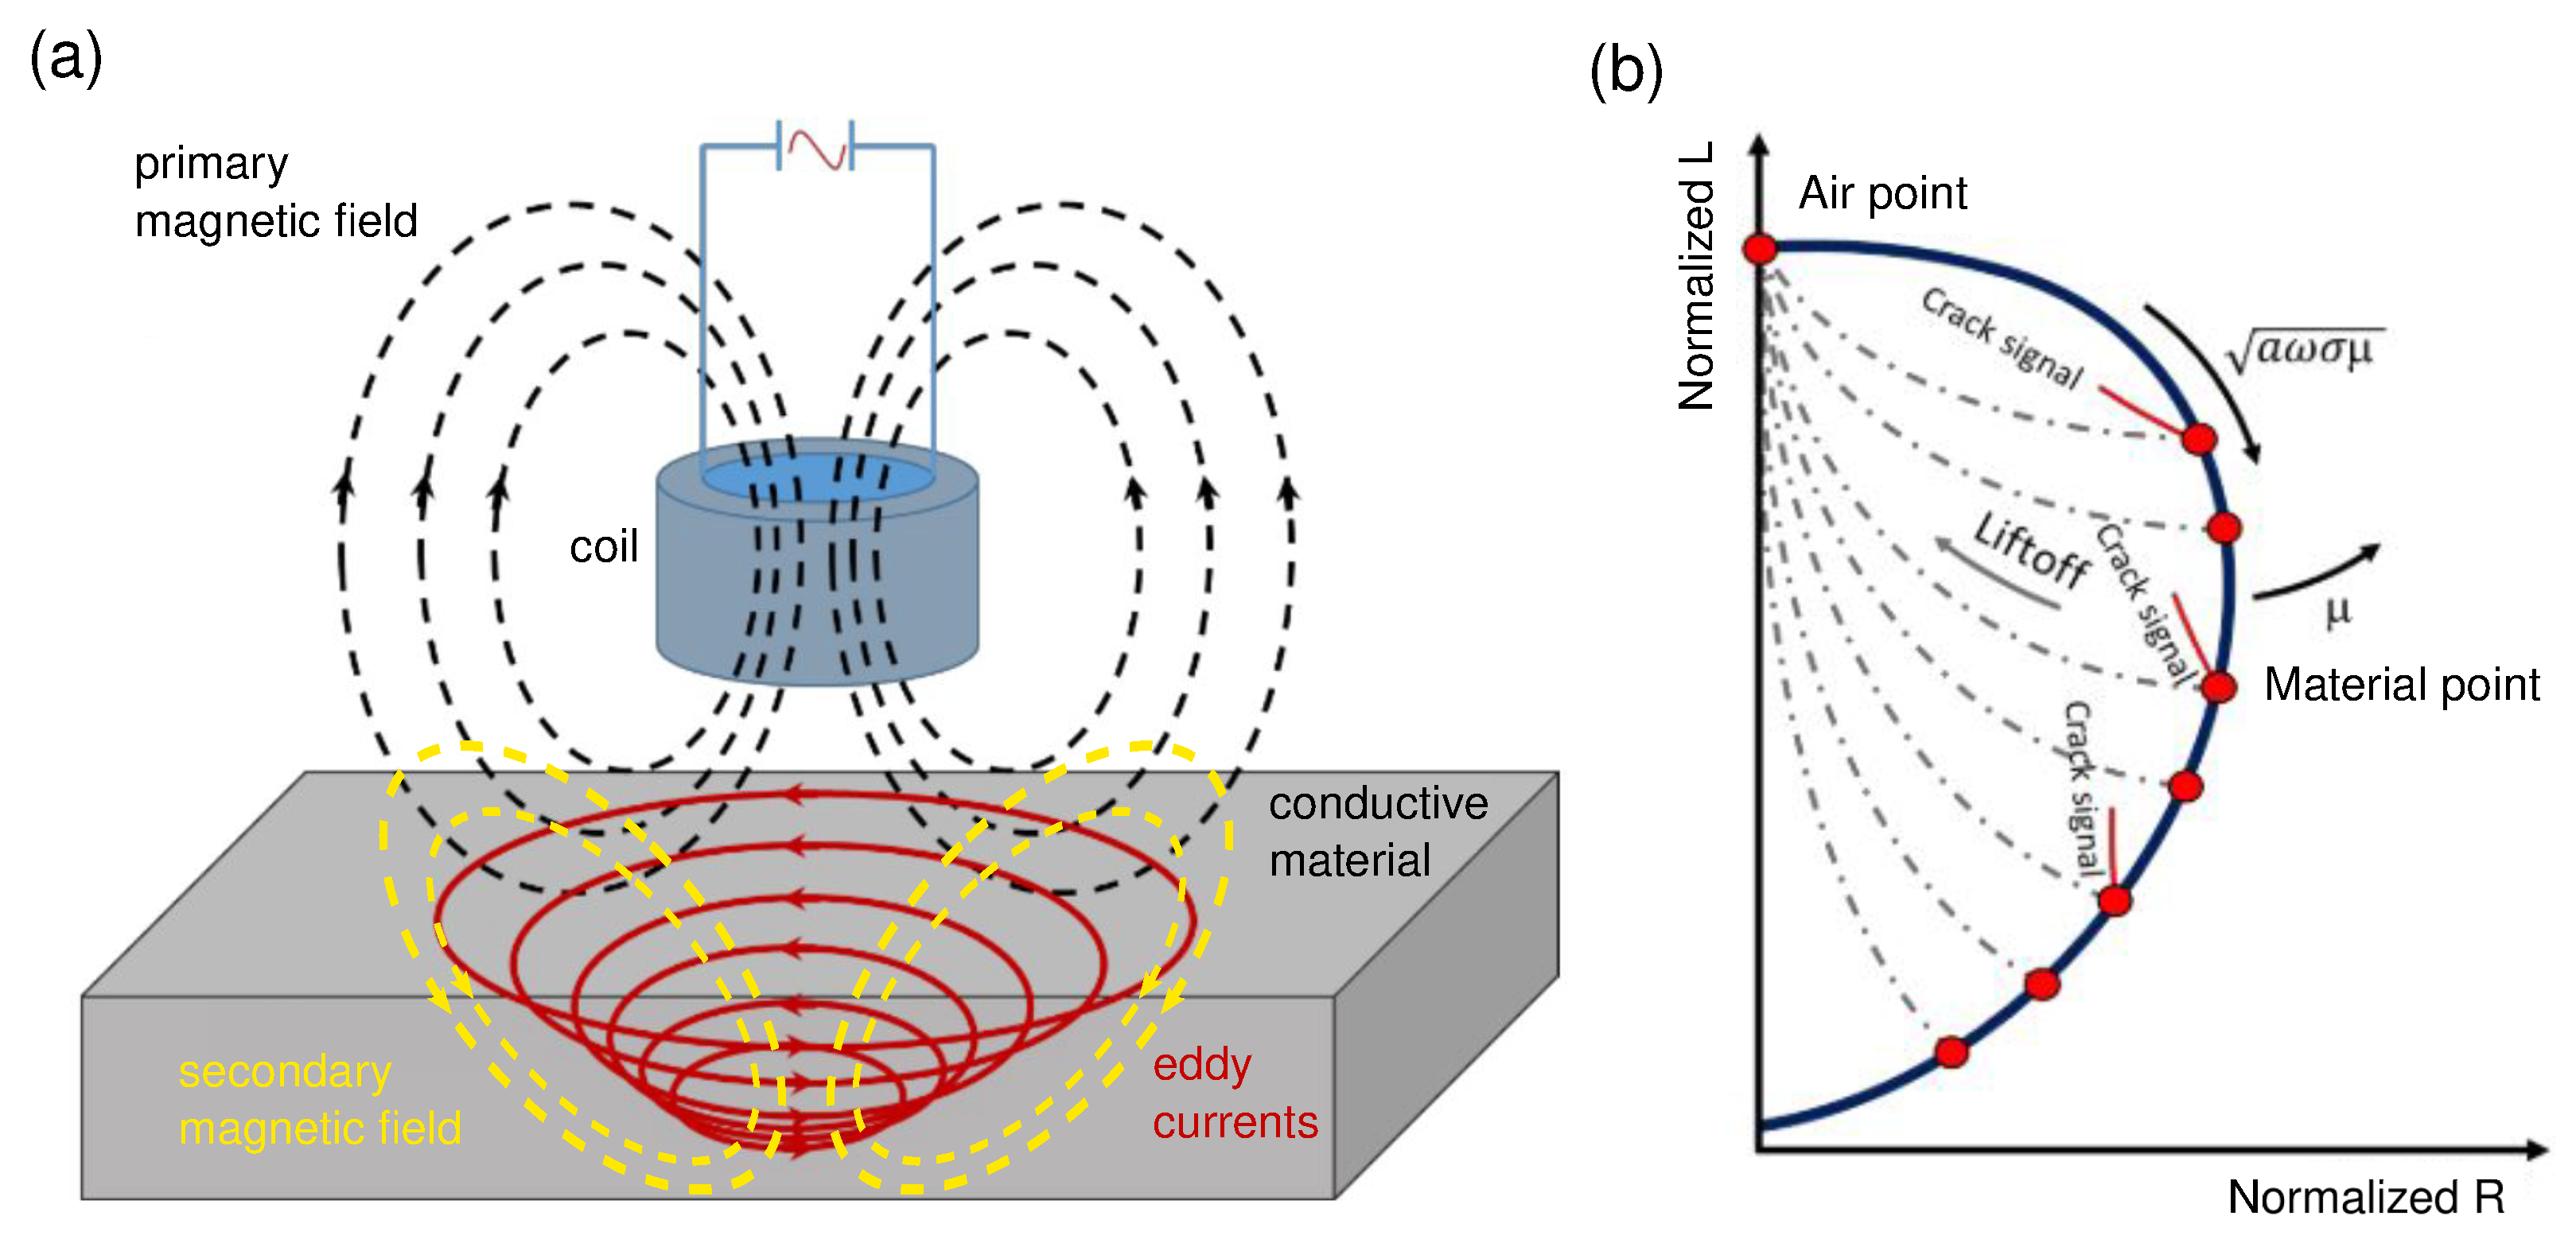
2.3.1. Measurement Principle

The physical theory of ECT is explained by Maxwell’s equations [26], which are not comprehensively discussed here. The simplified principle is explained using Figure 1a as follows.
A coil is excited with an alternating current with predefined amplitude and frequency f, which generates a time-varying primary magnetic field around it. In proximity to conductive material, the primary magnetic field induces eddy currents in the material. The eddy currents create a secondary magnetic field, which opposes the primary magnetic field that alters the impedance of the coil. Discontinuities of the electrical conductivity σ and magnetic permeability μ in the material triggered by defects such as cracks affect the eddy currents and the secondary field. The impedance change of the coil owing to the secondary magnetic field is measured and evaluated to characterize the material discontinuity. The impedance Z of the coil is calculated as:
Z = V I = R + i X = R + i ω L
where V, I, R, X, ω , and L represent the voltage across the coil, current in the coil, coil resistance, reactance, angular frequency and coil inductance, respectively [25]. The impedance is typically visualized in a normalized form relative to the impedance in air, as presented in Figure 1b. Reducing the distance between the coil and the conductive material leads to a signal transition from the air point to the material point along the lift-off direction. The location of the material point in the impedance plane changes as a function of a ω σ μ , where a, ω , σ , and μ denote the coil radius, angular frequency, electrical conductivity, and magnetic permeability of the material, respectively. The red dots moving from the air point along the blue curve presented in Figure 1b represent material points of different alloys. Signal responses to defects such as cracks or changes in electrical conductivity are identified by characteristic phase angles in the impedance plane, which differ from the phase angle of a lift-off variation, as presented in Figure 1b. By rotating the signals, i.e., adjusting the phase angle in the impedance plane for a given material, undesired alterations in lift-off during ECT can be shifted to the x-component of the signal in the impedance plane. Therefore, the y-component of the signal in the impedance plane represents the lift-off independent signal response owing to the property of interest. The principle is explained comprehensively in the book of Udpa et al. [27].

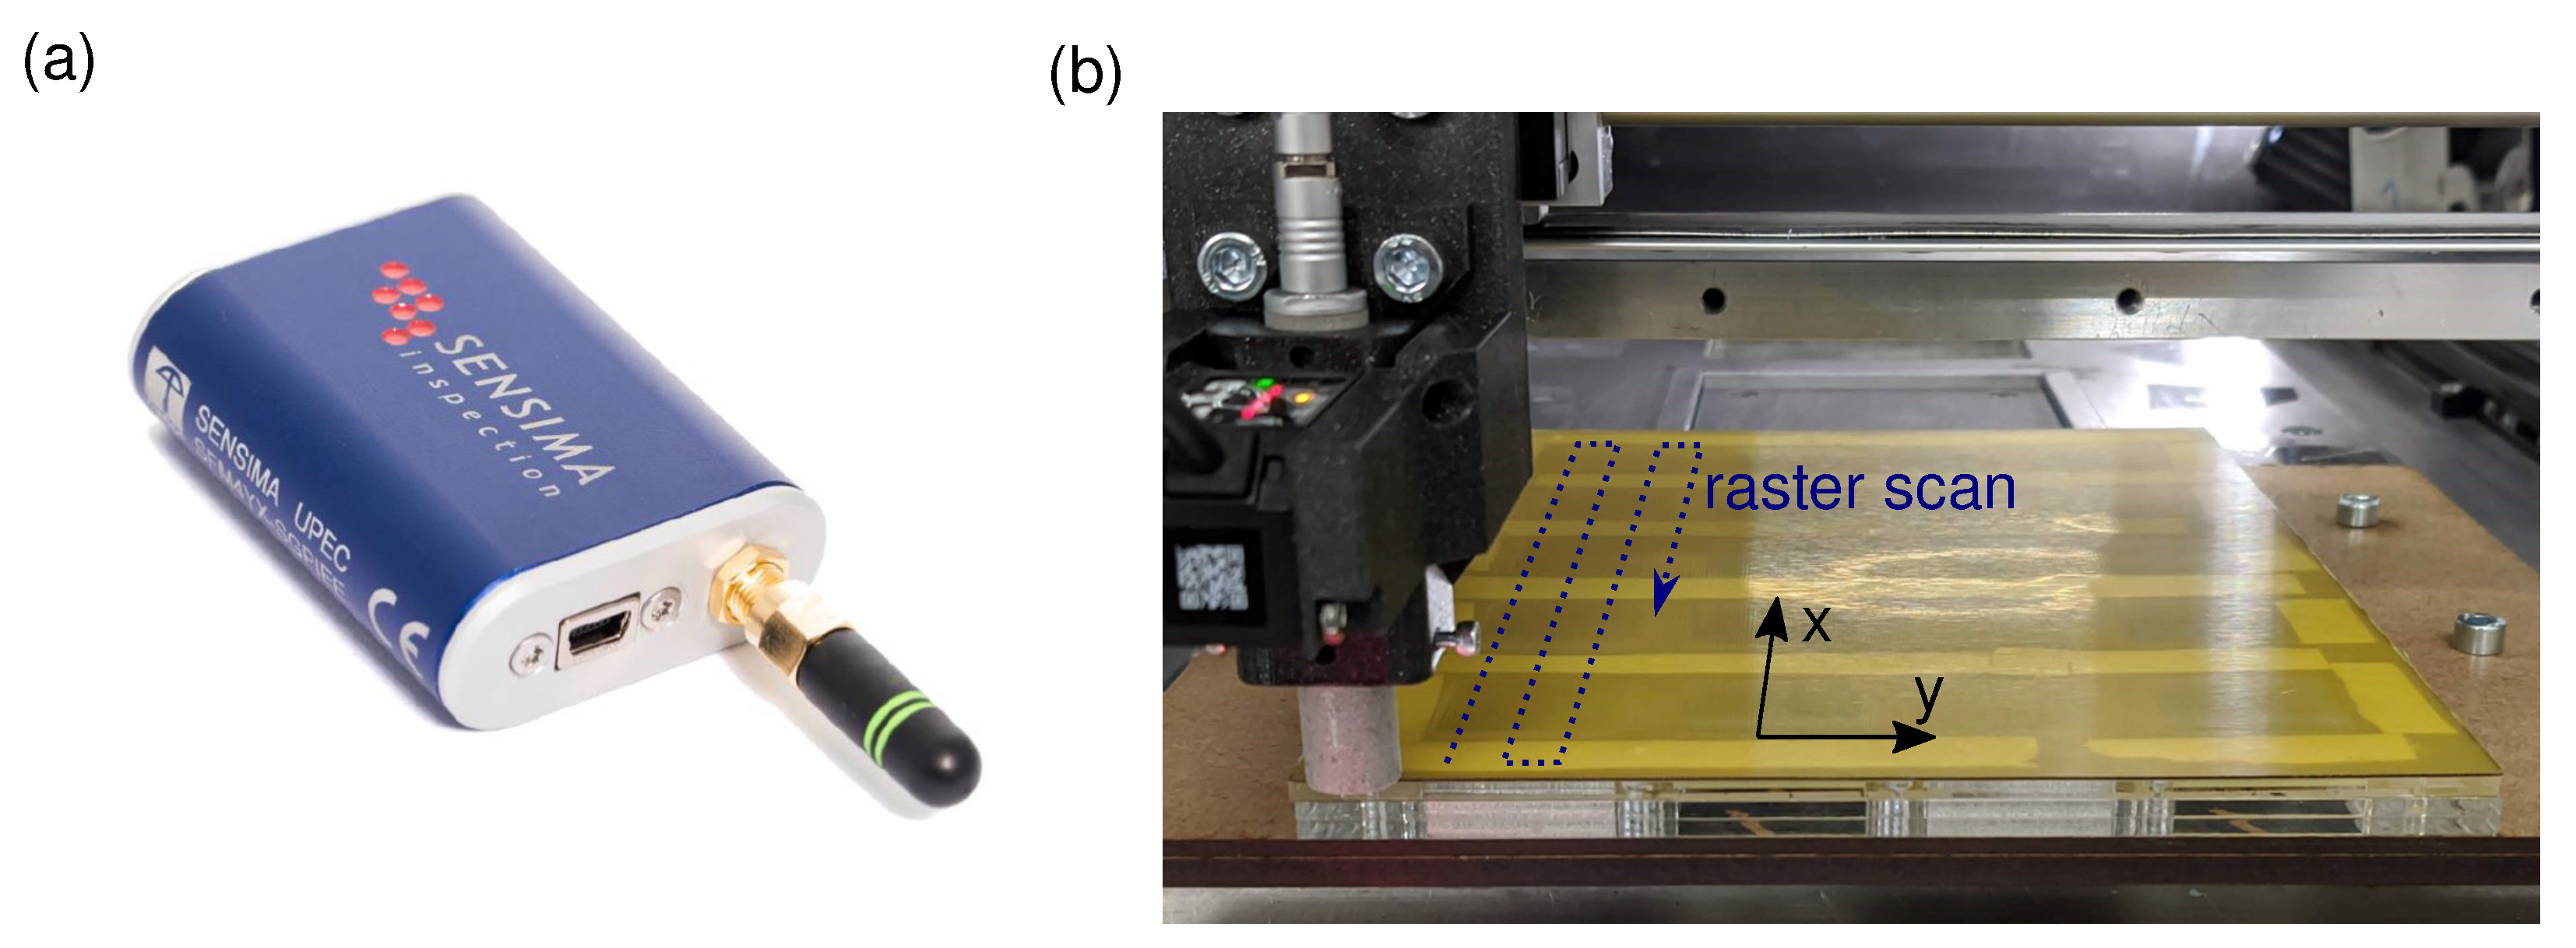
2.3.2. Measurement Equipment and Experimental Setup

A standard UPEC tester made by the Sensima Inspection SARL was adopted for the ECT, as presented in Figure 2a. The selected sensor was a ferrite rod coil sensor with a 3-mm diameter (L = 47 μH) operated in absolute mode. Absolute mode means that the measured signal is simply the value of the coil impedance itself [26]. The sensor was connected to the UPEC tester in a bridge configuration with an identical coil for balancing, including two 50- Ω resistors. The standard penetration depth δ is defined as the depth at which the eddy current density decreases to approximately 37% of its surface value [16]. It is calculated as:
δ = 1 π f σ μ
where f is the frequency of the excitation current, σ the electrical conductivity and μ = μ 0 μ r the magnetic permeability of the material, with μ r being the relative magnetic permeability and μ 0 = 1.256 × 10 6 H/m being the magnetic permeability in vacuum [26]. An excitation frequency of f = 201.6 kHz was set to ensure a sufficiently high penetration depth for both materials used. The penetration depths for 316L and AlSi10Mg, which were calculated according to Equation (2) are presented in Table 2.
The system was mounted onto a X-Y table laboratory test bench illustrated in Figure 2b. Linear encoders with a resolution of 0.1 mm were mounted on the axes and connected to the UPEC tester to map measured data to the sensor position during an acquisition. The cuboid parts were clamped onto the test bench as presented in Figure 2b to ensure a constant lift-off of 0.5 mm, which is the distance between the sensor and part surface. The as-built parts were orientated with the final layer created in the PBF process facing the sensor. Two-dimensional images were obtained by performing a raster scan with a pitch in the y-direction of 0.5 mm on the test bench guiding the sensor over the parts. Prior to the experiments, the lift-off phase angle in the impedance plane was determined for both materials by measuring one of the respective parts with different lift-offs. Accordingly, counter clockwise phase rotation angles of 69° and 79° for 316L and AlSi10Mg were obtained, respectively. The respective phase rotation filter was applied to the ECT data, and the absolute value of the lift-off independent signal component was analyzed, which is named rotated signal in the following chapters.

3. Results

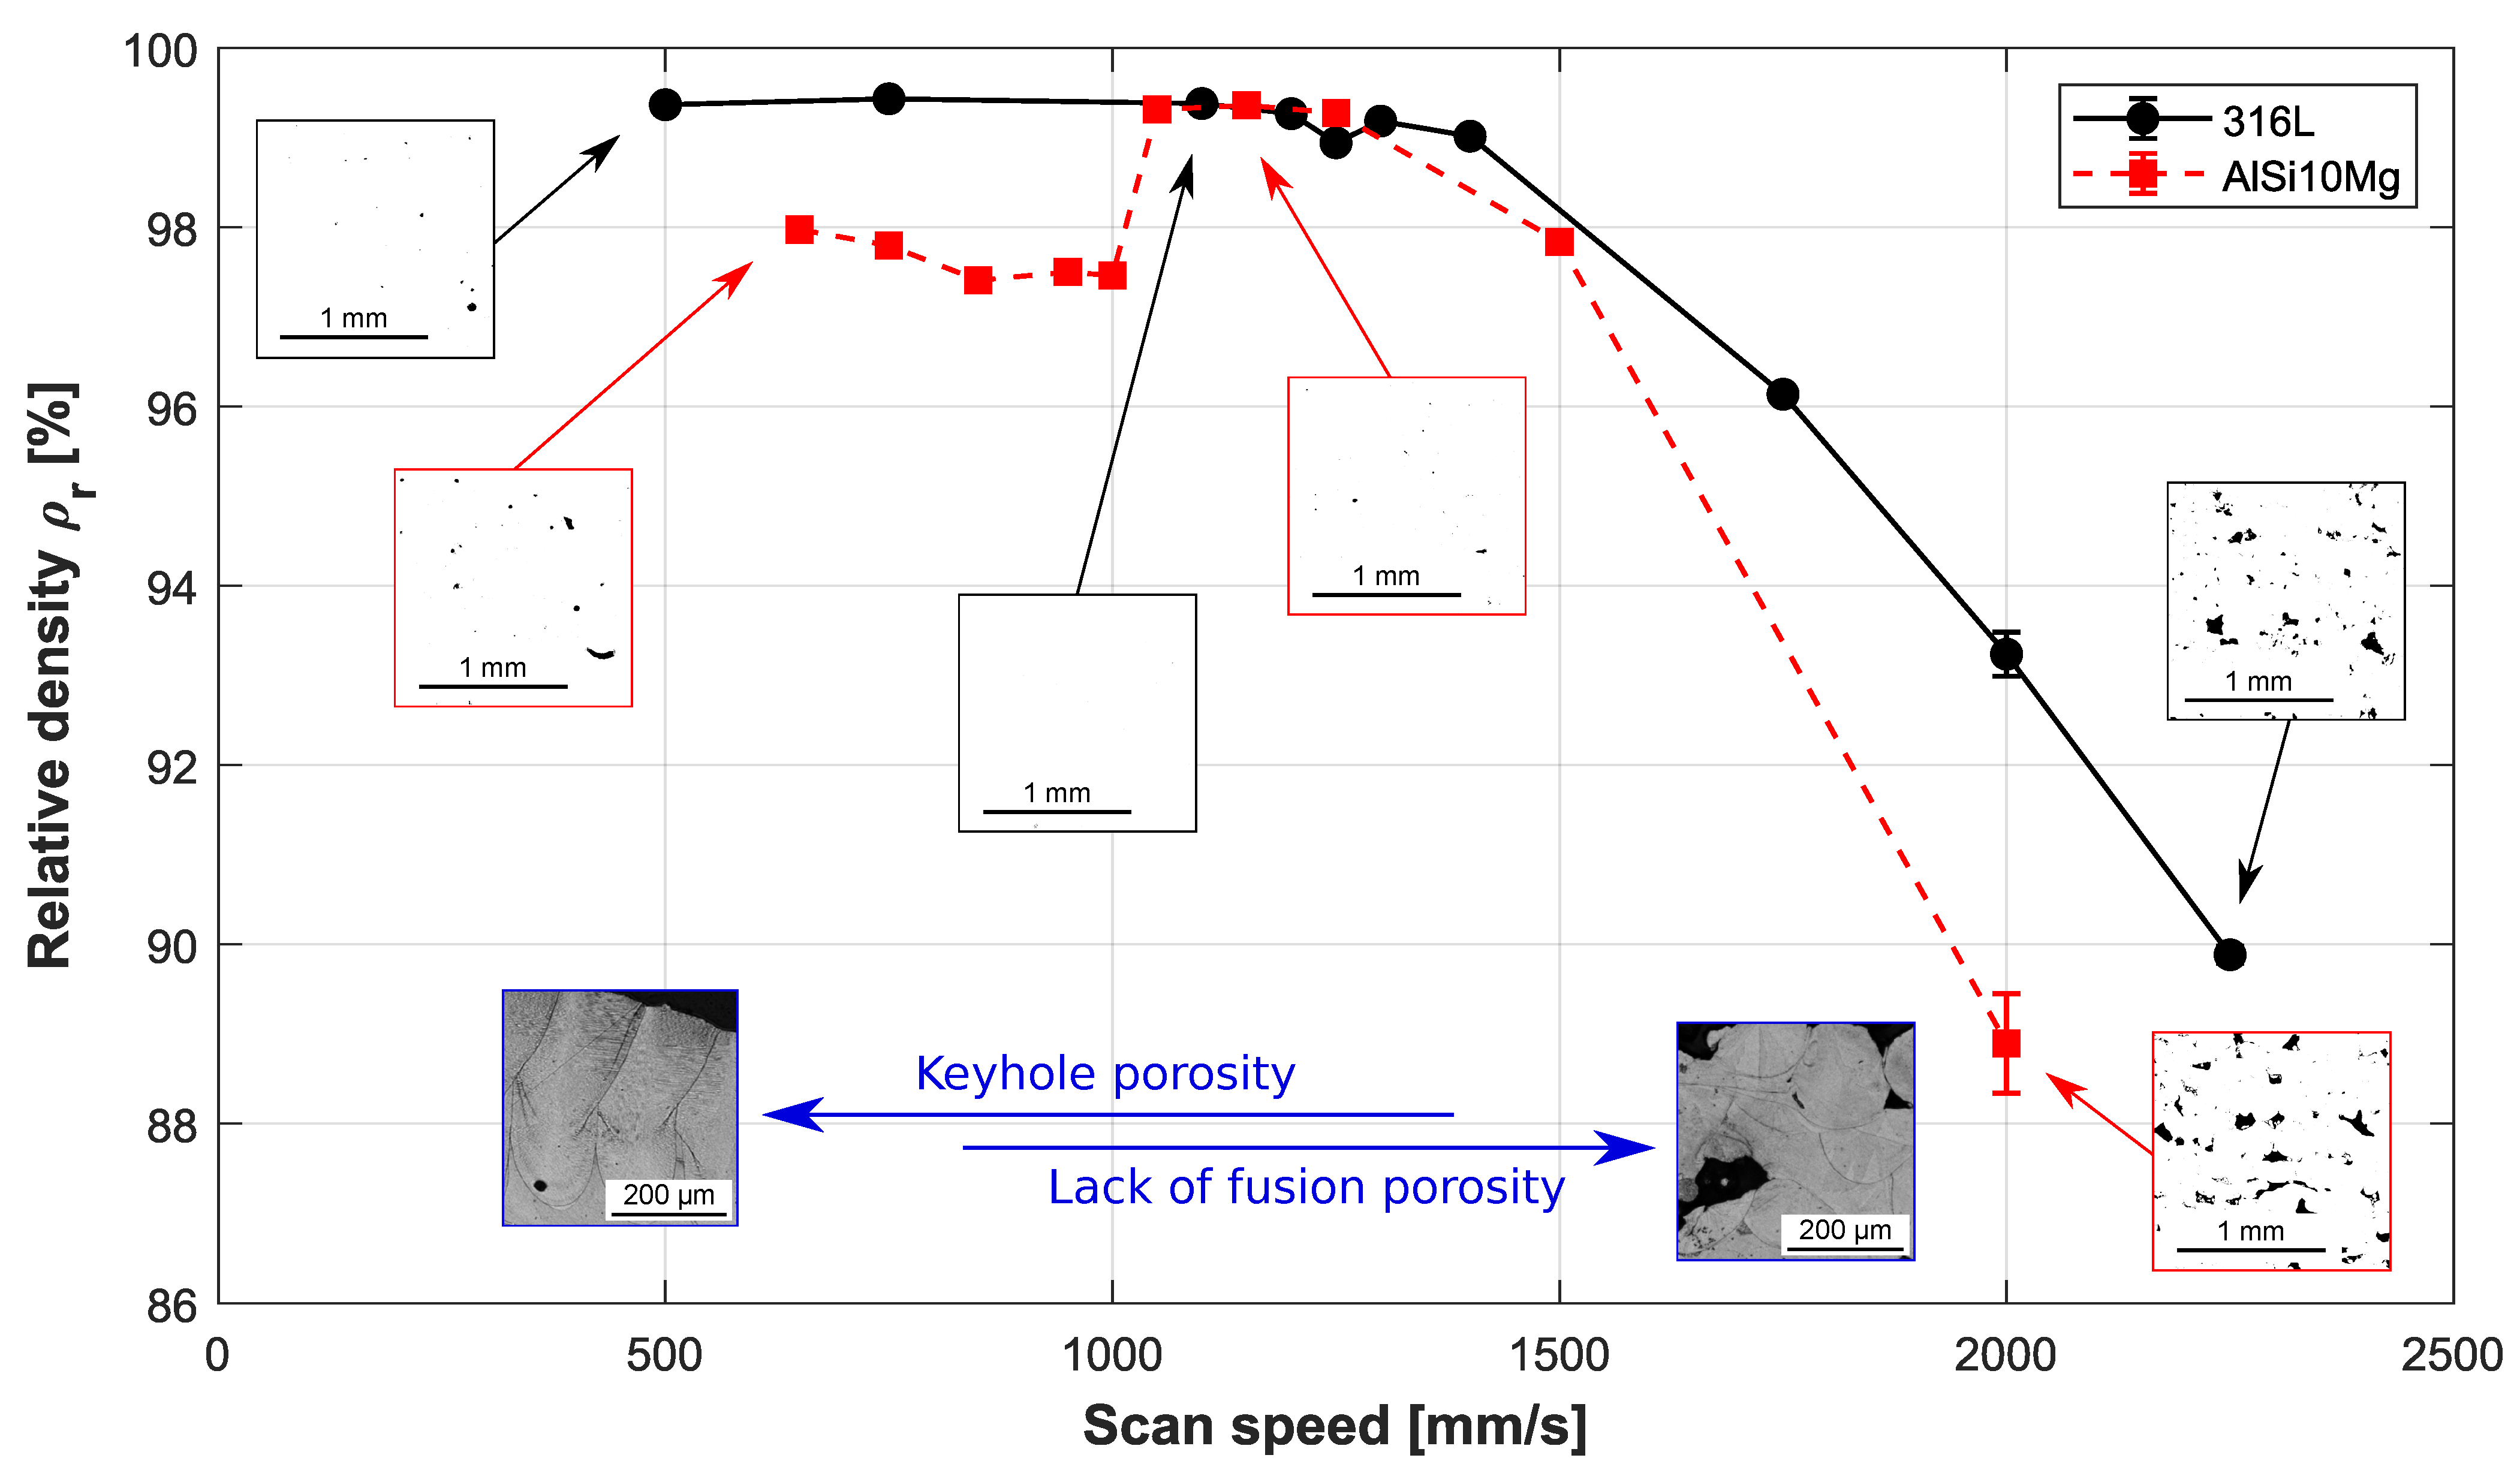
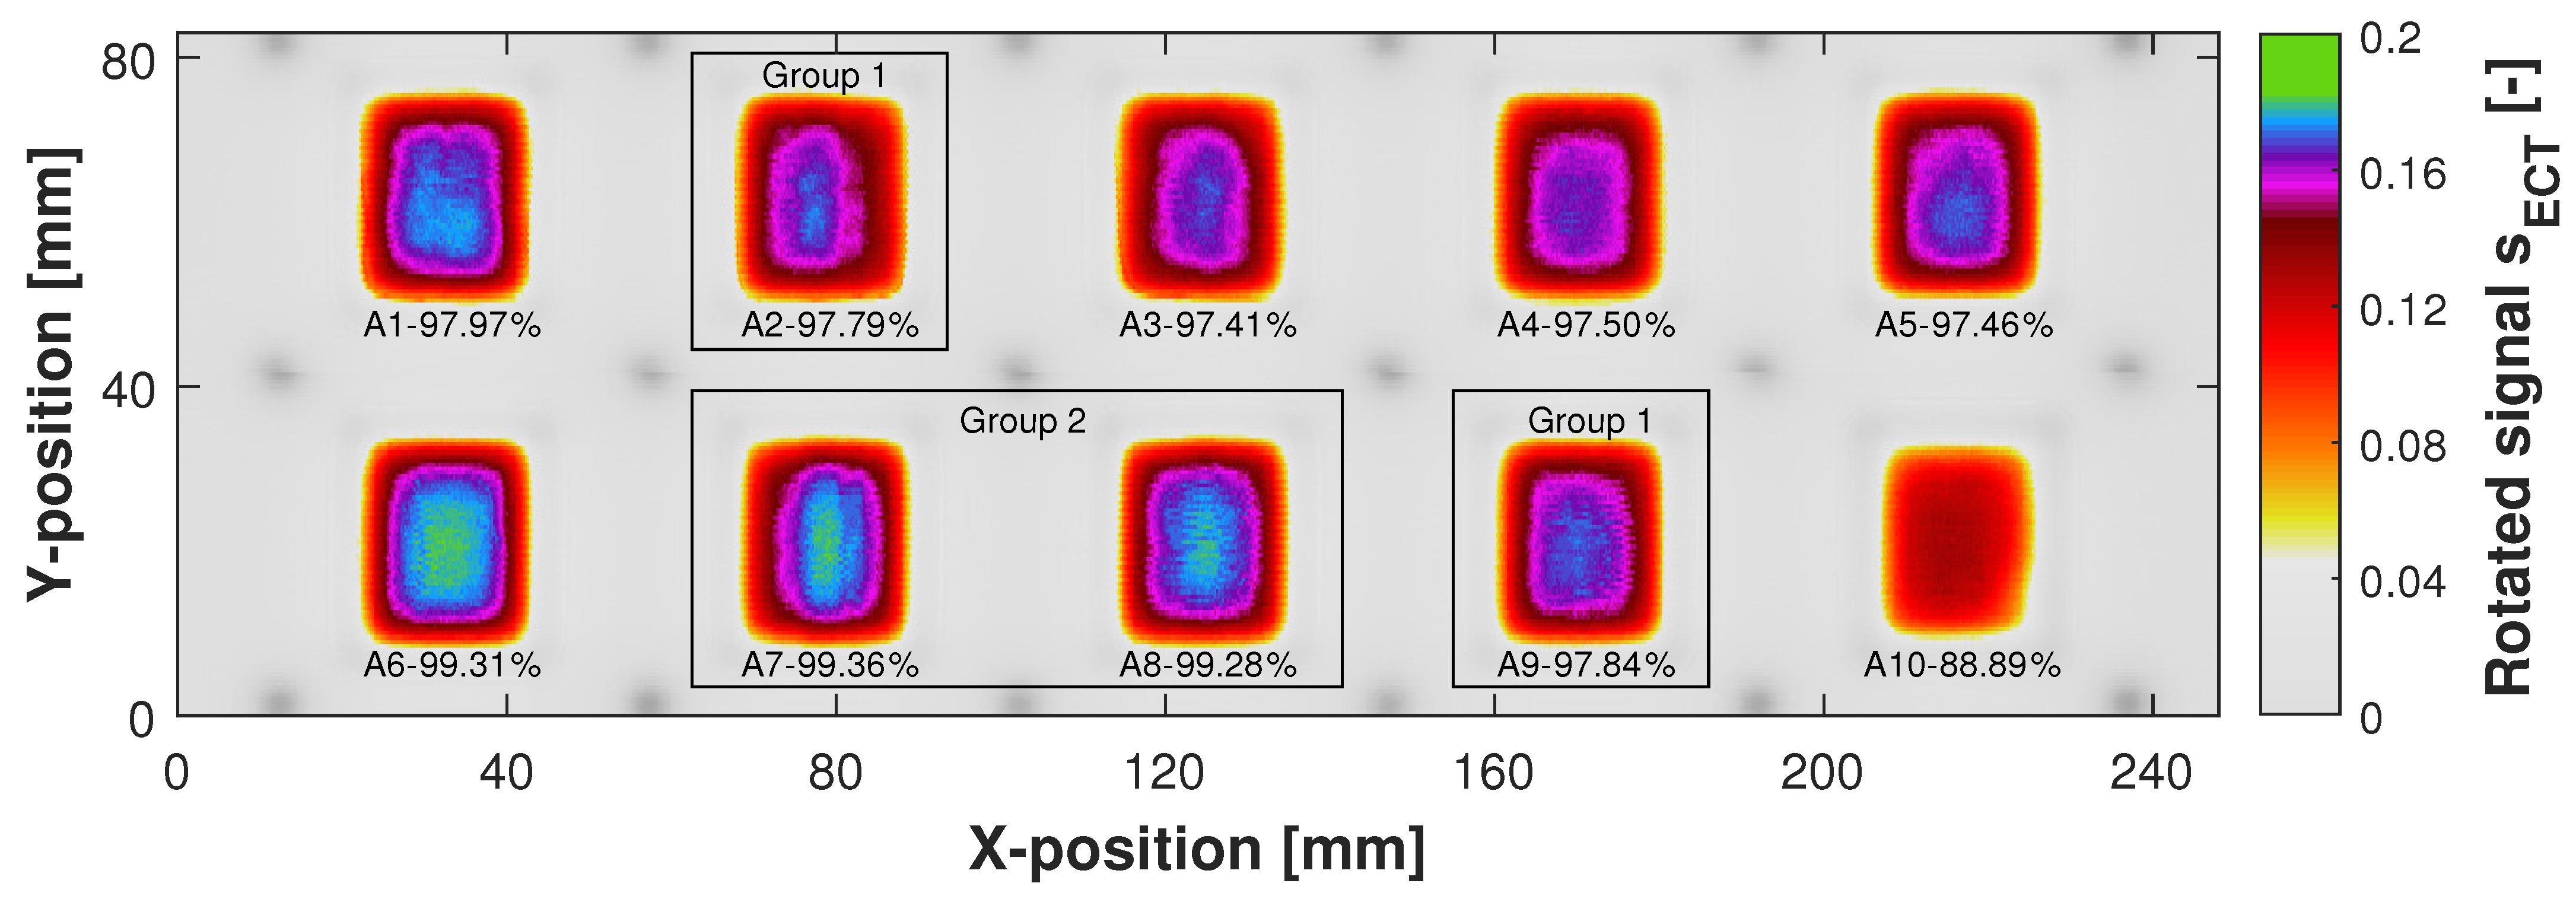
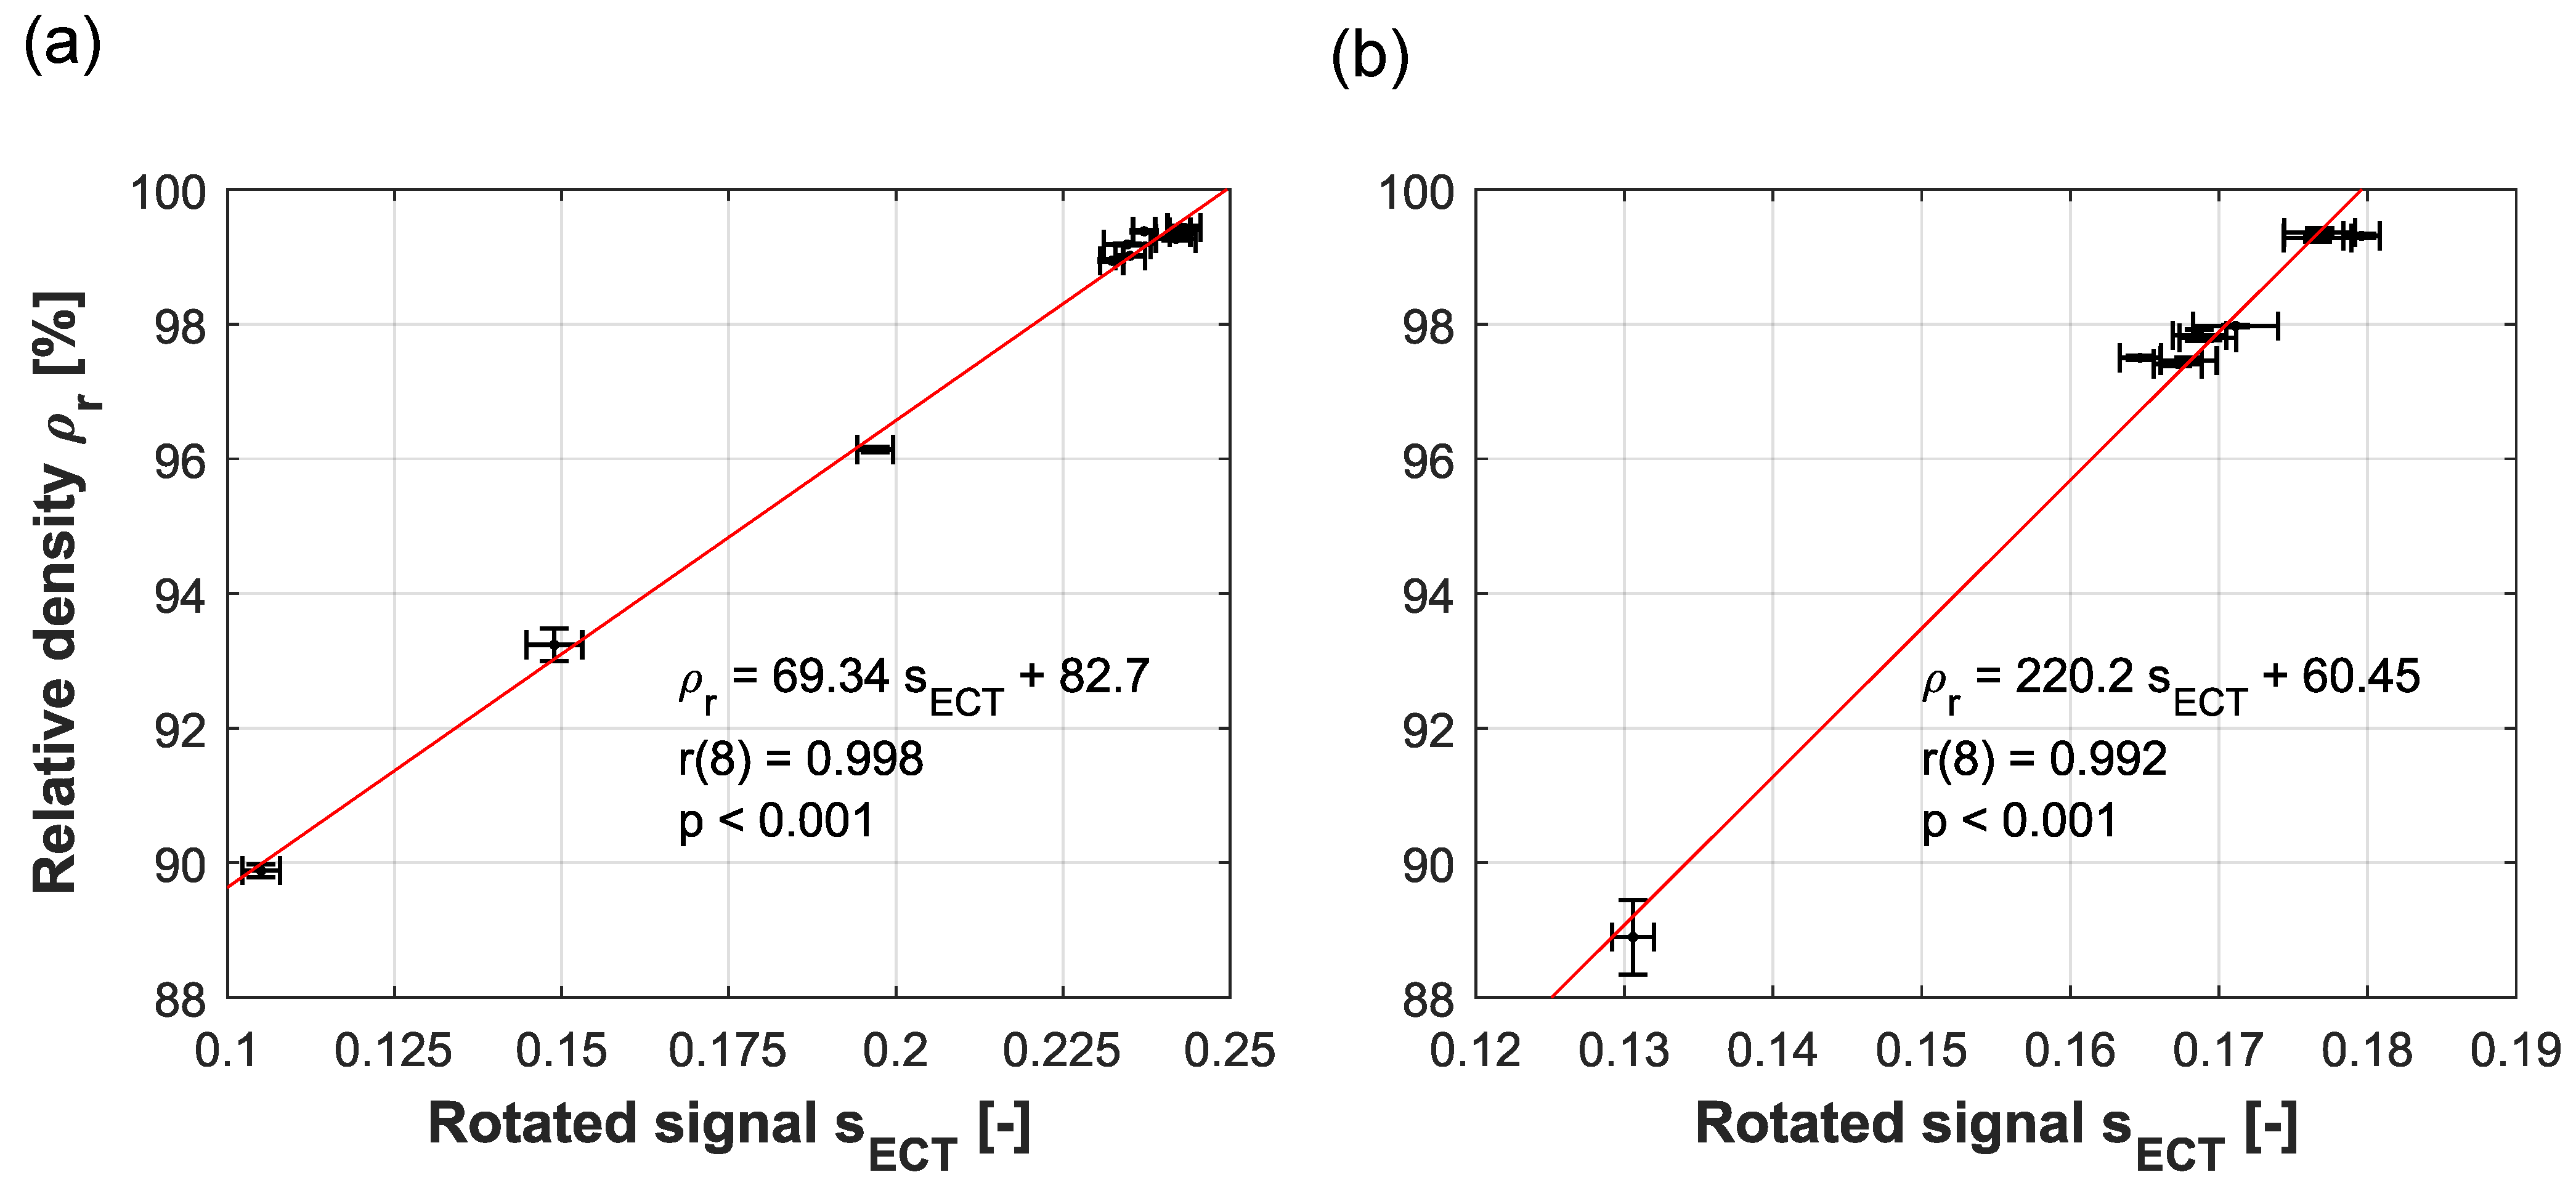
3.1. Relative Part Density

To assess the feasibility of ECT in measuring the relative density of PBF-manufactued parts, process parameters (Table 1) were chosen to cover a wide range of part densities and to include the primary causes of porosity in the PBF process. Figure 3 presents the relative density of the cuboid parts manufactured from AlSi10Mg and 316L, as a function of the scan speed.
The variation of the scan speed yields relative part densities covering a range of 89–99.5%. According to the widely used definition of the volumetric energy density by Stoffregen et al. [28], the energy input into the melt pool is inversely related to the scan speed. By adjusting the scan speed, the resulting relative density of the part can be controlled. In the process region, where insufficient energy input triggers lack of fusion, increasing the scan speed decreases the relative part density, which is consistent with the data presented in Figure 3. The micrograph images presented at the highest scan speeds in Figure 3 exhibit several irregularly shaped pores. These pores are characteristic for lack of fusion as studied extensively in the literature [22,29,30,31,32]. The lack of fusion is primarily triggered by the insufficient penetration of the melt pool into the previous layer as determined in different studies [33,34,35]. At the other end of the process window, low scan speeds yield an increased energy input into the melt pool. Consequently, the temperature of the melt pool at the center of the laser beam can reach the boiling temperature of the material, which substantially increases the amount of material evaporation and triggers the formation of a keyhole-shaped melt pool, as demonstrated by King et al. [36]. In the keyhole region of the process window, the collapse of the keyhole can lead to the formation of entrapped vapor, which causes keyhole porosity in the solidified material [36]. The micrograph images presented at the lowest scan speed in Figure 3 exhibit an increased amount of keyhole porosity, which was confirmed by melt pool shape analysis. Exemplaric images of the melt pool shapes in the different regions of the process window are presented in Figure 3. For most industrial use cases, PBF process windows are experimentally obtained to ensure dense parts; hence, the keyhole formation and lack of fusion are circumvented via the appropriate process parameter selection. Nevertheless, geometrical features of the parts, such as overhang areas, can lead to keyhole porosity owing to the local overheating of the material [37] while process influences, such as smoke obscuring the laser beam, can cause lack of fusion porosity [38]. Hence, relative part density monitoring systems for PBF must at minimum be able to detect porosity coming from these causes.

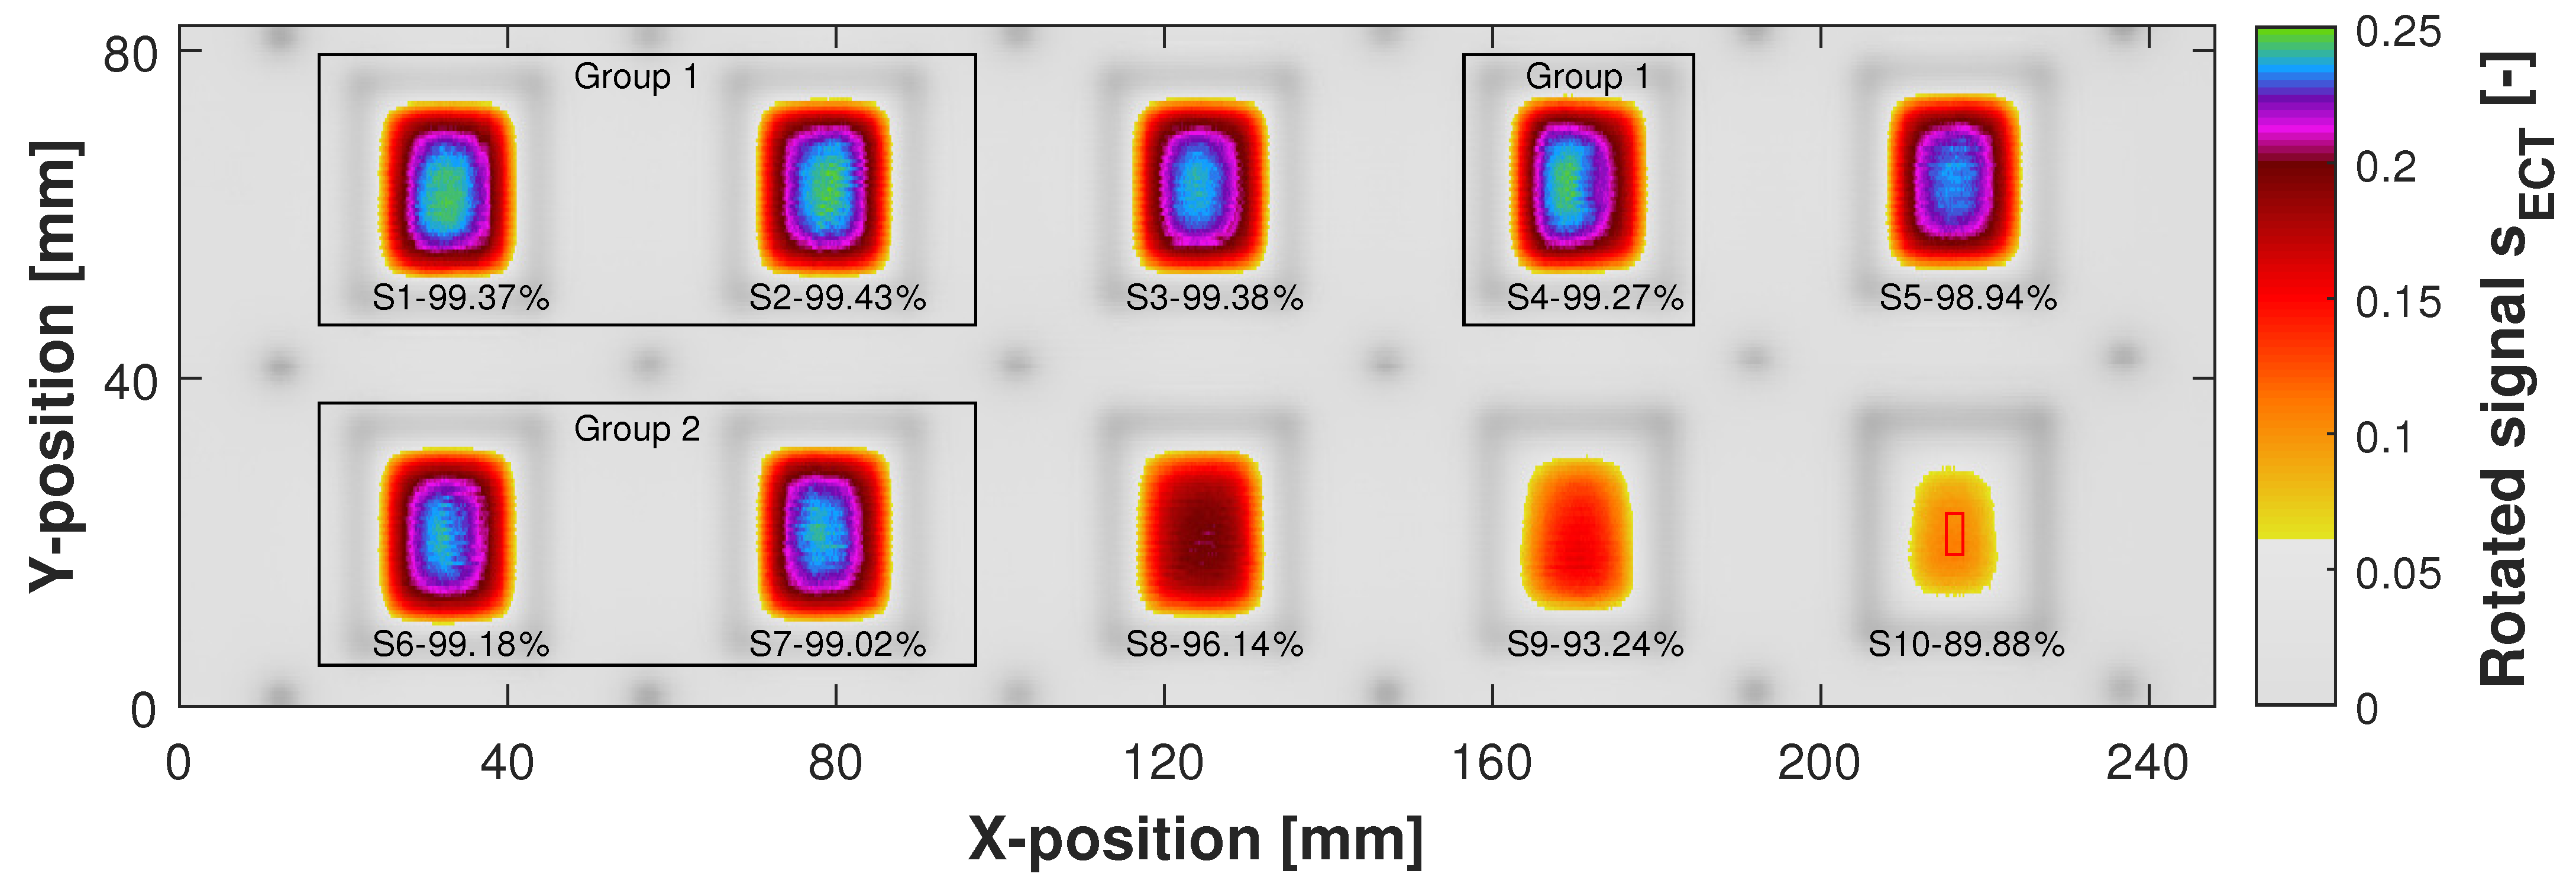
3.2. Eddy Current Testing

The 2D image obtained from measuring the 10 cuboid parts made from 316L using ECT is illustrated in Figure 4. The positions represented on the x- and y-axes reflect the position of the sensor during the raster scan. The signal weakening that is visible at the edge of the parts is owing to the edge effect, which has been extensively studied in the literature on ECT [39,40,41]. The size of the edge effect can be reduced, e.g., by adjusting the sensor design [41]; however, this is not the focus of this work.
Therefore, the following analyses are focused on the values of the rotated signal in the central region of the parts, where there is no influence exerted by the edges. This was ensured by measuring the size of the edge effect for the specific materials and making the parts sufficiently large. Samples of n = 209 individual measurements per part were selected from an area of 2 × 5 mm2 (X × Y) at the center of each part. The corresponding area is highlighted with a red rectangle on part S10 in Figure 4. To determine statistically significant differences between sample means, Welch’s analysis of variance and the Games–Howell post hoc test were applied.
The results of the statistical analysis are summarized in Table 3, which presents the p-values of the pairwise multiple comparisons between samples S1–S10 using the Games–Howell post hoc test. p < 0.05 is considered statistically significant. Most of the pairwise comparisons are statistically significant, which means that the respective parts can be statistically significantly distinguished from each other by the rotated signal. The relative density ρ r of the samples is reported alongside the sample description in Table 3. Even parts with small differences in relative density, such as S2 and S3, with a difference in relative density of 0.05%, can be statistically significantly distinguished by the rotated signal (p < 0.01). Non-significant sample differences, i.e., pairwise comparisons of samples with p ≥ 0.05, are indicated by grouping the respective parts in Figure 4. The parts of each group have differences in relative density smaller than 0.2%. Although S3 has a similar relative density as the parts in Group 1, the rotated signal is significantly smaller in the central region. This is probably attributed to the limitations of the Archimedes density measurement, which only provides the relative density of the entire part, but not of the near-surface volume fraction in the center of the part, which is measured by ECT. The relative density of the entire part is not necessarily equal to the relative density in the near-surface region owing to a potential inhomogeneous pore distribution within PBF-manufactured parts, as determined by Carlton et al. [22].
The 2D image obtained from measuring the 10 cuboid AlSi10Mg parts using ECT is presented in Figure 5. The same statistical analysis used for the 316L parts was conducted on the AlSi10Mg parts, and the results are summarized in Table 4. Similar to the 316L parts, most of the AlSi10Mg parts can be statistically significantly distinguished from each other by the rotated signal. The parts in each group have relative density variations smaller than 0.1%. However, the differences in relative density between part A3, A4, and A5 are also smaller than 0.1%, and these parts can be statistically significantly distinguished from each other by the rotated signal. As previously discussed, this is probably attributed to the different fractions of the part volume measured by the Archimedes density measurement and ECT. Hence, it is inferred that parts with small differences in relative density within the near-surface region can be statistically significantly distinguished by the rotated signal obtained from ECT.
The samples containing n = 209 individual measurements from the aforementioned area of 2 × 5 mm2 (X × Y) at the center of each part were used to analyze the correlation between the rotated signal and the relative density of the 316L and AlSi10Mg parts. In Figure 6, the correlation plots for 316L (a) and AlSi10Mg (b) are presented. The correlation is strong and significant for both materials with Pearson correlation coefficients of r ( 8 ) = 0.998 , p < 0.001 (316L) and r ( 8 ) = 0.992 , p < 0.001 (AlSi10Mg), respectively. Based on the theory of Dodd et al. [42], the impedance of the coil solely depends on the lift-off and electrical conductivity of the material for a fixed magnetic permeability, coil size, and excitation frequency, as given in the experiments. The influence of lift-off was eliminated from the data by phase rotation, such that the presented rotated signal primarily depends on the electrical conductivity of the material. Therefore, by measuring the electrical conductivity of a part using ECT, its relative density can be determined using alloy-specific correlation curves, equal to those presented in Figure 6. These correlation curves serve the calibration, i.e., converting the respective rotated signal to relative density. The correlation between the electrical conductivity and relative part density has already be demonstrated in the literature for metal foams [43,44], as well as the PBF-manufactured parts with internal cavities [25,45]. However, the correlations presented in this work are based on PBF-manufactured parts with relative density variations caused by introducing porosity owing to the two primary causes in PBF, which are lack of fusion and keyhole [3]. Hence, the data represent more realistic conditions for the PBF process.

4. Discussion

In this study, part densities were measured using the Archimedes principle, which provides the relative part density averaged across the entire volume of the part. ECT measurements were performed on the last layers of the parts, and only the central region was considered for the correlation analysis to eliminate the influence of the edge effect. The pore distribution within PBF-manufactured parts is not homogeneous [22]. Therefore, the relative density of the entire part measured by the Archimedes principle does not necessarily accurately represent the actual relative density in the near-surface volume fraction measured by ECT. Hence, it can be assumed that a large fraction of the signal variance indicated by the standard deviations of the rotated signal presented in Figure 6 is owing to actual small relative density differences in the parts. Accordingly, only a small fraction of this signal variance is caused by limitations of the ECT system itself, which could solely be verified by comparing relative density and ECT data obtained from the same fraction of the part volume.
To assess the limitations of the ECT system, the uncertainty of the determined relative density via ECT due to the instrument noise U I is calculated based on the principle of the expanded uncertainty explained in the Guide to the Expression of Uncertainty in Measurement (GUM) [46] as:
U I = k u I
where k is the coverage factor and u I is the standard uncertainty. A coverage factor k = 3 is selected, which corresponds to a confidence level of 99.7% given the sampling distribution of the sample mean is normal. The sampling distribution of the mean is the distribution of the mean as a random variable derived from random samples with the size n. According to the central limit theorem [47], normality of the sampling distribution of the mean can be assumed, because of the sufficiently large sample size n = 209 per part measured. The standard uncertainty u I owing to the instrument noise is calculated as:
u I = σ I n
where σ I is the standard deviation of the instrument noise and n is the sample size, which is n = 209 in this study. Equations (3) and (4) are combined, and the unit of U I is converted to % relative density by multiplying it with sensitivity b, which is the slope of the respective least-square fitted curve presented in Figure 6, as:
U I = k b σ I n
The results of the uncertainty calculation are presented in Table 5. The uncertainty in the determined relative density via ECT due to the instrument noise U I is 0.02 % (316L) and 0.06 % (AlSi10Mg), which indicates that small differences in average relative part density can be measured at high confidence levels.
Note that the error bars in Figure 6 are significantly larger than these estimated uncertainties as they represent the standard deviations of the observed signals, which include fluctuations due to inhomogeneities, e.g., local density differences, in the material itself. Furthermore, the aforementioned standard deviations simply describe the data variability within the actual sample, whereas the calculated uncertainty U I refers to the accuracy with which the mean value of each sample can be determined. The following remarks have to be considered while interpreting the results of this study. Standard instrument settings were adopted, that means that by optimizing parameters, such as gains, the sensitivity can be further increased. Moreover, the sensitivity can be improved by reducing the lift-off and applying more sophisticated signal processing methods, as well as an improved sensor design. Hence, this study demonstrates that such an ECT system mounted onto the recoater of a PBF-machine has the potential to evolve into a effective technology for layer-wise measuring the relative density of PBF-manufactured parts.

5. Conclusions

This study investigates the feasibility of measuring the relative part density of PBF-manufactured parts by ECT. Parts made from AlSi10Mg and 316L were manufactured with different process parameters yielding different densities. The relative part density differences were triggered by the two primary reasons for porosity in PBF, which are lack of fusion and keyhole. The parts were measured by ECT, and the results were correlated with the relative part density.
The ECT signal component, which mainly contains the electrical conductivity of the parts is strongly and significantly correlated with the relative part density for both 316L ( r ( 8 ) = 0.998 , p < 0.001 ) and AlSi10Mg ( r ( 8 ) = 0.992 , p < 0.001 ). Considering that the measured relative density is an averaged relative density across the entire part volume, and that the ECT data were obtained on the final layers, the correlation between the relative part density and the ECT signal is excellent. The sensitivity of the system can be further increased by reducing the lift-off, applying advanced signal processing methods, and adopting an improved sensor design.
This study presents a pathway for directly layer-wise measuring relative part density during the PBF process using an ECT system mounted on the recoater of a PBF-machine. Because the adopted ECT system is a compliant nondestructive testing instrument, it can furthermore serve the direct qualification and certification of PBF-manufactured parts. By measuring some additionally introduced test geometries to a build job, the system can also be used to assess the process window stability or to monitor the machine condition. Compared to monitoring techniques such as melt pool monitoring, where it is challenging to translate the large amount of generated data to relevant part properties, ECT can provide relevant and compliant part and process information obtained from direct measurements during the PBF process.

Author Contributions

Conceptualization, M.A.S. and A.B.S.; methodology, M.A.S., A.B.S., M.L., G.S. and B.R.; formal analysis, M.A.S.; investigation, M.A.S. and V.H.L.; resources, K.W.; data curation, M.A.S.; writing—original draft preparation, M.A.S.; writing—review and editing, M.A.S., A.B.S., G.S. and K.W.; visualization, M.A.S.; supervision, K.W.; project administration, M.A.S.; funding acquisition, A.B.S. and B.R. All authors have read and agreed to the published version of the manuscript.

Funding

Open Access funding provided by ETH Zurich. The authors like to thank Innosuisse—Swiss Innovation Agency for co-financing the investigations within the frame of innovation project 33657.1.

Institutional Review Board Statement

Not applicable.

Informed Consent Statement

Not applicable.

Data Availability Statement

The data presented in this study are available from the corresponding author on reasonable request.

Conflicts of Interest

The authors declare no conflict of interest.

References

  1. Milewski, J.O. Additive Manufacturing of Metals; Springer Series in Materials Science; Springer International Publishing: Cham, Switzerland, 2017; Volume 258. [Google Scholar] [CrossRef]
  2. Wohlers, T.; Campbell, R.I.; Diegel, O.; Huff, R.; Kowen, J. Wohlers Report 2020: 3D Printing and Additive Manufacturing State of the Industry; Wohlers Associates: Fort Collins, CO, USA, 2020. [Google Scholar]
  3. DebRoy, T.; Wei, H.L.; Zuback, J.S.; Mukherjee, T.; Elmer, J.W.; Milewski, J.O.; Beese, A.M.; Wilson-Heid, A.; De, A.; Zhang, W. Additive manufacturing of metallic components–Process, structure and properties. Prog. Mater. Sci. 2018, 92, 112–224. [Google Scholar] [CrossRef]
  4. Grasso, M.; Colosimo, B.M. Process defects and in situ monitoring methods in metal powder bed fusion: A review. Meas. Sci. Technol. 2017, 28, 044005. [Google Scholar] [CrossRef] [Green Version]
  5. Yan, Z.; Liu, W.; Tang, Z.; Liu, X.; Zhang, N.; Li, M.; Zhang, H. Review on thermal analysis in laser-based additive manufacturing. Opt. Laser Technol. 2018, 106, 427–441. [Google Scholar] [CrossRef]
  6. Mitchell, J.A.; Ivanoff, T.A.; Dagel, D.; Madison, J.D.; Jared, B. Linking pyrometry to porosity in additively manufactured metals. Addit. Manuf. 2020, 31, 100946. [Google Scholar] [CrossRef]
  7. Renken, V.; Lübbert, L.; Blom, H.; Von Freyberg, A.; Fischer, A. Model assisted closed-loop control strategy for selective laser melting. Procedia CIRP 2018, 74, 659–663. [Google Scholar] [CrossRef]
  8. Fisher, B.A.; Lane, B.; Yeung, H.; Beuth, J. Toward determining melt pool quality metrics via coaxial monitoring in laser powder bed fusion. Manuf. Lett. 2018, 15, 119–121. [Google Scholar] [CrossRef]
  9. Colosimo, B.M.; Grossi, E.; Caltanissetta, F.; Grasso, M. Penelope: A Novel Prototype for In Situ Defect Removal in LPBF. JOM 2020, 72, 1332–1339. [Google Scholar] [CrossRef] [Green Version]
  10. Özel, T.; Shaurya, A.; Altay, A.; Yang, L. Process monitoring of meltpool and spatter for temporal-spatial modeling of laser powder bed fusion process. Procedia CIRP 2018, 74, 102–106. [Google Scholar] [CrossRef]
  11. Mohr, G.; Altenburg, S.J.; Ulbricht, A.; Heinrich, P.; Baum, D.; Maierhofer, C.; Hilgenberg, K. In-situ defect detection in laser powder bed fusion by using thermography and optical tomography—comparison to computed tomography. Metals 2020, 10, 103. [Google Scholar] [CrossRef] [Green Version]
  12. Martin, A.A.; Calta, N.P.; Khairallah, S.A.; Wang, J.; Depond, P.J.; Fong, A.Y.; Thampy, V.; Guss, G.M.; Kiss, A.M.; Stone, K.H.; et al. Dynamics of pore formation during laser powder bed fusion additive manufacturing. Nat. Commun. 2019, 10, 1–10. [Google Scholar] [CrossRef] [PubMed] [Green Version]
  13. Ulbricht, A.; Mohr, G.; Altenburg, S.J.; Oster, S.; Maierhofer, C.; Bruno, G. Can potential defects in lpbf be healed from the laser exposure of subsequent layers? A quantitative study. Metals 2021, 11, 1012. [Google Scholar] [CrossRef]
  14. Clijsters, S.; Craeghs, T.; Buls, S.; Kempen, K.; Kruth, J.P. In situ quality control of the selective laser melting process using a high-speed, real-time melt pool monitoring system. Int. J. Adv. Manuf. Technol. 2014, 75, 1089–1101. [Google Scholar] [CrossRef]
  15. ISO. 15549:2019: Non-Destructive Testing-Eddy Current Testing-General Principles; International Organization for Standardization (ISO): Geneva, Switzerland, 2019. [Google Scholar] [CrossRef]
  16. García-Martín, J.; Gómez-Gil, J.; Vázquez-Sánchez, E. Non-destructive techniques based on eddy current testing. Sensors 2011, 11, 2525–2565. [Google Scholar] [CrossRef] [Green Version]
  17. ASTM. E1004-17: Standard Test Method for Determining Electrical Conductivity Using the Electromagnetic (Eddy Current) Method; ASTM: West Conshohocken, PA, USA, 2015; pp. 3–7. [Google Scholar] [CrossRef]
  18. ASTM. E3166-20: Standard Guide for Nondestructive Examination of Metal Additively Manufactured Aerospace Parts after Build; ASTM: West Conshohocken, PA, USA, 2020; pp. 1–63. [Google Scholar] [CrossRef]
  19. Todorov, E.I.; Boulware, P.; Gaah, K. Demonstration of array eddy current technology for real-time monitoring of laser powder bed fusion additive manufacturing process. In Characterization and Monitoring of Advanced Materials, Aerospace, Civil Infrastructure, and Transportation XII; International Society for Optics and Photonics (SPIE): Bellingham, WA, USA, 2018; Volume 10599, pp. 190–201. [Google Scholar] [CrossRef]
  20. Todorov, E.I. Non-destructive Evaluation of Additive Manufacturing Components. U.S. Patent US 2018/0266993 A1, 20 September 2018. [Google Scholar]
  21. Ehlers, H.; Pelkner, M.; Thewes, R. Heterodyne Eddy Current Testing using Magnetoresistive Sensors for Additive Manufacturing Purposes. IEEE Sens. J. 2020, 20, 5793–5800. [Google Scholar] [CrossRef]
  22. Carlton, H.D.; Haboub, A.; Gallegos, G.F.; Parkinson, D.Y.; MacDowell, A.A. Damage evolution and failure mechanisms in additively manufactured stainless steel. Mater. Sci. Eng. A 2016, 651, 406–414. [Google Scholar] [CrossRef] [Green Version]
  23. Eisenbarth, D.; Stoll, P.; Klahn, C.; Heinis, T.B.; Meboldt, M.; Wegener, K. Unique coding for authentication and anti-counterfeiting by controlled and random process variation in L-PBF and L-DED. Addit. Manuf. 2020, 35, 101298. [Google Scholar] [CrossRef]
  24. Obaton, A.F.; Lê, M.; Prezza, V.; Marlot, D.; Delvart, P.; Huskic, A.; Senck, S.; Mahé, E.; Cayron, C. Investigation of new volumetric non-destructive techniques to characterise additive manufacturing parts. Weld. World 2018, 62, 1049–1057. [Google Scholar] [CrossRef] [Green Version]
  25. Hippert, D.F. High Resolution Eddy Current Inspection and Eddy Current Testing for Additive Manufacturing. Ph.D. Thesis, École polytechnique fédérale de Lausanne (EPFL), Lausanne, Switzerland, 2015. [Google Scholar]
  26. Bowler, N. Eddy-Current Nondestructive Evaluation; Springer Series in Measurement Science and Technology; Springer: New York, NY, USA, 2019. [Google Scholar] [CrossRef]
  27. Udpa, S.S.; Moore, P.O. (Eds.) Electromagnetic Testing, 3rd ed.; Number v. 5 in Nondestructive testing handbook; American Society for Nondestructive Testing: Columbus, OH, USA, 2004. [Google Scholar]
  28. Stoffregen, H.; Fischer, J.; Siedelhofer, C.; Abele, E. Selective laser melting of porous structures. In Proceedings of the 22th International Solid Freeform Fabrication Symposium, Austin, TX, USA, 8–10 August 2011; Volume 19, pp. 680–695. [Google Scholar] [CrossRef]
  29. Yang, K.V.; Rometsch, P.; Jarvis, T.; Rao, J.; Cao, S.; Davies, C.; Wu, X. Porosity formation mechanisms and fatigue response in Al-Si-Mg alloys made by selective laser melting. Mater. Sci. Eng. A 2018, 712, 166–174. [Google Scholar] [CrossRef]
  30. Choo, H.; Sham, K.L.; Bohling, J.; Ngo, A.; Xiao, X.; Ren, Y.; Depond, P.J.; Matthews, M.J.; Garlea, E. Effect of laser power on defect, texture, and microstructure of a laser powder bed fusion processed 316L stainless steel. Mater. Des. 2019, 164, 107534. [Google Scholar] [CrossRef]
  31. Domfang Ngnekou, J.N.; Nadot, Y.; Henaff, G.; Nicolai, J.; Ridosz, L. Influence of defect size on the fatigue resistance of AlSi10Mg alloy elaborated by selective laser melting (SLM). Procedia Struct. Integr. 2017, 7, 75–83. [Google Scholar] [CrossRef]
  32. Bayat, M.; Mohanty, S.; Hattel, J.H. Multiphysics modelling of lack-of-fusion voids formation and evolution in IN718 made by multi-track/multi-layer L-PBF. Int. J. Heat Mass Transf. 2019, 139, 95–114. [Google Scholar] [CrossRef]
  33. Mukherjee, T.; Zuback, J.S.; De, A.; DebRoy, T. Printability of alloys for additive manufacturing. Sci. Rep. 2016, 6, 1–8. [Google Scholar] [CrossRef] [PubMed] [Green Version]
  34. Kasperovich, G.; Haubrich, J.; Gussone, J.; Requena, G. Erratum: Corrigendum to “Correlation between porosity and processing parameters in TiAl6V4 produced by selective laser melting” (Materials and Design (2016) 105 (160–170)). Mater. Des. 2016, 112, 160–161. [Google Scholar] [CrossRef]
  35. Dilip, J.J.; Zhang, S.; Teng, C.; Zeng, K.; Robinson, C.; Pal, D.; Stucker, B. Influence of processing parameters on the evolution of melt pool, porosity, and microstructures in Ti-6Al-4V alloy parts fabricated by selective laser melting. Prog. Addit. Manuf. 2017, 2, 157–167. [Google Scholar] [CrossRef] [Green Version]
  36. King, W.E.; Barth, H.D.; Castillo, V.M.; Gallegos, G.F.; Gibbs, J.W.; Hahn, D.E.; Kamath, C.; Rubenchik, A.M. Observation of keyhole-mode laser melting in laser powder-bed fusion additive manufacturing. J. Mater. Process. Technol. 2014, 214, 2915–2925. [Google Scholar] [CrossRef]
  37. Chahal, V.; Taylor, R.M. A review of geometric sensitivities in laser metal 3D printing. Virtual Phys. Prototyp. 2020, 15, 227–241. [Google Scholar] [CrossRef]
  38. Reijonen, J.; Revuelta, A.; Riipinen, T.; Ruusuvuori, K.; Puukko, P. On the effect of shielding gas flow on porosity and melt pool geometry in laser powder bed fusion additive manufacturing. Addit. Manuf. 2020, 32, 101030. [Google Scholar] [CrossRef]
  39. Xie, Y.; Li, J.; Tao, Y.; Wang, S.; Yin, W.; Xu, L. Edge Effect Analysis and Edge Defect Detection of Titanium Alloy Based on Eddy Current Testing. Appl. Sci. 2020, 10, 8796. [Google Scholar] [CrossRef]
  40. Wang, Y.; Bai, Q.; Du, W.; Zhang, B. Edge Effect on Eddy Current Detection for Subsurface Defects in Titanium Alloys. In Proceedings of the 8th International Conference on Computational Methods, Guilin, China, 25–27 July 2017. [Google Scholar]
  41. Sharma, S.; Elshafiey, I.M.; Udpa, L.; Udpa, S.S. Probe design for edge-effect reduction in eddy current inspection. Proc. SPIE-Int. Soc. Opt. Eng. 1996, 2945, 14–22. [Google Scholar] [CrossRef]
  42. Dodd, C.V.; Deeds, W.E. Analytical solutions to eddy-current probe-coil problems. J. Appl. Phys. 1968, 39, 2829–2838. [Google Scholar] [CrossRef] [Green Version]
  43. Ma, X.; Peyton, A.J. Eddy current measurement of the electrical conductivity and porosity of metal foams. IEEE Trans. Instrum. Meas. 2006, 55, 570–576. [Google Scholar] [CrossRef]
  44. Cuevas, F.G.; Montes, J.M.; Cintas, J.; Urban, P. Electrical conductivity and porosity relationship in metal foams. J. Porous Mater. 2009, 16, 675–681. [Google Scholar] [CrossRef]
  45. Boillat, E.; Fivat, D.; Jhabvala, J.; Matthey, M.; Glardon, R. A review of different techniques to characterise the mechanical properties of SLS parts-Focus on resistivity measurements. In Innovative Developments in Virtual and Physical Prototyping- Proceedings of the 5th International Conference on Advanced Research and Rapid Prototyping; Taylor & Francis: Leiria, Portugal, 2011; pp. 281–286. [Google Scholar] [CrossRef]
  46. GUM. Evaluation of measurement data—Guide to the expression of uncertainty in measurement. Int. Organ. Stand. Geneva ISBN 2008, 50, 134. [Google Scholar]
  47. Gu, H.; Gong, H.; Dilip, J.J.; Pal, D.; Hicks, A.; Doak, H.; Stucker, B. Effects of powder variation on the microstructure and tensile strength of Ti6Al4V parts fabricated by selective laser melting. In Proceedings of the 25th Annual International Solid Freeform Fabrication Symposium, An Additive Manufacturing Conference. Austin, TX, USA, 4–6 August 2014; pp. 470–483. [Google Scholar]
Figure 1. (a) Eddy current testing (ECT) measurement principle. (b) Impedance plane representation. Adapted from Hippert [25].
Metals 11 01376 g001
Figure 2. Measurement setup used for ECT. (a) Standard UPEC tester of Sensima Inspection SARL. (b) X-Y table laboratory test bench.
Metals 11 01376 g002
Figure 3. Relative part density of parts manufactured from AlSi10Mg and 316L powder using varied scan speeds. The error bars depict the standard deviations of three density measurements per part. The micrograph and melt pool images were taken from x-z cross sections of cubes (10 × 10 × 10 mm3) manufactured in close proximity to the parts on the build plate, using the same process parameters.
Metals 11 01376 g003
Figure 4. Image obtained from the 2D scan of the 316L parts. The data contain the rotated signal mapped to the X and Y positions of the sensor during the raster scan, as described in Section 2.3. Below each part, the part description and relative density are presented. Non-significant differences between mean rotated signals of samples are indicated by grouping the respective parts. One sample used for the statistical analysis obtained from the central region of the part 2 × 5 mm2 (X × Y) is highlighted with a red rectangle on part S10.
Metals 11 01376 g004
Figure 5. Image obtained from the 2D scan of the AlSi10Mg parts. The data contain the rotated signal mapped to the X and Y position of the sensor during the raster scan as described in Section 2.3. Below each part, the part description and relative density are presented. Non-significant differences between mean rotated signals of samples are indicated by grouping the respective parts.
Metals 11 01376 g005
Figure 6. (a) Correlation of the rotated signal and the relative part density of 316L parts. (b) Correlation of the rotated signal and the relative part density of AlSi10Mg parts. The ECT data presented is extracted from a 2 × 5-mm2 (X × Y) region in the center of each part to exclude the edge effect. The error bars depict the standard deviation of the rotated signal across the extracted area (horizontal) and the standard deviation of three density measurements per part (vertical). The curve was fitted to the given data via the least squares method.
Metals 11 01376 g006
Table 1. Powder bed fusion (PBF) process parameters.
Parameter 316LAlSi10Mg
Scan speed(mm/s)500, 750, 1100, 1200650, 750, 850, 950, 1000
1250, 1300, 1400, 1750, 22501050, 1150, 1250, 1500, 2000
Hatch distance(µm)75100
Laser power(W)180
Layer thickness(µm)30
Laser spot diameter(µm)105
Scan pattern-90° alternating
Recoater type-Silicone reinforced brush
Shielding gas-Nitrogen
Table 2. Calculated standard penetration depths for 316L and AlSi10Mg. * assumed because Aluminum alloys are paramagnetic [26].
Parameter 316LAlSi10Mg
Excitation frequencyf(kHz)201.6201.6
Electrical conductivity σ (MS/m)1.38 [26]12.85 [27]
Relative magnetic permeability μ r (-)1.02 [26]1.00 *
Standard penetration depth δ (μm)945313
Table 3. Results of the pairwise multiple comparisons using the Games–Howell post hoc test based on Welch’s analysis of variance ( F ( 9 , 844 ) = 59,847, p < 0.01 ). The samples with sample size n = 209 were obtained from a 2 × 5-mm2 (X × Y) region in the center of each of the 10 parts (316L). ** p < 0.01 , * p < 0.05 , n s not significant.
Sample S2S3S4S5S6S7S8S9S10
ρ r (%)99.4399.3899.2798.9499.1899.0296.1493.2489.88
S199.37 0.12 n s < 0.01 ** 0.16 n s < 0.01 **< 0.01 **< 0.01 **< 0.01 **< 0.01 **< 0.01 **
S299.43 < 0.01 **< 0.01 **< 0.01 **< 0.01 **< 0.01 **< 0.01 **< 0.01 **< 0.01 **
S399.38 < 0.01 **< 0.01 **< 0.01 **< 0.01 **< 0.01 **< 0.01 **< 0.01 **
S499.27 < 0.01 **< 0.01 **< 0.01 **< 0.01 **< 0.01 **< 0.01 **
S598.94 < 0.01 **< 0.01 **< 0.01 **< 0.01 **< 0.01 **
S699.18 0.87 n s < 0.01 **< 0.01 **< 0.01 **
S799.02 < 0.01 **< 0.01 **< 0.01 **
S896.14 < 0.01 **< 0.01 **
S993.24 < 0.01 **
Table 4. Results of the pairwise multiple comparisons via the Games–Howell post hoc test based on Welch’s analysis of variance ( F ( 9 , 845 ) = 18760, p < 0.01 ). The samples with sample size n = 209 were obtained from a 2 × 5-mm2 (X × Y) region in the center of each of the 10 parts (AlSi10Mg). ** p < 0.01 , * p < 0.05 , n s not significant.
Sample A2A3A4A5A6A7A8A9A10
ρ r (%)97.7997.4197.5097.4699.3199.3699.2897.8488.89
A197.97< 0.01 **< 0.01 **< 0.01 **< 0.01 **< 0.01 **< 0.01 **< 0.01 **< 0.01 **< 0.01 **
A297.79 < 0.01 **< 0.01 **< 0.01 **< 0.01 **< 0.01 **< 0.01 ** 0.05 n s < 0.01 **
A397.41 < 0.01 **< 0.01 **< 0.01 **< 0.01 **< 0.01 **< 0.01 **< 0.01 **
A497.50 < 0.01 **< 0.01 **< 0.01 **< 0.01 **< 0.01 **< 0.01 **
A599.46 < 0.01 **< 0.01 **< 0.01 **< 0.01 **< 0.01 **
A699.31 < 0.01 **< 0.01 **< 0.01 **< 0.01 **
A799.36 1.00 n s < 0.01 **< 0.01 **
A899.28 < 0.01 **< 0.01 **
A999.84 < 0.01 **
Table 5. Estimation of the uncertainty of the determined relative density due to the instrument noise U I .
Parameter 316LAlSi10Mg
Standard deviation of the instrument noise σ n (-)0.00130.0013
Sensitivityb(%)220.2069.34
Uncertainty of the determined relative density via ECT U I (%) 0.02 % 0.06 %
Publisher’s Note: MDPI stays neutral with regard to jurisdictional claims in published maps and institutional affiliations.

