Review

Diffraction-Based Residual Stress Characterization in Laser Additive Manufacturing of Metals

1
Bundesanstalt für Materialforschung und -Prüfung (BAM), Unter den Eichen 87, 12205 Berlin, Germany
2
Institut für Werkstoff- und Fügetechnik, Otto-von-Guericke-Universität Magdeburg, Universitätsplatz 2, 39106 Magdeburg, Germany
3
Institut für Physik und Astronomie, Universität Potsdam, Karl-Liebknecht-Str. 24-25, 14476 Potsdam, Germany
*
Authors to whom correspondence should be addressed.
Metals 2021, 11(11), 1830; https://doi.org/10.3390/met11111830
Submission received: 25 October 2021 / Revised: 8 November 2021 / Accepted: 9 November 2021 / Published: 13 November 2021

Abstract

:
Laser-based additive manufacturing methods allow the production of complex metal structures within a single manufacturing step. However, the localized heat input and the layer-wise manufacturing manner give rise to large thermal gradients. Therefore, large internal stress (IS) during the process (and consequently residual stress (RS) at the end of production) is generated within the parts. This IS or RS can either lead to distortion or cracking during fabrication or in-service part failure, respectively. With this in view, the knowledge on the magnitude and spatial distribution of RS is important to develop strategies for its mitigation. Specifically, diffraction-based methods allow the spatial resolved determination of RS in a non-destructive fashion. In this review, common diffraction-based methods to determine RS in laser-based additive manufactured parts are presented. In fact, the unique microstructures and textures associated to laser-based additive manufacturing processes pose metrological challenges. Based on the literature review, it is recommended to (a) use mechanically relaxed samples measured in several orientations as appropriate strain-free lattice spacing, instead of powder, (b) consider that an appropriate grain-interaction model to calculate diffraction-elastic constants is both material- and texture-dependent and may differ from the conventionally manufactured variant. Further metrological challenges are critically reviewed and future demands in this research field are discussed.

1. Introduction

In recent years additive manufacturing (AM) has evolved from a technology for rapid prototyping to a mature production process used in several industries from aerospace to medical applications [1]. In essence, an energy source incrementally manufactures a part in a layer-by-layer process from a wire or powder feedstock [2]. AM processes allow the fabrication of complex structures, which cannot be produced via conventional manufacturing methods [3,4]. This freedom of design enables improvements in component performance and weight reduction of parts [4,5]. In addition, the rapid solidification rates and tailored heat treatment schedules can improve certain material properties, leading to further performance and efficiency gains [6,7,8,9]. However, process-related internal stress (IS) may lead to the formation of cracks or delamination [10,11,12,13]. IS may severely reduce the applicability of the process to manufacture materials more prone to this type of in-process damage. Moreover, very often IS locks large residual stress (RS) in the parts after production [14].
Therefore, certain materials, which are less susceptible to IS and to related defect formation, are generally preferred to date for the production with laser-based AM methods. These include engineering materials such as stainless steels, titanium-, aluminum-, and nickel-based alloys. In fact, alloys such as 316L, Ti6Al4V, AlSi10Mg, as well as Inconel 625 and 718 are widely used in laser-based AM. It is extremely difficult to monitor IS during production, especially in such complex AM-based processes. Therefore, extensive research has been dedicated to the topics of RS (i.e., the final footprint of IS). The RS determination and mitigation for those alloys are the subjects of this review.
The subjects have a further relevance: In recent years efforts have also been made to extend the laser-based AM production to materials more prone to IS and RS related defects, such as Nickel alloys Inconel 939 [15,16], Inconel 738 [17,18,19,20], or martensitic steels [21,22,23]. In these cases, the control and knowledge of the RS state gains an even greater importance. In fact, investigations have shown that even optimized process parameters (e.g., hatch spacing, laser power, scan speed or scan strategy) can result in high RS magnitudes [24,25]. In general, a careful selection of the process parameters allows the reduction of the RS level and thus increases the overall mechanical performance [26].
Several destructive and non-destructive techniques are available to determine the RS within a material. Due to their non-destructive nature diffraction methods are, naturally, the most widespread for the characterization of RS. The complete stress state within the bulk (by means of neutrons), the subsurface (by means of synchrotron X-rays) and surface (using Lab X-ray) can be characterized.
To allow the precise determination of RS using diffraction-based methods, knowledge about the microstructure, the texture and the processing conditions is required. First, a strain-free lattice spacing ( d 0 h k l ) must be found as a reference to permit the calculation of the strain [27]. The situation is akin to weldments, in which a chemical gradient appears across the weld line, provoking a variation of d 0 h k l [27,28,29,30]: chemical gradients due to solute-concentration variation are present in AM alloys [31]. This poses a new challenge for the determination of strain and subsequently stress. Secondly, the anisotropic nature of most single crystals requires material specific constants to enable the precise determination of RS by diffraction-based strain measurements [32,33,34]. The so-called diffraction-elastic constants (DECs) are not only dependent on the alloy, but also rely on the underlying microstructure and texture. In fact, the RS determination by diffraction methods is facilitated if a non-textured polycrystal with relatively small equiaxed grains is measured: in such a case the so-called quasi-isotropic approximation can be used [32,34]. In practice, this assumption is often invalid, as the microstructure can strongly deviate from equiaxed. However, the crystallographic texture and morphology strongly depend on the processing conditions. Rolled or hot-extruded materials, for example, typically exhibit a strong crystallographic texture, which may cause an anisotropic behavior [35,36]. Methods to deal with such process-related peculiar microstructures have been developed in the past for established manufacturing methods [27]. The columnar microstructures, which develop during laser-based AM, typically exhibit a strong crystallographic texture in conjunction with an inhomogeneous grain size along the build direction [37]. Therefore, well established models to determine the DECs in conventional products may fail to predict correct values for AM alloys [38,39,40].
While detailed reviews on the process parameter dependence and process-specific strategies of RS mitigation can be found in the literature [14,41,42,43,44], an extensive review on the methodology of diffraction-based methods with respect to laser-based AM processes is absent.
A first assessment of the critical aspects to account for in the domain of RS determination of AM was provided by Mishurova et al. [45]. Building on this, the present paper showcases an in-depth critical review of the literature in the domain of experimental characterization of RS in laser-based powder AM via non-destructive diffraction methods: An overview of practices and related challenges in diffraction-based RS determination for laser-based AM will be given. Especially, the appropriate choice of the DECs and d 0 h k l is paramount to provide accurate absolute RS levels [33,45]. Furthermore, it is indispensable to take the principal stress directions into account, which are for AM materials not necessarily governed by the geometry but instead by the building strategy and, consequently, by the microstructure anisotropy [46]. We will show that significant method development work is still necessary to reliably determine RS by diffraction methods in AM parts.

2. Laser-Based AM Processes

The first laser-based AM process, namely selective laser sintering (SLS), was first developed in 1979, although it took until the 1990′s until metal materials were manufacturable [47]. In this process a laser compacts loose powder in a layer-by-layer process to form a green body using a binding polymer [47]. A following infiltration fills the porosity to improve the overall mechanical performance [48]. The development of laser sources allowed EOS (Electro Optical Systems GmbH, Krailing, Germany) to develop a variant of SLS, which no longer needed a binding polymer, as the peripheral region of the powder particles was meltable [47]. The resulted parts were porous but had reasonable mechanical properties [49]. Further development in laser technology finally allowed the manufacturer to fully melt the powder bed [47]. The laser powder bed fusion (LPBF) and laser metal deposition (LMD) processes were then developed. These processes will be introduced in the next paragraphs and are the focus of this review, owing to their propensity to generate high residual stresses. These also are the leading metal AM processes for both new part production and repair engineering [50,51]. Therefore, they have high technological and environmental importance.

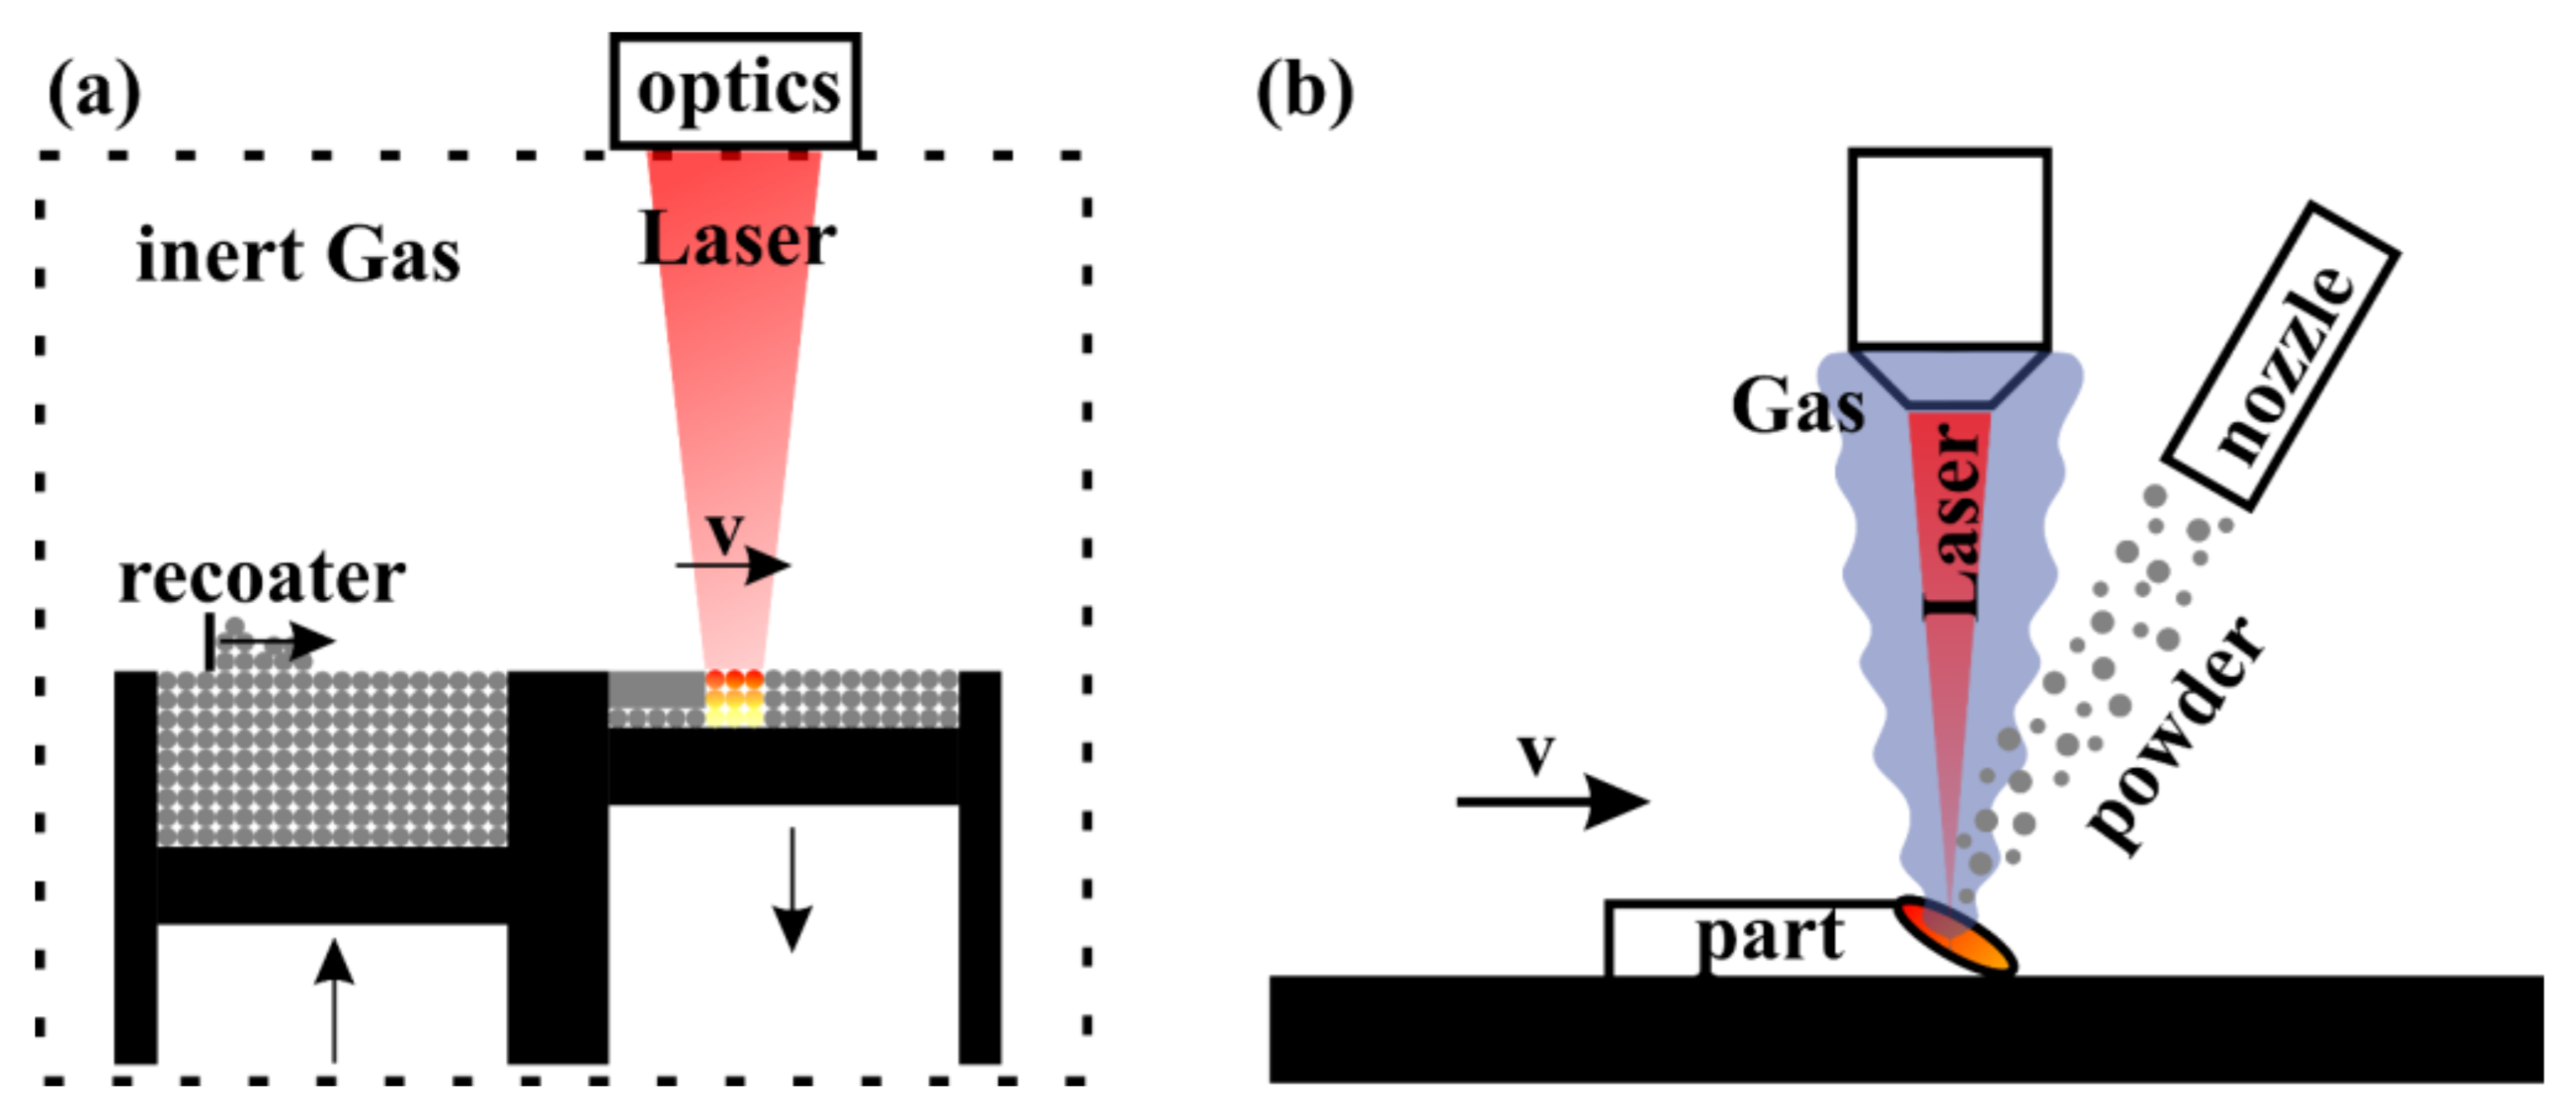
2.1. LPBF (Laser Powder Bed Fusion)

The usage of increasingly powerful lasers has increased the ability to fully melt the metallic powder [47]. This advance has gradually enabled the production of nearly fully dense (>99.9%) parts, if the process parameters are optimized, with mechanical properties comparable to those of conventionally produced metals [52,53]. Figure 1a illustrates the LPBF process. In a chamber flooded with a protective gas (typically Argon, to prevent oxidation during production), a recoater delivers powder from a reservoir to the build platform. A laser then melts predefined areas within the powder layer. The reservoir and build platform move accordingly to the part design and the steps are repeated in a layer-wise manner until the final part is produced.
The most relevant parameters for process optimization are laser power, scanning speed, layer thickness, hatching distance and, ultimately, the scanning strategy [54,55]. To reduce the temperature gradient during manufacturing, thereby reducing RS and distortions, preheating the baseplate is a typical approach [56]. Nowadays, preheating temperatures up to 1000 °C are realized [57]. The so-called inter layer time, which defines the time passed between deposition of subsequent layers can help to reduce microstructural gradients due to heat accumulation in the part [58]. Not only the process parameters but also the feedstock powder significantly influence the quality of the part. Typically, spherical particles with a size between 10–60 µm are ideal in terms of processability [59]. A comprehensive review on powders for LPBF can be found elsewhere [59]. When the process parameters are carefully controlled, parts with superior properties compared to SLS and direct metal laser sintering (DMLS) are manufacturable [52]. Due to the high heat input and high cooling rates, IS play a major role in those parts, which can lead to distortions and cracking, and remain locked in the part as RS [10,60].

2.2. LMD (Laser Metal Deposition)

While in the processes of SLS, DMLS and LPBF a first applied powder layer is selectively melted for part manufacture, during LMD a powder or wire feedstock, is directly fed into the laser beam focus [61]. In a powder-based process a carrier gas drags the powder from the feeder to the nozzle into the melt pool [62]. A second gas is used to prevent oxidation, whereby different gases are available as carrier and shielding [62,63]. Depending on the application different type of nozzles are available; they can influence the efficiency of the process [64,65]. The laser beam then fully melts the feedstock material, and the part is created in an incremental manner (Figure 1b). One of the main advantages of the LMD process is that in contrast to other processes the excess material is minimized, even though material loss can still be a problem due to overspray of the nozzle [65]. In addition, the deposition rates are higher during LMD, but the overall part quality typically suffers compared to LPBF [66]. The most relevant process parameters for process optimization are powder or wire feed rate, laser power, gas flow and scanning velocity [67]. In the LMD process layer thicknesses and particle sizes are commonly larger as compared to the LPBF process.
Figure 1. Simplified schematic images of the different laser-based additive manufacturing processes of (a) laser-powder bed fusion (adapted from [68]) and (b) powder-based laser metal deposition with a lateral injection nozzle (adapted from [69]).
Metals 11 01830 g001

3. Definition of Residual Stress

Residual stress (RS) is stress that exist in a manufactured part without the application of external loads, moments, or thermal gradients [34]. It is very unlikely for manufactured parts to be completely free of RS [70]. Figure 2 visualizes the different types of RS as defined in literature. Depending on the length scale over which the RS self-equilibrate, they can be categorized as the following [71]:
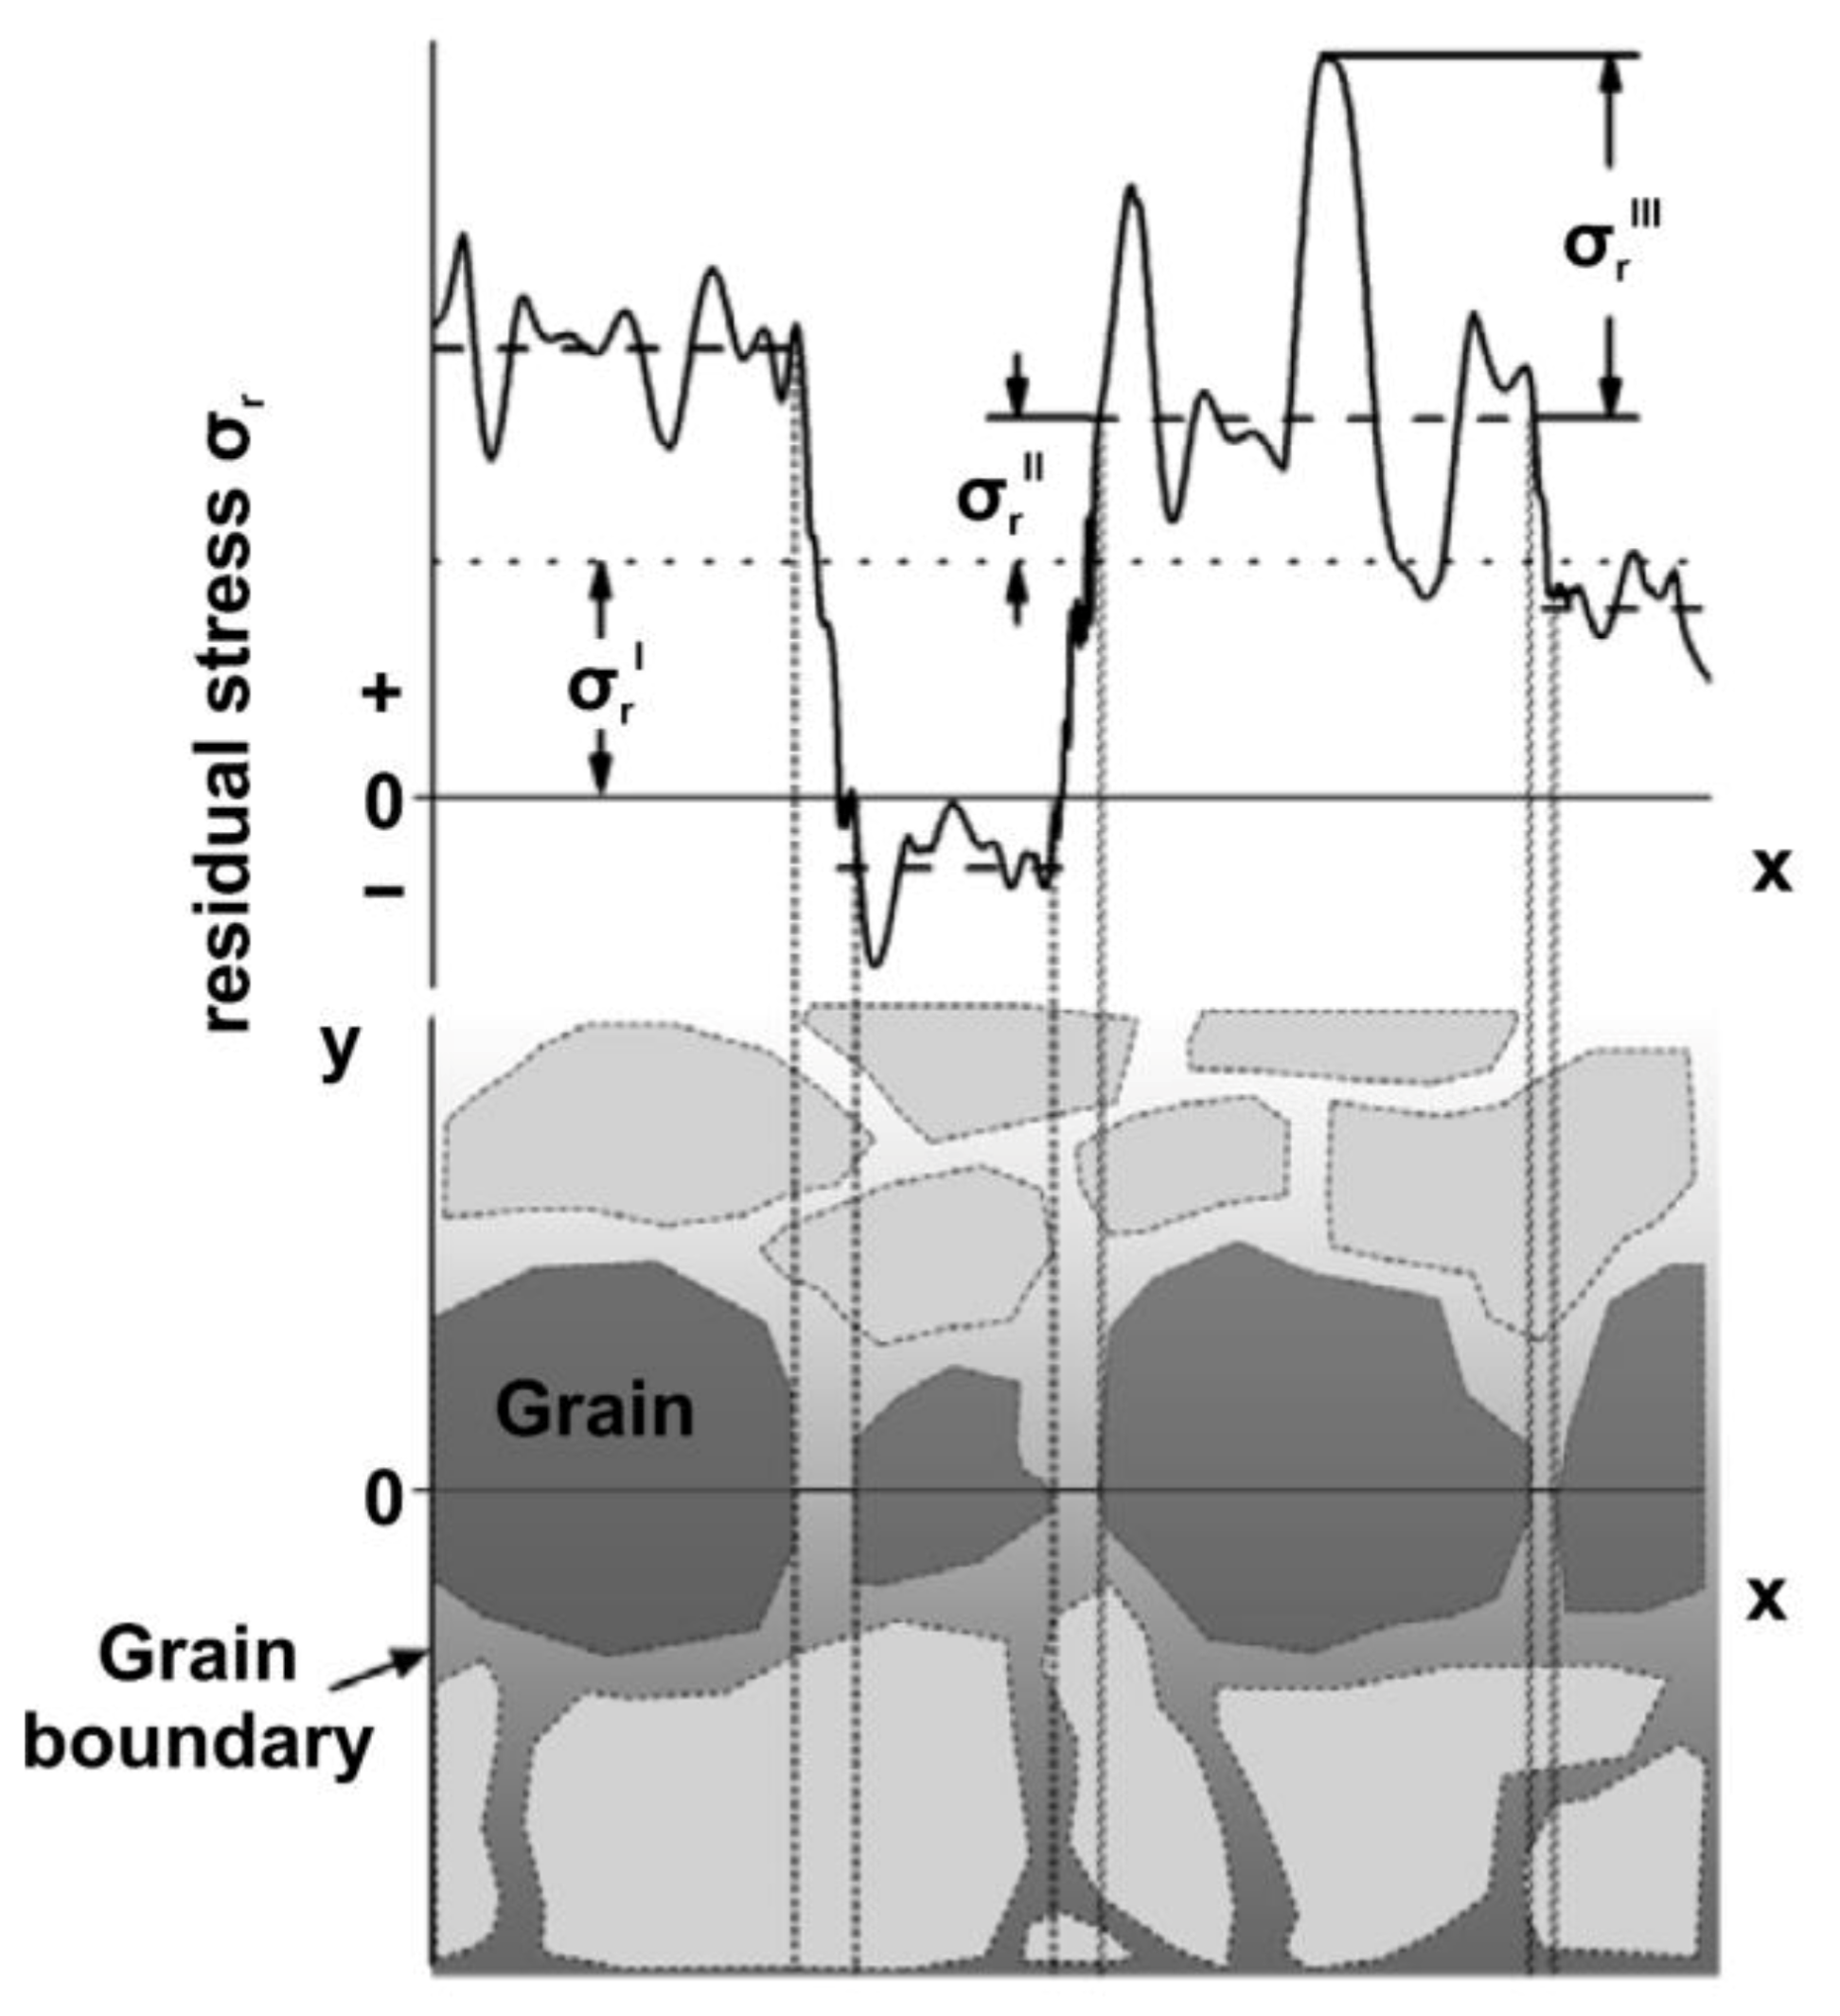
  • Type I stresses (σI) equilibrate over large distances (comparable to the size of the part). This type of RS can be caused e.g., by temperature gradients, machining, and other treatments at the component scale. They depend on the material and its history, as well as on the component geometry.
  • Type II or intergranular stresses (σII) vary over the grain scale and balance over a few grains. They strongly depend on the microstructure, and on the materials history, but weakly on the part geometry. Type II stress is very common in composites and crystallographically anisotropic materials
  • Type III stresses (σIII) vary over the atomic scale. Typically, this type is caused by defects of the crystal lattice (e.g., dislocations). They are balanced within each grain and depend on both the microstructure and the materials history.
While the failure of materials can depend on local features, and therefore on Type II and III stresses, in engineering applications usually Type I stress dominates. Indeed, a major contributor to RS in AM polycrystalline parts is Type I RS caused by localized heating, melting, and rapid solidification during the manufacturing process [60].
Figure 2. Schematic representation of the different types of RS within a polycrystalline material where σI, σII, σIII denote the type I, II and II stresses respectively. Adapted from [72].
Metals 11 01830 g002

4. Residual Stress with Respect to Laser-Based AM

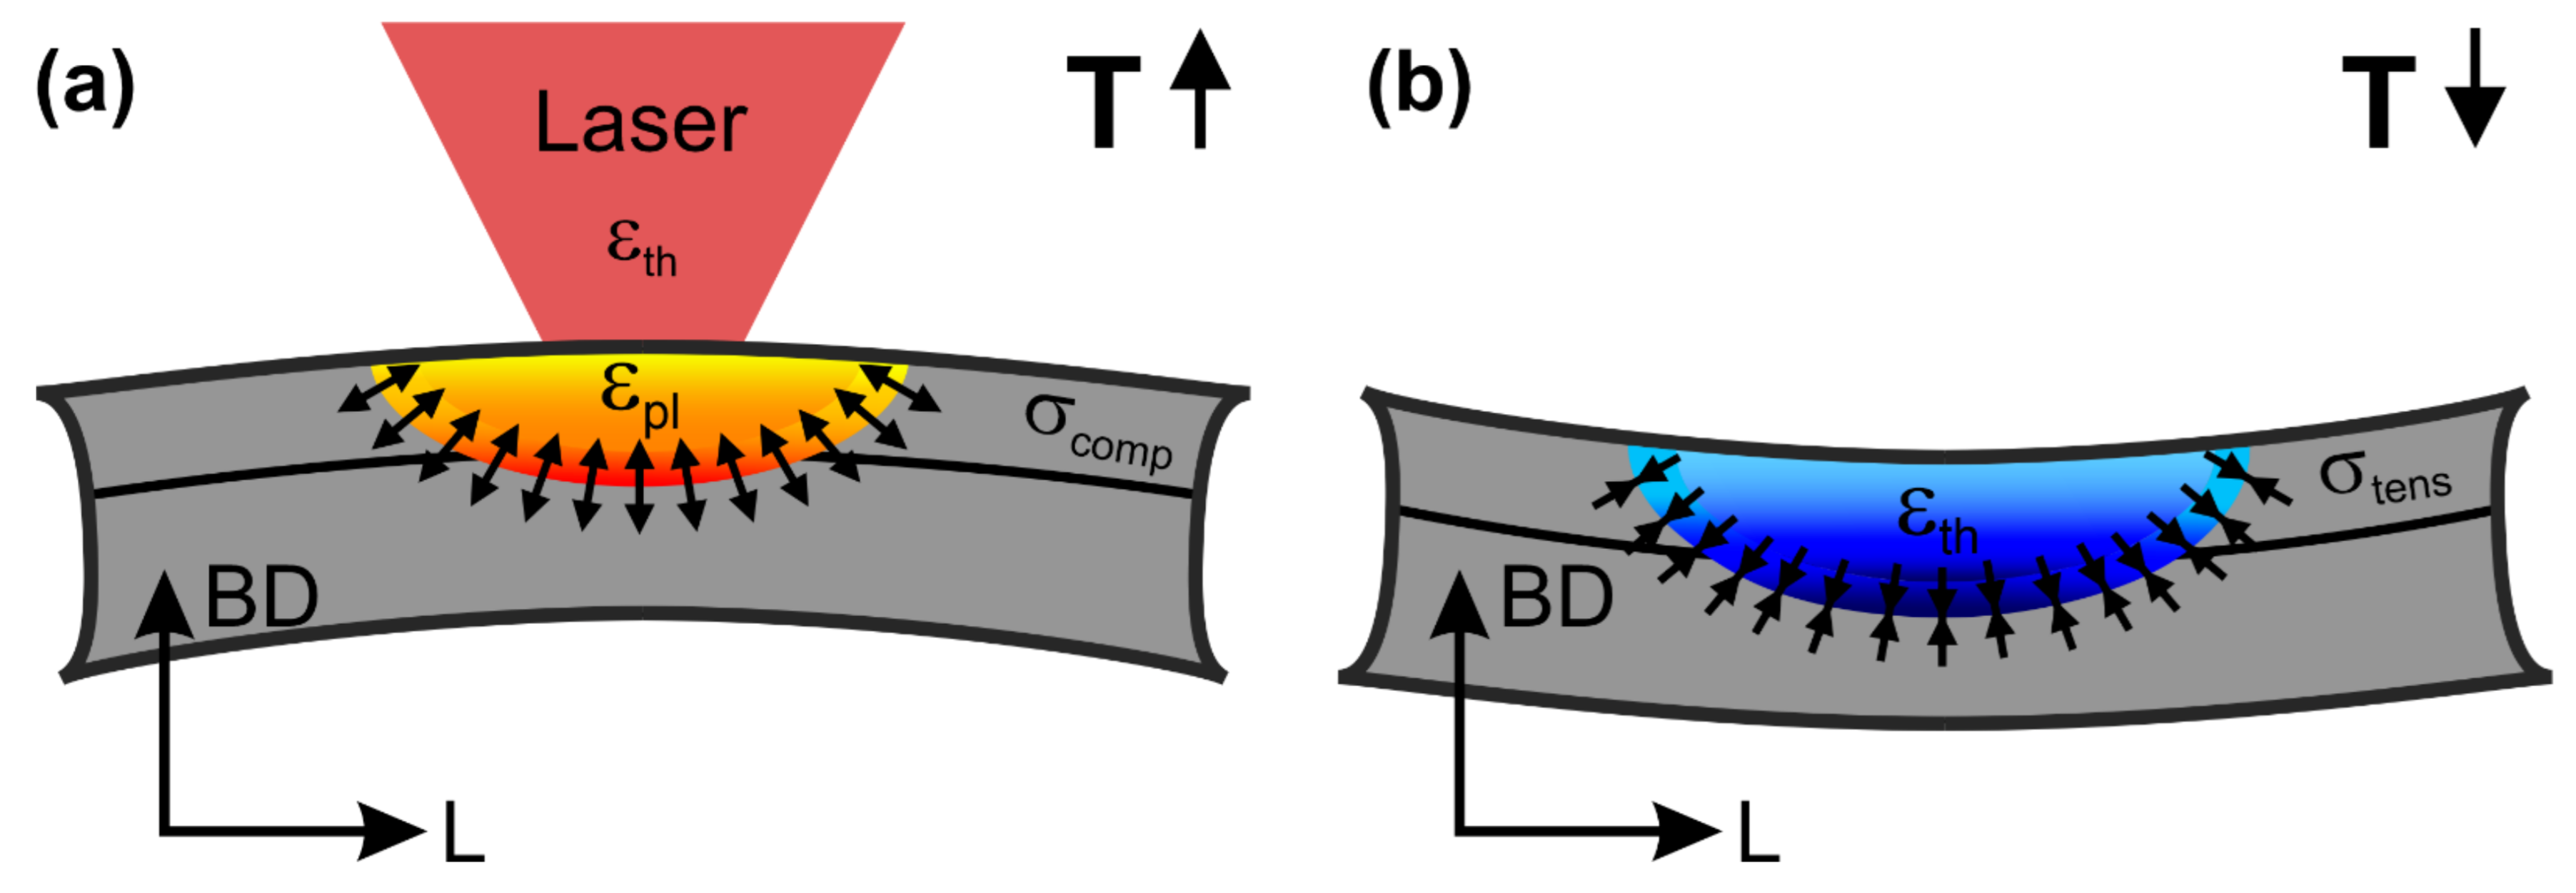
4.1. Origin of Residual Stress

Previous studies showed that RS in AM parts is primarily caused by the thermal gradients in conjunction with the solidification shrinkage that arise due to continuous re-heating, re-melting, and cooling of previously solidified layers [60,73,74]. The local and rapid heating of the upper layer by the laser beam, combined with slow heat conduction (Figure 3a), consequently leads to a steep temperature gradient within the material [60]. However, the already solidified layers restrict the expansion of the uppermost layer, thus leading to the formation of elastic compressive strains [60]. These strains eventually become plastic upon reaching the local temperature dependent yield strength [60]. Therefore, without the presence of mechanical constraints, such plastic strains (εpl) would lead to bending as indicated in Figure 3a [60]. During cooling, the shrinkage (εth) of the plastically compressed upper layers leads to an inversion of the bending [60]. The aforementioned is accompanied by the formation of tensile RS in the locally plastically deformed region, balanced by surrounding compression (Figure 3b) [60]. Finally, solidification shrinkage of the molten layer superimposes on the solid-state mechanisms, which leads to tensile RS at the upper most surface balanced by subjacent compression [60]. Extending this phenomenon over multiple layers leads to large thermal gradients particularly along the building direction. Thus, large RS may appear in the final part. The RS itself is influenced by many manufacturing parameters, e.g., the number and the thickness of the layers [60], the geometry, the scanning strategy [38,75,76,77], and the laser energy density [13]. Optimization of these parameters can significantly reduce RS but also needs to be balanced against the impact on defects and microstructure. The current approach is to optimize some scanning parameters and the scanning strategy, since they highly affect thermal gradients [78]. An alternative approach is the use of stress relieving heat treatments to reduce the magnitude and subsequent impact of RS [41]. These heat treatments must also be balanced against manufacturing cost considerations and both the desired microstructure and the consequent mechanical properties of the alloys.

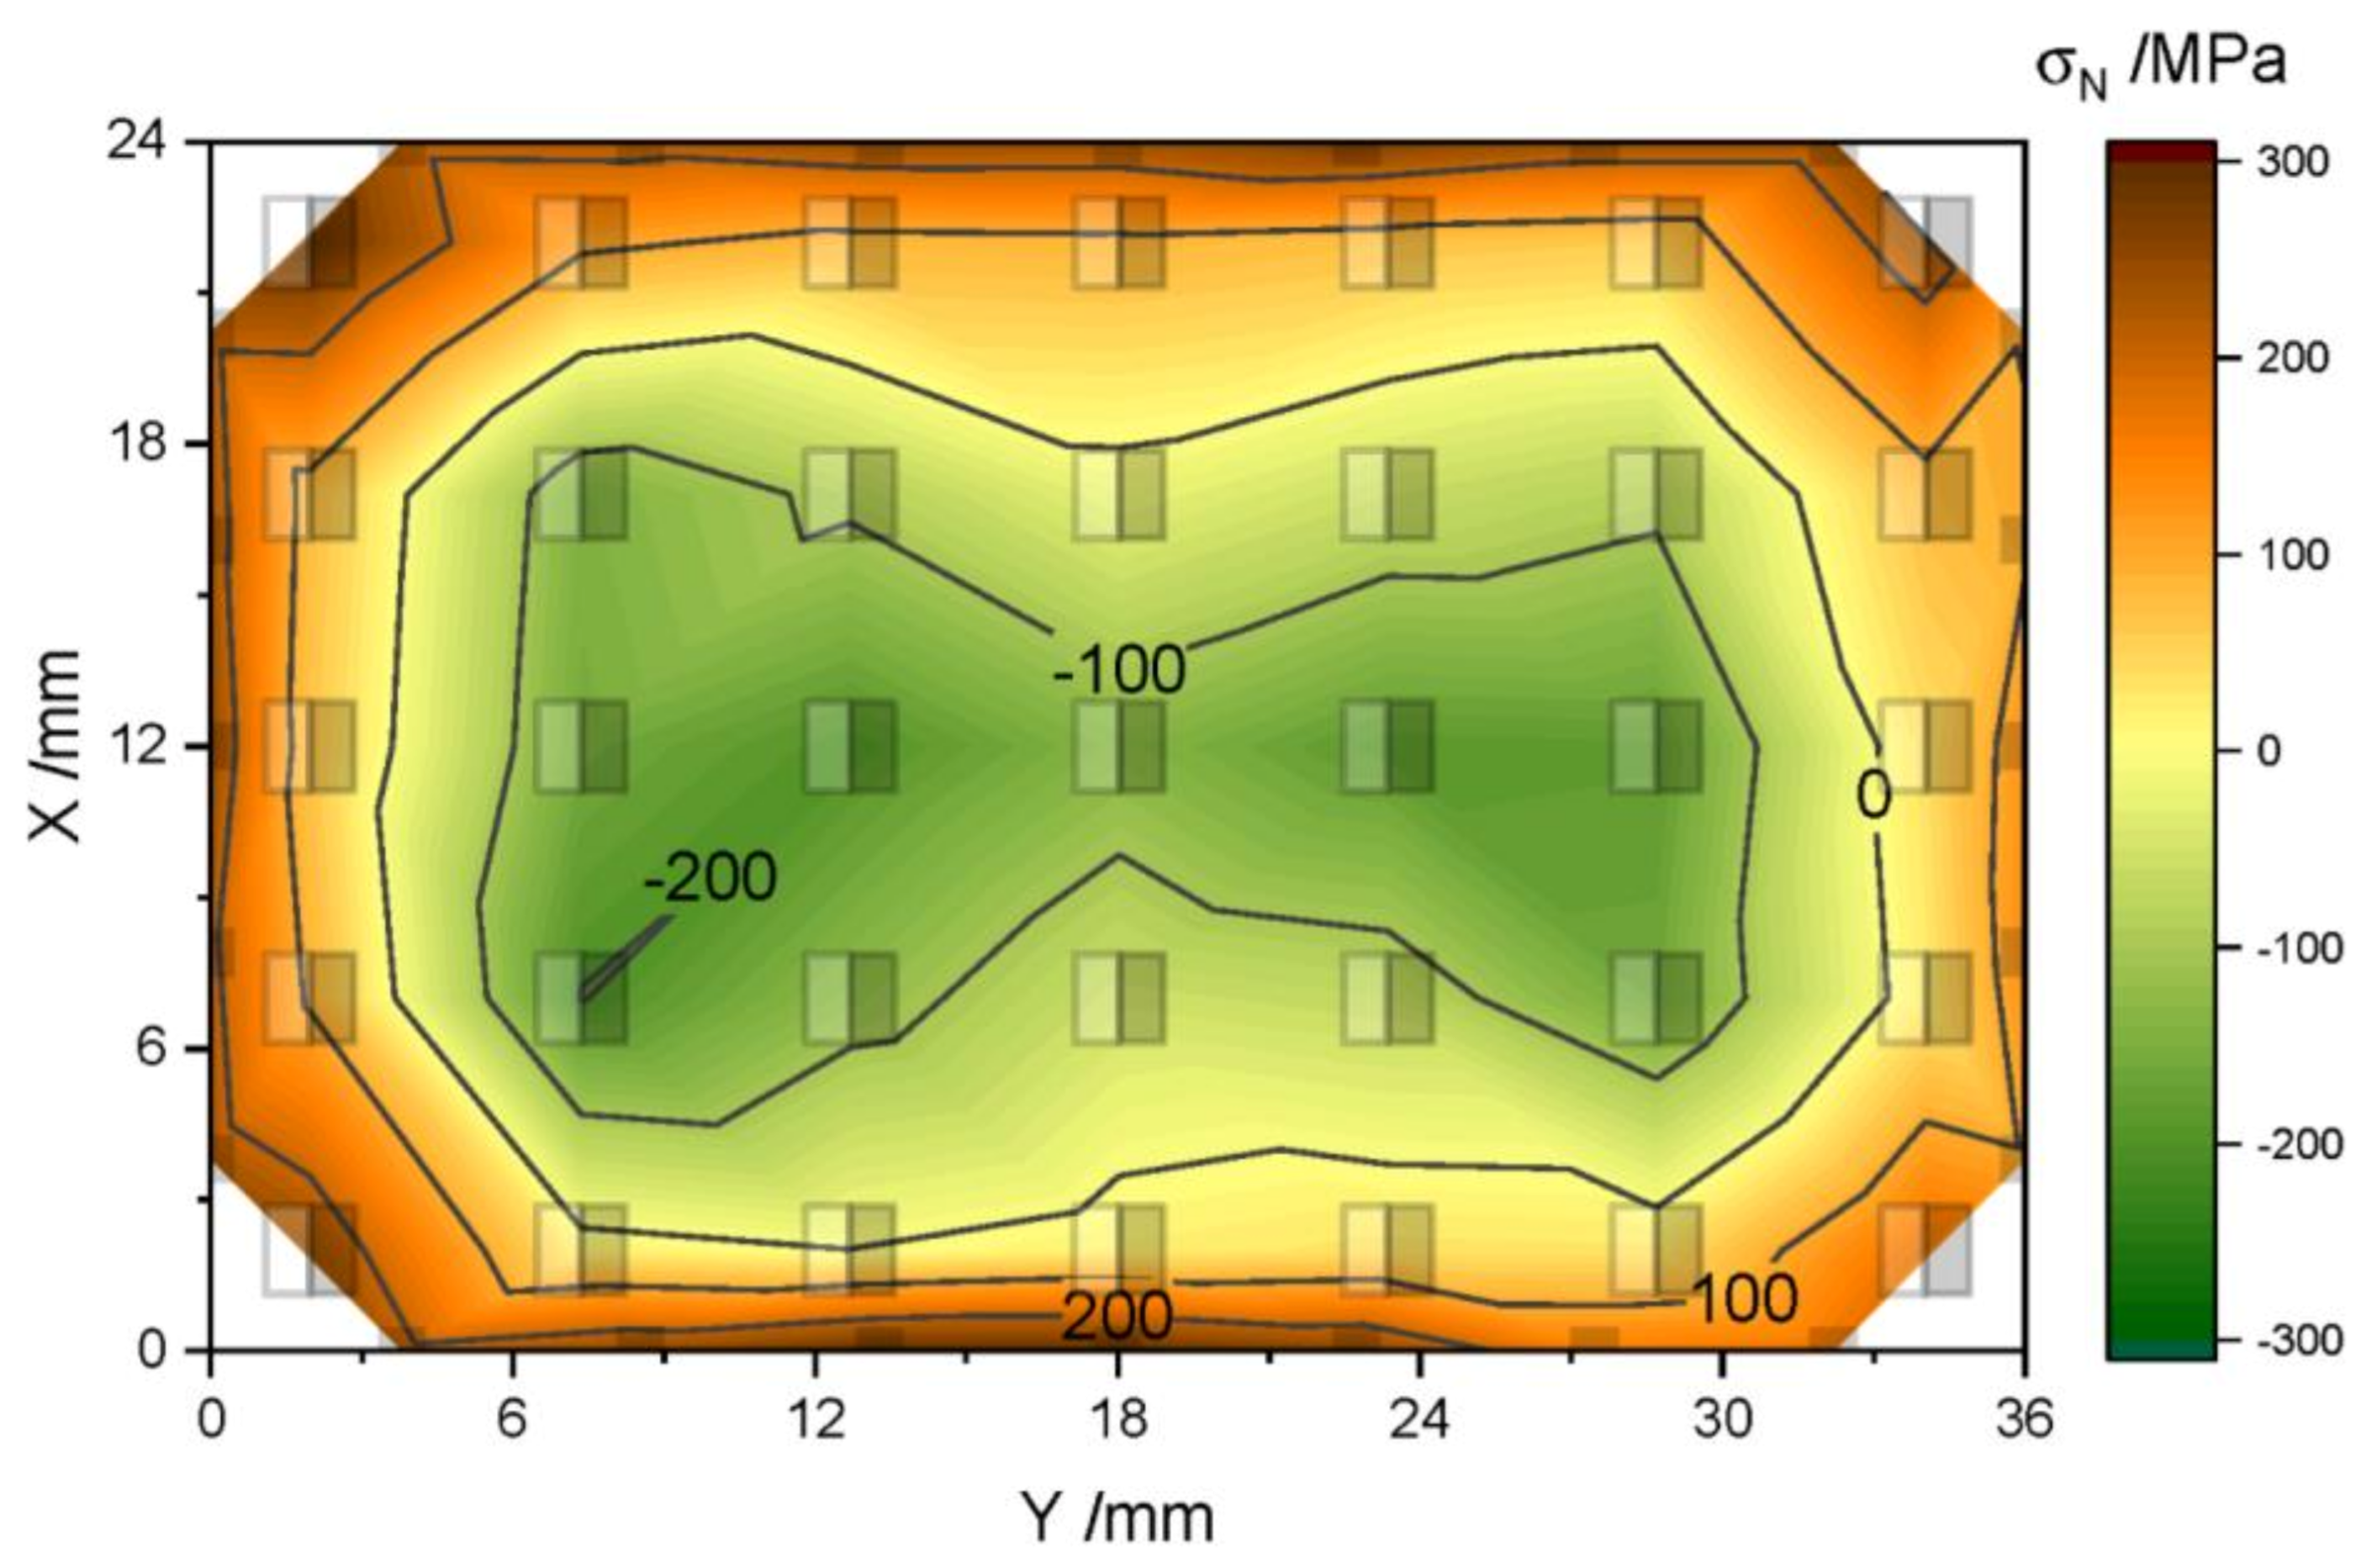
4.2. Distribition of Residual Stress

An exemplary RS distribution for LPBF of 316L is shown in Figure 4, acquired on 24 mm × 46 mm × 21 mm prisms at middle height [79]. Measurements conducted by X-ray diffraction reveal the presence of high magnitude tensile RS at the surfaces [79]. Bulk neutron diffraction measurements show that stresses invert to compressive RS at an approximate distance of 6 mm from the surfaces, balancing the tensile RS [79]. In fact, it is typical that tensile stresses develop at the surfaces which are balanced by compressive stresses in the bulk [12,60,74,75,79,80,81,82,83,84,85,86,87,88,89,90,91]. As mentioned before, the magnitude and distribution of the RS locked in the part is dependent on the manufacturing parameters. However, the general aspects remain unchanged irrespective of the alloy being produced. To characterize the complete stress distribution within a sample, different measurement methods may be required [79]. The methods and the associated challenges to determine the RS from diffraction-based methods in the domain of laser-based AM will be introduced in the following paragraphs.

5. Determination of Residual Stresses with Diffraction-Based Methods

The determination of RS can be categorized into destructive (e.g., hole drilling, crack compliance method, hardness testing, etc.) and non-destructive methods (e.g., Bridge curvature method, diffraction, etc.) [92]. However, this paper will solely focus on the methodology of non-destructive diffraction-based methods for RS analysis used for laser-based AM. Therefore, in the following paragraphs the most relevant diffraction techniques will be introduced. Diffraction techniques are well established non-destructive method to evaluate RS in both academia and industry. Determining elastic strains by measuring the variation of lattice spacing provides a powerful method to identify RS at the surface (X-ray diffraction, XRD), at the subsurface (synchrotron energy dispersive diffraction, ED-XRD), as well as in the bulk (synchrotron or neutron diffraction, ND) [13,74,82,83].

5.1. General Aspects of Diffraction-Based Methods

The Bragg equation [93] (Equation (1)) describes the condition for constructive interference of spherical waves emitted by an ordered arrangement of atoms (in lattice planes with distance d h k l ), induced by an impinging planar wave of wavelength λ with its order of diffraction n. This law provides the basis for the determination of RS with diffraction-based methods, as the lattice (quantified by the interplanar distance d h k l ) can be used as a strain gauge. Consequently, once a material is under the effect of RS the d h k l are altered. Since the beam size in XRD, SXRD or ND measurements is finite, the measured diffraction peak contains a superposition of type I and type II RS within the sampling volume [71]. In all diffraction measurements, the total strain of the lattice is expressed by a shift of the respective diffraction peak (Equation (1)). For the monochromatic case, with a defined wavelength λ, and a known strain-free lattice spacing ( d 0 h k l ), a peak shift to lower scattering angles represents a tensile strain, while a shift to larger scattering angles a compressive one. Type III stresses will mostly contribute to the broadening of the peak or changes in the peak shape [32].
2 d h k l s i n θ = n λ
The strain is then calculated as
ε h k l = d h k l d 0 h k l d 0 h k l
However, to link the determined lattice strains in the laboratory coordinate systems to macroscopic stresses in the sample coordinate systems a few more considerations are necessary. A short description of the fundamentals of RS determination with diffraction-based method is, therefore, presented in the following. For a more detailed description on RS analysis by diffraction-based methods, the reader is referred to the literature [32,33,34,71,94].
In the general case, RS is derived from lattice strains of a particular set of lattice planes. The measured values are d φ ψ h k l , i.e., interplanar distances at different sample orientations (φ,ψ). For the RS determination, the strains are calculated as in Equation (2) and successively converted to elastic stresses via Hooke’s law. This yields the general equation for RS determination in the Voigt notation (Equation (3)). Equation (3) connects the elastic lattice strain ε φ ψ h k l (in all directions (φ,ψ) with the components of the stress tensor in the sample coordinate system by using a transformation matrix (Figure 5). The stress (denoted by σ S ) is averaged over all crystallites contained in the gauge volume. The values 1 2 S 2 h k l (Equation (4a)) and S 1 h k l (Equation (4b)) represent the diffraction elastic constants (DECs), which in general depend on the measurement direction in the crystal system. These constants take the elastic anisotropy of the single crystal into account and are discussed in detail later. However, for quasi-isotropic (poly)-crystals they are independent of the sample coordinate system. The DECs serve as proportionality constants, which connect the measured d φ ψ h k l to a macroscopic RS for the different lattice planes. A further unknown parameter is d 0 h k l , which represents the reference value for the determination of the strain. Different strategies are available to determine the d 0 h k l , which will be examined later.
ε φ ψ h k l = d φ ψ h k l   -   d 0 h k l d 0 h k l =   1 2 S 2 h k l   [ s i n 2 ψ σ 11 S c o s 2 φ + σ 22 S s i n 2 φ + σ 12 S s i n 2 φ     σ 33 S + σ 33 S + 2 s i n 2 ψ ( σ 13 S c o s φ + σ 23 S s i n φ ) ] + S 1 h k l ( σ 11 S + σ 22 S + σ 33 S )
1 2 S 2 h k l = 1 + ν h k l E h k l
S 1 h k l = - ν h k l E h k l
Equation (3) represents the most general case, where all stress components are present. If simplifying assumptions can be made, such as the absence of shear stress components (i.e., the fact that the sample coordinate system coincides with the principal stress system), plane stress or plane strain states, or that a particular component vanishes, the equation would simplify. Some cases are developed in more detail below. The same would happen if we can apply simplifications on the DECs, as for instance assume that the material is isotropic.

5.2. X-ray Diffraction

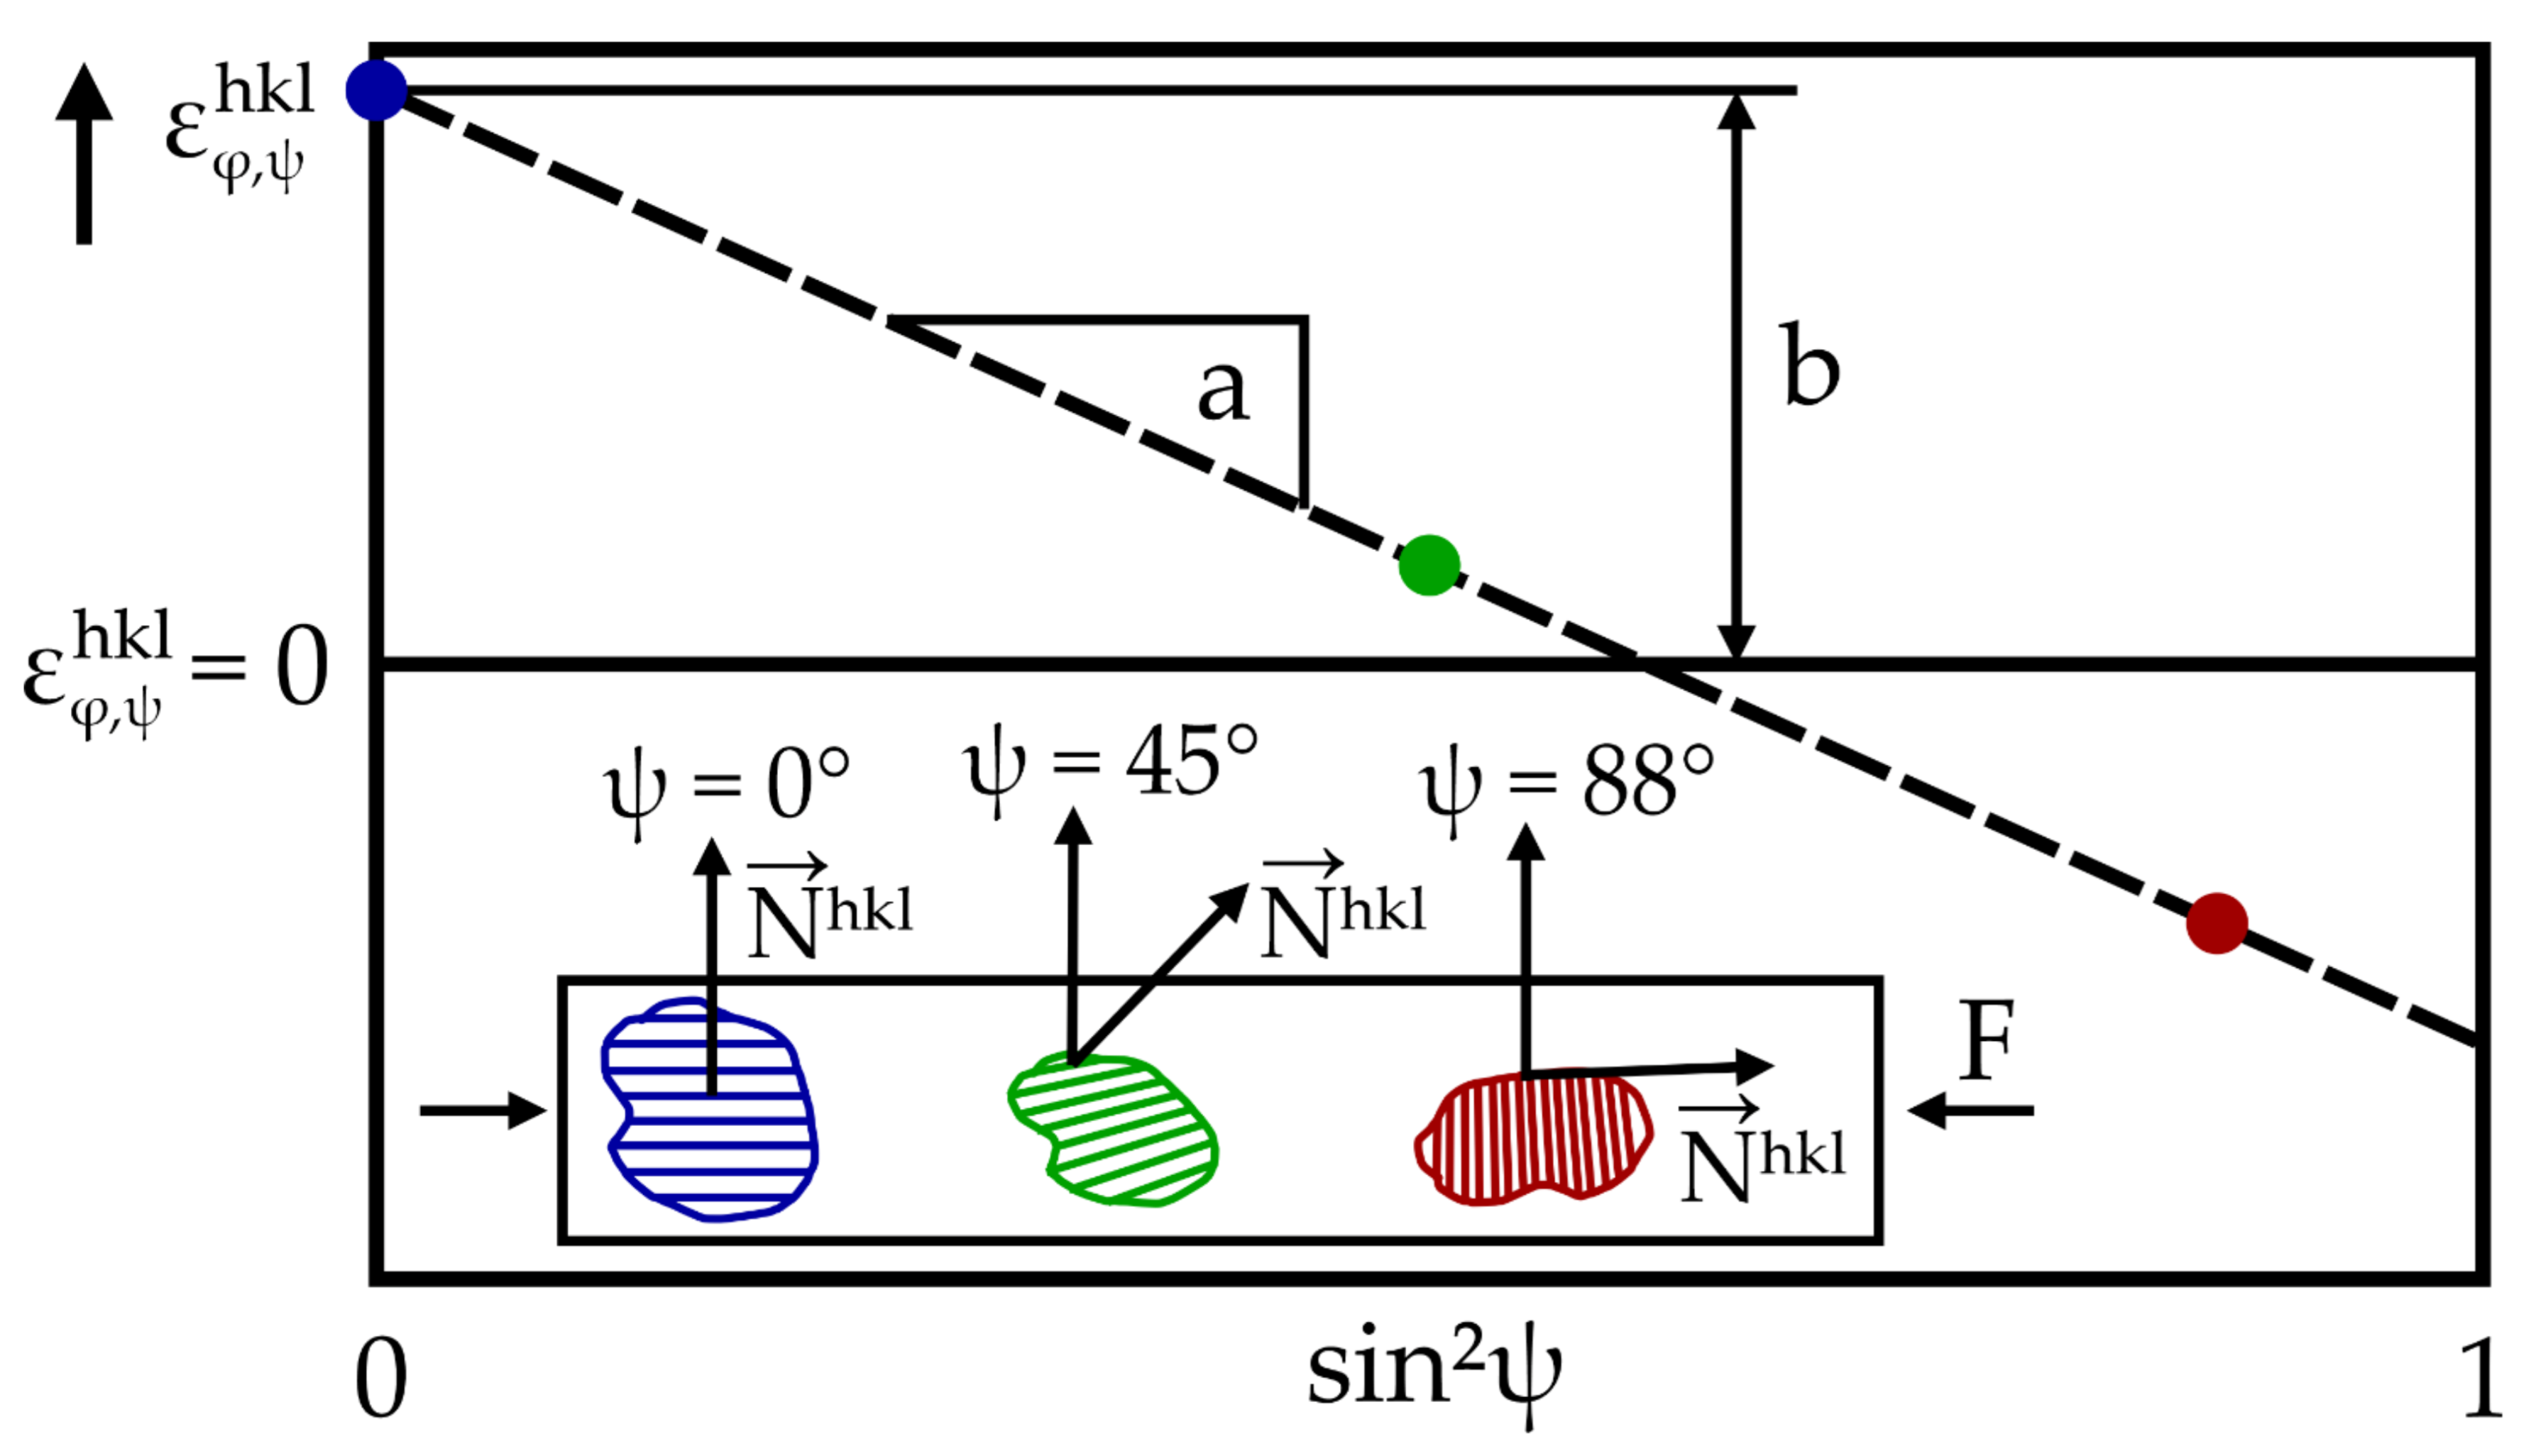
5.2.1. The Monochromatic Case for Surface Analysis

The use of monochromatic X-ray sources for the determination of RS is widely spread. The penetration depth is in the order of a few µm. The general equation for RS determination (Equation (3)) can thus be simplified: The stress components normal to the measurement plane 12 [ σ i 3 = 0   ( i = 1 ,   2 ,   3 ) ] can be considered zero (Equation (5)).
ε φ ψ h k l = 1 2 S 2 σ φ s i n 2 ψ + S 1 σ 11 + σ 22 with   σ φ = σ 11 c o s 2 φ + σ 22 s i n 2 φ + σ 12 s i n 2 φ
As laboratory setups mostly use monochromatic X-rays sources, an appropriate lattice plane representing the bulk material must be chosen. A guideline for this can be found in DIN EN 15305 [95], but will be discussed more in detail in Section 6.4. The main approach used in laboratory X-ray devices is the s i n 2 ψ method in which the lattice spacing is measured under variation of the ψ angle under a (usually) fixed φ angle (Figure 5). Equation (5) can be considered a linear equation of the form ε ( s i n 2 ψ ) = a · s i n 2 ψ + b . The straight line has a slope of a = 1 2 S 2 σ φ and intersects the ε ( s i n 2 ψ ) axis at b = S 1 σ 11 + σ 22 . From the linear regression of the respective ε ( s i n 2 ψ ) —distribution the RS can be determined in the direction φ (Figure 6). In an ideal case, where an elastically isotropic or non-textured material in a homogeneous stress state is sampled, the obtained ε ( s i n 2 ψ ) is truly linear [32]. Even though these requirements are often not fulfilled, the errors are typically of small order and can thus be neglected [32]. However, for strongly textured materials (e.g., rolled, additively manufactured) the deviations can be severe. In the case of present shear stresses (e.g., σ13 and σ23) an ellipsoid is observable (different ε ( s i n 2 ψ ) for ± ψ ) rather than a linear distribution. By the subtraction of the respective − ψ and + ψ distributions a linear equation is obtained. Finally, from its slope the shear stress component in the direction φ can be determined. Although normal stress components can also be determined within the information depth of the radiation this requires the precise knowledge of d 0 h k l , which is not needed for the determination of shear stresses [32]. Due to the relatively low penetration of lab X-rays into metallic materials, the surface roughness of additively manufactured material impacts the determined stress values [96].

5.2.2. The Energy Dispersive Case

In addition to the monochromatic (angular dispersive) XRD technique, it is also possible to use polychromatic radiation (white beam) for RS determination. An energy dispersive detector detects the respective energies of the diffracted X-rays at a fixed diffraction angle θ. In such manner the entire diffraction spectrum of the respective material can be obtained for each measurement direction ( φ , ψ ) [32]. Due to the wide energy range used, the information retrieved arises from different depths of the specimen [97]. The information depth of the respective energy can be calculated using the following equation [97]:
τ η = s i n 2 θ   -   s i n 2 ψ + c o s 2 θ s i n 2 ψ s i n 2 η 2   µ E h k l s i n θ c o s ψ
The information depth is a function of the sample rotation around the diffraction vector η , the diffraction angle θ , the tilt angle ψ and the energy dependent linear absorption coefficient µ ( E h k l ) . The latter is material dependent. τ η defines the depth below the surface from which 63% of the total diffracted intensity comes from [98].
The Energy of each respective reflection can be directly transferred to the lattice plane spacing by rewriting the Braggs law in terms of photon Energy E h k l [99]:
d h k l ( ) = h   ·   C 2 s i n θ 1 E h k l     6 . 199 s i n θ 1 E h k l
In Equation (7) h is the Planck constant and c the speed of light. The s i n 2 ψ method is also applicable for the energy dispersive case. The ε ( s i n 2 ψ ) distributions are simply calculated using Equation (7) together with the strain definition (see Equation (2)). The same simplifications (as for lab X-ray) apply whenever measuring in reflection mode or a biaxial stress state can elsewise be justified. In fact, the plane stress assumption might only hold for lower energy ranges with a low penetration depth. This complicates the RS analysis of higher energy reflections, as the triaxial approach could be more suitable. The acquisition of the entire diffraction spectrum allows the stress analysis for each lattice plane observed. Therefore, a depth resolved stress analysis (near surface) is possible up to the maximum information depth (according to Equation (6)). With respect to laser-based AM, authors have extracted RS depth profiles by using the combination of different reflections (under the assumption of vanishing stress component normal to the surface) [38,96]. In addition, a full pattern refinement to obtain an average d h k l can be conducted (e.g., Rietveld refinement) [100]. Recently, Hollmann et al. [101] proposed methods for near surface measurements of materials with cubic symmetry and nearly single crystalline texture (e.g., additively manufactured).
Due to the high energies available in synchrotron facilities even measurements in transmission are possible both in angular (monochromatic) and energy dispersive (polychromatic) modes, depending on the material measured and the sample thickness [32]. In these cases, depending on the geometry, the out-of-plane stress cannot be neglected and hence the triaxial stress analysis approach is required. However, the ability to perform triaxial RS measurements is hampered by the use of elongated lozenge-shaped sampling volume, typical in high energy diffraction measurements (because of the required small diffraction angle [32]). On the one hand, the method therefore allows a very high spatial resolution (in the order of 10–100 μm) in the two in-plane directions, but on the other hand the spatial resolution becomes poor (several millimeters) in the out-of-plane direction. Despite this limitation, energy dispersive techniques are well suited for thick wall geometries, whereby the stress state is closer to the plane strain condition and limit gradients exist though the thickness. Moreover, significant work is reported on the use of transmission set-up for the determination of DECs through in situ tensile testing. This topic is addressed in Section 6.3.3.

5.3. Neutron Diffraction

As neutrons have a high penetration depth in most materials, fully 3D stress states can be probed. The gain in generality of the approach must be paid at a price: the strong dependence of the RS analysis on the reference interplanar spacing, d 0 h k l . Additional complications arise when d 0 h k l differs over the analyzed region due to chemical gradients over the specimen. These points are discussed in detail in Section 6.1. There are two neutron diffraction methods to determine RS: the monochromatic and the time-of-flight (TOF) method. The TOF method uses a polychromatic beam and rests on the detection of many diffraction peaks. Thus, the method leverages on the fact that the velocity of the neutrons is inversely proportional to its wavelength. In the monochromatic case, the instrument operates with a fixed wavelength, and most commonly only one peak at a time can be detected. The two methods will be introduced briefly below. For a more detailed description the reader is referred to the literature [94].

5.3.1. The Monochromatic Method

In scattering, a neutron may be described by its wave vector k, of magnitude 2π/λ directed along its velocity part [94]. Due to the wave nature of matter, the de Broglie wavelength of the neutron (λ) is directly linked to the momentum (p) of the respective particle [94]:
p = m n v = h k 2 π = ħ k
This allows the calculation of an associated wavelength in dependence of the neutron velocity v and mass mn with the Planck’s constant h. In the monochromatic case, neutrons with a given wavelength are used to study the lattice strain within the material [102]. The wavelength of the neutrons is usually selected using a single crystal monochromator from a broader neutron wavelength spectrum [102]. Typically, the wavelength is chosen so that a diffraction angle of around 2θ~90° is used. The condition 2θ~90° allows the definition of a nearly cubic sampling (gauge) volume. Thereby, probing the same region upon any sample rotation. The diffracted signal is usually then detected on a position sensitive detector or a scanning point detector [94]. An example of a typical diffraction peak obtained is shown in Figure 7, which are typically fitted using a symmetric function (e.g., Gaussian).
The change of diffraction angle with respect to a reference value yields variations of the lattice strain and can be expressed in the angular form as [102]:
ε h k l = Δ d h k l d h k l = Δ θ h k l c o t θ h k l
Similar to the angular dispersive X-ray methods (see Section 5.2.1), an appropriate lattice-plane must be chosen, which represent the bulk behavior the best. For the stress analysis the same relations remain valid. However, the isotropic form of the Hooke’s law typically is applied along three orthogonal principal strain components [94] (see Equation (14)). The consequences for the related assumptions with respect to principal directions are discussed in Section 6.2.

5.3.2. The Time-of-Flight Method

The neutron diffraction (ND) time-of-flight method is the equivalent to polychromatic diffraction in the X-ray case. From the neutron travel time between source and detector, the associated wavelength can be calculated (Equation (10)) [94].
λ = h t m n L
As detectors are placed at 2θ~90°, using Bragg’s law (Equation (1)) one can directly determine d h k l from the wavelength at which peaks appear in the diffraction spectrum (for a known crystal structure). A typical ND diffraction spectrum is shown in Figure 8. In contrast, to steady state sources (monochromatic), the time-pulsed source instruments (time-of-flight) typically cause an asymmetry due to the moderation process: More complicated fitting functions are typically necessary [94]. Using the TOF methods an average d can be obtained by a full pattern refinement, but also single peak fits are performable [102].

6. Peculiarities of Diffraction-Based Methods in the Case of AM
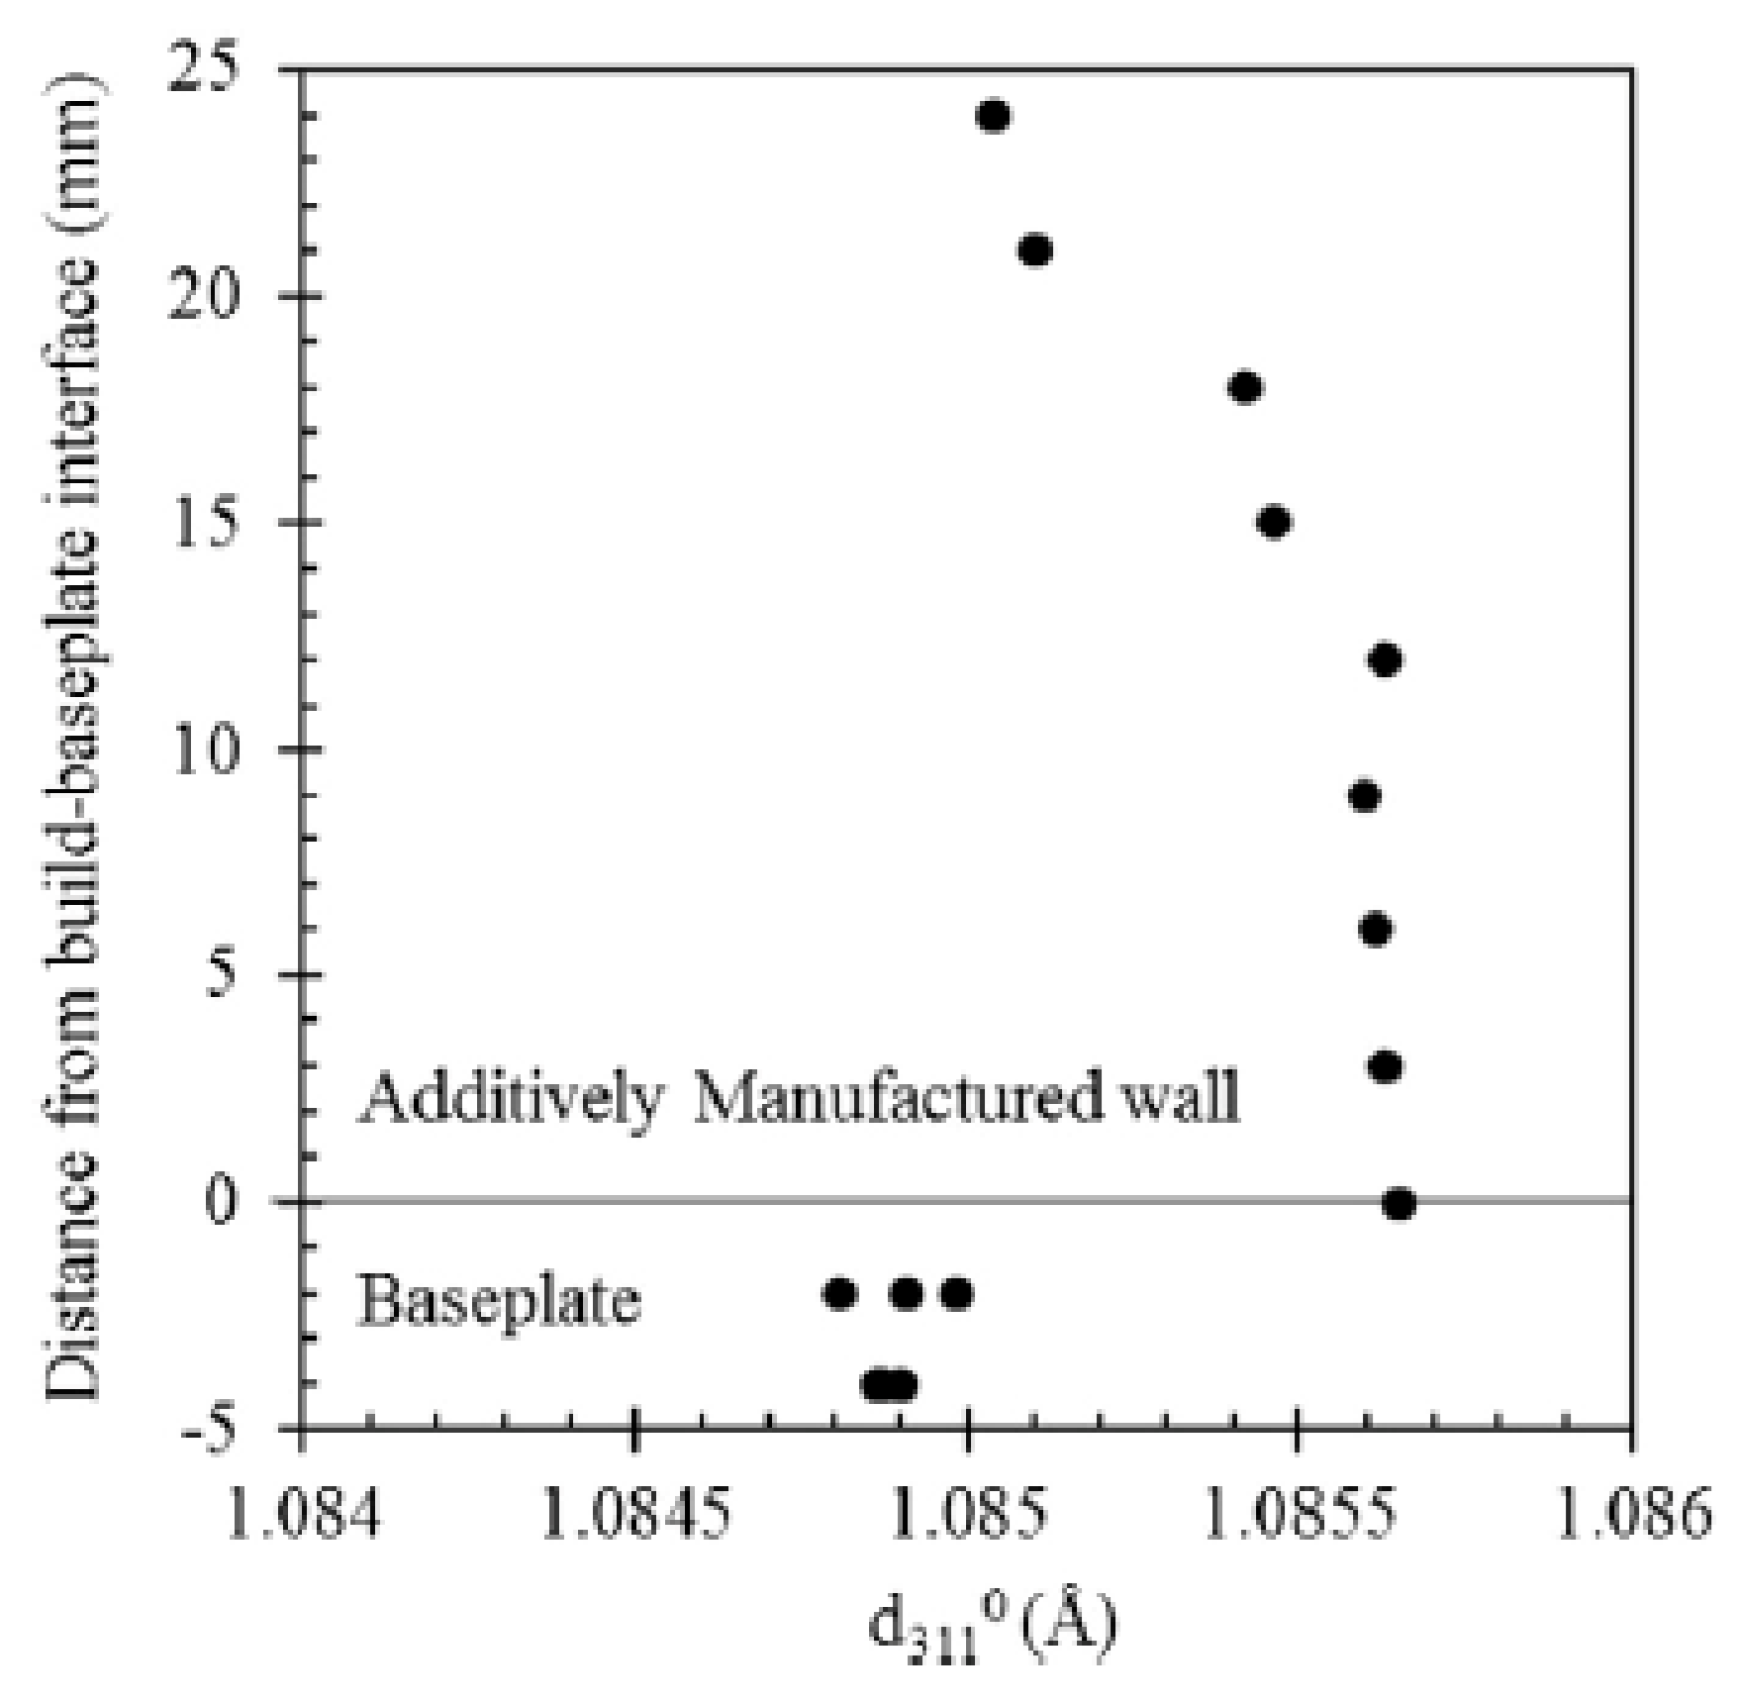
6.1. Strain-Free Lattice Spacing ( d 0 h k l )

To precisely determine RS in parts using diffraction-based techniques, the knowledge of a d 0 h k l as a reference is essential (see Equation (2)). A comprehensive description of the methods to obtain a d 0 h k l value is given by Withers et al. [27]. In the case of laboratory X-ray diffraction measurements ( s i n 2 ψ ), where out-of-plane stresses can be considered to equal zero (σi3 = 0), a prior knowledge of d 0 h k l is not required, as it can even be calculated by the combination of several measurements [32]. In addition, the method is relatively insensitive to an inaccuracy in d 0 h k l up to 10−3 nm [32].
For example, one could measure d h k l vs. s i n 2 ψ for the directions (φ = 90°, ψ) and (φ = 0, ψ) and then determine their average value:
d h k l   φ = 90 ° ,   ψ + d h k l   φ = 0 ° ,   ψ 2 = σ 11 + σ 22 d 0 h k l 2 S 1 h k l + 1 2 S 2 h k l s i n 2 ψ + d 0 h k l  
The right term equals to d 0 h k l , when (isotropic, no steep gradient, σ ¯ 22   σ ¯ 11 ) [34]:
s i n 2 ψ = s i n 2 ψ = - S 1 h k l 1 2 S 2 h k l 1 + σ ¯ 22   σ ¯ 11
Consequently, the d 0 h k l can be defined as (e.g., for σ ¯ 11 = σ ¯ 22 ):
d 0 h k l = d h k l φ = 0 ° , ψ + d h k l φ = 90 ° , ψ 2   with   s i n 2 ψ = - 2 S 1 h k l 1 2 S 2 h k l
Therefore, in this particular case, the bare elastic constants define the strain-free direction ψ , and the half average of d h k l (φ = 90°, ψ) and d h k l (φ =, ψ) at the position s i n 2 ψ provides the d 0 h k l (at the location where the s i n 2 ψ scan was carried out). A more detailed description and examples for other stress states to derive a d 0 h k l are given in [34].
Although this method leads to a simplified experimental determination of d 0 h k l it still bears the problem of DECs values (Equation (12)). As the determination of d 0 h k l by this method is dependent upon knowledge of DECs (Equation (12)), the reliability of the DECs must be high to determine a correct value for d 0 h k l . The determination of the DECs is a separate topic and will be examined later.
While the method is sensitive to intergranular and interphase stresses [27], a relative comparison of d 0 h k l near the surface is often still possible. Thiede et al. [82] used this method to determine d 0 h k l variations across the surface of LPBF manufactured Inconel 718 prisms (assuming σ ¯ 11 = σ ¯ 22 ) (Figure 9a). A small normal stress component σ n was observed, which was reported to correlate with the scanning strategy. The s i n 2 ψ method has also been used by other researchers to determine d 0 h k l in LPBF Ti6Al4V [83,96]. As an alternative, Pant et al. [81] used the d h k l value measured at ψ = 0° as d 0 h k l for calculating RS values.
For the cases in which the out-of-plane stress cannot be considered to equal zero (σi3  0) the precise knowledge of d 0 h k l remains indispensable. An independent determination of d 0 h k l can be made by means of the following strategies:
Figure 9. d 0 311 values extracted from d 311 versus s i n 2 ψ plots (a) and from raw powder (RP), filings (SP) and cuboids (L, T, N) (b). Data taken from [82].
Metals 11 01830 g009

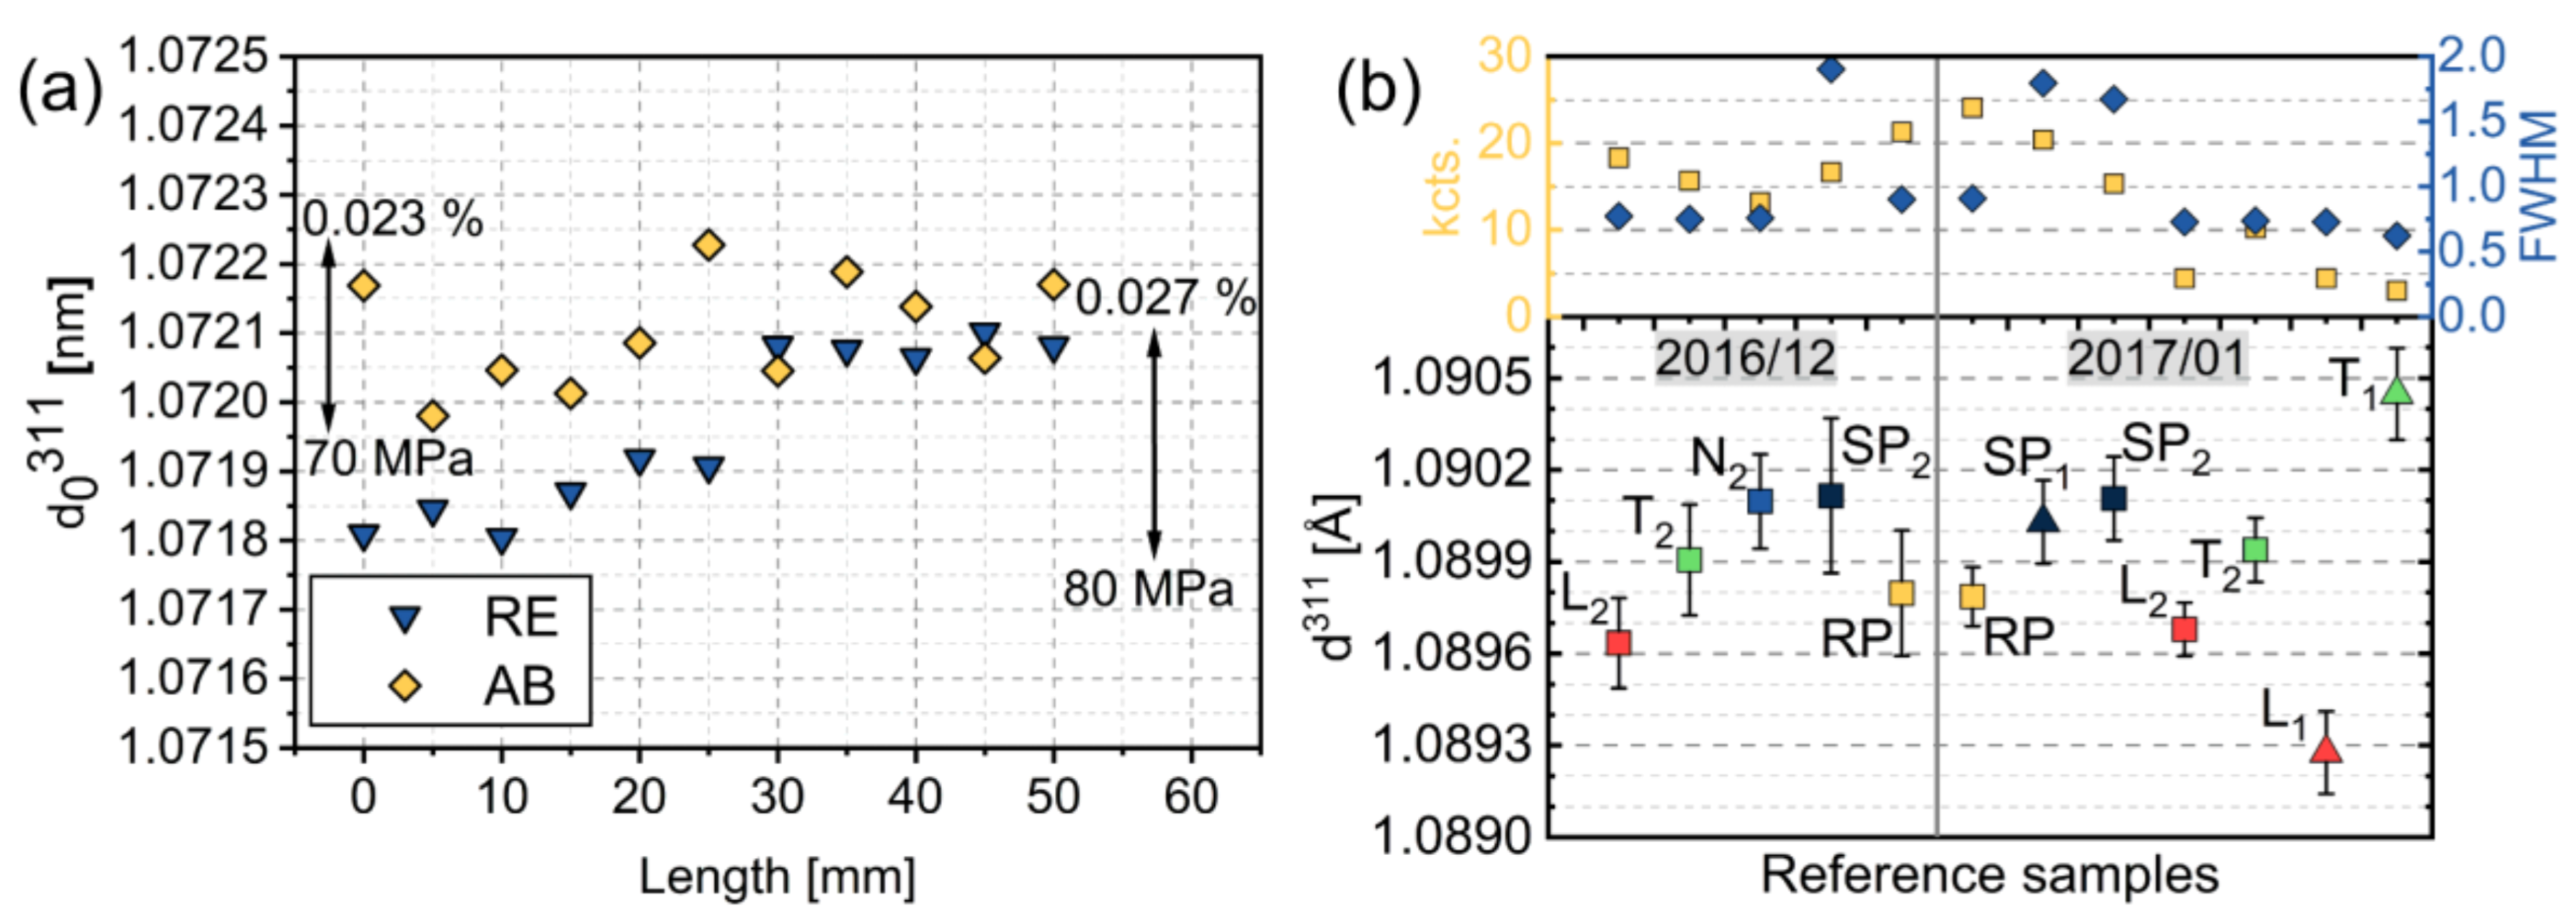
6.1.1. Use of Raw Powder

In the case of AM there is also the possibility to obtain d 0 h k l by measurements on raw powder. This is a method, which does not require a twin specimen and is non-destructive by nature. However, the thermal history of the raw powder, and consequently the local chemical composition and microstructure, may differ significantly from that of the printed part [103]. The macro- and micro-scale differences in chemistry can significantly alter the lattice parameters of the material [104,105,106]. As Thiede et al. [82] have concluded, a shift due to different local chemical segregation prevented the use of it as a reference (Figure 9b). Similar findings were made by Kolbus et al. [103] and more recently Serrano-Munoz et al. [107]. While there may be examples of low alloyed or commercially pure materials, where the use of the raw powder may be applicable due to the lower amount of segregation, using raw manufacturing powder as d 0 h k l is generally not recommended in the domain of AM [45].

6.1.2. Use of Mechanical Filings

Mechanical filings from either the specimen itself or taken from a twin specimen can be used. This approach would capture the effect of the thermal cycles on the local chemical segregation and has the advantage that in a powder the macroscopic RS is fully relieved [27]. However, the filing process tends to induce plastic deformation within the powder, leading to strong diffraction peak broadening associated with microscopic stresses (Type III and possibly Type II [103]). In addition, filings certainly contain different intergranular strain than the component, so that they cannot be considered fully stress-free [27].
It was recently shown that using the d 0 h k l reference value of mechanical filings, a compressive stress was found for all measured points, which contradicts the stress balance condition [107]. This mismatch was attributed to the high accumulation of plastic strain in the as-filed condition, and in fact the FWHM vastly reduced upon heat treatment (indicating a significant plastic recovery). Even if some circumstances lead to the conclusion that the filings from the material are the most suitable d 0 h k l [82], the applicability of mechanical filings as d 0 h k l shall be limited to exceptional cases and rarely be considered an appropriate approach in the general case of AM.

6.1.3. Use of Macroscopically Relaxed Samples (Cubes/Combs/Arrays)

In neutron diffraction, it is common to determine the d 0 h k l with small cubes (or combs) cut from a sister sample. These cubes are assumed to be free of macroscopic stress. Although they appropriately represent the (possible) variation of chemical composition of the specimen, other problems must be considered: The cubes could retain intergranular stresses and are vulnerable to geometrical effects if poorly positioned on the sample manipulator [27]. Thiede et al. [82] measured small 5 mm × 5 mm × 5.5 mm cubes extracted from sister samples of LPBF Inconel 718. However, they found a significant dependence of the d h k l value on the measurement direction (Figure 9b). This suggests that the cubes were not fully macroscopically stress free and thus could not yield a reliable d 0 h k l [82]. Nevertheless, a similar d h k l dependence on the measurement direction was found by Ulbricht et al. [79] for LPBF manufactured stainless steel 316L, this time using 3 mm × 3 mm × 3 mm coupons.
To obtain a representative d 0 h k l they averaged the values over all measured directions (which correspond to the main geometrical directions). Kolbus et al. [103] attributed the different d 0 h k l in different directions of reassembled DMLS Inconel 718 cubes (2.5 mm × 2.5 mm × 2.5 mm and 5 mm × 5 mm × 5 mm) to anisotropic micro stress between the fcc matrix and the precipitation phases. They applied an average obtained from measurements on reference cubes extracted from different positions but did not average over different strain directions. Regardless of the direction being measured, Pant et al. [81] found that the average value of the measured d 0 h k l on the LPBF manufactured Inconel 718 array (cut by wire electric discharge machining) was position independent. The average value, however, showed to not provide sufficient accuracy concerning the stress balance condition in the cross sections [81]. Other approaches based on relaxing macroscopic stresses by cutting or extracting small geometries from sister samples were conducted by several researchers [31,85,91,108,109,110,111,112]. Although some inconsistencies in defining a representative d 0 h k l from measurements on macroscopically stress-free samples have been reported, approaches to determine d 0 h k l using coupons (or small pieces of the printed part) are widespread; to date, this approach is considered the best to produce a reliable measured d 0 h k l .

6.1.4. Stress and Moment Balance

Another method to determine a d 0 h k l is based on the continuum mechanics-based requirements that force and moment must balance across selected cross sections or over the whole specimen [27]. Therefore, by mapping the d h k l in the required sample region the reference d 0 h k l can be iteratively found by imposing stress and moment balance, even starting from a nominal value [27]. However, great care must be taken to prove the applicability of the method: the experimental data must cover the whole cross section and it must be ensured that a global d 0 h k l is appropriate (i.e., the method would not work if d 0 h k l varies across the sample) [27]. Serrano-Munoz et al. [107] applied this method to obtain a d 0 h k l for different cross sections of LPBF manufactured Inconel 718 prisms. The method produced a similar d 0 h k l , indicating no dependance on the scanning strategy and the cross section being analyzed (i.e., there is no spatial variation of d 0 h k l along the length of the sample). Therefore, an average value was used for the d 0 h k l in the RS calculation [107], which applicability was later shown [80].
In fact, Kolbus et al. [103] proposed the method of stress balance as a possibility to check the measured d 0 h k l , as also indicated by Withers et al. [27]. To cross-check the values measured on mechanically relaxed samples, Pant et al. [81] used the stress balance approach and found a significant difference. Such discrepancy was attributed to microstructural variations: the average d 0 h k l value obtained by stress balance was used for the final RS calculations. Stress balance is often applied as an alternative approach to obtain a d 0 h k l without additional experimental effort [86,113]. However, in order to check the applicability of the hypotheses mentioned above, one should always compare the results (stress fields, d 0 h k l ) obtained by using the stress balance condition with those obtained using experimental methods [27,80,103].
Indeed, the applicability of the stress balance approach for AM materials, which possibly exhibit 2D or 3D chemical variations due to the differential cooling rates, still requires further experimentation to test the robustness of the approach. Although this method would aid to make the RS determination by diffraction fully non-destructive, great care must be taken to avoid large errors in the RS values. In fact, Wang et al. [31] showed a LMD manufactured Inconel 625 wall displayed local variations of d 0 h k l due to the chemical and microstructural heterogeneity of the builds (Figure 10). This fact impeded the applicability of the stress balance condition.
The following table (Table 1) summarizes available methods to obtain d 0 h k l . It also reports the references in which each method was applied (in the case of laser-based AM parts).

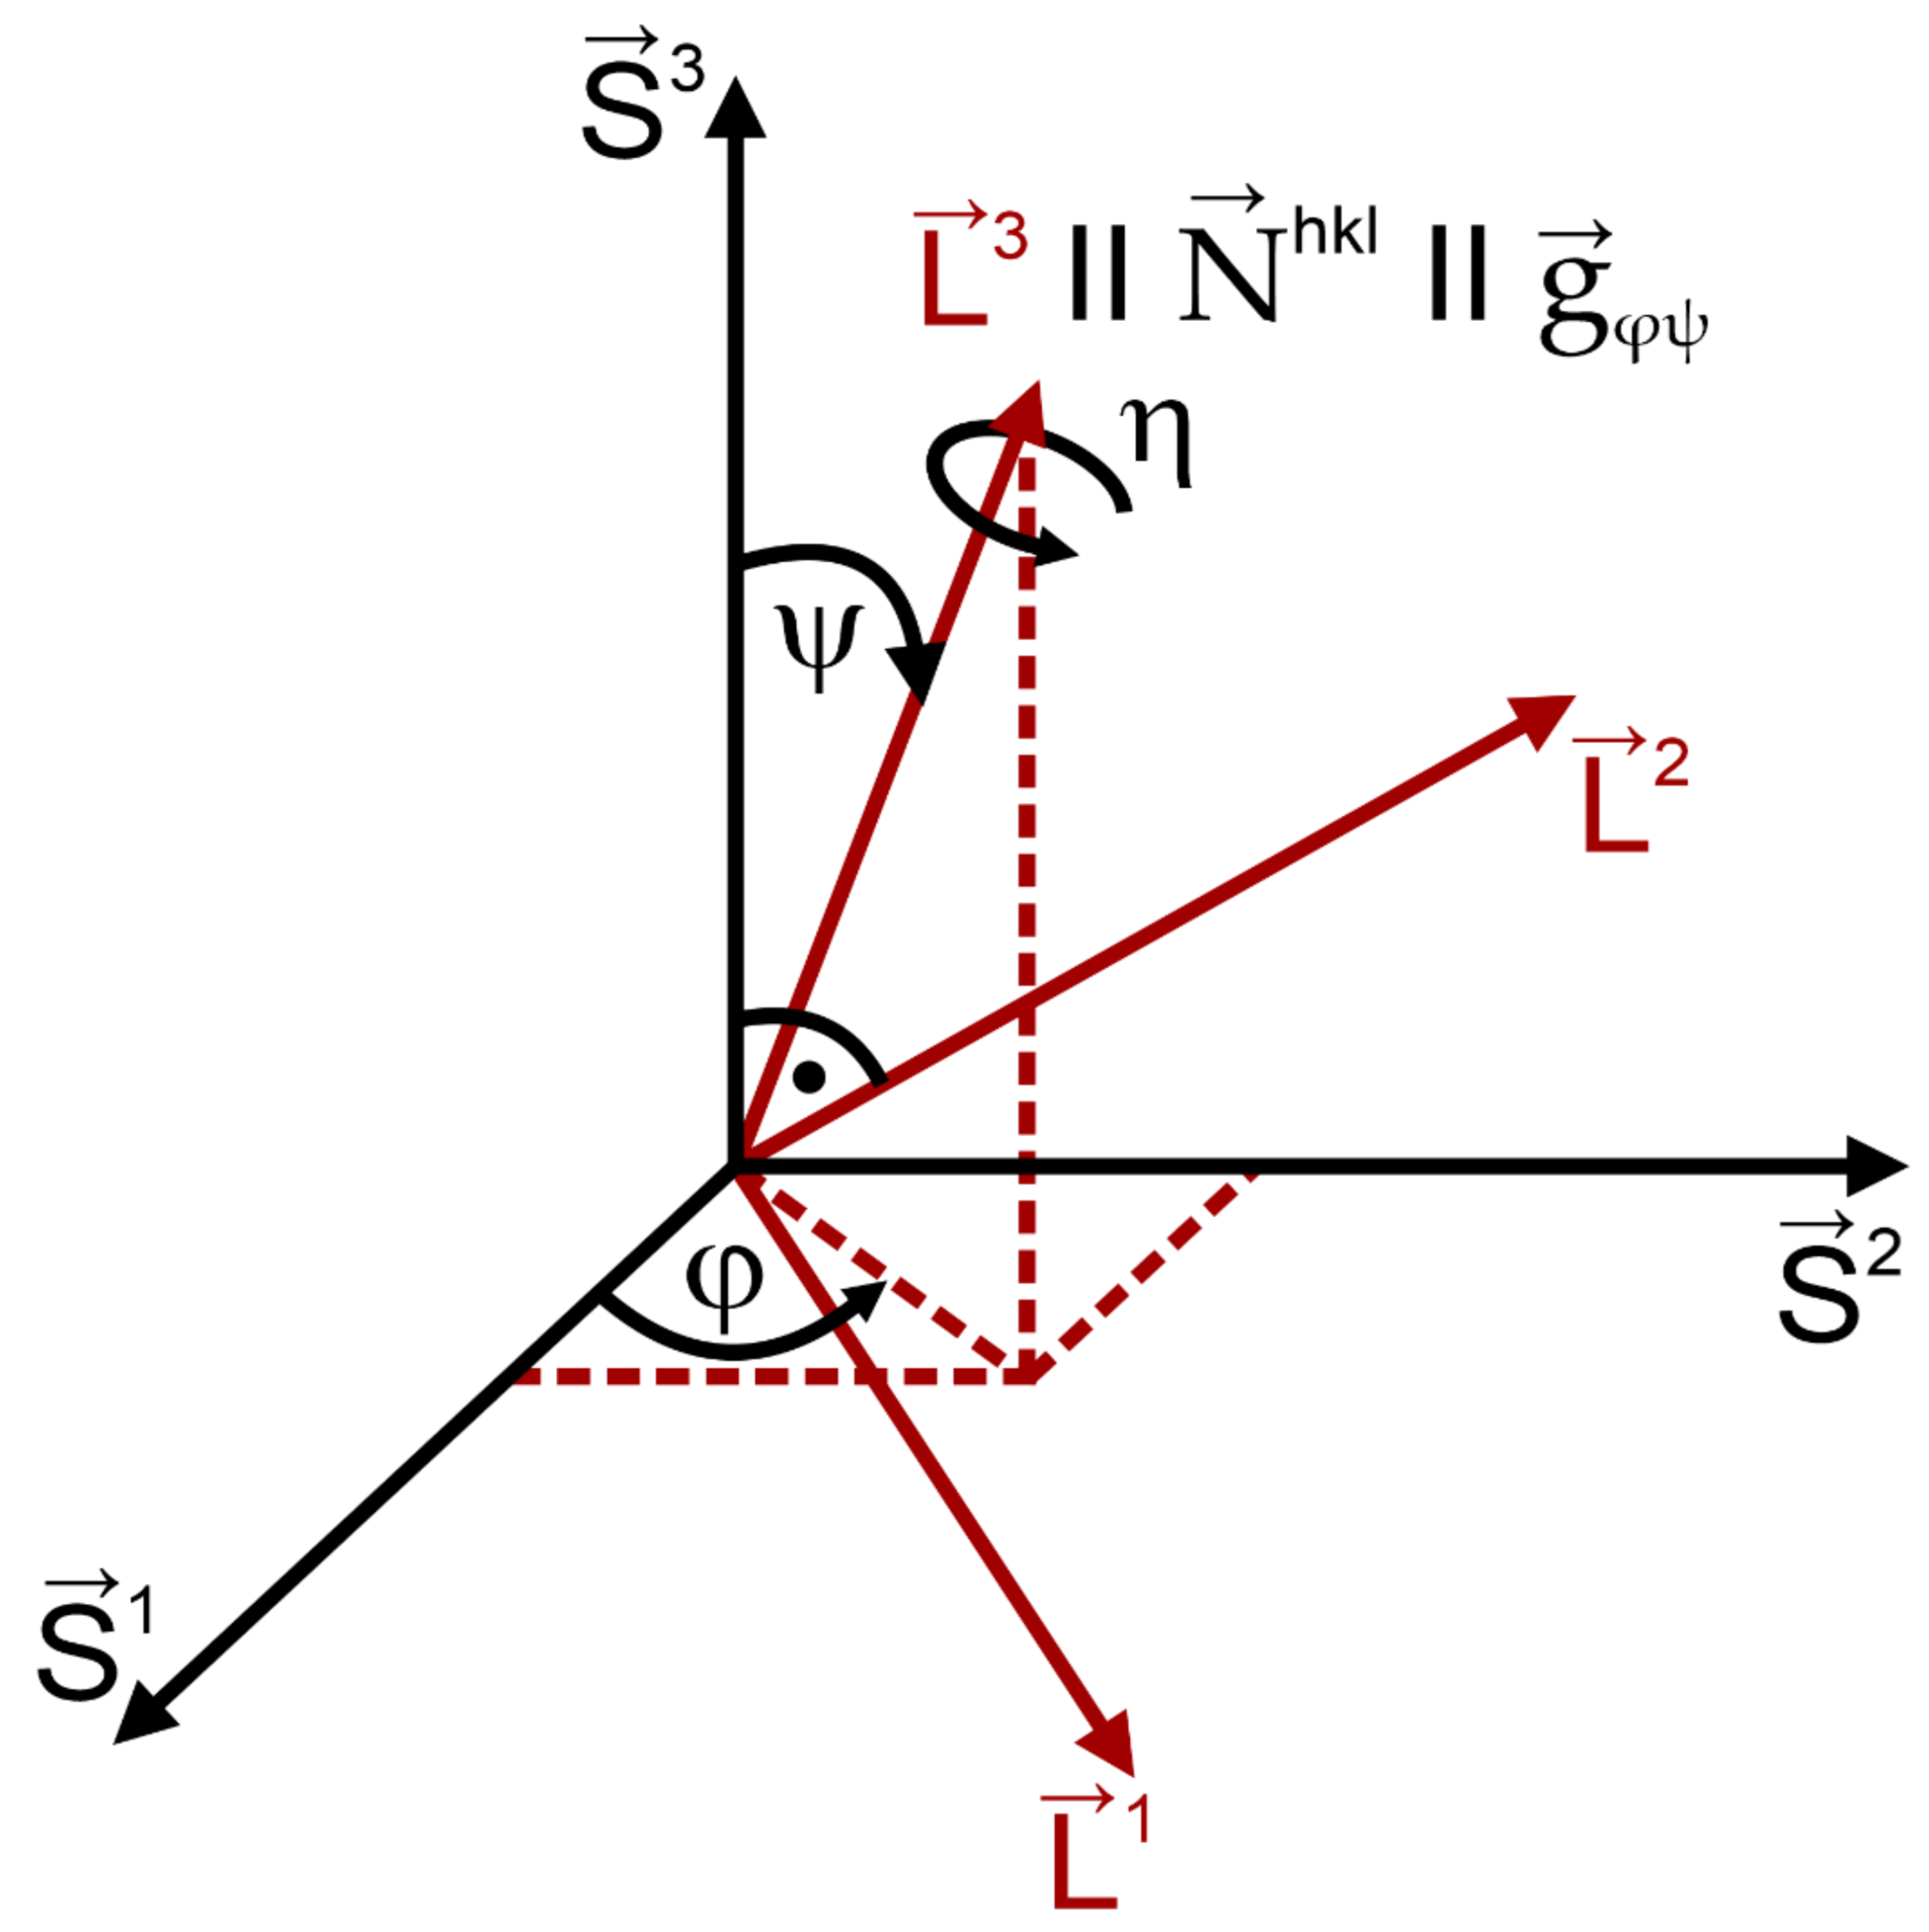
6.2. Principal Stress Directions

A simplification of Equation (3) with the hypothesis of isotropic elastic constants (i.e., with the use of E, Young’s modulus, and ν Poisson’s ratio) would read for normal stress and strain components (ii = xx, yy, zz in cartesian coordinates) [94]:
σ ii = E h k l 1 + ν h k l ε ii + ν h k l 1   -   2 ν h k l ε x x + ε y y + ε z z
For isotropic materials, Equation (14) is valid also in presence of shear stress [114]. However, without the knowledge about the principal stress directions, such a determination would not necessarily capture the maximum stress values. A common assumption to reduce the experimental effort is, that the principal stress directions coincide with the sample geometrical axes (e.g., see [82,83,103,110,115]). If the principal stress directions are known, Equation (14) can be used to calculate the principal stress components. This would reduce the number of measurements needed down to 3, if d 0 h k l is known. In the general case, where the principal stress axes are not known particular attention (and effort) needs to be dedicated to this aspect. In AM parts, the determination of the principal stress directions goes through the knowledge of the manufacturing process and of its impact on the principal stress directions.
Although several process parameters largely influence the magnitude of the RS, such as layer thickness, scanning speed, beam power, and vector length, the major influencing parameter on the stress distribution (and principal axes) is the relative orientation of the scanning pattern to the corresponding geometry [107].
Investigations about the principial stress direction in AM-Material started on simple geometries such as prisms [108]. Six strain directions were used for the calculation of the principal stress direction, which was not found to coincide with the sample geometrical ones. In contrast, complex structures were investigated by Fritsch et al. [116] using ND. It was shown, that for LPBF manufactured IN 625 lattice structures measurements along 6 independent strain directions are not sufficient to determine the principal stress directions and magnitudes. The authors found that at least seven independent directions are required to experimentally determine the direction of principal stress and even 8 directions are needed if the correct RS magnitude needs to be determined. In that case the calculated directions become insensitive to the choice of the measurement directions. Furthermore, it was proven that the RS tensor ellipsoid axes align well with the orientation of the struts within the lattice structure. [116].
Gloaguen et al. [46] showed, for example, that when assuming the principal stresses along the geometrical specimen axes for LPBF manufactured Ti6Al4V, the RS is affected by significant errors. This can be attributed to the fact that the principal stress axes deviate from the sample axes. This observation was made even though a simple bidirectional scanning strategy along the geometry with a 90° interlayer rotation was applied.
In fact, Vrancken [117] found for LPBF manufactured Ti6Al4V produced by a comparable scanning strategy, that the principal stress directions coincide with the direction of the scanning tracks. In other studies researchers found the principal stress directions to align with the sample geometrical axes [76,82], if the scanning strategy is more complicated (e.g., rotation between subsequent layers etc.).
These results emphasize that an increasing part complexity requires advanced measurement techniques and strategies to reach the desired precision for a reliable assessment of RS states. Again, given the complexity of laser-based additive manufacturing processes, the general assumption that the principal stress directions are governed by the sample geometry must be used carefully [46]. Therefore, for the alignment of the specimen in the laboratory coordinate system it is recommended not to make any assumption about the principal direction of stress and measure at least eight independent directions at all locations.

6.3. Diffraction-Elastic Constants (DECs)

To obtain stress values, the DECs act as proportionality constants to link the measured microscopic (i.e., lattice) strains to macroscopic stresses (see Equation (3)). Their precise knowledge is important, because the magnitude of the resulting RS depends on the values of the DECs (see Equation (3)). RS are thus highly vulnerable to errors if reliable values of the DEC are not used.
Two methods are available to obtain the DECs: They can be calculated from the single crystal elastic constants (SCEC) using different theoretical schemes (for instance a grain interaction model for the polycrystalline aggregate). This method is to be preferred if the SCECs are reliably known (note that much work needs still to be made for AM materials). The presence of a strong crystallographic texture in conjunction with crystal anisotropy can hamper the determination of the DECs by theoretical calculations, as one must properly take the texture into account. Alternatively, one can directly determine them in an in situ deformation test during diffraction. In this case, the microscopic response is monitored during a macroscopic deformation, and the proportionality constant between applied stress and lattice strain is the plane-specific Young’s modulus Ehkl. A guideline for this is given in DIN EN 15305 [95]. The latter method, however, is connected to a relatively high experimental effort.

6.3.1. The Anisotropy of Single Crystals

The anisotropy of the single crystal can be expressed by the differences of the different elements of the compliance tensor. For cubic materials Zener [118] proposed the following coefficient, written in the Voigt notation, to calculate the anisotropy of the single crystal:
A Z = 2   ·   C 44 C 11   -   C 12
In this definition, full isotropy is expressed by a value of AZ = 1. Any deviation from AZ = 1 signifies a certain degree of crystal anisotropy. However, as the Zener ratio only remains valid in the cubic case, researchers were motivated to formulate a more general anisotropy index, which would be valid for an arbitrary crystal structure. Such an index (AU) was derived by Rangathan and Ostoja-Starzewski [119]. It is based on the fractional difference between the upper (Voigt) and lower (Reuss) bounds on the bulk (κV, κR) and shear (µV, µR) moduli. The values can be determined by the following equation (Equation (16)).
A U = κ v κ R + 5 µ v µ R     6
The main advantage of this formulation is its applicability to any type of crystal symmetry. However, it remains a relative measure of anisotropy. In fact, it has not been proven, that a crystal with twice an AU also is twice as anisotropic. Therefore, Kube [120] provided an alternative definition, the anisotropy index AL (Equation (17)), whereby the value of AL = 0 expresses isotropy.
A L ( C v ,   C R ) = ln κ v κ R 2 + 5 ln µ v µ R 2
There are also different approaches such as the Ledbetter and Migliori ratio [121] or the method proposed by Chung and Buessem [122]. However, we will use AL in the following to compare the single crystal anisotropy of the commonly materials used in laser-based AM. One last important remark must be made: the applicability of all DEC calculation schemes heavily rests on the availability of reliable SCEC. A compiled list with the single crystal elastic constants (SCEC) of important alloys for laser based additive manufacturing is given in Table 2. The significant difference in the elastic anisotropy of the different single crystals is evident. The data shown are mainly inferred from measurements on conventionally produced polycrystalline materials or represent measurements on the respective single crystals. Data directly related to additively manufactured materials are still lacking. This may have an impact on the determination of the DECs and of RS. This is because the calculation of DECs is made under the assumption, that tabulated SCECs are still suitable for additively manufactured materials. Nevertheless, some authors have already tackled the problem of the determination of SCEC from experimental data on textured polycrystalline alloys [123].

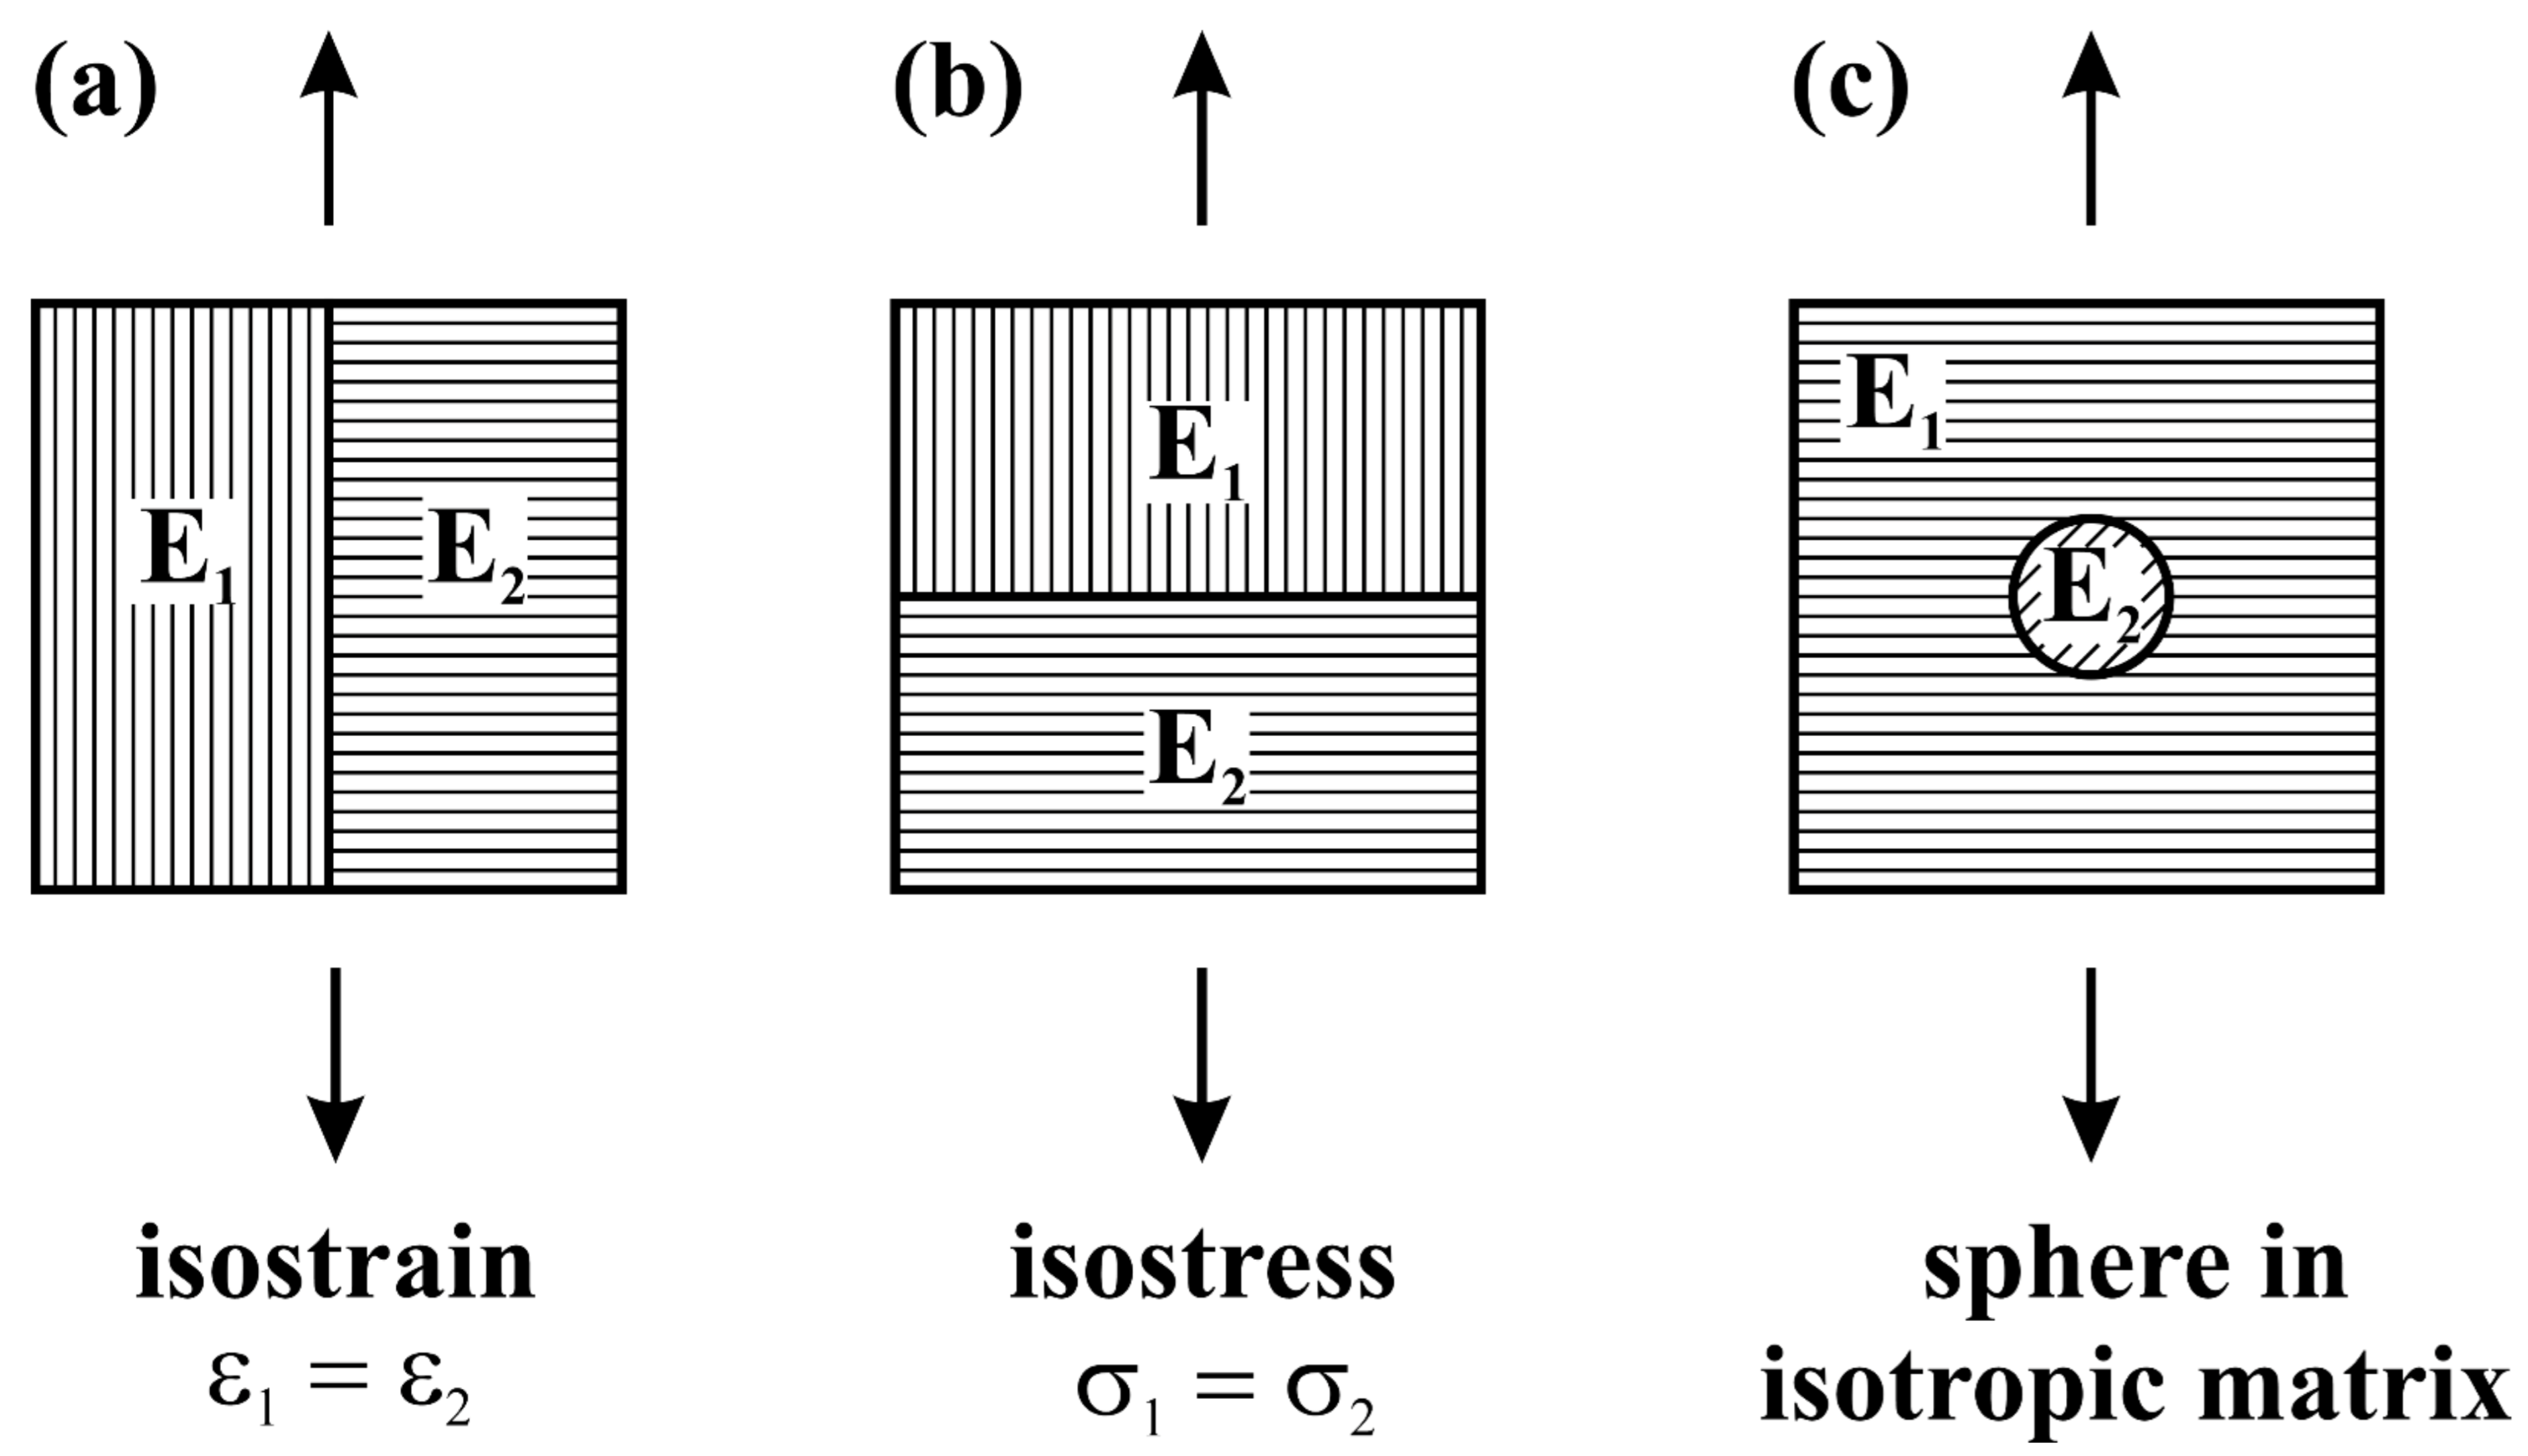
6.3.2. Grain Interaction Models for the Calculation of DECs

Several models have been developed to calculate DECs from SCEC. The first model developed by Voigt [138] (Figure 11a) assumes that adjacent grains undergo the same strain during deformation. However, this assumption violates the equilibrium of forces at the interfaces. On the other hand, Reuss [139] later proposed a model where the equilibrium of forces is fulfilled as a homogenous stress state is assumed (Figure 11b). This leads to the problem, that the different crystals undergo different strains, which would not satisfy the compatibility conditions [114]. To solve these problems Kröner developed a model based on Eshelby’s theory [140], which fulfills the interface and the compatibility conditions (Figure 11c). Such scheme considers a spherical particle of arbitrary anisotropy embedded in an isotropic material. With the assumption of spherical particles and isotropic matrix, Kröner derived a closed (analytical) solution to the problem [141]. If the surrounding matrix is not texture free (e.g., as in the case of AM materials), numerical approaches must be considered [141]. In general, the Voigt model is the least applicable, as it results in elastic properties, such as Ehkl, that are independent on the plane {hkl}. This does not apply for most crystals. In contrast, the Kröner model has been shown to well match to experimentally determined values in an excellent manner for non-textured microstructures [142,143,144]. Interestingly, if a strong texture is present, as it has been observed in certain cases (including AM materials), the Reuss model displays better agreement with experimental data [32]. In fact, for columnar structures (the case of AM microstructures) the assumption that each crystal undergoes the same stress could be a good approximation.
From the discussion above, it is clear that for the application of each model, the microstructure and texture present in the material must be considered to determine appropriate values for the DECs. Indeed, many modifications and developments of the three schemes mentioned above have been made over the past years, to encompass the microstructure in the calculation of DECs. Initially, Dölle and Hauk [145] introduced the so-called stress factors to account for the texture using the crystallographic orientation distribution function (ODF). Several authors (e.g., Slim et al. [146], Brakman et al. [147], Welzel et al. [148,149,150], Gnäupel-Herold et al. [151]) proposed alternative approaches to embed the ODF in the determination of the DECS. More recently Mishurova et al. [40] have shown, that the use of Wu’s tensor [152] is equivalent to using Kröner´s approach. In addition, they showcased the applicability of the procedure to LPBF Ti6Al4V. They concluded that, since hexagonal polycrystals possess transverse isotropy and LPBF Ti6Al4V had a fiber texture, the calculated DECs (using the best-fit isotropy assumption) reasonably agreed with experimentally determined values.

6.3.3. Experimental Determination of Diffraction Elastic Constants

The main method for the experimental determination of DECs are in situ mechanical tests, i.e., during high-energy X-ray or neutron diffraction experiments. The response of each lattice plane is monitored as a function of applied stress. It is important to mention that this approach rests on the hypothesis that a statistically significant ensemble of grains with the normal to the planes {hkl} is oriented along the load axis. From these datasets, the DECs for each monitored plane then can be derived (see Table 3). For LPBF Ti6Al4V and IN718 a comparison of the model prediction with experimentally obtained values is given in Figure 12.
For the alloys 316L and AlSi10Mg such a comparative figure is not necessary, since the model prediction of Kröner nearly perfectly matches the experimental values of the elastic moduli [153,154]. This is different for additively manufactured Ti6Al4V, Inconel 718 and Inconel 625. For a recrystallized and, thus, untextured microstructure (FHT) the Kröner model best matches the experimental values (Figure 12a) [39]. When, on the contrary, the columnar as-built microstructure (exhibiting relatively strong crystallographic texture) was retained, the model prediction of Reuss best fit the experimental data for Inconel 718 and 625 (Figure 12a,b) [39,131]. The AM Ti6Al4V alloy seems to deviate from this behavior: Mishurova et al. [156] showed, that for low H2 (prismatic planes) the model predictions by Kröner agreed better with experimental data than other schemes (Figure 12c). In contrast, for higher H2 (basal planes) the model prediction of Reuss better matched with the data [156]. This can be explained by the transverse isotropy of the single crystal elastic tensor, exhibiting an isotropic behavior in the basal directions but a strong anisotropy along its c-axis. It has been shown that when considering the transversal isotropy in the material model a reasonable agreement between model and experimental data can be obtained [40]. In presence of crystallographic texture, materials with a higher anisotropy factor (Table 2) tend to be better described by the predictions of the Reuss model than by those of Kröner’s scheme. The exception to this trend is given by the alloy 316, for which the model approach of Kröner yields a good prediction of the polycrystal behavior, although the single crystal itself is highly anisotropic [154]. Such an agreement can be explained by the rather weak crystallographic texture along the loading direction in conjunction with the relatively small grain size [154].
As Mishurova et al. [45,156] argue, it is mandatory to report the DECs used to obtain stress values if one wants to compare own data with literature. Severe differences in the RS magnitude are the consequence if different model predictions considered for the determination of DEC. This was shown by Serrano-Munoz et al. [38] for LPBF manufactured Inconel 718: Applying the Kröner model led to a spiky stress depth profile. Stress values of 1200 MPa were reached, which far exceed the yield strength of the non-heat-treated material (630–800 MPa). Much more realistic stress values (up to 870 MPa) were obtained by applying the Reuss model to the experimental data. Also, the spikes of the stress depth profile were smoothed. This indicates the ability of the Reuss model to reasonably describe the intergranular behavior of LPBF Inconel 718 [157]. This was also supported by the findings of Pant et al. [81], who found stresses up to 1000 MPa in their study of as built LPBF manufactured Inconel 718. They used DECs measured for conventionally manufactured Inconel 718 and nearly equal to the Kröner model calculations [158].
Currently, a lack of consistency is observable in the open literature, as summarized in Table 4. It is to remark that, so far, DECs of additively manufactured microstructures have been mainly determined for loading along the building direction. The micromechanical behavior of the microstructure perpendicular to the build direction is, to the best of the authors’ knowledge, not yet reported.
To summarize, in order to reliably calculate the DECs the proper SCECs of the material and both the microstructure and texture of the specimen should be considered. The crystal and macroscopic anisotropy provide guidance for the choice of the model to consider.
One last remark must be made: To obtain the plane specific Poisson ratio (νhkl) one would have to track the same set of grains during the deformation in both, the transverse and axial direction (i.e., along the tensile axis) [156]. However, this is practically impossible. In the case of nearly texture-free conventionally manufactured materials with small grain size the calculation of the νhkl using measurements in two perpendicular sample direction is a good approximation, as the gauge volume contains a sufficient amount of randomly oriented crystals. This approximation, in contrast, cannot be made for strongly textured AM materials. In this case, the use of suitable model schemes is recommended.

6.4. Choice of the Appropriate Lattice Planes

In the angular dispersive (monochromatic) case, one uses specific grains with specific lattice orientations as strain monitors [172]. It is assumed that the statistical ensemble is representative of the material. However, because of their particular elastic and plastic response, these grains are not necessarily representative of the overall stress state [172]. Consequently, the choice of a suitable reflection, whose grains represent the macroscopic RS in a body, is of utter importance [172,173]. Thereby, three main aspects need to be addressed:
  • Insensitivity to intergranular stress accumulation (material dependent)
  • Crystal symmetry
  • Texture of the material
Whenever a sample is under stresses, a superposition of macroscopic (Type I) and intergranular stress (Type II) occurs [172]. If our goal is to determine the macroscopic stress state, a lattice plane, which exhibits a low tendency to accumulate intergranular stresses during deformation should be chosen. This tendency can be tested during in-situ loading experiments. Increasing non-linearity of the lattice plane response to a macroscopic load is an indication for the intergranular strain accumulation [174,175]. In fact, if the lattice strain vs. applied stress curve is non-linear residual strain is retained upon unloading. Such residual strain increases with increasing macroscopic plastic deformation.
The accumulation of intergranular stresses is critically dependent on the elastic and plastic anisotropy of the material [175]. In general, it is advisable to choose the lattice planes with the lowest Miller indices possible, as a high multiplicity of the lattice plane helps to reduce the required measurement time.
Besides these general considerations, one should take the underlying texture into account [176]. For example, for a (cubic) material with a strong cube texture, one should use the 200 reflection in spite of its typically high sensitivity to intergranular strains [172]. In fact, the 200 reflection represents most of the grains in such particular case [172]. For conventionally manufactured materials a general guideline on the selection of an appropriate lattice plane is given in ISO-21432 [177]. However, for AM the situation might be different, as strong textures typically prevail.
Very little studies on the topic of the accumulation of intergranular strains in laser-based AM materials are available in the open literature. Table 5 shows the lattice planes typically considered for RS analysis of different laser-based AM materials and outlines their suitability compared to their conventionally manufactured counterparts. In the case of fcc materials the 311 reflection is almost exclusively used [26,74,82,83,103,108]. However, it has been shown by Choo et al. [178] for LPBF 316L that the {311} oriented grains accumulate more intergranular strain than the {111} and {220} grains, which is in contrast to conventional rolled 316L [179]. In fact, considering the <220> texture along the building direction [178], the 220 reflection is more easily detected than others, and yields less data scatter. Likewise, Wang et al. [180] observed a strong nonlinear micromechanical response during initial loading of LPBF manufactured 316L, which has been attributed to anisotropic residual strains within the as-built samples. Consequently, the hierarchical heterogenous microstructures of AM 316L may give rise to significant differences in the buildup of intergranular stresses and should be accounted for.
For hexagonally closed packaged (hcp) materials the pyramidal planes {102} and {103} are considered to exhibit low intergranular stress (for conventionally processed materials) [181,182]. However, Cho et al. [183] showed for conventionally manufactured α-Ti-834 that the first eight diffraction peaks (i.e., those with the lowest Miller indices) accumulate significant intergranular strains. In fact, studies on the topic of intergranular strain accumulation are absent for additively manufactured hcp materials. Although Zhang et al. [155] showed that a high dislocation density is present within the α’ Phase of as-built LPBF Ti6Al4V, the micromechanical response show anomalies to conventional Ti6Al4V: sometimes it remains linear well beyond the early stages of loading, sometimes it shows footprints of twinning [184,185]. Thus, the question of the accumulation of intergranular strains is yet far from fully elucidated in AM hcp materials.
In general, more research needs to be dedicated to the topic of intergranular stresses within the domain of laser-based AM materials. One must carefully evaluate whether the requirements are fulfilled for a certain lattice plane to represent the bulk behavior. The approach of using the full pattern refinement of the lattice parameter minimizes (actually, averages) the possible contributions of high intergranular stress to the determined macroscopic type I RS.

7. Summary & Outlook

Additive manufacturing (AM) methods allow the fabrication of complex structures within a single manufacturing step. Still the heterogeneity of the process often leads to mechanically anisotropic, columnar, and textured microstructures. While one of the biggest challenges in AM is to develop mitigation strategies for the large residual stress that inevitably appears after production, the precise determination of such residual stress remains challenging. Diffraction-based methods provide a powerful tool to non-destructively determine the residual stress. However, the peculiar microstructures of AM materials pose challenges for the characterization of residual stress. Therefore, assumptions and measurement conditions must be chosen with great care:
  • First, one must evaluate if the assumption of a biaxial stress state can be justified (e.g., surface measurements with s i n 2 ψ method) or a triaxial stress state must be considered. In the latter case, neutron diffraction should be preferred to other techniques and precise knowledge about the strain-free lattice spacing ( d 0 h k l ) is required. To obtain such a reference, measurements on mechanically relaxed samples are recommended. The stress balance method is recommended as a validation method. If the requirements for the correct application of stress balance conditions (no spatial variation of composition with large number of points) are known to be fulfilled, the stress balance method can be used to obtain a global d 0 h k l . Still, the strategy to determine d 0 h k l needs to be tailored for each case.
  • Secondly, the principal stress directions should be known in advance if one wants to determine the maximum stress values. For conventional processes such as forging or rolling these are often known (they coincide with the main geometrical sample axes). In the case of AM, the complexity of the process conditions hinders the prior knowledge of the principal stress directions. Although research indicates the principal directions to be determined by the scanning strategy (i.e., the main stress axes follow the scanning vector) it is recommended to run experimental checks. Ideally the full stress tensor should be characterized.
  • Thirdly, the microstructure and texture of the sample should be well characterized. Texture is one of the driving factors for the determination of the diffraction elastic constants (DECs). Furthermore, the DECs are material-dependent, dictated by the single crystal properties. Therefore, choosing the appropriate modeling scheme for the calculation of DECs from single crystal elastic constants is challenging. At best the DECs should be experimentally determined. If that is not possible, it is indispensable to take the microstructure and the texture into account in the selection of the grain-interaction model.
  • Lastly, an appropriate lattice plane must be chosen in the case of a monochromatic measurement technique (Laboratory XRD or steady state Neutron sources), as stresses are derived from one single lattice plane. Such plane should be insensitive to accumulation of intergranular strain and possess a high multiplicity, to represent the macroscopic behavior of the sample.
The amount of research dedicated to the methodology of diffraction-based methods in the domain of AM is increasing but still limited. In particular, the understanding of the influence of the microstructure and texture on the DECs should be addressed for all metal AM processes. This would aid to provide a general strategy to determine the DECs for an additively manufactured material. Further research is needed to develop a uniform strategy to determine an appropriate d 0 h k l ; this would increase the comparability of results. It is also worthwhile to dedicate research to gain a better understanding of intergranular stress accumulation for the hierarchical structures occurring in laser-based AM.

Author Contributions

Conceptualization, J.S., A.E. and M.S.; methodology, J.S. and A.K.; validation, J.S., T.M., and I.S.-M.; formal analysis, T.M.; investigation, J.S. and A.U.; resources, G.B.; writing—original draft preparation, J.S., A.E. and A.U.; writing—review and editing, J.S., A.E., T.M., A.U., M.S., I.S.-M., T.F., A.K., T.K. and G.B.; visualization, J.S., A.K. and T.F.; supervision, A.E., G.B. and T.K.; project administration, G.B. and T.K. All authors have read and agreed to the published version of the manuscript.

Funding

This research received no external funding.

Institutional Review Board Statement

Not applicable.

Informed Consent Statement

Not applicable.

Data Availability Statement

Not applicable.

Acknowledgments

The authors kindly acknowledge the fruitful scientific discussions on the topic with Michael Hofmann (TU Munich), Winfried Petry (TU Munich), Christoph Genzel (HZB, Berlin), and Manuela Klaus (HZB, Berlin). This work was supported by the internal BAM focus area materials project AGIL “Microstructure development in additively manufactured metallic components: from powder to mechanical failure” and the internally funded project MIT1-2019-45.

Conflicts of Interest

The authors declare no conflict of interest.

References

  1. Appleyard, D. Powering up on powder technology. Met. Powder Rep. 2015, 70, 285–289. [Google Scholar] [CrossRef]
  2. Emmelmann, C.; Kranz, J.; Herzog, D.; Wycisk, E. Laser Additive Manufacturing of Metals. Biol. Med. Phys. Biomed. 2013, 143–191. [Google Scholar] [CrossRef]
  3. Kranz, J.; Herzog, D.; Emmelmann, C. Design guidelines for laser additive manufacturing of lightweight structures in TiAl6V4. J. Laser Appl. 2015, 27, S14001. [Google Scholar] [CrossRef]
  4. Khorasani, M.; Ghasemi, A.; Rolfe, B.; Gibson, I. Additive manufacturing a powerful tool for the aerospace industry. Rapid Prototyp. J. 2021. Ahead-of-Print. [Google Scholar] [CrossRef]
  5. Herzog, D.; Seyda, V.; Wycisk, E.; Emmelmann, C. Additive manufacturing of metals. Acta Mater. 2016, 117, 371–392. [Google Scholar] [CrossRef]
  6. Gallmeyer, T.G.; Moorthy, S.; Kappes, B.B.; Mills, M.J.; Amin-Ahmadi, B.; Stebner, A.P. Knowledge of process-structure-property relationships to engineer better heat treatments for laser powder bed fusion additive manufactured Inconel 718. Addit. Manuf. 2020, 31, 100977. [Google Scholar] [CrossRef]
  7. Voisin, T.; Forien, J.B.; Perron, A.; Aubry, S.; Bertin, N.; Samanta, A.; Baker, A.; Wang, Y.M. New insights on cellular structures strengthening mechanisms and thermal stability of an austenitic stainless steel fabricated by laser powder-bed-fusion. Acta Mater. 2021, 203, 116476. [Google Scholar] [CrossRef]
  8. Pröbstle, M.; Neumeier, S.; Hopfenmuller, J.; Freund, L.P.; Niendorf, T.; Schwarze, D.; Goken, M. Superior creep strength of a nickel-based superalloy produced by selective laser melting. Mater. Sci. Eng. A 2016, 674, 299–307. [Google Scholar] [CrossRef]
  9. Vrancken, B.; Thijs, L.; Kruth, J.P.; Van Humbeeck, J. Heat treatment of Ti6Al4V produced by Selective Laser Melting: Microstructure and mechanical properties. J. Alloy. Compd. 2012, 541, 177–185. [Google Scholar] [CrossRef] [Green Version]
  10. Yadroitsev, I.; Yadroitsava, I. Evaluation of residual stress in stainless steel 316L and Ti6Al4V samples produced by selective laser melting. Virtual. Phys. Prototyp. 2015, 10, 67–76. [Google Scholar] [CrossRef]
  11. Kruth, J.P.; Froyen, L.; Van Vaerenbergh, J.; Mercelis, P.; Rombouts, M.; Lauwers, B. Selective laser melting of iron-based powder. J. Mater. Process. Technol. 2004, 149, 616–622. [Google Scholar] [CrossRef]
  12. Mukherjee, T.; Zhang, W.; DebRoy, T. An improved prediction of residual stresses and distortion in additive manufacturing. Comput. Mater. Sci. 2017, 126, 360–372. [Google Scholar] [CrossRef] [Green Version]
  13. Mishurova, T.; Cabeza, S.; Artzt, K.; Haubrich, J.; Klaus, M.; Genzel, C.; Requena, G.; Bruno, G. An Assessment of Subsurface Residual Stress Analysis in SLM Ti-6Al-4V. Materials 2017, 10, 348. [Google Scholar] [CrossRef] [Green Version]
  14. Carpenter, K.; Tabei, A. On Residual Stress Development, Prevention, and Compensation in Metal Additive Manufacturing. Materials 2020, 13, 255. [Google Scholar] [CrossRef] [Green Version]
  15. Marchese, G.; Parizia, S.; Saboori, A.; Manfredi, D.; Lombardi, M.; Fino, P.; Ugues, D.; Biamino, S. The Influence of the Process Parameters on the Densification and Microstructure Development of Laser Powder Bed Fused Inconel 939. Metals 2020, 10, 882. [Google Scholar] [CrossRef]
  16. Kanagarajah, P.; Brenne, F.; Niendorf, T.; Maier, H.J. Inconel 939 processed by selective laser melting: Effect of microstructure and temperature on the mechanical properties under static and cyclic loading. Mater. Sci. Eng. A 2013, 588, 188–195. [Google Scholar] [CrossRef]
  17. Zhang, X.Q.; Chen, H.B.; Xu, L.M.; Xu, J.J.; Ren, X.K.; Chen, X.Q. Cracking mechanism and susceptibility of laser melting deposited Inconel 738 superalloy. Mater. Des. 2019, 183, 108105. [Google Scholar] [CrossRef]
  18. Muñiz-Lerma, J.A.; Tian, Y.; Wang, X.; Gauvin, R.; Brochu, M. Microstructure evolution of Inconel 738 fabricated by pulsed laser powder bed fusion. Prog. Addit. Manuf. 2019, 4, 97–107. [Google Scholar] [CrossRef]
  19. Ramakrishnan, A.; Dinda, G.P. Direct laser metal deposition of Inconel 738. Mater. Sci. Eng. A 2019, 740, 1–13. [Google Scholar] [CrossRef]
  20. Sotov, A.V.; Agapovichev, A.V.; Smelov, V.G.; Kokareva, V.V.; Dmitrieva, M.O.; Melnikov, A.A.; Golanov, S.P.; Anurov, Y.M. Investigation of the IN-738 superalloy microstructure and mechanical properties for the manufacturing of gas turbine engine nozzle guide vane by selective laser melting. Int. J. Adv. Manuf. Tech. 2020, 107, 2525–2535. [Google Scholar] [CrossRef]
  21. Seede, R.; Shoukr, D.; Zhang, B.; Whitt, A.; Gibbons, S.; Flater, P.; Elwany, A.; Arroyave, R.; Karaman, I. An ultra-high strength martensitic steel fabricated using selective laser melting additive manufacturing: Densification, microstructure, and mechanical properties. Acta Mater. 2020, 186, 199–214. [Google Scholar] [CrossRef]
  22. Boes, J.; Rottger, A.; Theisen, W.; Cui, C.; Uhlenwinkel, V.; Schulz, A.; Zoch, H.W.; Stern, F.; Tenkamp, J.; Walther, F. Gas atomization and laser additive manufacturing of nitrogen-alloyed martensitic stainless steel. Addit. Manuf. 2020, 34, 101379. [Google Scholar] [CrossRef]
  23. Saeidi, K.; Zapata, D.L.; Lofaj, F.; Kvetkova, L.; Olsen, J.; Shen, Z.J.; Akhtar, F. Ultra-high strength martensitic 420 stainless steel with high ductility. Addit. Manuf. 2019, 29, 100803. [Google Scholar] [CrossRef]
  24. Lu, Y.; Wu, S.; Gan, Y.; Huang, T.; Yang, C.; Junjie, L.; Lin, J. Study on the microstructure, mechanical property and residual stress of SLM Inconel-718 alloy manufactured by differing island scanning strategy. Opt. Laser Technol. 2015, 75, 197–206. [Google Scholar] [CrossRef]
  25. Valdez, M.; Kozuch, C.; Faierson, E.J.; Jasiuk, I. Induced porosity in Super Alloy 718 through the laser additive manufacturing process: Microstructure and mechanical properties. J. Alloys Compd. 2017, 725, 757–764. [Google Scholar] [CrossRef]
  26. Nadammal, N.; Mishurova, T.; Fritsch, T.; Serrano-Munoz, I.; Kromm, A.; Haberland, C.; Portella, P.D.; Bruno, G. Critical role of scan strategies on the development of microstructure, texture, and residual stresses during laser powder bed fusion additive manufacturing. Addit. Manuf. 2021, 38, 101792. [Google Scholar] [CrossRef]
  27. Withers, P.J.; Preuss, M.; Steuwer, A.; Pang, J.W.L. Methods for obtaining the strain-free lattice parameter when using diffraction to determine residual stress. J. Appl. Crystallogr. 2007, 40, 891–904. [Google Scholar] [CrossRef]
  28. Dixneit, J.; Kromm, A.; Boin, M.; Wimpory, R.C.; Kannengiesser, T.; Gibmeier, J.; Schroepfer, D. Residual stresses of LTT welds in large-scale components. Weld. World 2017, 61, 1089–1097. [Google Scholar] [CrossRef]
  29. Kromm, A. Evaluation of weld filler alloying concepts for residual stress engineering by means of Neutron and X-ray diffraction. Adv. Mater. Res. 2014, 996, 469–474. [Google Scholar] [CrossRef] [Green Version]
  30. Altenkirch, J.; Gibmeier, J.; Kromm, A.; Kannengiesser, T.; Nitschke-Pagel, T.; Hofmann, M. In situ study of structural integrity of low transformation temperature (LTT)-welds. Mater. Sci. Eng. A 2011, 528, 5566–5575. [Google Scholar] [CrossRef]
  31. Wang, Z.; Denlinger, E.; Michaleris, P.; Stoica, A.D.; Ma, D.; Beese, A.M. Residual stress mapping in Inconel 625 fabricated through additive manufacturing: Method for neutron diffraction measurements to validate thermomechanical model predictions. Mater. Des. 2017, 113, 169–177. [Google Scholar] [CrossRef] [Green Version]
  32. Spieß, L.; Teichert, G.; Schwarzer, R.; Behnken, H.; Genzel, C. Moderne Röntgenbeugung, 2nd ed.; Vieweg+Teubner Verlag: Wiesbaden, Germany, 2009. [Google Scholar] [CrossRef]
  33. Noyan, I.C.; Cohen, J.B. Residual Stress: Measurement by Diffraction and Interpretation; Springer: New York, NY, USA, 1987; p. x. 276p. [Google Scholar]
  34. Hauk, V.; Behnken, H. Structural and Residual Stress Analysis by Nondestructive Methods: Evaluation, Application, Assessment; Elsevier: Amsterdam, The Netherlands, 1997; p. xiv. 640p. [Google Scholar]
  35. Ye, T.; Li, L.X.; Liu, X.; Liu, W.H.; Guo, P.C.; Tang, X. Anisotropic deformation behavior of as-extruded 6063-T4 alloy under dynamic impact loading. Mater. Sci. Eng. A 2016, 666, 149–155. [Google Scholar] [CrossRef]
  36. You, Z.; Fu, H.; Qu, S.; Bao, W.; Lu, L. Revisiting anisotropy in the tensile and fracture behavior of cold-rolled 316L stainless steel with heterogeneous nano-lamellar structures. Nano Mater. Sci. 2020, 2, 72–79. [Google Scholar] [CrossRef]
  37. Charmi, A.; Falkenberg, R.; Avila, L.; Mohr, G.; Sommer, K.; Ulbricht, A.; Sprengel, M.; Neumann, R.S.; Skrotzki, B.; Evans, A. Mechanical anisotropy of additively manufactured stainless steel 316L: An experimental and numerical study. Mater. Sci. Eng. A 2021, 799, 140154. [Google Scholar] [CrossRef]
  38. Serrano-Munoz, I.; Fritsch, T.; Mishurova, T.; Trofimov, A.; Apel, D.; Ulbricht, A.; Kromm, A.; Hesse, R.; Evans, A.; Bruno, G. On the interplay of microstructure and residual stress in LPBF IN718. J. Mater. Sci. 2021, 56, 5845–5867. [Google Scholar] [CrossRef]
  39. Schröder, J.; Mishurova, T.; Fritsch, T.; Serrano-Munoz, I.; Evans, A.; Sprengel, M.; Klaus, M.; Genzel, C.; Schneider, J.; Bruno, G. On the influence of heat treatment on microstructure and mechanical behavior of laser powder bed fused Inconel 718. Mater. Sci. Eng. A 2021, 805, 140555. [Google Scholar] [CrossRef]
  40. Mishurova, T.; Bruno, G.; Evsevleev, S.; Sevostianov, I. Determination of macroscopic stress from diffraction experiments: A critical discussion. J. Appl. Phys. 2020, 128, 025103. [Google Scholar] [CrossRef]
  41. Bartlett, J.L.; Li, X. An overview of residual stresses in metal powder bed fusion. Addit. Manuf. 2019, 27, 131–149. [Google Scholar] [CrossRef]
  42. DebRoy, T.; Wei, H.L.; Zuback, J.S.; Mukherjee, T.; Elmer, J.W.; Milewski, J.O.; Beese, A.M.; Wilson-Heid, A.; De, A.; Zhang, W. Additive manufacturing of metallic components—Process, structure and properties. Prog. Mater. Sci. 2018, 92, 112–224. [Google Scholar] [CrossRef]
  43. Acevedo, R.B.O.; Kantarowska, K.; Santos, E.C.; Fredel, M.C. Residual stress measurement techniques for Ti6Al4V parts fabricated using selective laser melting: State of the art review. Rapid Prototyp. J. 2020. [Google Scholar] [CrossRef]
  44. Fang, Z.C.; Wu, Z.L.; Huang, C.G.; Wu, C.W. Review on residual stress in selective laser melting additive manufacturing of alloy parts. Opt. Laser Technol. 2020, 129, 106283. [Google Scholar] [CrossRef]
  45. Mishurova, T.; Serrano-Munoz, I.; Fritsch, T.; Ulbricht, A.; Sprengel, M.; Evans, A.; Kromm, A.; Madia, M.; Bruno, G. A Critical Discussion on the Diffraction-Based Experimental Determination of Residual Stress in AM Parts. In Structural Integrity of Additive Manufactured Materials and Parts; Shamsaei, N., Seifi, M., Eds.; ASTM International: West Conshohocken, PA, USA, 2020; pp. 122–138. [Google Scholar] [CrossRef]
  46. Gloaguen, D.; Girault, B.; Courant, B.; Dubos, P.A.; Moya, M.J.; Edy, F.; Kornmeier, J.R. Study of Residual Stresses in Additively Manufactured Ti-6Al-4V by Neutron Diffraction Measurements. Metall. Mater. Trans. A 2020, 51, 951–961. [Google Scholar] [CrossRef]
  47. Vayre, B.; Vignat, F.; Villeneuve, F. Metallic additive manufacturing: State-of-the-art review and prospects. Mech. Ind. 2012, 13, 89–96. [Google Scholar] [CrossRef]
  48. Kumar, S.; Kruth, J.P. Effect of bronze infiltration into laser sintered metallic parts. Mater. Des. 2007, 28, 400–407. [Google Scholar] [CrossRef]
  49. Kruth, J.P.; Vandenbroucke, B.; Van Vaerenbergh, J.; Mercelis, P. Benchmarking of different SLS/SLM processes as rapid manufacturing techniques. In Proceedings of the International Conference Polymers & Moulds Innovations PMI, Gent, Belgium, 20–24 April 2005. [Google Scholar]
  50. Saboori, A.; Aversa, A.; Marchese, G.; Biamino, S.; Lombardi, M.; Fino, P. Application of Directed Energy Deposition-Based Additive Manufacturing in Repair. Appl. Sci. 2019, 9, 3316. [Google Scholar] [CrossRef] [Green Version]
  51. Onuike, B.; Bandyopadhyay, A. Additive manufacturing in repair: Influence of processing parameters on properties of Inconel 718. Mater. Lett. 2019, 252, 256–259. [Google Scholar] [CrossRef]
  52. Kruth, J.P.; Mercelis, P.; Van Vaerenbergh, J.; Froyen, L.; Rombouts, M. Binding mechanisms in selective laser sintering and selective laser melting. Rapid Prototyp. J. 2005, 11, 26–36. [Google Scholar] [CrossRef] [Green Version]
  53. Poprawe, R.; Loosen, P.; Hoffmann, H.-D. The future of high power laser techniques. In XVI International Symposium on Gas Flow, Chemical Lasers, and High-Power Lasers, Pts 1 and 2; International Society for Optics and Photonics: Bellingham, WA, USA, 2007; Volume 6346, p. 34602. [Google Scholar] [CrossRef]
  54. Aboulkhair, N.T.; Everitt, N.M.; Ashcroft, I.; Tuck, C. Reducing porosity in AlSi10Mg parts processed by selective laser melting. Addit. Manuf. 2014, 1–4, 77–86. [Google Scholar] [CrossRef]
  55. Oliveira, J.P.; LaLonde, A.D.; Ma, J. Processing parameters in laser powder bed fusion metal additive manufacturing. Mater. Des. 2020, 193, 108762. [Google Scholar] [CrossRef]
  56. Buchbinder, D.; Meiners, W.; Pirch, N.; Wissenbach, K.; Schrage, J. Investigation on reducing distortion by preheating during manufacture of aluminum components using selective laser melting. J. Laser Appl. 2014, 26, 012004. [Google Scholar] [CrossRef]
  57. von Müller, A.; Schlick, G.; Neu, R.; Anstatt, C.; Klimkait, T.; Lee, J.; Pascher, B.; Schmitt, M.; Seidel, C. Additive manufacturing of pure tungsten by means of selective laser beam melting with substrate preheating temperatures up to 1000 degrees C. Nucl. Mater. Energy. 2019, 19, 184–188. [Google Scholar] [CrossRef]
  58. Mohr, G.; Altenburg, S.J.; Hilgenberg, K. Effects of inter layer time and build height on resulting properties of 316L stainless steel processed by laser powder bed fusion. Addit. Manuf. 2020, 32, 101080. [Google Scholar] [CrossRef]
  59. Vock, S.; Klöden, B.; Kirchner, A.; Weißgräber, T.; Kieback, B. Powders for powder bed fusion: A review. Prog. Addit. Manuf. 2019, 4, 383–397. [Google Scholar] [CrossRef] [Green Version]
  60. Mercelis, P.; Kruth, J.P. Residual stresses in selective laser sintering and selective laser melting. Rapid Prototyp. J. 2006, 12, 254–265. [Google Scholar] [CrossRef]
  61. Gu, D.D.; Meiners, W.; Wissenbach, K.; Poprawe, R. Laser additive manufacturing of metallic components: Materials, processes and mechanisms. Int. Mater. Rev. 2012, 57, 133–164. [Google Scholar] [CrossRef]
  62. Ruiz, J.E.; Cortina, M.; Arrizubieta, J.I.; Lamikiz, A. Study of the Influence of Shielding Gases on Laser Metal Deposition of Inconel 718 Superalloy. Materials 2018, 11, 1388. [Google Scholar] [CrossRef] [Green Version]
  63. Cortina, M.; Arrizubieta, J.I.; Ruiz, J.E.; Lamikiz, A.; Ukar, E. Design and manufacturing of a protective nozzle for highly reactive materials processing via Laser Material Deposition. Procedia CIRP 2018, 68, 387–392. [Google Scholar] [CrossRef]
  64. Arrizubieta, J.I.; Ruiz, J.E.; Martinez, S.; Ukar, E.; Lamikiz, A. Intelligent nozzle design for the Laser Metal Deposition process in the Industry 4.0. Procedia Manuf. 2017, 13, 1237–1244. [Google Scholar] [CrossRef]
  65. Bernhard, R.; Neef, P.; Eismann, T.; Wiche, H.; Hoff, C.; Hermsdorf, J.; Kaierle, S.; Wesling, V. Additive manufacturing of LMD nozzles for multi-material processing. Procedia CIRP 2020, 94, 336–340. [Google Scholar] [CrossRef]
  66. Gruber, S.; Grunert, C.; Riede, M.; Lopez, E.; Marquardt, A.; Brueckner, F.; Leyens, C. Comparison of dimensional accuracy and tolerances of powder bed based and nozzle based additive manufacturing processes. J. Laser Appl. 2020, 32, 032016. [Google Scholar] [CrossRef]
  67. Mahamood, R.M. Processing Parameters in Laser Metal Deposition Process. In Laser Metal Deposition Process of Metals, Alloys, and Composite Materials. Engineering Materials and Processes, 1st ed.; Springer: Cham, Switzerland, 2018. [Google Scholar] [CrossRef]
  68. Frazier, W.E. Metal Additive Manufacturing: A Review. J. Mater. Eng. Perform. 2014, 23, 1917–1928. [Google Scholar] [CrossRef]
  69. Gibson, I.; Rosen, D.; Stucker, B. Directed Energy Deposition Processes. In Additive Manufacturing Technologies: 3D Printing, Rapid Prototyping, and Direct Digital Manufacturing; Springer: New York, NY, USA, 2015; pp. 245–268. [Google Scholar] [CrossRef]
  70. Withers, P.J.; Bhadeshia, H.K.D.H. Overview—Residual stress part 2—Nature and origins. Mater. Sci. Technol. 2001, 17, 366–375. [Google Scholar] [CrossRef]
  71. Withers, P.J.; Bhadeshia, H.K.D.H. Overview—Residual stress part 1—Measurement techniques. Mater. Sci. Technol. 2001, 17, 355–365. [Google Scholar] [CrossRef]
  72. Mo, F.J.; Sun, G.G.; Li, J.; Zhang, C.S.; Wang, H.; Chen, Y.; Liu, Z.; Yang, Z.K.; Li, H.J.; Yang, Z.L.; et al. Recent Progress of Residual Stress Distribution and Structural Evolution in Materials and Components by Neutron Diffraction Measurement at RSND. Quantum Beam Sci. 2018, 2, 15. [Google Scholar] [CrossRef] [Green Version]
  73. Patterson, A.E.; Messimer, S.L.; Farrington, P.A. Overhanging Features and the SLM/DMLS Residual Stresses Problem: Review and Future Research Need. Technologies 2017, 5, 15. [Google Scholar] [CrossRef]
  74. Nadammal, N.; Cabeza, S.; Mishurova, T.; Thiede, T.; Kromm, A.; Seyfert, C.; Farahbod, L.; Haberland, C.; Schneider, J.A.; Portella, P.D.; et al. Effect of hatch length on the development of microstructure, texture and residual stresses in selective laser melted superalloy Inconel 718. Mater. Des. 2017, 134, 139–150. [Google Scholar] [CrossRef]
  75. Wu, A.S.; Brown, D.W.; Kumar, M.; Gallegos, G.F.; King, W.E. An Experimental Investigation into Additive Manufacturing-Induced Residual Stresses in 316L Stainless Steel. Metall. Mater. Trans. A 2014, 45, 6260–6270. [Google Scholar] [CrossRef]
  76. Bagg, S.D.; Sochalski-Kolbus, L.M.; Bunn, J.R. The Effect of Laser Scan Strategy on Distortion and Residual Stresses of Arches Made With Selective Laser Melting. In Proceedings of the American Society for Precision Engineering (ASPE), Raleigh, NC, USA, 27–30 June 2016. [Google Scholar]
  77. Schmidt, M.; Merklein, M.; Bourell, D.; Dimitrov, D.; Hausotte, T.; Wegener, K.; Overmeyer, L.; Vollertsen, F.; Levy, G.N. Laser based additive manufacturing in industry and academia. CIRP Ann.-Manuf. Technol. 2017, 66, 561–583. [Google Scholar] [CrossRef]
  78. Vastola, G.; Zhang, G.; Pei, Q.X.; Zhang, Y.W. Controlling of residual stress in additive manufacturing of Ti6Al4V by finite element modeling. Addit. Manuf. 2016, 12, 231–239. [Google Scholar] [CrossRef]
  79. Ulbricht, A.; Altenburg, S.J.; Sprengel, M.; Sommer, K.; Mohr, G.; Fritsch, T.; Mishurova, T.; Serrano-Munoz, I.; Evans, A.; Hofmann, M.; et al. Separation of the Formation Mechanisms of Residual Stresses in LPBF 316L. Metals 2020, 10, 1234. [Google Scholar] [CrossRef]
  80. Serrano-Munoz, I.; Evans, A.; Mishurova, T.; Sprengel, M.; Pirling, T.; Kromm, A.; Bruno, G. The Importance of Subsurface Residual Stress in Laser Powder Bed Fusion IN718. Adv. Eng. Mater. 2021, 2100895. [Google Scholar] [CrossRef]
  81. Pant, P.; Proper, S.; Luzin, V.; Sjostrom, S.; Simonsson, K.; Moverare, J.; Hosseini, S.; Pacheco, V.; Peng, R.L. Mapping of residual stresses in as-built Inconel 718 fabricated by laser powder bed fusion: A neutron diffraction study of build orientation influence on residual stresses. Addit. Manuf. 2020, 36, 101501. [Google Scholar] [CrossRef]
  82. Thiede, T.; Cabeza, S.; Mishurova, T.; Nadammal, N.; Kromm, A.; Bode, J.; Haberland, C.; Bruno, G. Residual stress in selective laser melted Inconel 718: Influence of the removal from base plate and deposition hatch length. Mater. Perform. Charact. 2018, 7, 717–735. [Google Scholar] [CrossRef]
  83. Mishurova, T.; Cabeza, S.; Thiede, T.; Nadammal, N.; Kromm, A.; Klaus, M.; Genzel, C.; Haberland, C.; Bruno, G. The influence of the support structure on residual stress and distortion in SLM Inconel 718 parts. Metall. Mater. Trans. A 2018, 49, 3038–3046. [Google Scholar] [CrossRef] [Green Version]
  84. Casavola, C.; Campanelli, S.L.; Pappalettere, C. Preliminary investigation on distribution of residual stress generated by the selective laser melting process. J. Strain Anal. Eng. Des. 2009, 44, 93–104. [Google Scholar] [CrossRef]
  85. Zaeh, M.F.; Branner, G. Investigations on residual stresses and deformations in selective laser melting. Prod. Eng. 2010, 4, 35–45. [Google Scholar] [CrossRef]
  86. Moat, R.J.; Pinkerton, A.J.; Li, L.; Withers, P.J.; Preuss, M. Residual stresses in laser direct metal deposited Waspaloy. Mater. Sci. Eng. A 2011, 528, 2288–2298. [Google Scholar] [CrossRef]
  87. Kruth, J.-P.; Deckers, J.; Yasa, E.; Wauthlé, R. Assessing and comparing influencing factors of residual stresses in selective laser melting using a novel analysis method. Proc. Inst. Mech. Eng. Part B J. Eng. Manuf. 2012, 226, 980–991. [Google Scholar] [CrossRef]
  88. Liu, Y.; Yang, Y.; Wang, D. A study on the residual stress during selective laser melting (SLM) of metallic powder. Int. J. Adv. Manuf. Technol. 2016, 87, 647–656. [Google Scholar] [CrossRef]
  89. Cheng, B.; Shrestha, S.; Chou, K.V. Stress and deformation evaluations of scanning strategy effect in selective laser melting. Addit. Manuf. 2016, 12, 240–251. [Google Scholar] [CrossRef]
  90. Attallah, M.M.; Jennings, R.; Wang, X.; Carter, L.N. Additive manufacturing of Ni-based superalloys: The outstanding issues. MRS Bull. 2016, 41, 758–764. [Google Scholar] [CrossRef]
  91. Ghasri-Khouzani, M.; Peng, H.; Rogge, R.; Attardo, R.; Ostiguy, P.; Neidig, J.; Billo, R.; Hoelzle, D.; Shankar, M.R. Experimental measurement of residual stress and distortion in additively manufactured stainless steel components with various dimensions. Mater. Sci. Eng. A 2017, 707, 689–700. [Google Scholar] [CrossRef]
  92. Lu, J.; Society for Experimental Mechanics (U.S.). Handbook of Measurement of Residual Stresses; Fairmont Press: Lilburn, GA, USA; Prentice Hall PTR: Upper Saddle River, NJ, USA, 1996; p. xv. 238p. [Google Scholar]
  93. Bragg, W.H.; Bragg, W.L. The reflection of X-rays by crystals. Proc. R. Soc. Lond. A 1913, 88, 428–438. [Google Scholar] [CrossRef]
  94. Hutchings, M.T.; Withers, P.J.; Holden, T.M.; Lorentzen, T. Introduction to the Characterization of Residual Stress by Neutron Diffraction; CRC Press Taylor & Francis Group: Boca Raton, FL, USA, 2005. [Google Scholar] [CrossRef]
  95. DIN-EN-15305. Non-Destructive Testing—Test Method for Residual Stress Analysis by X-ray Diffraction; German Institute for Standardization: Berlin, Germany, 2019. [Google Scholar] [CrossRef]
  96. Mishurova, T.; Artzt, K.; Haubrich, J.; Requena, G.; Bruno, G. Exploring the Correlation between Subsurface Residual Stresses and Manufacturing Parameters in Laser Powder Bed Fused Ti-6Al-4V. Metals 2019, 9, 261. [Google Scholar] [CrossRef] [Green Version]
  97. Genzel, C. Formalism for the Evaluation of Strongly Nonlinear Surface Stress-Fields by X-Ray-Diffraction Performed in the Scattering Vector Mode. Phys. Status Solidi A 1994, 146, 629–637. [Google Scholar] [CrossRef]
  98. Genzel, C.; Denks, I.A.; Gibmeler, J.; Klaus, M.; Wagener, G. The materials science synchrotron beamline EDDI for energy-dispersive diffraction analysis. Nucl. Instrum. Meth. A 2007, 578, 23–33. [Google Scholar] [CrossRef]
  99. Giessen, B.C.; Gordon, G.E. X-ray Diffraction—New High-Speed Technique Based on X-ray Spectrography. Science 1968, 159, 973–975. [Google Scholar] [CrossRef]
  100. Apel, D.; Klaus, M.; Genzel, M.; Genzel, C. Rietveld-based energy-dispersive residual stress evaluation: Analysis of complex stress fields σij(z). J. Appl. Crystallogr. 2014, 47, 511–526. [Google Scholar] [CrossRef] [Green Version]
  101. Hollmann, A.; Meixner, M.; Klaus, M.; Genzel, C. Concepts for nondestructive and depth-resolved X-ray residual stress analysis in the near-surface region of nearly single crystalline materials with mosaic structure. J. Appl. Crystallogr. 2021, 54, 22–31. [Google Scholar] [CrossRef]
  102. Webster, G.A.; Wimpory, R.C. Non-destructive measurement of residual stress by neutron diffraction. J. Mater. Process. Technol. 2001, 117, 395–399. [Google Scholar] [CrossRef]
  103. Kolbus, L.; Payzant, E.; Cornwell, P.; Watkins, T.; Babu, S.; Dehoff, R.; Lorenz, M.; Ovchinnikova, O.; Duty, C. Comparison of Residual Stresses in Inconel 718 Simple Parts Made by Electron Beam Melting and Direct Laser Metal Sintering. Metall. Mater. Trans. A 2015, 46, 1419–1432. [Google Scholar] [CrossRef]
  104. Liu, W.C.; Yao, M.; Chen, Z.L.; Wang, S.G. Niobium segregation in Inconel 718. J. Mater. Sci. 1999, 34, 2583–2586. [Google Scholar] [CrossRef]
  105. Bobbio, L.D.; Bocklund, B.; Otis, R.; Borgonia, J.P.; Dillon, R.P.; Shapiro, A.A.; McEnerney, B.; Liu, Z.K.; Beese, A.M. Characterization of a functionally graded material of Ti-6Al-4V to 304L stainless steel with an intermediate V section. J. Alloys Compd. 2018, 742, 1031–1036. [Google Scholar] [CrossRef]
  106. Carroll, B.E.; Otis, R.A.; Borgonia, J.P.; Suh, J.O.; Dillon, R.P.; Shapiro, A.A.; Hofmann, D.C.; Liu, Z.K.; Beese, A.M. Functionally graded material of 304L stainless steel and inconel 625 fabricated by directed energy deposition: Characterization and thermodynamic modeling. Acta Mater. 2016, 108, 46–54. [Google Scholar] [CrossRef] [Green Version]
  107. Serrano-Munoz, I.; Ulbricht, A.; Fritsch, T.; Mishurova, T.; Kromm, A.; Hofmann, M.; Wimpory, R.C.; Evans, A.; Bruno, G. Scanning Manufacturing Parameters Determining the Residual Stress State in LPBF IN718 Small Parts. Adv. Eng. Mater. 2021, 23, 2100158. [Google Scholar] [CrossRef]
  108. Bayerlein, F.; Bodensteiner, F.; Zeller, C.; Hofmann, M.; Zaeh, M.F. Transient development of residual stresses in laser beam melting—A neutron diffraction study. Addit. Manuf. 2018, 24, 587–594. [Google Scholar] [CrossRef]
  109. Syed, A.K.; Ahmad, B.; Guo, H.; Machry, T.; Eatock, D.; Meyer, J.; Fitzpatrick, M.E.; Zhang, X. An experimental study of residual stress and direction-dependence of fatigue crack growth behaviour in as-built and stress-relieved selective-laser-melted Ti6Al4V. Mater. Sci. Eng. A 2019, 755, 246–257. [Google Scholar] [CrossRef]
  110. Brown, D.W.; Bernardin, J.D.; Carpenter, J.S.; Clausen, B.; Spernjak, D.; Thompson, J.M. Neutron diffraction measurements of residual stress in additively manufactured stainless steel. Mater. Sci. Eng. A 2016, 678, 291–298. [Google Scholar] [CrossRef] [Green Version]
  111. Woo, W.; Kim, D.-K.; Kingston, E.J.; Luzin, V.; Salvemini, F.; Hill, M.R. Effect of interlayers and scanning strategies on through-thickness residual stress distributions in additive manufactured ferritic-austenitic steel structure. Mater. Sci. Eng. A 2019, 744, 618–629. [Google Scholar] [CrossRef]
  112. Pratt, P.; Felicelli, S.D.; Wang, L.; Hubbard, C.R. Residual Stress Measurement of Laser-Engineered Net Shaping AISI 410 Thin Plates Using Neutron Diffraction. Metall. Mater. Trans. A 2008, 39, 3155–3163. [Google Scholar] [CrossRef]
  113. Cottam, R.; Wang, J.; Luzin, V. Characterization of microstructure and residual stress in a 3D H13 tool steel component produced by additive manufacturing. J. Mater. Res. 2014, 29, 1978–1986. [Google Scholar] [CrossRef]
  114. Hosford, W.F. Mechanical Behavior of Materials; Cambridge University Press: Cambridge, UK; New York, NY, USA, 2005; p. xx. 425p. [Google Scholar]
  115. An, K.; Yuan, L.; Dial, L.; Spinelli, I.; Stoica, A.D.; Gao, Y. Neutron residual stress measurement and numerical modeling in a curved thin-walled structure by laser powder bed fusion additive manufacturing. Mater. Des. 2017, 135, 122–132. [Google Scholar] [CrossRef]
  116. Fritsch, T.; Sprengel, M.; Evans, A.; Farahbod-Sternahl, L.; Saliwan-Neumann, R.; Hofmann, M.; Bruno, G. On the determination of residual stresses in additively manufactured lattice structures. J. Appl Crystallogr. 2021, 54, 228–236. [Google Scholar] [CrossRef] [PubMed]
  117. Vrancken, B. Study of Residual Stresses in Selective Laser Melting; KU Leuven: Leuven, Belgium, 2016. [Google Scholar]
  118. Zener, C.M. Elasticity and Anelasticity of Metals; University of Chicago Press: Chicago, IL, USA, 1948; p. x. 170p. [Google Scholar]
  119. Ranganathan, S.I.; Ostoja-Starzewski, M. Universal elastic anisotropy index. Phys. Rev. Lett. 2008, 101, 055504. [Google Scholar] [CrossRef] [Green Version]
  120. Kube, C.M. Elastic anisotropy of crystals. AIP Adv. 2016, 6, 095209. [Google Scholar] [CrossRef]
  121. Ledbetter, H.; Migliori, A. A general elastic-anisotropy measure. J. Appl. Phys. 2006, 100, 063516. [Google Scholar] [CrossRef]
  122. Chung, D.H.; Buessem, W.R. Elastic Anisotropy of Crystals. J. Appl. Phys. 1967, 38, 2010–2012. [Google Scholar] [CrossRef]
  123. Heldmann, A.; Hoelzel, M.; Hofmann, M.; Gan, W.M.; Schmahl, W.W.; Griesshaber, E.; Hansen, T.; Schell, N.; Petry, W. Diffraction-based determination of single-crystal elastic constants of polycrystalline titanium alloys. J. Appl. Crystallogr. 2019, 52, 1144–1156. [Google Scholar] [CrossRef] [Green Version]
  124. Dieter, G.E. Mechanical Metallurgy, 3rd ed.; McGraw-Hill: New York, NY, USA, 1986; p. xxiii. 751p. [Google Scholar]
  125. Tallon, J.L.; Wolfenden, A. Temperature-Dependence of the Elastic-Constants of Aluminum. J. Phys. Chem. Solids 1979, 40, 831–837. [Google Scholar] [CrossRef]
  126. Kamm, G.N.; Alers, G.A. Low-Temperature Elastic Moduli of Aluminum. J. Appl. Phys. 1964, 35, 327–330. [Google Scholar] [CrossRef]
  127. Sutton, P.M. The Variation of the Elastic Constants of Crystalline Aluminum with Temperature between 63-Degrees-K and 773-Degrees-K. Phys. Rev. 1953, 91, 816–821. [Google Scholar] [CrossRef]
  128. Goens, E. The main resilience constants of monocrystal of cooper, gold and lead. Phys. Z. 1936, 37, 321–326. [Google Scholar]
  129. Lazarus, D. The Variation of the Adiabatic Elastic Constants of Kcl, Nacl, Cuzn, Cu, and Al with Pressure to 10,000 Bars. Phys. Rev. 1949, 76, 545–553. [Google Scholar] [CrossRef]
  130. Schmunk, R.E.; Smith, C.S. Pressure Derivatives of the Elastic Constants of Aluminum and Magnesium. J. Phys. Chem. Solids 1959, 9, 100–112. [Google Scholar] [CrossRef]
  131. Wang, Z.; Stoica, A.D.; Ma, D.; Beese, A.M. Diffraction and single-crystal elastic constants of Inconel 625 at room and elevated temperatures determined by neutron diffraction. Mater. Sci. Eng. A 2016, 674, 406–412. [Google Scholar] [CrossRef] [Green Version]
  132. Haldipur, P.; Margetan, F.J.; Thompson, R.B. Estimation of single-crystal elastic constants from ultrasonic measurements on polycrystalline specimens. AIP 2004, 700, 1061–1068. [Google Scholar] [CrossRef]
  133. Martin, G.; Ochoa, N.; Sai, K.; Herve-Luanco, E.; Cailletaud, G. A multiscale model for the elastoviscoplastic behavior of Directionally Solidified alloys: Application to FE structural computations. Int. J. Solids Struct. 2014, 51, 1175–1187. [Google Scholar] [CrossRef]
  134. Jothi, S.; Merzlikin, S.V.; Croft, T.N.; Andersson, J.; Brown, S.G.R. An investigation of micro-mechanisms in hydrogen induced cracking in nickel-based superalloy 718. J. Alloys Compd. 2016, 664, 664–681. [Google Scholar] [CrossRef] [Green Version]
  135. Kikuchi, M. Elastic Anisotropy and Its Temperature Dependence of Single-Crystals and Polycrystal of 18-12 Type Stainless-Steel. Trans. Jpn. Inst. Met. 1971, 12, 417–421. [Google Scholar] [CrossRef] [Green Version]
  136. Bradfield, G. Comparison of Elastic Anisotropy of 2 Austenitic Steels. J. Iron Steel Inst. 1964, 202, 616. [Google Scholar]
  137. Mangalick, M.C.; Fiore, N.F. Orientation Dependence of Dislocation Damping and Elastic Constants in Fe-18cr-Ni Single Crystals. Trans. Metall. Soc. AIME 1968, 242, 2363. [Google Scholar]
  138. Voigt, W. Ueber die Beziehung zwischen den beiden Elasticitätsconstanten isotroper Körper. Ann. Phys. 1889, 274, 573–587. [Google Scholar] [CrossRef] [Green Version]
  139. Reuss, A. Account of the liquid limit of mixed crystals on the basis of the plasticity condition for single crystal. Z. Angew. Math. Mech. 1929, 9, 49–58. [Google Scholar] [CrossRef]
  140. Eshelby, J.D. The Determination of the Elastic Field of an Ellipsoidal Inclusion, and Related Problems. Proc. R. Soc. Lond. Ser. A-Math. Phys. Sci. 1957, 241, 376–396. [Google Scholar] [CrossRef]
  141. Kröner, E. Berechnung Der Elastischen Konstanten Des Vielkristalls Aus Den Konstanten Des Einkristalls. Z. Fur Phys. 1958, 151, 504–518. [Google Scholar] [CrossRef]
  142. Holden, T.M.; Holt, R.A.; Clarke, A.P. Intergranular strains in Inconel-600 and the impact on interpreting stress fields in beat steam-generator tubing. Mater. Sci. Eng. A 1998, 246, 180–198. [Google Scholar] [CrossRef]
  143. Wagner, J.N.; Hofmann, M.; Wimpory, R.; Krempaszky, C.; Stockinger, M. Microstructure and temperature dependence of intergranular strains on diffractometric macroscopic residual stress analysis. Mater. Sci. Eng. A 2014, 618, 271–279. [Google Scholar] [CrossRef]
  144. Daymond, M.R.; Bouchard, P.J. Elastoplastic deformation of 316 stainless steel under tensile loading at elevated temperatures. Metall. Mater. Trans. A-Phys. Metall. Mater. Sci. 2006, 37, 1863–1873. [Google Scholar] [CrossRef]
  145. Dölle, H.; Hauk, V. Influence of Mechanical Anisotropy of Polycrystal (Texture) Upon Stress Evaluation by Means of X-rays. Z. Fur Met. 1978, 69, 410–417. [Google Scholar]
  146. Slim, M.F.; Alhussein, A.; Zgheib, E.; Francois, M. Determination of single-crystal elasticity constants of the beta phase in a multiphase tungsten thin film using impulse excitation technique, X-ray diffraction and micro-mechanical modeling. Acta Mater. 2019, 175, 348–360. [Google Scholar] [CrossRef]
  147. Brakman, C.M. Diffraction Elastic-Constants of Textured Cubic Materials—The Voigt Model Case. Philos. Mag. A-Phys. Condens. Matter Struct. Defects Mech. Prop. 1987, 55, 39–58. [Google Scholar] [CrossRef]
  148. Welzel, U.; Mittemeijer, E.J. Diffraction stress analysis of macroscopically elastically anisotropic specimens: On the concepts of diffraction elastic constants and stress factors. J. Appl. Phys. 2003, 93, 9001–9011. [Google Scholar] [CrossRef]
  149. Welzel, U.; Ligot, J.; Lamparter, P.; Vermeulen, A.C.; Mittemeijer, E.J. Stress analysis of polycrystalline thin films and surface regions by X-ray diffraction. J. Appl. Crystallogr. 2005, 38, 1–29. [Google Scholar] [CrossRef]
  150. Welzel, U.; Freour, S.; Kumar, A.; Mittemeijer, E.J. Diffraction stress analysis using direction dependent grain-interaction models. Mater. Sci. Forum 2005, 490–491, 7–12. [Google Scholar] [CrossRef] [Green Version]
  151. Gnäupel-Herold, T.; Creuziger, A.A.; Iadicola, M. A model for calculating diffraction elastic constants. J. Appl. Crystallogr. 2012, 45, 197–206. [Google Scholar] [CrossRef]
  152. Wu, T.T. The effect of inclusion shape on the elastic moduli of a two-phase material. Int. J. Solids Scrut. 1966, 2, 1–8. [Google Scholar] [CrossRef]
  153. Zhang, X.X.; Lutz, A.; Andrä, H.; Lahres, M.; Gan, W.M.; Maawad, E.; Emmelmann, C. Evolution of microscopic strains, stresses, and dislocation density during in-situ tensile loading od additively manufactured AlSi10Mg. Int. J. Plast. 2021, 139, 102946. [Google Scholar] [CrossRef]
  154. Chen, W.; Voisin, T.; Zhang, Y.; Florien, J.B.; Spadaccini, C.M.; McDowell, D.L.; Zhu, T.; Wang, Y.M. Microscale residual stresses in additively manufactured stainless steel. Nat. Commun. 2019, 10, 4338. [Google Scholar] [CrossRef] [Green Version]
  155. Zhang, D.C.; Wang, L.Y.; Zhang, H.; Maldar, A.; Zhu, G.M.; Chen, W.; Park, J.S.; Wang, J.; Zeng, X.Q. Effect of heat treatment on the tensile behavior of selective laser melted Ti-6Al-4V by in situ X-ray characterization. Acta Mater. 2020, 189, 93–104. [Google Scholar] [CrossRef]
  156. Mishurova, T.; Artzt, K.; Haubrich, J.; Evsevleev, S.; Evans, A.; Meixner, M.; Munoz, I.S.; Sevostianov, I.; Requena, G.; Bruno, G. Connecting Diffraction-Based Strain with Macroscopic Stresses in Laser Powder Bed Fused Ti-6Al-4V. Metall. Mater. Trans. A 2020, 51, 3194–3204. [Google Scholar] [CrossRef] [Green Version]
  157. Klaus, M.; Genzel, C. Reassessment of evaluation methods for the analysis of near-surface residual stress fields using energy-dispersive diffraction. J. Appl. Crystallogr. 2019, 52, 94–105. [Google Scholar] [CrossRef]
  158. Aba-Perea, P.E.; Pirling, T.; Withers, P.J.; Kelleher, J.; Kabra, S.; Preuss, M. Determination of the high temperature elastic properties and diffraction elastic constants of Ni-base superalloys. Mater. Des. 2016, 89, 856–863. [Google Scholar] [CrossRef]
  159. Song, J.; Wu, W.; Zhang, L.; He, B.; Lu, L.; Ni, X.; Long, Q.; Zhu, G. Role of scanning strategy on residual stress distribution in Ti-6Al-4V alloy prepared by selective laser melting. Optik 2018, 170, 342–352. [Google Scholar] [CrossRef]
  160. Anderson, L.S.; Venter, A.M.; Vrancken, B.; Marais, D.; van Humbeeck, J.; Becker, T.H. Investigating the Residual Stress Distribution in Selective Laser Melting Produced Ti-6Al-4V using Neutron Diffraction. Mater. Res. Proc. 2018, 4, 73–78. [Google Scholar] [CrossRef] [Green Version]
  161. Wang, L.; Felicelli, S.D.; Pratt, P. Residual stresses in LENS-deposited AISI 410 stainless steel plates. Mater. Sci. Eng. A 2008, 496, 234–241. [Google Scholar] [CrossRef]
  162. Lesyk, D.A.; Martinez, S.; Mordyuk, B.N.; Dzhemelinskyi, V.V.; Lamikiz, A.; Prokopenko, G.I. Post-processing of the Inconel 718 alloy parts fabricated by selective laser melting: Effects of mechanical surface treatments on surface topography, porosity, hardness and residual stress. Surf. Coat. Tech. 2020, 381, 125136. [Google Scholar] [CrossRef]
  163. Li, L.; Pan, T.; Zhang, X.C.; Chen, Y.T.; Cui, W.Y.; Yan, L.; Liou, F. Deformations and stresses prediction of cantilever structures fabricated by selective laser melting process. Rapid Prototyp. J. 2021, 27, 453–464. [Google Scholar] [CrossRef]
  164. van Zyl, I.; Yadroitsava, I.; Yadroitsev, I. Residual Stress in Ti6al4v Objects Produced by Direct Metal Laser Sintering. S. Afr. J. Ind. Eng. 2016, 27, 134–141. [Google Scholar] [CrossRef]
  165. Shah, K.; Haq, I.U.; Shah, S.A.; Khan, F.U.; Khan, M.T.; Khan, S. Experimental Study of Direct Laser Deposition of Ti-6Al-4V and Inconel 718 by Using Pulsed Parameters. Sci. World J. 2014, 2014, 841549. [Google Scholar] [CrossRef]
  166. Levkulich, N.C.; Semiatin, S.L.; Gockel, J.E.; Middendorf, J.R.; DeWald, A.T.; Klingbeil, N.W. The effect of process parameters on residual stress evolution and distortion in the laser powder bed fusion of Ti-6Al-4V. Addit. Manuf. 2019, 28, 475–484. [Google Scholar] [CrossRef]
  167. Serrano-Munoz, I.; Mishurova, T.; Thiede, T.; Sprengel, M.; Kromm, A.; Nadammal, N.; Nolze, G.; Saliwan-Neumann, R.; Evans, A.; Bruno, G. The residual stress in as-built Laser Powder Bed Fusion IN718 alloy as a consequence of the scanning strategy induced microstructure. Sci. Rep. 2020, 10, 14645. [Google Scholar] [CrossRef]
  168. Mishurova, T.; Artzt, K.; Haubrich, J.; Requena, G.; Bruno, G. New aspects about the search for the most relevant parameters optimizing SLM materials. Addit. Manuf. 2019, 25, 325–334. [Google Scholar] [CrossRef]
  169. Rangaswamy, P.; Griffith, M.L.; Prime, M.B.; Holden, T.M.; Rogge, R.B.; Edwards, J.M.; Sebring, R.J. Residual stresses in LENS® components using neutron diffraction and contour method. Mater. Sci. Eng. A 2005, 399, 72–83. [Google Scholar] [CrossRef]
  170. Rangaswamy, P.; Holden, T.M.; Rogge, R.B.; Griffith, M.L. Residual stresses in components formed by the laserengineered net shaping (LENS®) process. J. Strain Anal. Eng. Des. 2003, 38, 519–527. [Google Scholar] [CrossRef]
  171. Vrancken, B.; Wauthle, R.; Kruth, J.-P.; Humbeeck, J. Study of the influence of material properties on residual stress in selective laser melting. In Proceedings of the 24th International SFF Symposium: An Additive Manufacturing Conference, Austin, TX, USA, 12–14 August 2013; pp. 393–407. [Google Scholar]
  172. Clausen, B.; Leffers, T.; Lorentzen, T. On the proper selection of reflections for the measurement of bulk residual stresses by diffraction methods. Acta Mater. 2003, 51, 6181–6188. [Google Scholar] [CrossRef]
  173. Daymond, M.R.; Bourke, M.A.M.; VonDreele, R.B.; Clausen, B.; Lorentzen, T. Use of Rietveld refinement for elastic macrostrain determination and for evaluation of plastic strain history from diffraction spectra. J. Appl. Phys. 1997, 82, 1554–1562. [Google Scholar] [CrossRef]
  174. Dye, D.; Stone, H.J.; Reed, R.C. Intergranular and interphase microstresses. Curr. Opin. Solid State Mater. Sci. 2001, 5, 31–37. [Google Scholar] [CrossRef]
  175. Clausen, B.; Lorentzen, T.; Leffers, T. Self-consistent modelling of the plastic deformation of FCC polycrystals and its implications for diffraction measurements of internal stresses. Acta Mater. 1998, 46, 3087–3098. [Google Scholar] [CrossRef]
  176. Daymond, M.R.; Tome, C.N.; Bourke, M.A.M. Measured and predicted intergranular strains in textured austenitic steel. Acta Mater. 2000, 48, 553–564. [Google Scholar] [CrossRef]
  177. ISO-21432. Non-Destructive Tesing—Standard Test Method for Determining Residual Stresses by Neutron Diffraction; International Organization for Standardization: Geneva, Switzerland, 2019. [Google Scholar] [CrossRef]
  178. Choo, H.; Koehler, M.R.; White, L.P.; Ren, Y.; Morin, D.; Garlea, E. Influence of defect characteristics on tensile deformation of an additively manufactured stainless steel: Evolutions of texture and intergranular strain. Mater. Sci. Eng. A 2020, 791, 139637. [Google Scholar] [CrossRef]
  179. Clausen, B.; Lorentzen, T.; Bourke, M.A.M.; Daymond, M.R. Lattice strain evolution during uniaxial tensile loading of stainless steel. Mater. Sci. Eng. A 1999, 259, 17–24. [Google Scholar] [CrossRef]
  180. Wang, Y.M.; Voisin, T.; McKeown, J.T.; Ye, J.C.; Calta, N.P.; Li, Z.; Zeng, Z.; Zhang, Y.; Chen, W.; Roehling, T.T.; et al. Additively manufactured hierarchical stainless steels with high strength and ductility. Nat. Mater. 2018, 17, 63–71. [Google Scholar] [CrossRef] [Green Version]
  181. Warwick, J.L.W.; Coakley, J.; Raghunathan, S.L.; Tailing, R.J.; Dye, D. Effect of texture on load partitioning in Ti-6Al-4V. Acta Mater. 2012, 60, 4117–4127. [Google Scholar] [CrossRef]
  182. Stapleton, A.M.; Raghunathan, S.L.; Bantounas, I.; Stone, H.J.; Lindley, T.C.; Dye, D. Evolution of lattice strain in Ti-6Al-4V during tensile loading at room temperature. Acta Mater. 2008, 56, 6186–6196. [Google Scholar] [CrossRef]
  183. Cho, J.R.; Dye, D.; Conlon, K.T.; Daymond, M.R.; Reed, R.C. Intergranular strain accumulation in a near-alpha titanium alloy during plastic deformation. Acta Mater. 2002, 50, 4847–4864. [Google Scholar] [CrossRef]
  184. Voisin, T.; Calta, N.P.; Khairallah, S.A.; Forien, J.B.; Balogh, L.; Cunningham, R.W.; Rollett, A.D.; Wang, Y.M. Defects-dictated tensile properties of selective laser melted Ti-6Al-4V. Mater. Des. 2018, 158, 113–126. [Google Scholar] [CrossRef]
  185. Vallejos, J.M.; Barriobero-Vila, P.; Gussone, J.; Haubrich, J.; Kelm, K.; Stark, A.; Schell, N.; Requena, G. In Situ High-Energy Synchrotron X-Ray Diffraction Reveals the Role of Texture on the Activation of Slip and Twinning during Deformation of Laser Powder Bed Fusion Ti-6Al-4V. Adv. Eng. Mater. 2021, 2001556. [Google Scholar] [CrossRef]
  186. Sangid, M.D.; Book, T.A.; Naragani, D.; Rotella, J.; Ravi, P.; Finch, A.; Kenesei, P.; Park, J.-S.; Sharma, H.; Almer, J.; et al. Role of heat treatment and build orientation in the microstructure sensitive deformation characteristics of IN718 produced via SLM additive manufacturing. Addit. Manuf. 2018, 22, 479–496. [Google Scholar] [CrossRef]
  187. Capek, J.; Polatidis, E.; Knapek, M.; Lyphout, C.; Casati, N.; Pederson, R.; Strobl, M. The Effect of γ” and δ Phase Precipitation on the Mechanical Properties of Inconel 718 Manufactured by Selective Laser Melting: An In Situ Neutron Diffraction and Acoustic Emission Study. JOM 2021, 73, 223–232. [Google Scholar] [CrossRef]
  188. Brown, D.W.; Adams, D.P.; Balogh, L.; Carpenter, J.S.; Clausen, B.; King, G.; Reedlunn, B.; Palmer, T.A.; Maguire, M.C.; Vogel, S.C. In Situ Neutron Diffraction Study of the Influence of Microstructure on the Mechanical Response of Additively Manufactured 304L Stainless Steel. Metall. Mater. Trans. A 2017, 48, 6055–6069. [Google Scholar] [CrossRef]
  189. Zhang, X.X.; Andra, H.; Harjo, S.; Gong, W.; Kawasaki, T.; Lutz, A.; Lahres, M. Quantifying internal strains, stresses, and dislocation density in additively manufactured AlSi10Mg during loading-unloading-reloading deformation. Mater. Des. 2021, 198, 109339. [Google Scholar] [CrossRef]
Figure 3. Schematic images showing the effect of the heat input on the stress state during (a) heating and (b) cooling in LPBF manufacturing (adapted from [60]).
Metals 11 01830 g003
Figure 4. Example of a stress distribution along the build direction (σN) in LPBF of 316L prisms measured by ND (bulk) and lab X-ray (surface). Reproduced from [79].
Metals 11 01830 g004
Figure 5. Orientation of the laboratory coordinate system (L) with respect to the sample coordinate system (S), and the associated angles φ and ψ. η denotes the rotation angle around the measurement direction (adapted from [32]).
Metals 11 01830 g005
Figure 6. Simplified ε ( s i n 2 ψ ) distribution assuming an elastically isotropic or non-textured material in a homogeneous compression stress state (adapted from [32]).
Metals 11 01830 g006
Figure 7. Neutron peak profile. Reproduced from [102] with permission from Elsevier.
Metals 11 01830 g007
Figure 8. Time-of-flight pattern. Reproduced from [102] with permission from Elsevier.
Metals 11 01830 g008
Figure 10. Reference d 0 311 as a function of distance from the build-baseplate interface measured by neutron diffraction in the 40 s dwell time stress-free reference samples without heat treatment. Reproduced from [31] with permission from Elsevier.
Metals 11 01830 g010
Figure 11. Overview of different model approaches for the calculation of the diffraction elastic constants. (a) Voigt model [138] (b) Reuss model [139] (c) Eshelby–Kröner model [141].
Metals 11 01830 g011
Figure 12. Comparison of the model predictions of Reuss, Voigt and Kröner for Ni-based alloys Inconel 718 (a), Inconel 625 (b) [39] and Ti6Al4V [155,156] (c).
Metals 11 01830 g012
Table 1. Overview of the different methods to obtain a d 0 h k l in the domain of laser-based AM.
MethodAdvantagesDisadvantagesReferences
Cubes/
matchsticks
  • Can capture spatial variations when taken from several regions
  • Represent thermal history
  • Contain same chemical segregation if taken from representative twin
  • Need a sister sample
  • Require precise sample alignment
  • Contain possible type I and II stresses
  • Display possible anisotropy of d 0 h k l depending on direction
  • Are destructive for twin or actual specimen
[79,82,103,109,110,112]
Comb/arrays
  • Can capture spatial variations
  • Are easier to align (relative to cubes)
  • Are easier to extract with respect to cubes taken from distinct positions
Same as Cubes/matchsticks and:
  • Are time consuming to measure
  • Require twin or destruction of specimen
[31,46,80,81,91,111]
Stress balance
  • Does not need twin sample
  • Is fully non-destructive
  • Cannot capture spatial variations of d 0 h k l
  • Only works with a high density of measurement points over a cross section
  • Needs to be experimentally verified
[80,81,86,103,107,113]
Feedstock powder
  • Is easily obtained for powder-based AM
  • Does not represent the thermal history of the AM process
  • Has different segregation from the AM part
[82,103,107]
Powder filings
  • Represent thermal history of the sample
  • Are plastically deformed
  • Need a twin specimen (or partially destroy the specimen)
  • Can yield spatially resolved d 0 h k l only if extracted from distinct locations
[82,107]
Sin2ψ
  • Is fully non-destructive
  • Can only be applied for plane stress states
  • Relies on the DECs
[38,82]
Table 2. Single crystal elastic constants (SCEC) of several engineering alloys in GPa, with their dimensionless calculated Zener (Az) and universal (AL) anisotropy ratios. For the calculation of AL the Matlab script provided by Kube [120] was used.
MaterialCrystal StructureC11C12C44C33C13Ref.AZAL [∙10−2]
AluminiumFCC108.261.328.5--[124]1.22.04
107.960.428.6--[125]1.21.85
106.860.728.2--[126]1.22.18
112.466.327.7--[127]1.21.81
108.262.228.4--[128]1.22.38
105.663.928.5--[129]1.45.22
107.360.928.3--[130]1.22.12
Average 108.162.228.3---1.22.35
Ti6Al4VHCP150834213753[123]-5.67
Inconel 625FCC243.3156.7117.8--[131]2.751.88
Inconel 718FCC240.9140.5105.7--[132]2.129.17
259.6179109.6--[133]2.751.85
231.2145.1117.2--[134]2.751.95
Average 243.9154.9110.8---2.543.36
316LFCC191.2117.9138.6--[135]3.889.33
215.9144.6128.9--[136]3.683.72
198125122--[137]3.371.38
Average 204.4131.8128.8---3.681.41
Table 3. Experimentally determined diffraction elastic constants by the means of diffraction methods. The plane-specific elastic moduli ( E h k l ) are given in GPa.
MaterialProcessConditionE200E311E420E220E331E111 Ref.
AlSi10Mg LPBF As built
tension
6668-71-73 [153]
IN625 LMD As built
compression
123156169210219278 [131]
IN718 LPBF FHT *
tension
194196231-230- [39]
IN718 LPBF DA **
tension
152173173199227197 [39]
316L LPBF As built
tension
139180-219-246 [154]
Ti6Al4V LPBF E 10 1 ¯ 0 E 10 1 ¯ 1 E 11 2 ¯ 2 E 0002 E 10 1 ¯ 2 E 10 1 ¯ 3
As built
tension
110106117-107117[155]
HT-730
tension
106116126134128125
HT-900
tension
111114113132118127
E 21 3 ¯ 0 E 11 2 ¯ 0 E 10 1 ¯ 1 E 11 2 ¯ 2 E 20 2 ¯ 3 E 10 1 ¯ 2 E 10 1 ¯ 3
As built
tension
108110115115116120125[156]
As built
compression
-115-117123125126
* FHT (°C/h/MPa): 1066/1.5 + 1150/3/105 + 982/1 + 720/8 + 620/10, ** DA (°C/h): 1066/1.5 + 720/8.
Table 4. Origins of applied diffraction elastic constants used for stress calculation in additively manufactured specimens.
Origin of DECsReferences
Not given[75,76,85,88,109,113,159,160,161,162,163]
unknown origin[10,103,110,164]
Experimental values (conventional)[81,86,165,166]
Reuss Model[38,107,167]
Eshelby–Kröner Model[13,26,74,79,82,83,96,108,112,168,169,170]
Voigt-Reuss-Hill[171]
Experimental values (AM)[31,115]
Table 5. Material dependent selection of Lattice planes for RS determination in laser-based AM.
MaterialAMConventionalConclusion
Inconel 718
(fcc)
  • DA: <200> texture along BD max. 3 m.r.d (corresponds to loading direction) [39]
  • 311 only slightly non-linear upon loading [39]
  • As built: 311 remains linear upon loading (<220> textured along BD) [186]
  • Heat-treated: 311 shows increased non-linearity (untextured) [186]
  • 311, 111 linear upon loading in as built condition, with increased non-linearity of (311) in heat-treated condition (possibly γ shedding load to δ) [187]
  • Low texture (max. 1.5 m.r.d) [143]
  • 311, 111 remain linear upon loading [143]
  • 220 displays non-linearity at larger strains [143]
  • 222 and 311 accumulate low intergranular strain [143]
  • Heat-treatments affect the micromechanical behavior upon loading
  • 311 appears suitable for as built samples
  • Texture up to 3 m.r.d has little influence on the choice of the lattice plane
316L
(fcc)
  • <220> texture along BD (<200> perpendicular which corresponds to LD max. 4 m.r.d) [154]
  • 311: remains linear upon loading in the loading direction [154]
  • 200, 111, 220 display increased non-linearity upon loading [154]
  • <110> texture along BD (max. 2.8 m.r.d) 311, 200 accumulates significant intergranular strain; 220, 111 accumulate low intergranular strain [178]
  • Nearly untextured (≈ 1 m.r.d) lower magnitude of total intergranular strain accumulated [178]
  • Weak cube texture (max. 2 m.r.d) [179]
  • 311 slightly non-linear at larger strains [179]
  • 311, 111 accumulate low residual strain [179]
  • 311 accumulates significant intergranular strain, but remains linear upon loading
  • 220 lowest intergranular strain accumulation and representative for the bulk (along BD; dependent on processing conditions)
    Comparison to full pattern fit required to draw a general conclusion
    Texture must be taken into consideration
304
(fcc)
  • Austenite <200> textured perpendicular to BD (max. 3 m.r.d corresponds to loading direction) [188]
  • 311: Slight increase in non-linearity upon loading [188]
  • Different behavior in compression/tension for 200, 111, 220 [188]
  • 200 carries load shed from 220 and 111 [188]
  • Low texture (max. 1 m.r.d) [188]
  • 311: linear behavior [188]
  • No difference in compression/tension [188]
  • 200 carries load shed from 220 and 111 [188]
AlSiMg10
(fcc)
  • Texture with max. 3.4 m.r.d [153]
  • Interphase and intergranular strains between Al matrix and Si particles [153]
  • Strong non-linearity in plastic region for every reflection [153]
  • <100> texture along BD with max. 4.5 m.r.d [189]
  • Al phase accumulates significant residual strains for 220 < 111 < 311 < 200 (parallel to loading direction) [189]
  • Si phase accumulates significant residual strains for 111 and 311 [189]
  • Rietveld refinement reasonably agrees with the trend for both Al and Si 311 [189]
-
  • Significant residual strains accumulate in 311
  • Still 311 displays best agreement with average obtained by Rietveld refinement (represents bulk behavior)
  • 220 accumulates least residual strain
Ti6Al4V
(hcp)
  • <002> texture along BD (max. 6 m.r.d) in as built specimen [155]
  • Increased non-linearity for 100, 101, 102 at higher deformations in as built condition [155]
  • <002> texture along BD [184]
  • Early deviation from linearity for 002 and 110 (elastic region) [184]
  • 102 and 103 start to deviate at higher strains [184]
  • Strong non-linearity for every reflection upon compressive loading for different build orientations (horizontal, 45°, vertical) [185]
  • Strong twinning formation in vertically build specimen (driven by initial texture) [185]
Unidirectionally rolled plate (UD) (loading along rolling direction (RD)) [181]:
  • <002> texture along transverse direction (max. 3.8 m.r.d)
  • 103, 002 accumulate lowest residual strain
  • Largest in 101, 201
  • Cross rolled plate [181]:
  • <002> texture along RD (max. 3.5 m.r.d)
  • 103, 002 accumulate lowest residual strain
  • Largest in 101, 201
  • Bar vs. UD plate [182]:
  • UD: Strong texture up to max. 6 m.r.d
  • Bar: texture up to max. 2 m.r.d
  • Low accumulation of residual lattice strains for 102 and 002 in both cases
  • Larger accumulation of residual lattice strains for 100 and 110 in UD due to stronger texture
  • Comparable texture intensity of AM and conventional
  • Still significant change of micromechanical behavior between additively manufactured and conventional Ti6Al4V
  • Full pattern fit recommended
  • For AM materials (along BD) 002 may represent the bulk behavior the best
    Question not resolved: Studies on accumulation of residual strains required
Publisher’s Note: MDPI stays neutral with regard to jurisdictional claims in published maps and institutional affiliations.

