Article

Thermodynamic Optimization of the Ternary Ga-Sn-Te System Using Modified Quasichemical Model

1
Department of Metallurgical and Materials Engineering, Indian Institute of Technology Kharagpur, Kharagpur 721302, West Bengal, India
2
Research Institute of Engineering and Technology, Hanyang University, Ansan 15588, Korea
*
Author to whom correspondence should be addressed.
Metals 2021, 11(9), 1363; https://doi.org/10.3390/met11091363
Submission received: 2 August 2021 / Revised: 25 August 2021 / Accepted: 26 August 2021 / Published: 30 August 2021
(This article belongs to the Special Issue Thermodynamic Modeling of Metallurgical Processes)

Abstract

:
Thermoelectric (TE) materials are of great interest to many researchers because they directly convert electric and thermal energy in a solid state. Various materials such as chalcogenides, clathrates, skutterudites, eutectic alloys, and intermetallic alloys have been explored for TE applications. The Ga-Sn-Te system exhibits promising potential as an alternative to the lead telluride (PbTe) based alloys, which are harmful to environments because of Pb toxicity. Therefore, in this study, thermodynamic optimization and critical evaluation of binary Ga-Sn, binary Sn-Te, and ternary Ga-Sn-Te systems have been carried out over the whole composition range from room temperature to above liquidus temperature using the CALPHAD method. It is observed that Sn-Te and Ga-Te liquids show the strong negative deviation from the ideal solution behavior. In contrast, the Ga-Sn liquid solution has a positive mixing enthalpy. These different thermodynamic properties of liquid solution were explicitly described using Modified Quasichemical Model (MQM) in the pair approximation. The asymmetry of ternary liquid solution in the Ga-Sn-Te system was considered by adopting the toop-like interpolation method based on the intrinsic property of each binary. The solid phase of SnTe was optimized using Compound Energy Formalism (CEF) to explain the high temperature homogeneity range, whereas solid solution, Body-Centered Tetragonal (BCT) was optimized using a regular solution model. Thermodynamic properties and phase diagram in the Ga-Sn-Te and its sub-systems were reproduced successfully by the optimized model parameters. Using the developed database, we also suggested several ternary eutectic compositions for designing TE alloy with improved properties.

1. Introduction

Thermoelectric (TE) materials are being continuously developed for application in waste heat recovery and electronic cooling because of their ability to interchange between thermal energy and electrical energy in a solid-state [1,2]. As these materials can harvest waste energy and directly convert it to electricity, they can be applied as green and sustainable energy sources. However, the low conversion efficiency of the TE devices is one of the major limiting factors for commercial applications. This conversion efficiency is described by a dimensionless thermoelectric figure of merit (ZT) represented as S2σT/(k), where S, σ, k, and T are Seebeck coefficient, electrical conductivity, thermal conductivity, and temperature, respectively. The Seebeck coefficient of a material is represented as the ratio of an induced thermoelectric voltage to the temperature difference across that material [3]. Generally, the Seebeck coefficient is inversely proportional to the number of charge carriers, whereas electrical conductivity is directly proportional to the number of charge carriers [4,5]. Therefore, it is challenging to maximize the collective term, S2σ. Another approach is to reduce thermal conductivity by introducing phonon scattering sites such as solid solutions, multi-phase microstructure, precipitations, or nanostructuring. Nanostructuring of materials such as supper-lattices and quantum dots has been proven effective in maximizing the phonon scattering, thereby reducing thermal conductivity [6]. However, the high cost and challenges associated with the large-scale production of such nanostructured materials are limiting factors for commercial application. Eutectic alloys’ lamellar structure resembles superlattice structure and thus is a good source of phonon scattering sites. Therefore, in various literatures such as PbTe-Sb2Te3 [7], PbTe-Te-Ag5Te3 [8], Ag2Te-PbTe-Sb2Te3 [9], PbTe-Bi2Te3 [10], GeTe-Ag8GeTe6 [11], PbTe-Si [12], InSb-Sb [13], (Bi,Sb)2Te3-Te [14], SnTe-Te [15], and Bi2Te3-In2Te3 [16], eutectic alloys have been reported with enhanced ZT. Moreover, multi-functional properties such as lower melting temperature, good mechanical, chemical properties, and low thermal conductivity of eutectic alloys are useful for large-scale production [17,18,19,20,21].
Among the various TE materials such as chalcogenides, skutterudites, intermetallic alloys, and clathrates, Sn-based chalcogenides can potentially be promising TE materials in the intermediate temperature range (600–900 K) as an alternative to PbTe based alloys because of environmental concerns associated with Pb-toxicity [22,23]. Among the Sn- chalcogenides, SnTe has the same rock-salt structure (Fm-3m) and similar electronic structures as PbTe [24]. However, SnTe has many intrinsic Sn vacancies and considerable energy separation between the light hole band at L-point and the heavy hole band at Σ-point, which causes a low Seebeck coefficient as well as high thermal conductivity [25]. A recent study has achieved a ZT of 0.99 at 873 K in alloy Sn0.96Ga0.07Te. They have demonstrated that Ga doping in SnTe improves the electronic properties by activating several hole packets, thereby enhancing the Seebeck Coefficient [26]. Eutectic alloys in this ternary system have not been explored for TE application. Therefore, in this study, thermodynamic assessment of the Ga-Sn-Te was carried out by critical evaluation of experimental data in this system and adopting a proper model that accurately describes the stability of the phases. The thermodynamic calculations can be used to design new ternary eutectic compositions in the Ga-Sn-Te system for TE application.
No thermodynamic optimization has been reported in the Ga-Sn-Te ternary system to the best knowledge of the present authors. A thermodynamic investigation of the ternary Ga-Sn-Te and its sub-binary system is presented in this study. It is observed that Sn-Te and Ga-Te show a strong tendency for local ordering and a sharp negative enthalpy of mixing curve of the liquid solution, whereas Ga-Sn exhibits a positive deviation for the enthalpy of mixing against the ideal mixing. Considering the diversified natures of the sub-binary liquid solution, the liquid phase was optimized using a Modified Quasichemical Model (MQM) [27,28] in the pair approximation that can account for the Short-Range Ordering (SRO) of Te with Ga and Sn in the liquid solution as well as both positive enthalpy of mixing in the Ga-Sn system and the liquid immiscibility in the Ga-rich corner of Ga-Te-Sn system. The binary Sn-Te and Ga-Sn systems were optimized using available experimental data in the literature. The thermodynamic description of the binary Ga-Te was adopted from our recent optimization [29] without any modification. The Gibbs free energy of ternary liquid solution was estimated by combining the optimized model parameters of the three sub-binary systems with a reasonable interpolation method.

2. Thermodynamic Models

All the calculations and optimization in the present study were performed using FactSage thermochemical software [30,31]. The Gibbs free energy of all phases of pure Ga, Sn, and Te was taken from Dinsdale [32].

2.1. Pure Elements and Stoichiometric Compound

The Gibbs free energies of all pure elements were taken from Scientific Group Thermodata Europe (SGTE) database. The Gibbs free energies of pure compounds were determined based on the available experimental data such as heat capacity, standard enthalpy, and entropy at 298.15 K. As the thermodynamic principle, the Gibbs free energies of pure elements can be calculated as follows:
G T ° =   H T °     TS T °
H T ° =   H 298.15   K ° + 298.15   K T C p dT
S T ° = S 298.15   K ° + 298.15   K T ( C p / T ) dT
where   H 298.15   K ° , S 298.15   K ° , and C p are standard enthalpy of formation from the stable pure elements at 298.15 K, entropy at 298.15 K, and heat capacity, respectively. The heat capacity expression of each compound can be determined by fitting heat capacity data. The Neumann–Kopp rule [33] can be used to predict the C p expression in case of no available reliable data on   C p .

2.2. Liquid Solution

The Modified Quasichemical Model (MQM) [27,28], which accounts for the short-range ordering of the nearest neighbor atoms, was used to describe the liquid solutions. Compared to the conventional Bragg–Williams Random Mixing Model, the MQM provides a more realistic description of the entropy of the solution. In the MQM, Gibbs energy of a pair formation can be expressed in a polynomial of a pair fraction instead of a component fraction. Besides, the coordination number is allowed to vary with the composition. These added features of the MQM provide greater flexibility in reproducing the binary experimental data and combining optimized binary liquid parameters into a larger database for a multicomponent system.
In the MQM, the reaction of pair exchanging in a binary A-B liquid solution can be expressed by the distribution of A and B atoms over the sites of the quasi lattice as follows:
( A - A ) + ( B - B ) = 2 ( A - B ) ;   Δ g A B
where (i-j) represents the First-Nearest Neighbor (FNN) pair between components i and j, and Δ g A B is the Gibbs energy change of forming two moles of (A-B) pairs. The Gibbs energy of the liquid solution can be estimated by the following equation:
G L sol = n A g A ° + n B g B ° T Δ S config + ( n A B / 2 ) Δ g A B
where n A , n B , and n A B are the moles of A, B atoms, and A-B pair, respectively. g A ° and g B ° are the molar Gibbs energies of the pure A and B components. Δ S config is the configurational entropy of randomly mixing (A-A), (B-B), and (A-B) pairs.
Δ S config = R ( n A ln X A + n B ln X B ) R ( n A A ln ( X A A Y A 2 ) + n B B ln ( X B B Y B 2 ) + n A B ln ( X A B 2 Y A Y B ) )
where   n i j is the number of moles of (i-j) pairs. Z A and Z B are the coordination numbers of A and B, respectively. Pair fraction X i i , mole fraction X i , and coordination equivalent fraction Y i are defined as follows:
X i i = n i i ( n A A + n B B + n A B )
X A = n A n A + n B = 1 X B
Y A = Z A n A Z A n A + Z B n B = 1 Y B
Z i n i = 2 n i i + n A B
Equation (10) can be obtained by mass balance of (i-j) pairs. The Δ g A B is the model parameter and can be expanded as a polynomial in terms of the pair fraction as follows:
Δ g A B = Δ g A B ° + i 1 Δ g A B i 0 X A A i + j 1 Δ g A B 0 j X B B j
Δ g A B ° , Δ g A B i 0 , and Δ g A B 0 j are the model parameters, and that can be a function of temperature. The composition dependent coordination numbers are given as follows:
1 Z A = 1 Z A A A ( 2 n A A 2 n A A + n A B ) + 1 Z A B A ( 2 n A B 2 n A A + n A B )
1 Z B = 1 Z B B B ( 2 n B B 2 n B B + n A B ) + 1 Z B A B ( 2 n A B 2 n A A + n A B )
where Z A A A and Z A B A are the value Z A when all nearest-neighbor atoms of atom A are A and Bs, respectively. Z B B B and Z B A B are defined analogously. The composition of maximum SRO in each binary subsystem is estimated by ratio of the coordination numbers Z B / Z A . In this study, all the coordination numbers are set to 6, except Z GaTe Te = 4 to have a maximum SRO composition, XTe = 0.6 in the Ga-Te binary system [29].
The Gibbs energy of the ternary liquid solution can be predicted using the interpolation technique based on the model parameter of the sub-binary systems. One of the advantages of the MQM is the flexibility to choose the interpolation method depending on the nature of each binary system. Toop-like interpolation with Te as an asymmetric component was used to describe the asymmetry of the ternary liquid with the positive enthalpy of mixing in the Ga-Sn system and the strong negative enthalpy of mixing in the Ga-Te and Sn-Te systems.

2.3. Solid Solution

In the Ga-Sn-Te ternary system, there are only two existing solid solution phases, SnTe in Sn-Te binary and Body-Centered Tetragonal (BCT) in the Ga-Sn binary system. The Compound Energy Formalism (CEF) [34] is used to describe the Gibbs energy of SnTe to explain the high temperature homogeneity range of the compound. The homogeneity range of the SnTe phase is described by a large intrinsic vacancy at high temperature; thus, it was formulated as (Sn, Va) (Te). The Gibbs energy of the solid solution can be expressed as:
G s sol . = y Sn   y Te   G Sn : Te + y Va   y Te G Va : Te + RT ( y Sn   ln y Sn + y Va   ln y Va   ) + i , j , k y i y j y k L i , j : k + i , j , k y k y i y j L k : i , j
where y i and y i are the site fraction of species, i, in the corresponding sublattice. G i : j is the Gibbs free energy of an end-member, and the L i , j : k and L k : i , j are adjustable interaction parameters between the species in related sublattices.
BCT solid solution was optimized using one lattice regular solution model. This solution model is one lattice version of the CEF. The Gibbs energy expression of the solution using this model is as follows:
G m BCT = X ° G Sn BCT + X Ga ° G Ga BCT + RT i = Sn , Ga X i ln X i + X Sn X Ga i = 0 , 1 L Sn , Ga i ( X Sn X Ga ) i
where L Sn , Ga i is the adjustable model parameter. The self-consistent thermodynamic parameter from the present optimization is given in Table 1.

3. Results

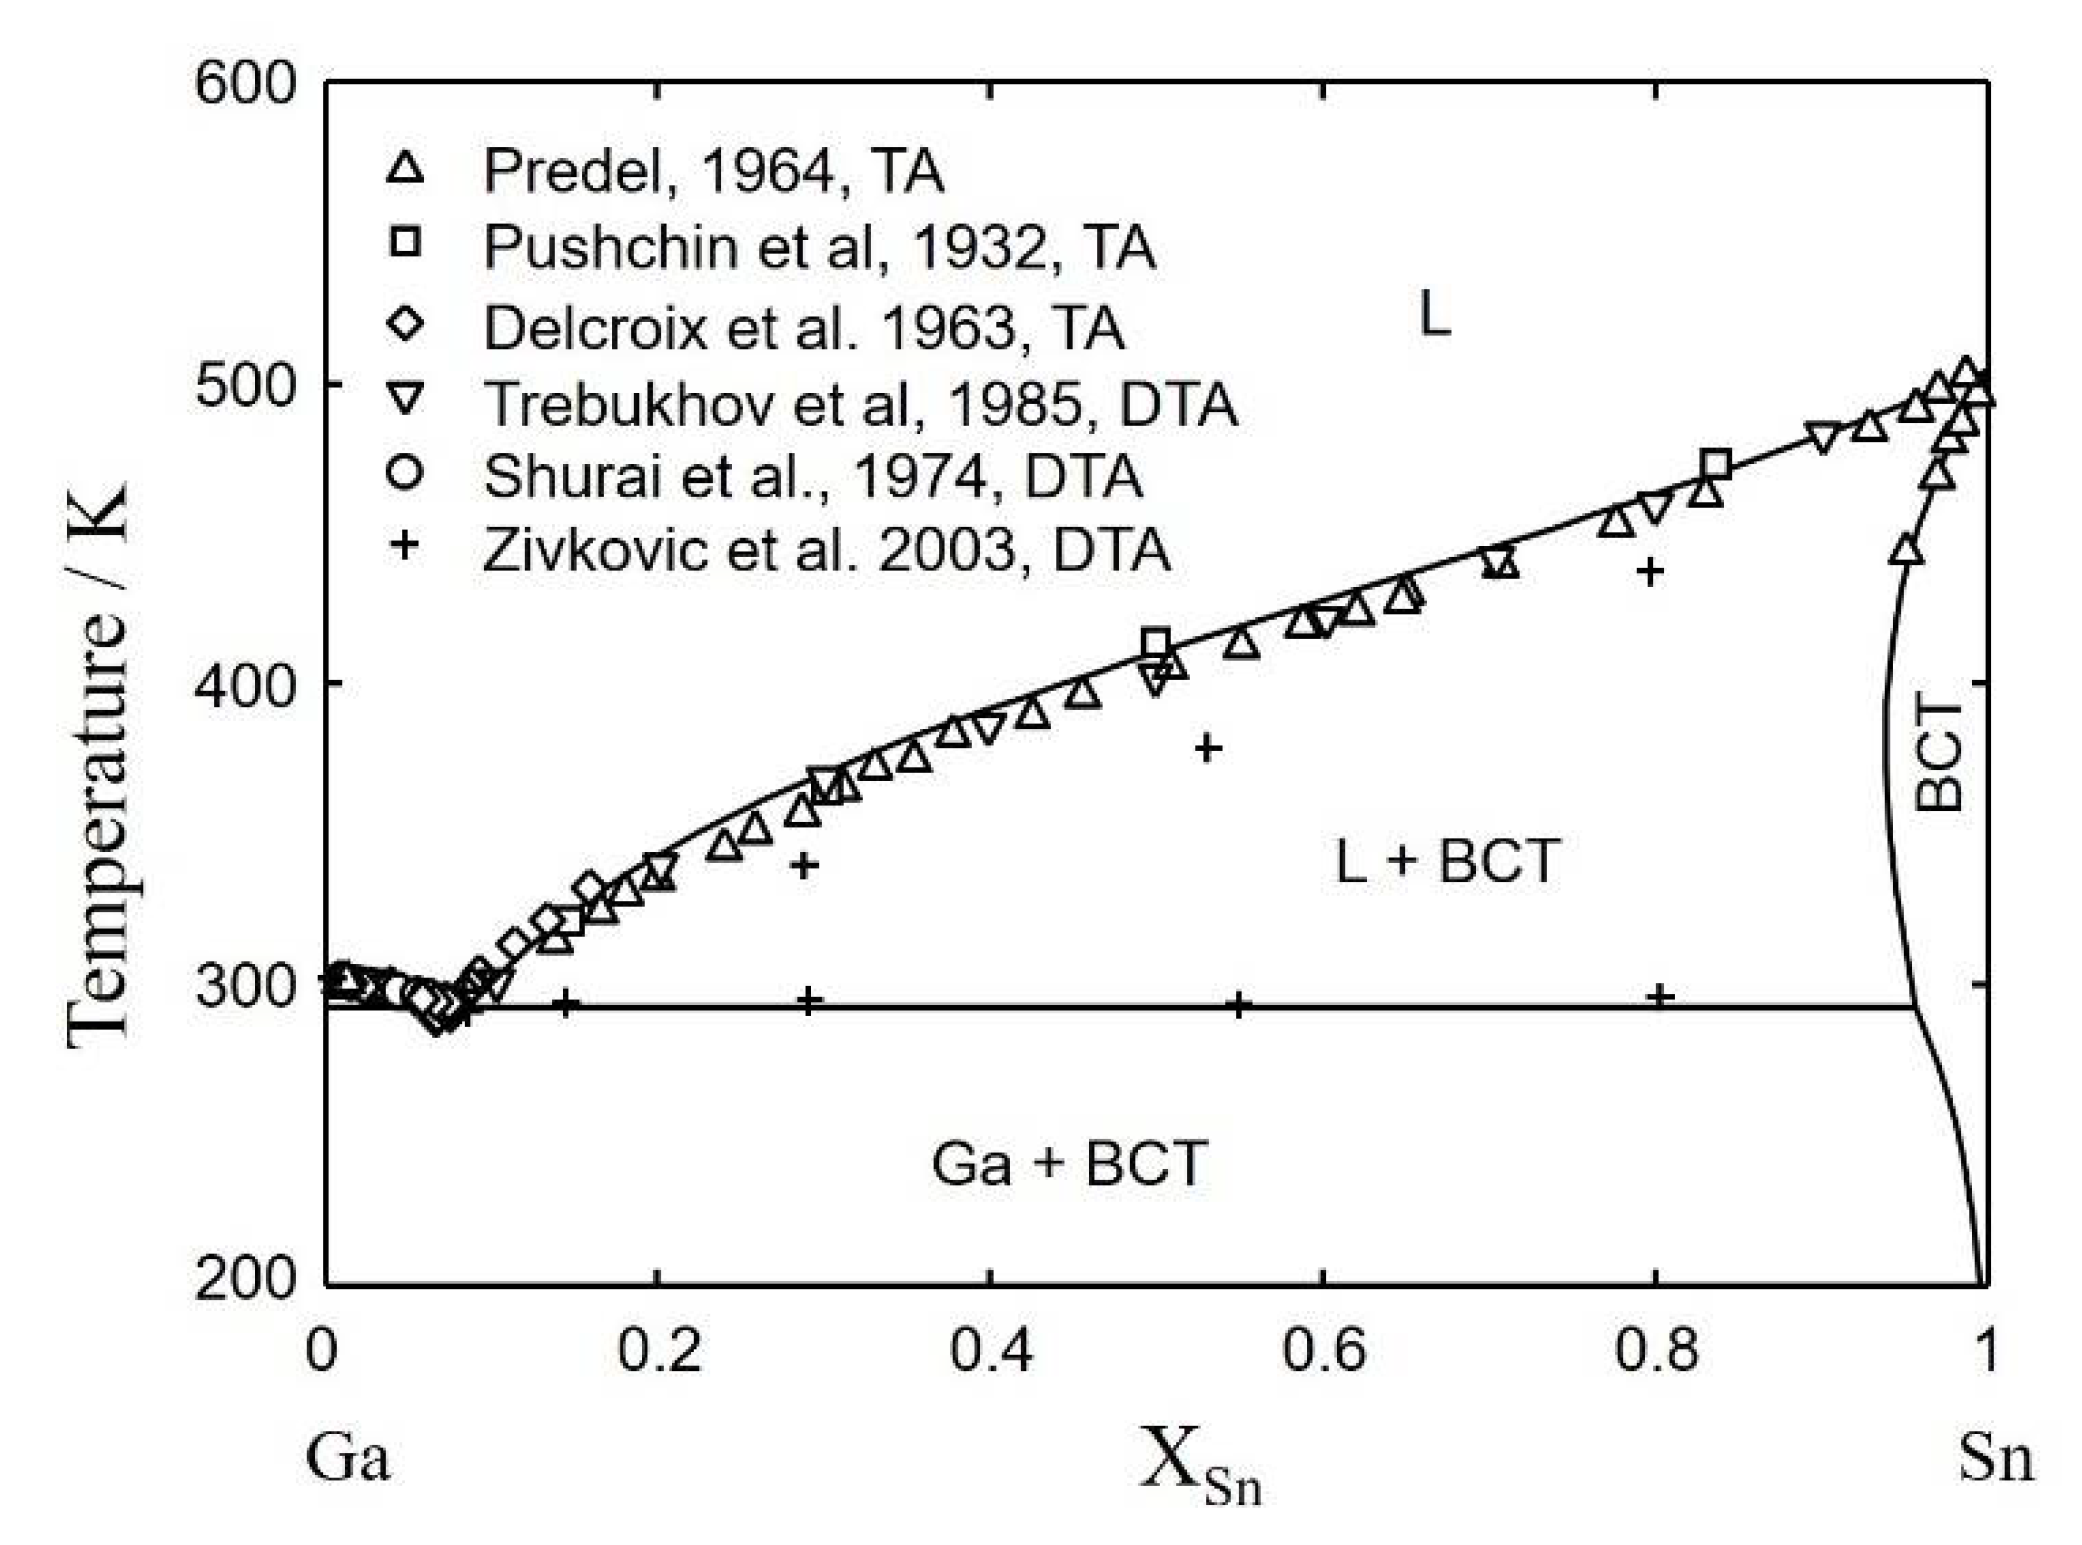
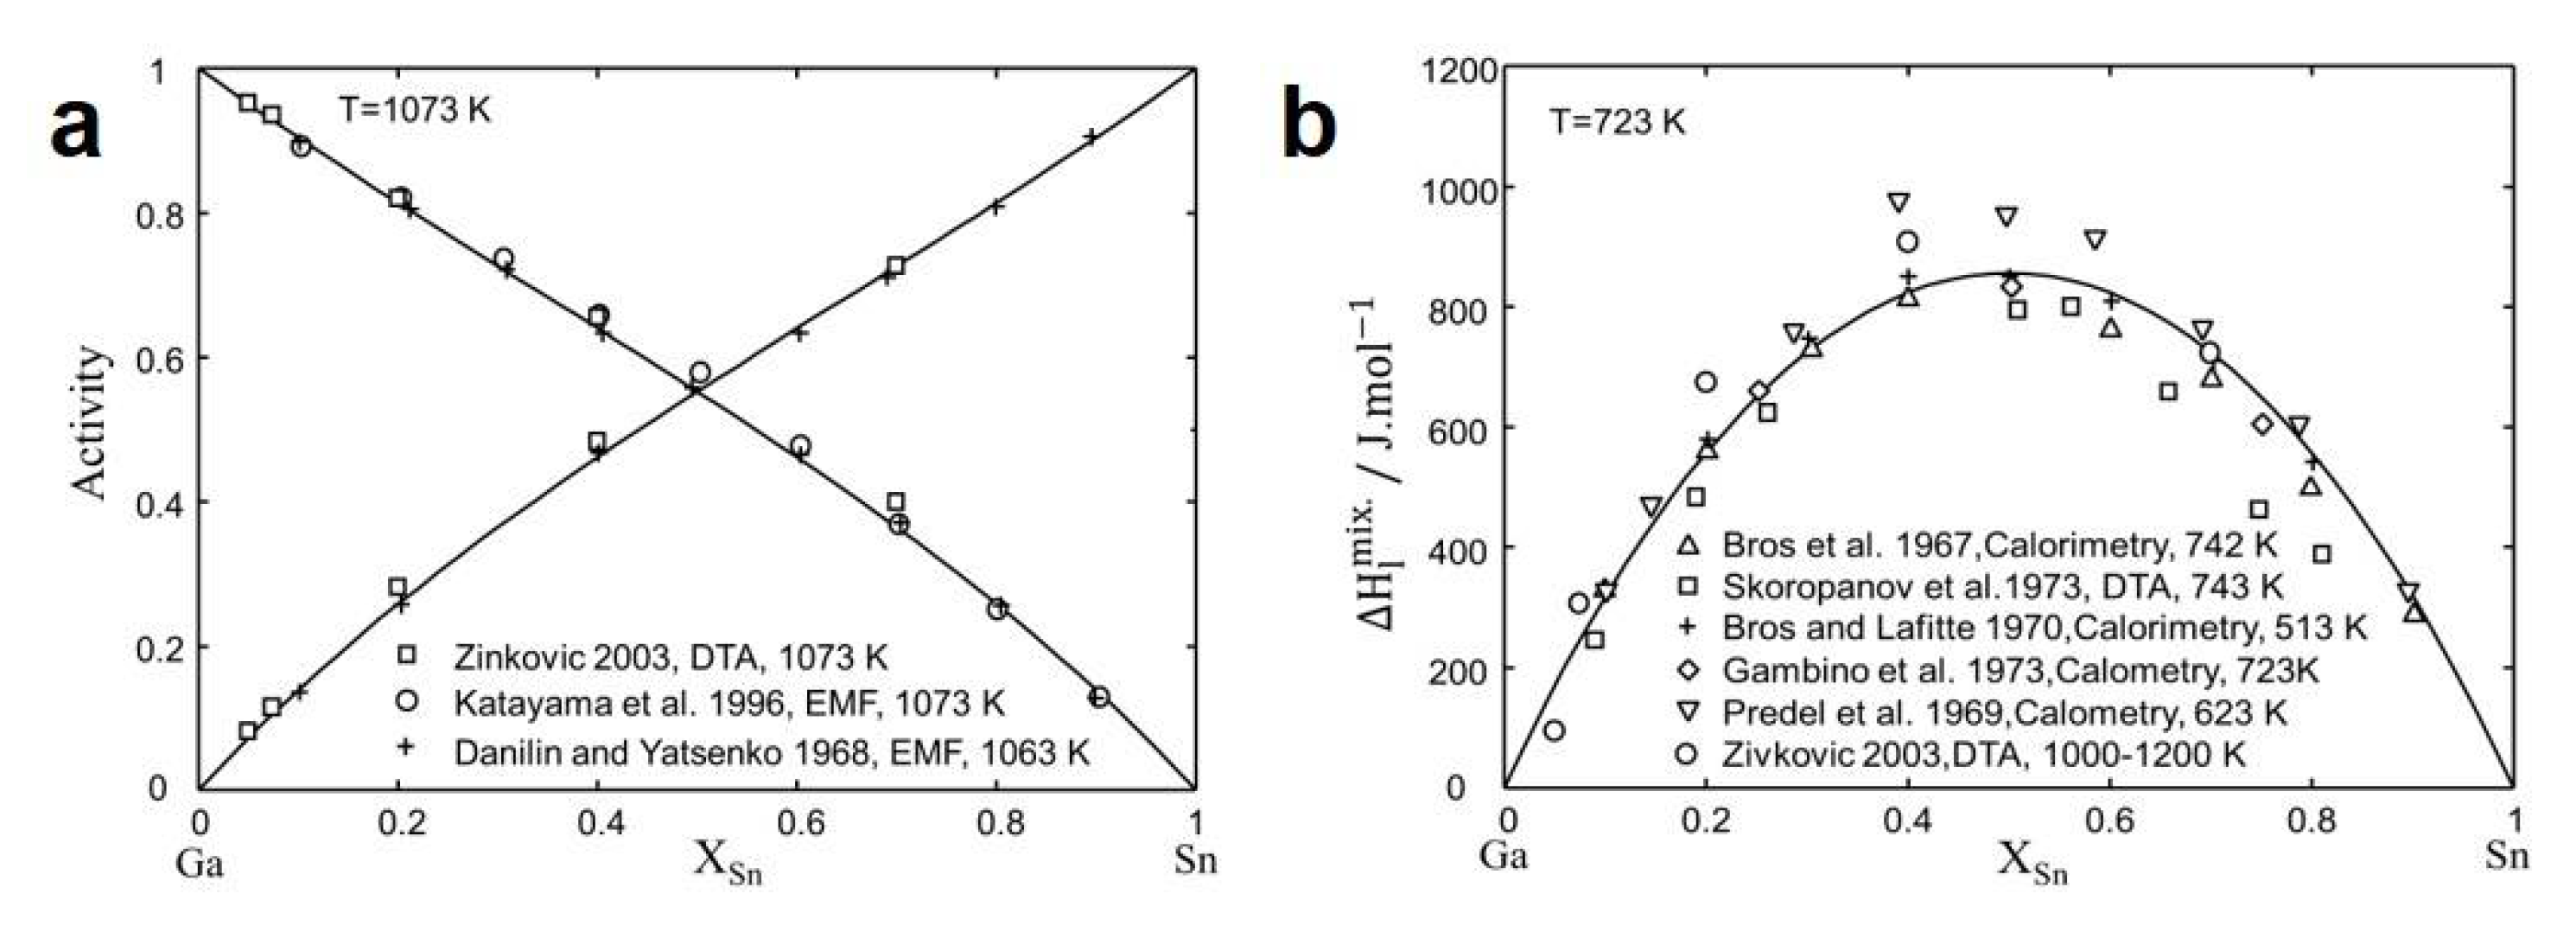
3.1. Ga-Sn Binary System

The Ga-Sn system has been thermodynamically assessed by Anderson and Ansara [35]. They proposed the Ga-Sn phase diagram based on the extensive review of the thermodynamic and phase diagram data. Recently, thermodynamic optimization of this system was done by Kulawik et al. [36]. They used a regular solution model with exponential model parameters for the liquid solution. Their proposed thermodynamic description can satisfactorily represent available thermodynamic and phase diagram data. However, to keep the consistency with other binaries, Ga-Sn liquid solution was optimized using MQM in this study. According to the previous optimization, the Ga-Sn is a simple binary eutectic system that includes three phases: Othorhombic_Ga, BCT_A5, and liquid. The liquidus line was determined by Delcroix et al. [37], Predel [38], and Puschin et al. [39] using thermal analysis and by Shurai et al. [40], Trebukhov et al. [41], and Zivkovic et al. [42] using differential thermal analysis (DTA). The solidus line in Sn rich side was determined by Predel [38] using X-ray and thermal analysis. By measuring electrical resistance, Audit et al. [43] and Bosio et al. [44] have reported extrapolated Sn solubility in Ga at the eutectic temperature 0.016 at. % Sn and 0.027 at. % Sn, respectively. This reported solubility of Sn in Ga is very small. Therefore, it has not been included in the present optimization. The BCT phase was described using one lattice regular solution model. No thermodynamic property was reported for the BCT solid solution. Therefore, model parameters were obtained to fix the solidus data reported by Predel [38]. The calculated phase diagram of the Ga-Sn system is shown in Figure 1 along with experimental data [37,38,39,40,41,42]. Using MQM, only one parameter was required to describe the thermodynamic properties of the liquid solution.
Danilin and Yatsenko [45] and Katayama et al. [46] determined activity in the liquid solution using the Electromotive Force (EMF) method at 1063 K and 1073 K, respectively. Zivkovic et al. [42] determined the activity in the liquid solution using DTA. Mixing enthalpy of liquid Ga-Sn alloy was measured by Bros et al. [47] at 742 K, Bros and Laffitte [48] at 513 K, Gambino et al. [49] at 723 K, and Predel et al. [50] at 623 K using calorimetry. Skoropanov et al. [51] and Zivkovic et al. [42] determined the mixing enthalpy of liquid using DTA at 743 K and 1000–1200 K, respectively. The calculated activity and mixing enthalpy of liquid solution are shown in Figure 2a,b, respectively. These calculated thermodynamic properties with a single positive parameter are in good agreement with the respective experimental data [42,45,46,47,48,49,50,51].

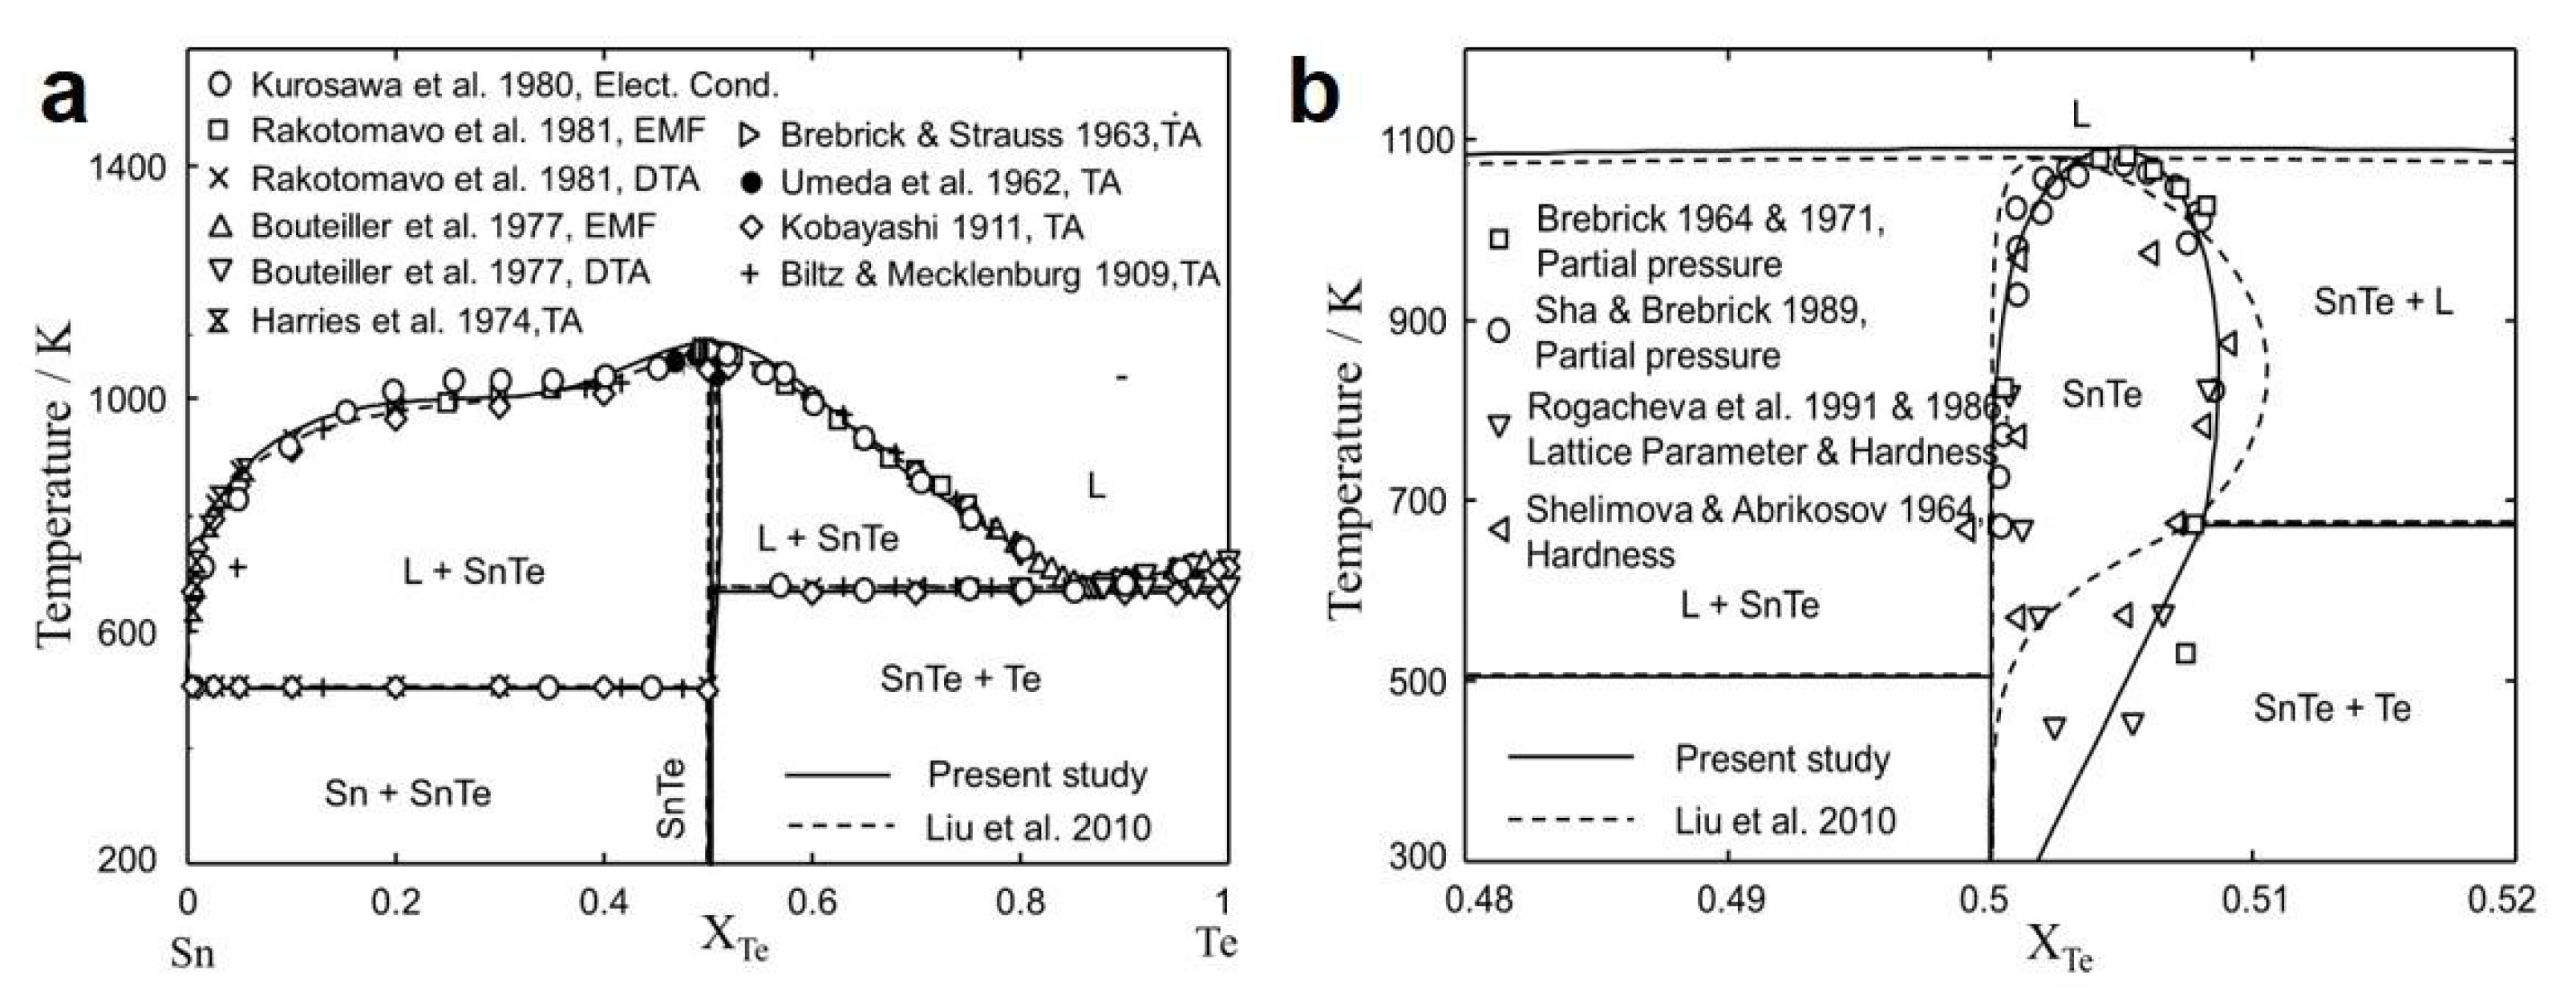
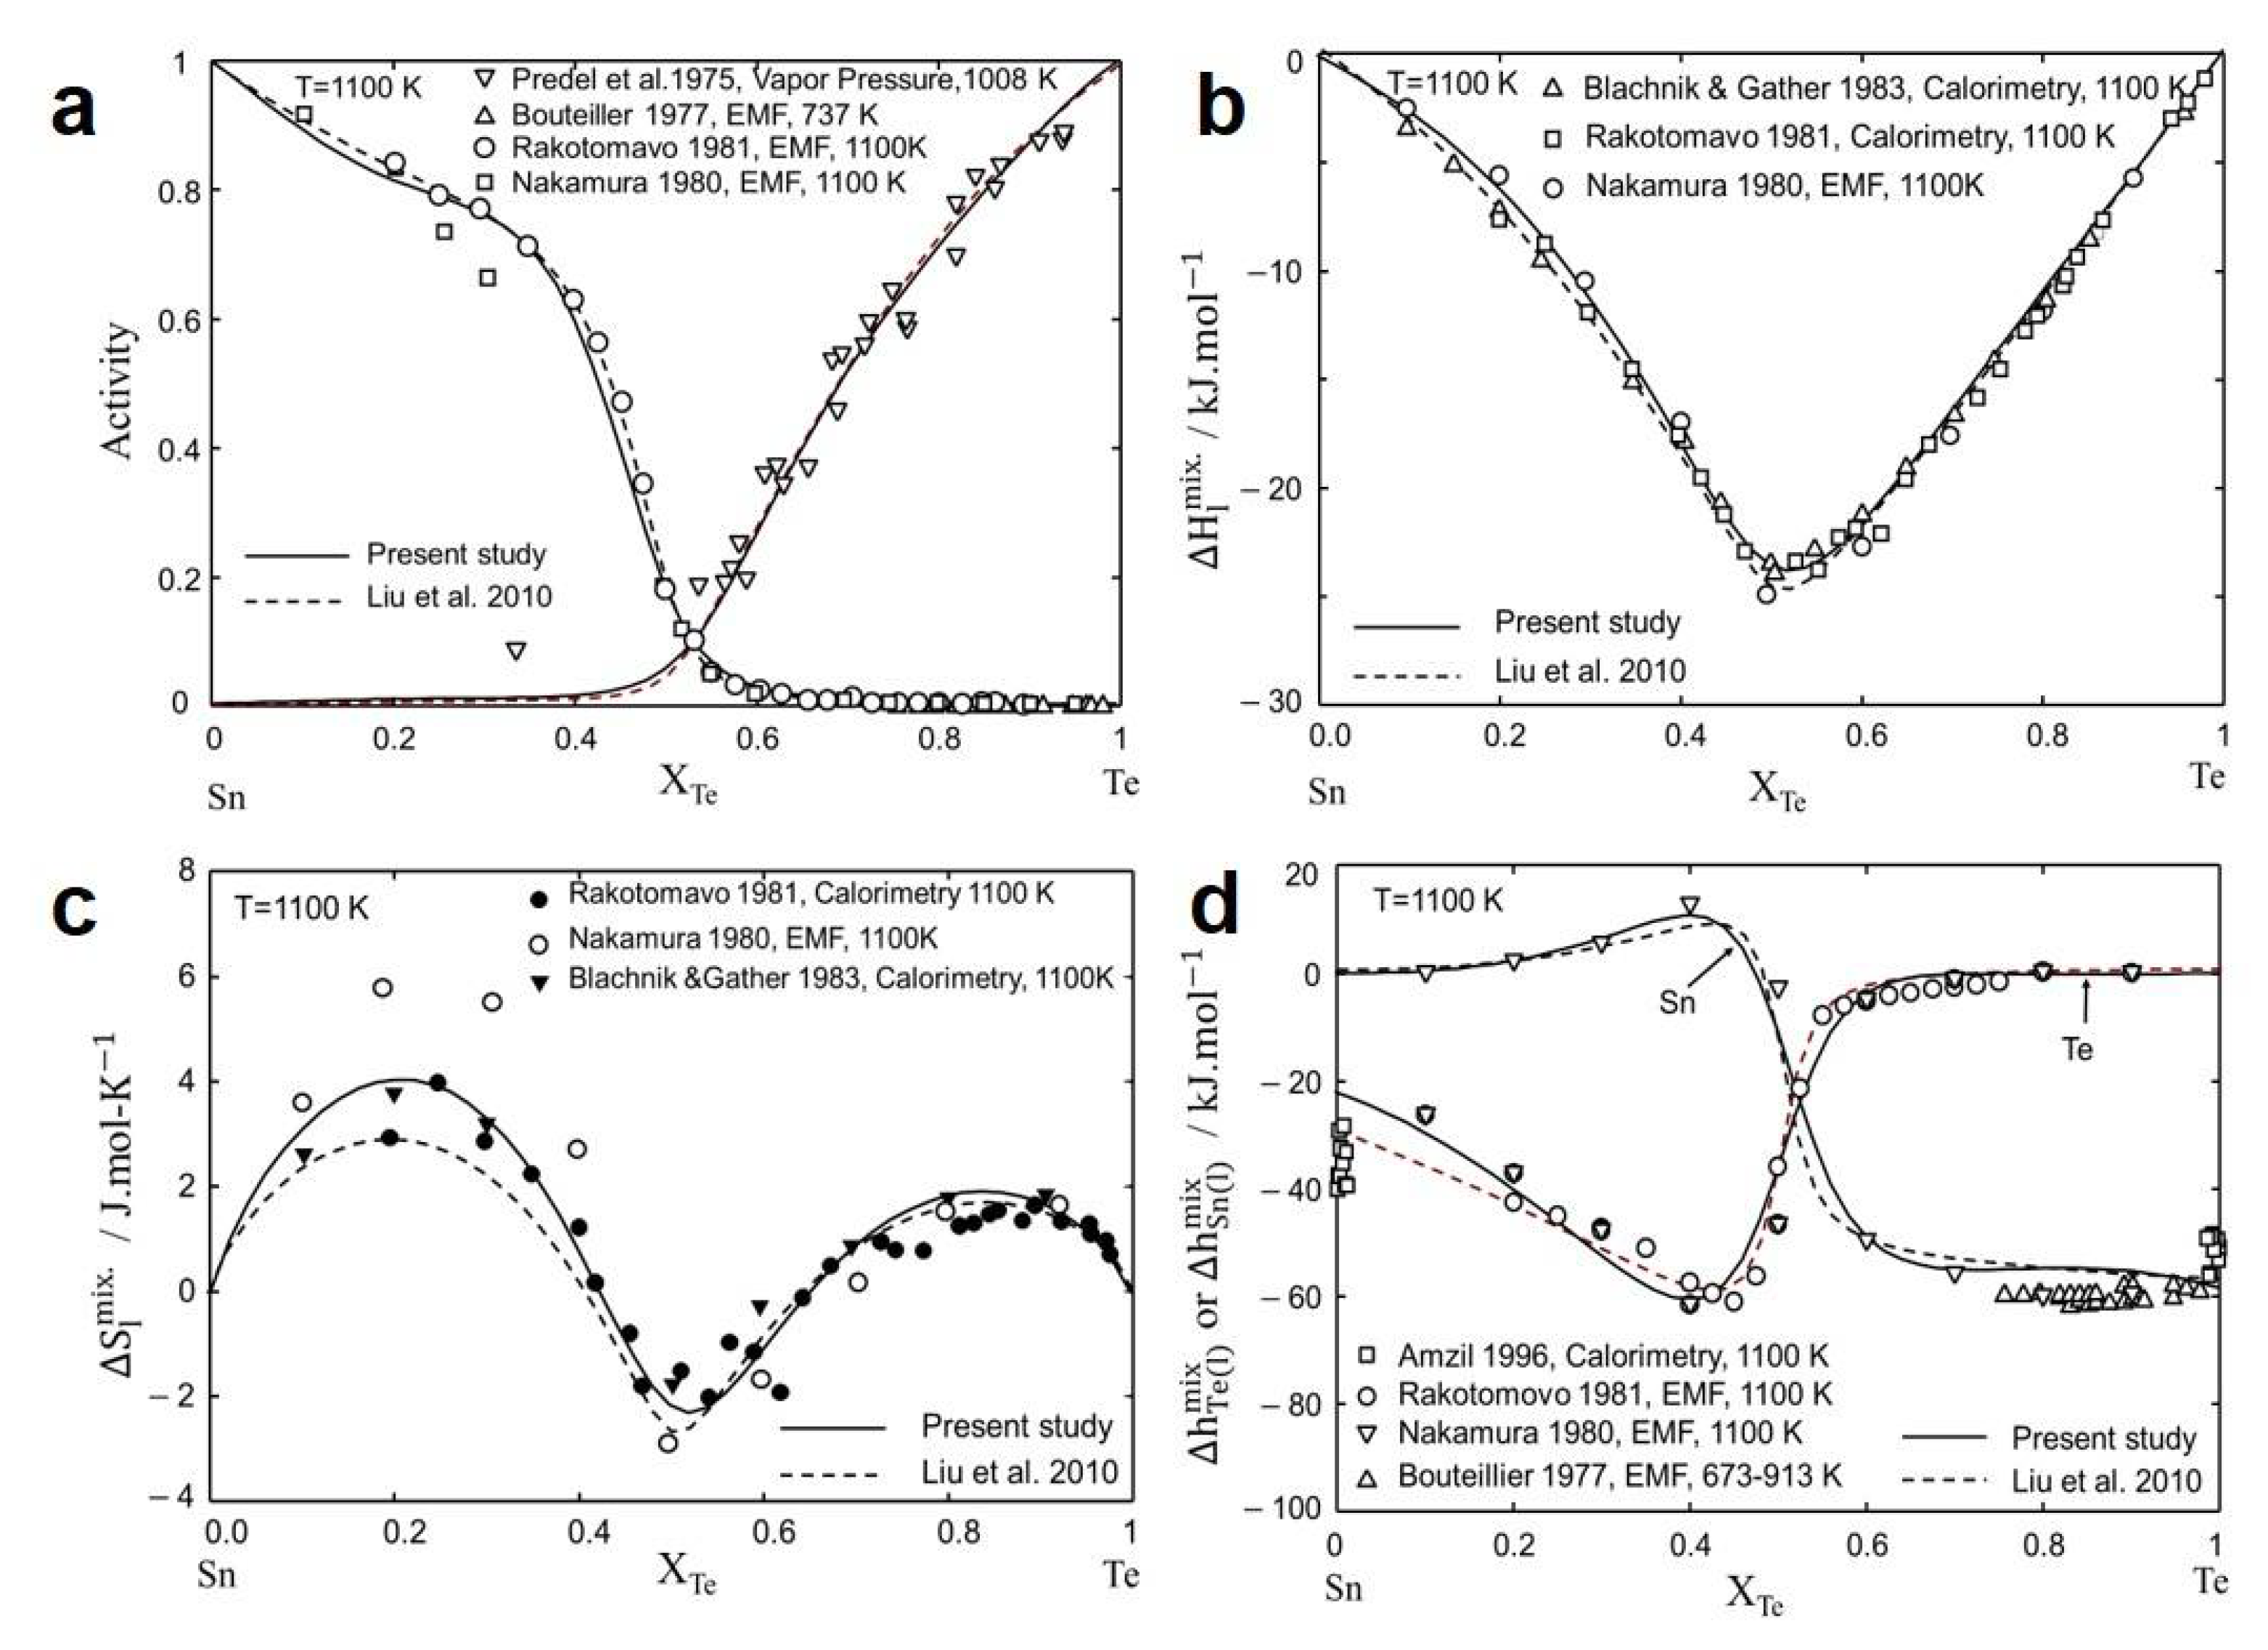
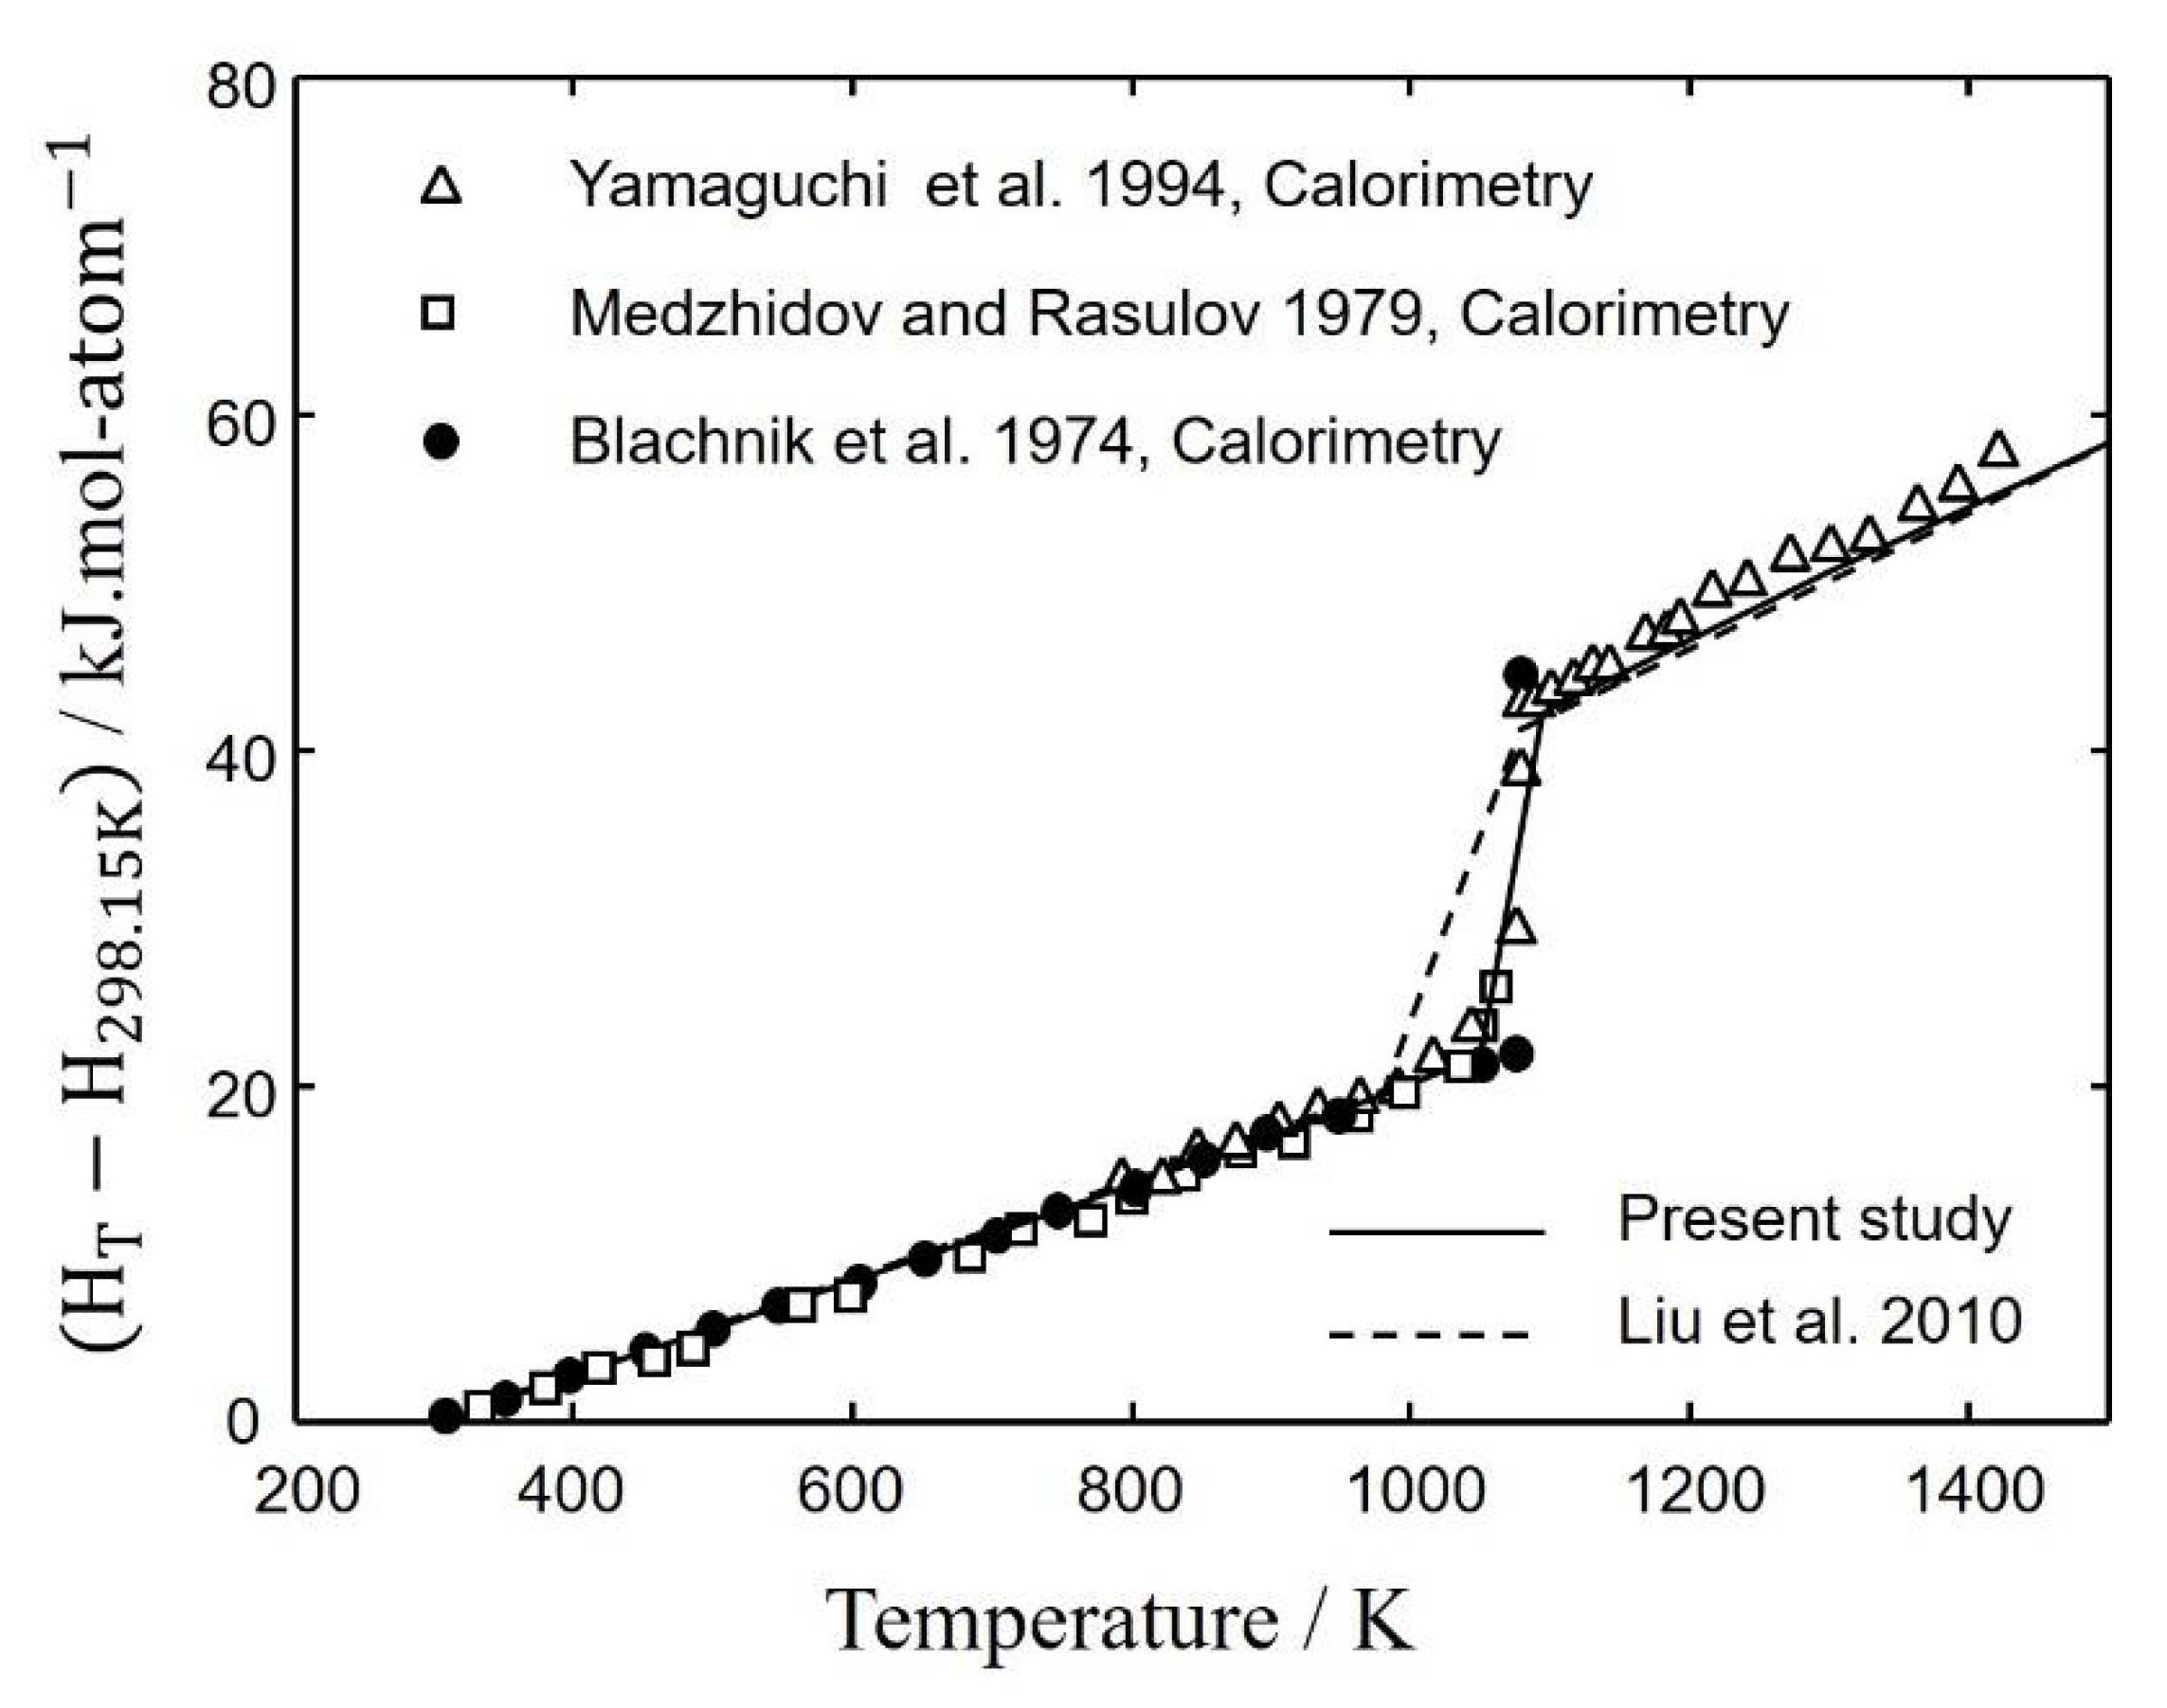
3.2. Sn-Te Binary System

The Sn-Te phase diagram consists of two eutectic reactions and one intermediate congruently melting phase, SnTe. This binary system has been thermodynamically assessed by various authors [52,53,54,55,56,57]. Hsieh et al. [52], Kattner et al. [53], Sharma and Chang [57], Kuznetsov [54], and Liu et al. [56] used an associate solution model with SnTe as an associate component, whereas Merzhanov et al. [55] used a formal mathematical model. All proposed thermodynamic descriptions can satisfactorily reproduce reported experimental thermodynamic and phase diagram data in this system. However, Hsieh et al. [52] and Kattner et al. [53] used old thermodynamic descriptions of the pure elements, and Kuznetsov [54] and Sharma and Chang [57] obtained model parameters that were not consistent with other CALPHAD type modeling. They have extensively reviewed the available thermodynamic data and those data were employed in the present study to determine the model parameters for this binary system. Biltz and Mecklenburg [58], Kobayashi [59], Umeda et al. [60], and Harries et al. [61] used thermal analysis to measure the liquidus temperature. Brebrick and Strauss [62] measured the partial pressure of Te2 over SnTe and determined the liquidus temperature near the SnTe region. Rakotomavo et al. [63] and Le Bouteiller et al. [64] determined the liquidus temperature using EMF measurements and DTA analysis. Rakotomavo et al. [63] reported Eutectic temperature 507±1 K on Sn rich side and 673 ± 1 K on Te rich side based upon DTA measurements. Le Bouteiller et al. [64] reported eutectic temperature 675 ± 2 K in Te rich side. Kurosawa et al. [65] measured the electrical conductivity of the liquid Sn-Te system to determine the liquidus. Brebrick [66,67] determined the homogeneity range of the intermetallic compound SnTe by measuring the partial pressure of Te2 over SnTe and lattice parameter measurements. Shelimova and Abrikosov [68], Sha and Brebrick [69], and Rogacheva et al. [70,71] determined the homogeneity range by hardness, partial pressure measurements, and lattice parameter as well as hardness measurements, respectively. The calculated phase diagram of the Sn-Te system is shown in Figure 3a along with experimental data [58,59,60,61,62,63,64,65] and the most recent optimization [56]. The calculated enlarged homogeneity range of the SnTe compound is shown in Figure 3b along with experimental data [66,67,68,69,70,71]. As seen in Figure 3b, compared to the previous calculation by Liu et al. [56], the calculated homogeneity range of the SnTe is in good agreement with the experimental data.
Le Bouteiller et al. [64], Rakotomavo et al. [63], and Nakamura et al. [72] have performed EMF measurements on galvanic cells to determine thermodynamic properties such as activity, partial enthalpy in liquid phase at 673–913 K, 673–1123 K, and at 1100 K, respectively. Predel et al. [73] determined the activity of Te (l) by partial pressure measurements. Partial enthalpy of Sn (l) and Te (l) at high dilution in liquid Sn-Te was measured by Amzil et al. [74] using reaction calorimetry. The mixing enthalpy and entropy of the liquid solution were measured using calorimetry by Blachnik and Gather [75] and Rakotomavo et al. [63], and EMF by Nakamura et al. [72]. The calculated activity of Sn (l) and Te (l), mixing enthalpy, mixing entropy, and partial enthalpy of Sn (l) and Te (l) in the liquid solution at 1100 K are shown in Figure 4a–d along with respective experimental data [63,64,72,73,74,75]. The calculated thermodynamic properties are in good agreement with the experimental data.
Formation enthalpy of SnTe at 298.15 K ( Δ H 298.15 K f ) was measured by Mcateer and Harry [76] using potentiometric analysis, by Robinson and Bever [77], Vecher et al. [78] and Misra [79] using calorimetry, and by Colin and Drowart [80] using Mass spectrometry. The Δ H 298.15 K f of SnTe are listed in Table 2. Blachnik et al. [81], Medzhidov and Rasulov [82], and Yamaguchi et al. [83] measured heat content (HT-H298.15K) using calorimetry. The calculated heat content (HT-H298.15K) is shown in Figure 5 along with experimental data [81,82,83]. Recently, Pashinkin et al. [84] measured the heat capacity of SnTe using calorimetry in the temperature range 350–600 K. They reported entropy of SnTe at 298.15 K (S298.15K) as 102 ± 4.2 J/mol-K, which is in good agreement with the present optimized value 100.37 J/mol-K.

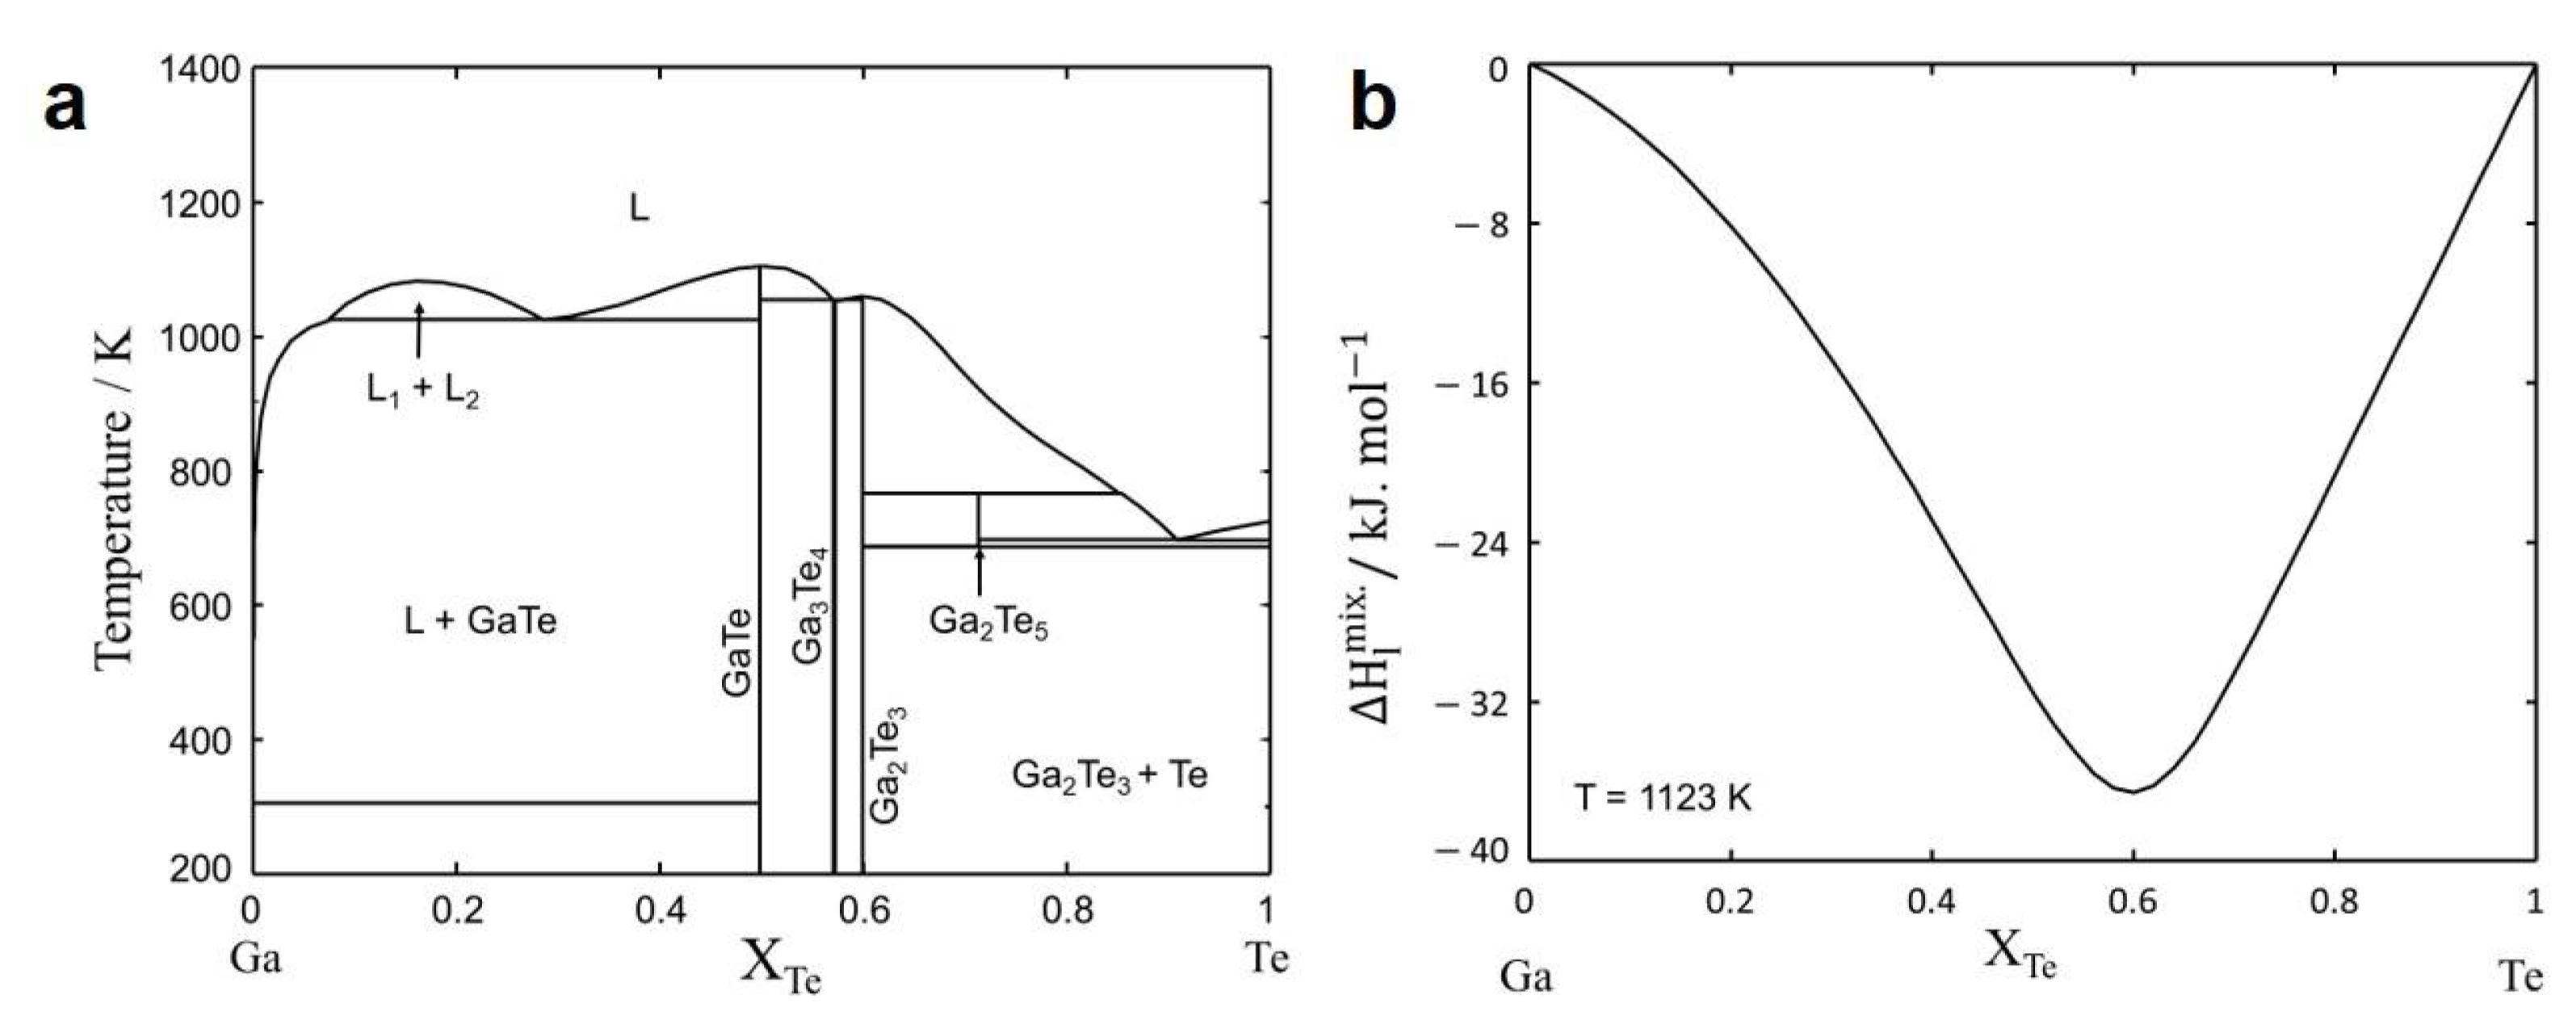
3.3. Ga-Te Binary System

The optimized result of the Ga-Te binary system by the authors’ recent study [29] was directly adopted in the present study. The optimized phase diagram and the integral enthalpy of mixing of liquid solution were shown in Figure 6a,b, respectively. The liquid immiscibility at the Ga-rich side and the asymmetric enthalpy curve were described well by using MQM with the modification of the coordination number ratio between Ga and Te as Z GaTe Ga / Z GaTe Te = 6 / 4 .

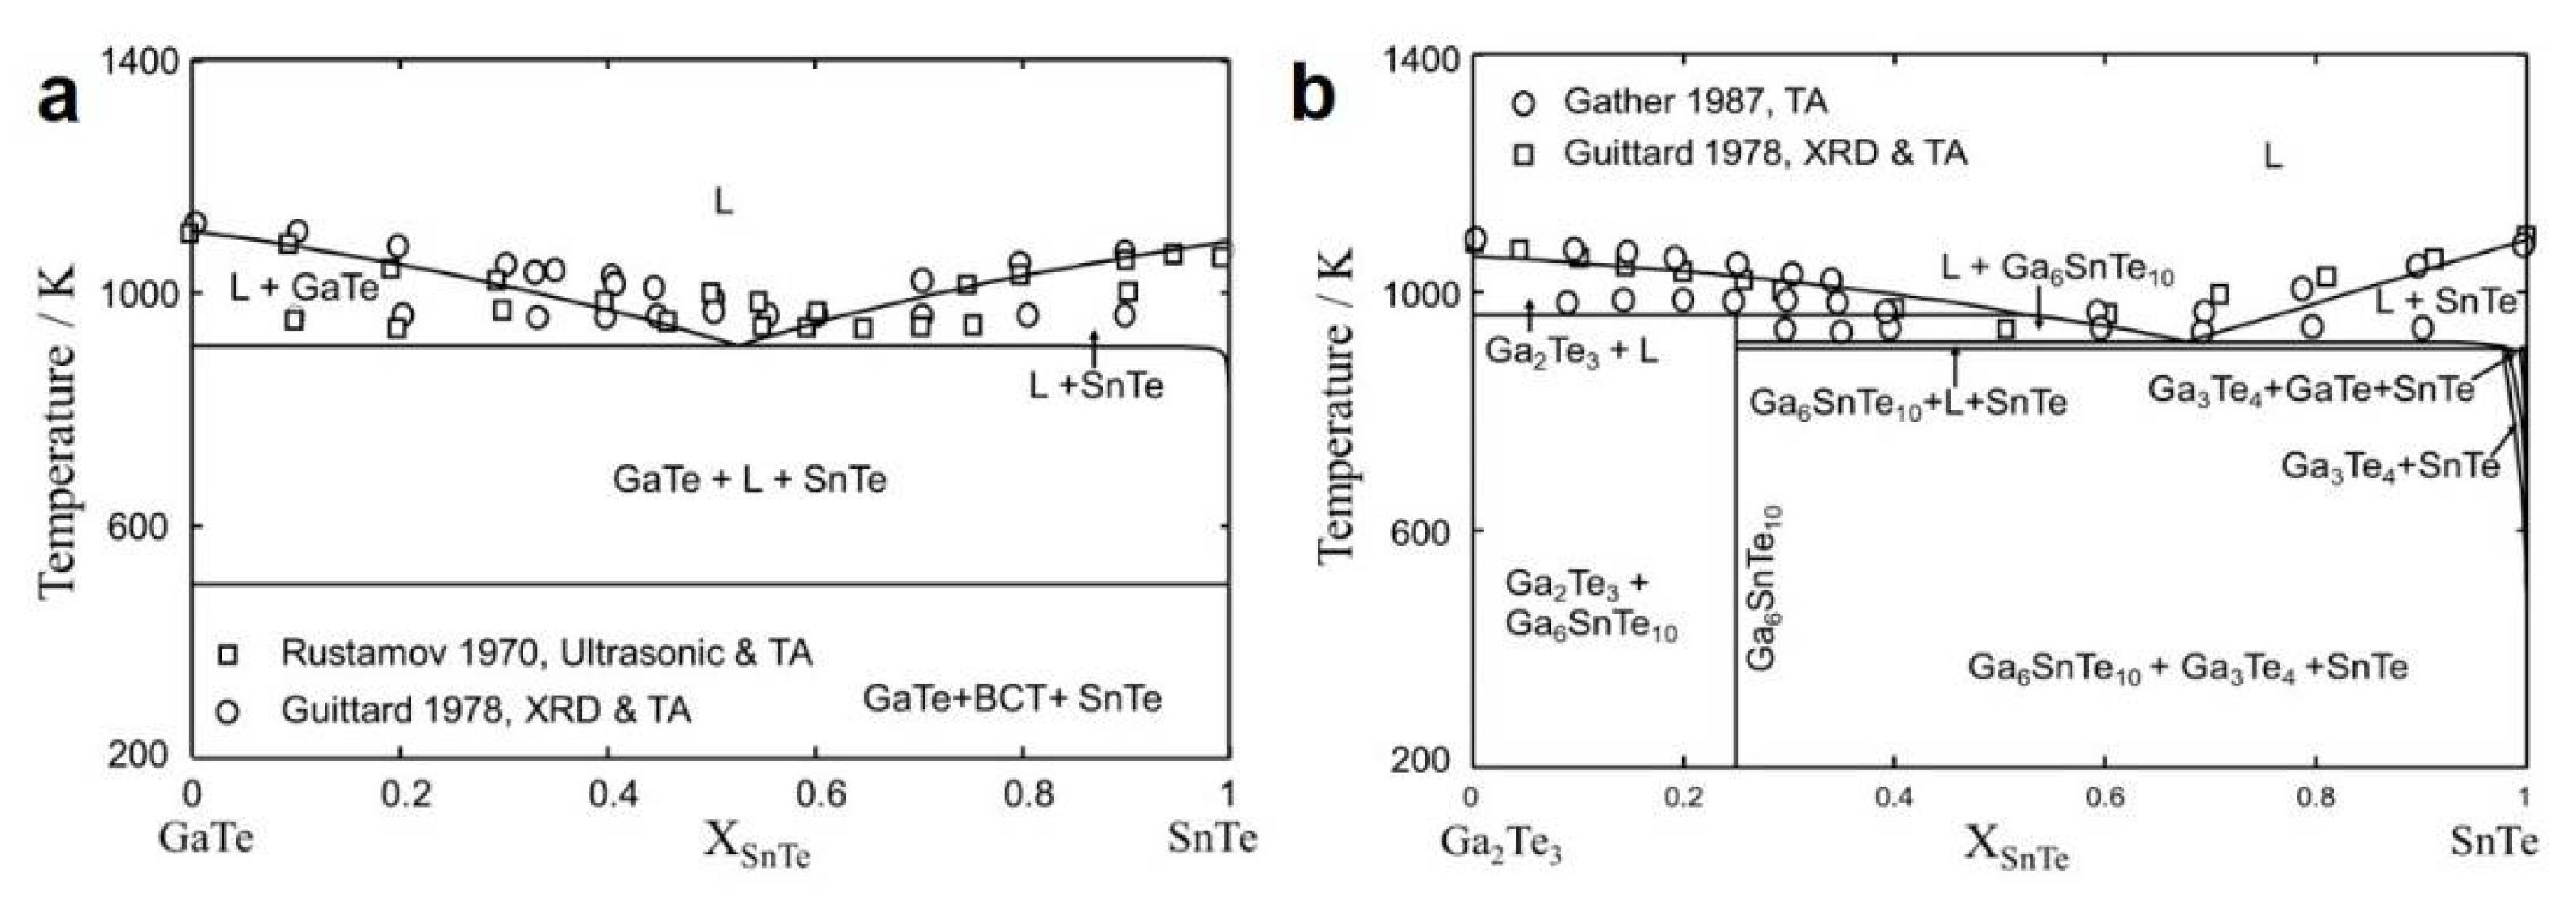
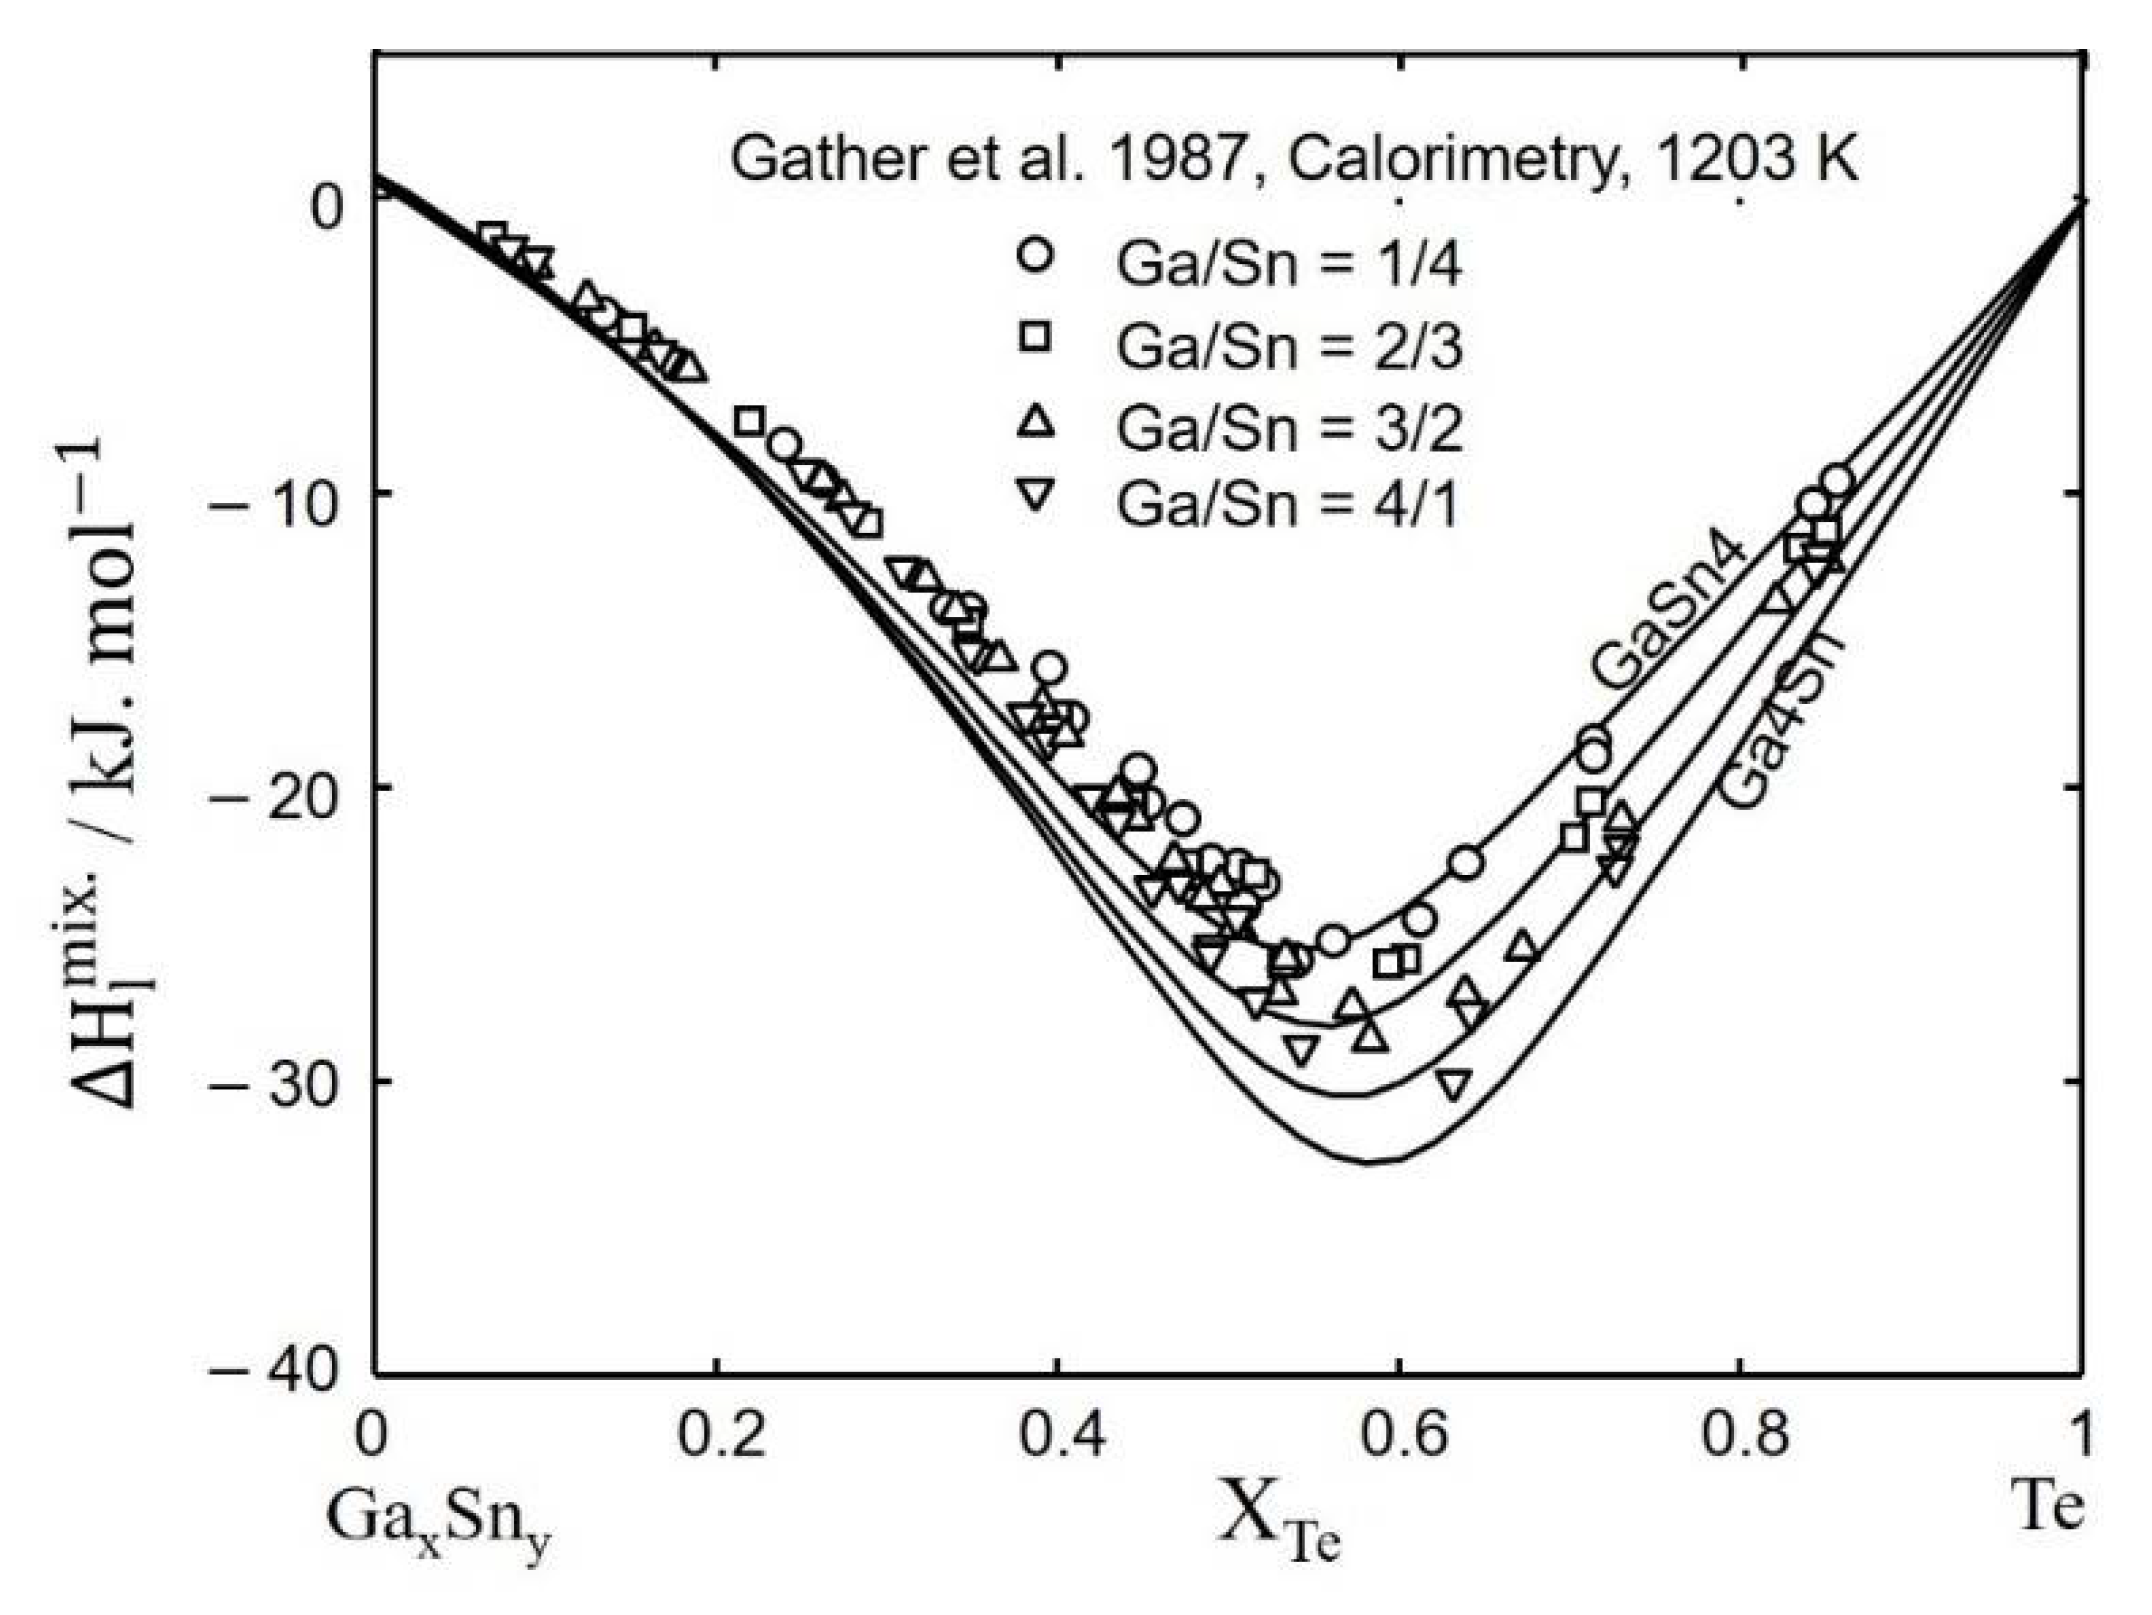
3.4. Ga-Sn-Te Ternary System

The description of the ternary Ga-Sn-Te is not known over the whole composition and temperature range. There are some investigations on vertical sections Ga2Te3-SnTe [85,86] and GaTe-SnTe [86,87]. The three ternary compounds, Ga2SnTe3, GaSnTe2 [87,88], and Ga6SnTe10 [85,86,89,90], have been reported in this system. Rustamov et al. [87] investigated the GaTe-SnTe system using the ultrasonic technique. They reported two ternary compounds, Ga2SnTe3 and GaSnTe2, corresponding to the peak in velocity-composition isotherm obtained from the ultrasonic technique. However, they confirmed only one compound (GaSnTe2) using thermographic and metallographic techniques, the detection of other peaks could be due to structural defects such as Sn vacancy. Guittard et al. [89] reported the ternary phase Ga6SnTe10 using XRD and thermal analysis for 15 days at 600 °C. They reported crystal structure of the ternary phase Ga6SnTe10 as rhombohedral (space group R32) and lattice parameters a = 10.207 Å, α = 87.74°. Dedegkaev et al. [85] studied the Ga2Te3-SnTe system using XRD and reported the ternary phase Ga6SnTe10 with a cubic primitive unit cell of lattice parameter 10.2 Å. Gather et al. [86] measured excess enthalpy using a heat flow calorimeter for the ternary liquid Ga-Sn-Te. Moreover, they have determined the Ga2Te3-SnTe and GaTe-SnTe quasi binary phase diagram and confirmed the existence of ternary phase Ga6SnTe10 using thermal analysis. The existence of ternary compounds Ga2SnTe3 and GaSnTe2 are still controversial [86]. Therefore, ternary compound Ga6SnTe10 was only considered in the present calculation. The Gibbs energy of the compound was estimated using the Neumann–Kopp rule with the slight modification of excess enthalpy term for best fitting the phase diagram in the quasi-binary Ga2Te3-SnTe. The liquidus line is measured by [87,89] for GaTe-SnTe and by [86,89] for Ga2Te3-SnTe.
As a first approximation of Gibbs free energy of the ternary liquid solution in the Ga-Sn-Te system, “Toop-like” asymmetric approximation [91] with Te as the asymmetric component was used. One adjustable ternary model parameter was added to avoid unexpected expansion of liquid miscibility gap toward the Sn-rich side. It was solved by increasing the stability of the ternary liquid solution with small negative parameter, g GaTe ( Sn ) 001 = −8900. The calculated vertical section GaTe-SnTe and Ga2Te3-SnTe are shown in Figure 7a,b along with experimental data [86,87,88,89], respectively. The predicted liquidus is in good agreement with the respective experimental data [86,87,88,89]. The calculated mixing enthalpy of liquid GaxSny-Te is shown in Figure 8 along with experimental data [86]. The enthalpy of mixing decreases with increasing Ga/Sn ratio due to the higher contribution of Ga-Te, which is more negative than liquid Sn-Te. The same tendency was observed in the experimental data measured at 1203 K with Ga/Sn ratio. The calculated liquidus projection over the entire composition range of the ternary system Ga-Sn-Te is shown in Figure 9. The black solid lines in the liquidus projection represent the univariant equilibria. The colored lines are isothermal lines calculated at the interval of 50 K. The different types of invariant reactions in this system are given in Table 3.

4. Application of the Database

Three vertical sections calculated using the present database in the Ga-Sn-Te system that have great potential as TE materials are shown in Figure 10a–c. The solid red circle in the figure indicates the prospective compositions of the potential eutectic alloys that may be investigated for TE application.

5. Conclusions

In this study, binary Sn-Te and Ga-Sn and ternary Ga-Sn-Te systems are thermodynamically assessed based on available experimental information using the CALPHAD method. The liquid solution in binary Sn-Te was reassessed by using the Modified Quasichemical Model (MQM) to account for the short-range ordering (SRO) exhibited by the liquid solution. To keep the consistency with other sub-binaries, the liquid Ga-Sn solution was optimized using MQM. The Gibbs free energy of thermoelectric compound, SnTe was optimized using Compound Energy Formalism to explain the high-temperature homogeneity range of the phase. BCT in the Ga-Sn binary system was optimized using a regular solution model. A set of self-consistent thermodynamic descriptions was obtained for all the phases in the binary system Ga-Sn, Sn-Te, and that of Ga-Te binary system was taken from our previous optimization. The available thermodynamic and phase diagram data were reproduced within the experimental error limits. Combining the optimized sub-binary systems, thermodynamic properties of the ternary Ga-Sn-Te system were predicted well with only one adjustable ternary model parameter. Several eutectic compositions were predicted, and these might be used for thermoelectric applications. Furthermore, the optimized database will be extended to a larger telluride-based system by adding elements such as In and Bi to explore the multiphase eutectic systems for thermoelectric (TE) applications.

Author Contributions

Conceptualization, C.S.T.; Investigation, B.K.; Methodology, M.-K.P.; Project administration, M.P.; Supervision, C.S.T.; Writing—original draft, B.K.; Writing—review & editing, M.P. and M.-K.P. All authors have read and agreed to the published version of the manuscript.

Funding

This research received no external funding.

Data Availability Statement

Not applicable.

Acknowledgments

This research was partly supported by the Korea Institute of Energy Technology Evaluation and Planning (KETEP, Grant Number 20217510100080) granted resource from the Ministry of Trade, Industry & Energy (MOTIE), Korea.

Conflicts of Interest

The authors declare no conflict of interest.

References

  1. Snyder, G.J.; Toberer, E.S. Complex thermoelectric materials. Nat. Mater. 2008, 7, 105–114. [Google Scholar] [CrossRef] [PubMed]
  2. Bell, L.E. Cooling, heating, generating power, and recovering waste heat with thermoelectric systems. Science 2008, 321, 1457–1461. [Google Scholar] [CrossRef] [PubMed] [Green Version]
  3. Uchida, K.; Takahashi, S.; Harii, K.; Ieda, J.; Koshibae, W.; Ando, K.; Maekawa, S.; Saitoh, E. Observation of the spin Seebeck effect. Nature 2008, 455, 778–781. [Google Scholar] [CrossRef] [PubMed]
  4. Cutler, M.; Leavy, J.F.; Fitzpatrick, R.L. Electronic transport in semimetallic cerium sulfide. Phys. Rev. 1964, 133, A1143. [Google Scholar] [CrossRef]
  5. Hasan, M.N.; Wahid, H.; Nayan, N.; Mohamed Ali, M.S. Inorganic thermoelectric materials: A review. Int. J. Energy Res. 2020, 44, 6170–6222. [Google Scholar] [CrossRef]
  6. Harman, T.C.; Walsh, M.P.; Laforge, B.E.; Turner, G.W. Nanostructured thermoelectric materials. J. Electron. Mater. 2005, 34, L19–L22. [Google Scholar] [CrossRef]
  7. Ikeda, T.; Toberer, E.S.; Ravi, V.A.; Haile, S.M.; Jeffrey Snyder, G. Lattice thermal conductivity of self-assembled PbTe-Sb2Te 3 composites with nanometer lamellae. In Proceedings of the 2007 26th International Conference on Thermoelectrics, Jeju, Korea, 3–7 June 2007; pp. 1–4. [Google Scholar]
  8. Wu, H.J.; Foo, W.J.; Chen, S.W.; Jeffrey Snyder, G. Ternary eutectic growth of nanostructured thermoelectric Ag-Pb-Te materials. Appl. Phys. Lett. 2012, 101, 023107. [Google Scholar] [CrossRef] [Green Version]
  9. Dadda, J.; Müller, E.; Perlt, S.; Höche, T.; Hermann, R.; Neubrand, A. Evolution of phase segregation and eutectic structures in AgPb18SbTe20. Phys. Status Solidi 2014, 211, 1276–1281. [Google Scholar] [CrossRef]
  10. Yim, J.-H.; Jung, K.; Kim, H.-J.; Park, H.-H.; Park, C.; Kim, J.-S. Effect of composition on thermoelectric properties in PbTe-Bi2Te3 composites. J. Electron. Mater. 2011, 40, 1010–1014. [Google Scholar] [CrossRef]
  11. Li, J.Q.; Li, L.F.; Song, S.H.; Liu, F.S.; Ao, W.Q. High thermoelectric performance of GeTe-Ag8GeTe6 eutectic composites. J. Alloys Compd. 2013, 565, 144–147. [Google Scholar] [CrossRef]
  12. Sootsman, J.R.; He, J.; Dravid, V.P.; Ballikaya, S.; Vermeulen, D.; Uher, C.; Kanatzidis, M.G. Microstructure and thermoelectric properties of mechanically robust PbTe-Si eutectic composites. Chem. Mater. 2010, 22, 869–875. [Google Scholar] [CrossRef]
  13. Cheng, Y.; Yang, J.; Jiang, Q.; He, D.; He, J.; Luo, Y.; Zhang, D.; Zhou, Z.; Ren, Y.; Xin, J. New insight into InSb-based thermoelectric materials: From a divorced eutectic design to a remarkably high thermoelectric performance. J. Mater. Chem. A 2017, 5, 5163–5170. [Google Scholar] [CrossRef]
  14. Femi, O.E.; Akkiraju, K.; Murthy, B.S.; Ravishankar, N.; Chattopadhyay, K. Effect of processing route on the bipolar contribution to the thermoelectric properties of n-type eutectic Bi22.5Sb7.5Te70 alloy. J. Alloys Compd. 2016, 682, 791–798. [Google Scholar] [CrossRef]
  15. Yang, B.; Li, S.; Li, X.; Wang, Y.; Zhong, H.; Feng, S. Microstructure and enhanced thermoelectric performance of Te–SnTe eutectic composites with self-assembled rod and lamellar morphology. Intermetallics 2019, 112, 106499. [Google Scholar] [CrossRef]
  16. Liu, D.; Dreβler, C.; Seyring, M.; Teichert, S.; Rettenmayr, M. Reduced thermal conductivity of Bi-In-Te thermoelectric alloys in a eutectic lamellar structure. J. Alloys Compd. 2018, 748, 730–736. [Google Scholar] [CrossRef]
  17. Durman, M.; Murphy, S. Precipitation of metastable ϵ-phase in a hypereutectic zinc-aluminium alloy containing copper. Acta Metall. Mater. 1991, 39, 2235–2242. [Google Scholar] [CrossRef]
  18. Spinelli, J.E.; Silva, B.L.; Garcia, A. Microstructure, phases morphologies and hardness of a Bi-Ag eutectic alloy for high temperature soldering applications. Mater. Des. 2014, 58, 482–490. [Google Scholar] [CrossRef]
  19. Wu, X.F.; Wang, K.Y.; Wu, F.F.; Zhao, R.D.; Chen, M.H.; Xiang, J.; Ma, S.N.; Zhang, Y. Simultaneous grain refinement and eutectic Mg2Si modification in hypoeutectic Al-11Mg2Si alloys by Sc addition. J. Alloys Compd. 2019, 791, 402–410. [Google Scholar] [CrossRef]
  20. Blanco-Rodríguez, P.; Rodríguez-Aseguinolaza, J.; Risueño, E.; Tello, M. Thermophysical characterization of Mg-51%Zn eutectic metal alloy: A phase change material for thermal energy storage in direct steam generation applications. Energy 2014, 72, 414–420. [Google Scholar] [CrossRef]
  21. Li, S.L.; Song, J.M.; Uan, J.Y. Mg-Mg2X (X=Cu, Sn) eutectic alloy for the Mg2X nano-lamellar compounds to catalyze hydrolysis reaction for H2 generation and the recycling of pure X metals from the reaction wastes. J. Alloys Compd. 2019, 772, 489–498. [Google Scholar] [CrossRef]
  22. Tan, G.; Hao, S.; Hanus, R.C.; Zhang, X.; Anand, S.; Bailey, T.P.; Rettie, A.J.E.; Su, X.; Uher, C.; Dravid, V.P.; et al. High thermoelectric performance in SnTe-AgSbTe2 alloys from lattice softening, giant phonon-vacancy scattering, and valence band convergence. ACS Energy Lett. 2018, 3, 705–712. [Google Scholar] [CrossRef]
  23. Zhang, Q.; Liao, B.; Lan, Y.; Lukas, K.; Liu, W.; Esfarjani, K.; Opeil, C.; Broido, D.; Chen, G.; Ren, Z. High thermoelectric performance by resonant dopant indium in nanostructured SnTe. Proc. Natl. Acad. Sci. USA 2013, 110, 13261–13266. [Google Scholar] [CrossRef] [Green Version]
  24. Moshwan, R.; Yang, L.; Zou, J.; Chen, Z.-G. Eco-Friendly SnTe thermoelectric materials: Progress and future challenges. Adv. Funct. Mater. 2017, 27, 1703278. [Google Scholar] [CrossRef]
  25. Li, S.; Li, X.; Ren, Z.; Zhang, Q. Recent progress towards high performance of tin chalcogenide thermoelectric materials. J. Mater. Chem. A 2018, 6, 2432–2448. [Google Scholar] [CrossRef]
  26. Al Rahal Al Orabi, R.; Hwang, J.; Lin, C.C.; Gautier, R.; Fontaine, B.; Kim, W.; Rhyee, J.S.; Wee, D.; Fornari, M. Ultralow lattice thermal conductivity and enhanced thermoelectric performance in SnTe:Ga materials. Chem. Mater. 2017, 29, 612–620. [Google Scholar] [CrossRef]
  27. Pelton, A.D.; Degterov, S.A.; Eriksson, G.; Robelin, C.; Dessureault, Y. The modified quasichemical model I—Binary solutions. Metall. Mater. Trans. B 2000, 31, 651–659. [Google Scholar] [CrossRef]
  28. Pelton, A.D.; Chartrand, P. The modified quasi-chemical model: Part II. multicomponent solutions. Met. Mater. Trans. A 2001, 32, 1355–1360. [Google Scholar] [CrossRef]
  29. Kumar, B.; Paek, M.-K.; Tiwary, C.S.; Paliwal, M. Thermodynamic modeling of the ternary Bi-Ga-Te system for potential application in thermoelectric materials. Calphad 2021, 74, 102326. [Google Scholar] [CrossRef]
  30. Bale, C.W.; Chartrand, P.; Degterov, S.A.; Eriksson, G.; Hack, K.; Mahfoud, R.B.; Petersen, S. FactSage: Thermochemical software and databases. Calphad 2002, 26, 189–228. [Google Scholar] [CrossRef]
  31. Bale, C.W.; Bélisle, E.; Chartrand, P.; Decterov, S.A.; Eriksson, G.; Hack, K.; Jung, I.H.; Kang, Y.B.; Melançon, J.; Pelton, A.D.; et al. FactSage thermochemical software and databases-recent developments. Calphad 2009, 33, 295–311. [Google Scholar] [CrossRef]
  32. Dinsdale, A.T. SGTE data for pure elements. Calphad 1991, 15, 317–425. [Google Scholar] [CrossRef]
  33. Kopp, H. Investigations of the specific heat of solid bodies. Philos. Trans. R. Soc. Lond. 1865, 155, 71–202. [Google Scholar] [CrossRef] [Green Version]
  34. Hillert, M. The compound energy formalism. J. Alloys Compd. 2001, 320, 161–176. [Google Scholar] [CrossRef]
  35. Anderson, T.J.; Ansara, I. The Ga-Sn (Gallium-Tin) System. J. Phase Equilibria 1992, 13, 181–189. [Google Scholar] [CrossRef]
  36. Kulawik, S.; Gierlotka, W.; Dębski, A.; Gąsior, W.; Zajączkowski, A. Thermodynamic assessment of the Ga-Sn-Zn system. Calphad 2020, 69, 101765. [Google Scholar] [CrossRef]
  37. Delcroix, S.; Defrain, A.; Epelboin, I. Sur les diagrammes d’alliages du gallium I ou II avec l’étain, le zinc ou l’indium. J. Phys. Radium 1963, 24, 17–20. [Google Scholar] [CrossRef] [Green Version]
  38. Predel, B. Zustandsdiagramm und eigenschaften von Gallium-Zinn-Legierungen. J. Less-Common Met. 1964, 7, 347–355. [Google Scholar] [CrossRef]
  39. Pushin, N.; Stepanovic, S.; Stajic, V. Über die Legierungen des Galliums mit Zink, Cadmium, Quecksilber, Zinn, Blei, Wismut und Aluminium. Z. Anorg. Chem. 1932, 209, 329–334. [Google Scholar] [CrossRef]
  40. Shurai, P.; Danilin, V.; Sryvalin, I.T. A quanti-tative thermographic study of the phase diagram for the gallium-indium-tin system. Zh. Fiz. Khim. 1974, 48, 1325. [Google Scholar]
  41. Trebukhov, A.; Sarmurzina, R.G.; Sokol’skii, D.V. Study of the physico-chemical properties of the gallium-tin system. Zh. Fiz. Khim. 1985, 59, 2065–2067. [Google Scholar]
  42. Živković, D.; Manasijević, D.; Živković, Z. Thermodynamic study of Ga-Sn and Ga-Zn systems using quantitative differential thermal analysis. J. Therm. Anal. Calorim. 2003, 74, 85–96. [Google Scholar] [CrossRef]
  43. Audit, P.; Epelboin, I.; Erny, M. Determination of the solubility of tin in gallium by measurement of the electrical resistance. Mém. Sci. Rev. Métall. 1962, 59, 233–239. [Google Scholar]
  44. Bosio, L.; Defrain, A.; Erny, M.; Lignel, S.; Epelboin, I. Influence of Impurities on supercooling, solidification and melting of Ga. Mdm. Sci. Rev. Mdtall. 1961, 58, 43–51. [Google Scholar]
  45. Danilin, V.; Yatsenko, S. Use of the EMF Method to improve the accuracy of the Ga-Sn phase diagram. Russ. Met. 1968, 5, 137–139. [Google Scholar]
  46. Katayama, I.; Maki, K.; Nakano, M.; Iida, T. Thermodynamic activity in liquid Ga-Sn alloys studied by EMF method. Mater. Trans. JIM 1996, 37, 988–990. [Google Scholar] [CrossRef] [Green Version]
  47. Bros, J.; Castanet, R.; Laffitte, M. Enthalpy of mixing of liquid gallium-indium and gallium-tin alloys at 469 °C. CR Acad. Sci. 1967, 264, 1804–1806. [Google Scholar]
  48. Bros, J.; Laffitte, M. Thermodynamic study of gallium-tin alloys. J. Chim. Phys. 1970, 67, 1636–1642. [Google Scholar] [CrossRef]
  49. Gambino, M.; Bros, J.P.; Ajersch, F.; Ansara, I. Contribution à l’étude thermodynamique du système bismuth-gallium. Thermochim. Acta 1976, 14, 305–313. [Google Scholar] [CrossRef]
  50. Predel, B.; Frebel, M.; Gust, W. Untersuchung der thermodynamisches eigenschaften flussiger gallium-zinn und gallium-wismut-legierungen. J. Less Common Met. 1969, 17, 391–402. [Google Scholar] [CrossRef]
  51. Skoropanov, A.S.; Mechkovskii, L.A.; Zakharov, D.M.; Vecher, A.A. Measurement of the enthalpy of mixing in the gallium-indium--tin system by quantitative differential thermal analysis. Russ. J. Phys. Chem. (Engl. Transl.) 1973, 47, 426–427. [Google Scholar]
  52. Hsieh, K.C.; Wei, M.S.; Chang, Y.A. Thermodynamic analysis of the tin-tellurium system and calculation of the phase diagram. Z. Met. 1983, 74, 330–337. [Google Scholar]
  53. Kattner, U.; Lukas, H.L.; Petzow, G. Optimization and calculation of the Sn-Te system. J. Less-Common Met. 1985, 114, 129–144. [Google Scholar] [CrossRef]
  54. Kuznetsov, V.L. System Sn-Te: Critical evaluation and optimization of data on the thermodynamic properties and phase diagram. Inorg. Mater. 1996, 32, 231–242. [Google Scholar]
  55. Merzhanov, I.; Goryacheva, V.I.; Gejderikh, V.A. Optimization of data on thermodynamic properties and phase diagram for the tin-telluium system. Vestn. Mosk. Univ. Seriya 2 Khimiya 1988, 29, 471–474. [Google Scholar]
  56. Liu, Y.; Liang, D.; Zhang, L. Thermodynamic descriptions for the Sn-Te and Pb-Sn-Te systems. J. Electron. Mater. 2010, 39, 246–257. [Google Scholar] [CrossRef]
  57. Sharma, R.C.; Chang, Y.A. The Sn-Te (Tin-Tellurium) system. Bull. Alloy Phase Diagr. 1986, 7, 72–80. [Google Scholar] [CrossRef]
  58. Biltz, W.; Mecklenburg, W. Über die Zustandsdiagramme von Zinn mit Schwefel, Selen und Tellur. Z. Anorg. Chem. 1909, 64, 226–235. [Google Scholar] [CrossRef]
  59. Kobayashi, M. Über die Legierungen des Tellurs mit Cadmium und Zinn. Z. Anorg. Chem. 1911, 69, 1–9. [Google Scholar] [CrossRef]
  60. Umeda, J.; Jeong, M.; Okada, T. Tin-Tellurium phase diagram in the vicinity of stannous telluride SnTe. Jpn. J. Appl. Phys. 1962, 1, 277–282. [Google Scholar] [CrossRef]
  61. Harris, J.S.; Gertner, E.R.; Clarke, J.E. The PbSn-Te phase diagram and its application to the liquid phase epitaxial growth of Pb1-xSnxTe. J. Cryst. Growth 1975, 28, 334–342. [Google Scholar] [CrossRef]
  62. Brebrick, R.F.; Strauss, A.J. Partial pressures in equilibrium with group IV tellurides. II. tin telluride. J. Chem. Phys. 1964, 197–205. [Google Scholar] [CrossRef]
  63. Rakotomavo, J.; Baron, M.C.; Petot, C. Thermodynamic properties of liquid tin-tellurium alloys at high temperature. Metall. Trans. B 1981, 12, 461–467. [Google Scholar] [CrossRef]
  64. Bouteiller, M.L.; Martre, A.M.; Farhi, R.; Petot, C. Thermodynamic measurements in liquid tin-tellurium alloys. Metall. Trans. B 1977, 8B, 339–343. [Google Scholar] [CrossRef]
  65. Kurosawa, S.; Nakamura, Y.; Shimoji, M. The electrical conductivity and the phase diagram of the molten tin-tellurium system. J. Less-Common Met. 1980, 70, 119–121. [Google Scholar] [CrossRef]
  66. Brebrick, R.F. Deviations from stoichiometry and electrical properties in SnTe. J. Phys. Chem. Solids 1963, 24, 27–36. [Google Scholar] [CrossRef]
  67. Brebrick, R.F. Composition stability limits rocksalt-structure from lattice parameter. J. Phys. Chem. Solids 1971, 32, 551–562. [Google Scholar] [CrossRef]
  68. Shelimova, L.E.; Abrikosov, N.K. The Sn−Te system in the region of the compound SnTe. Russ. J. Inorg. Chem. 1964, 9, 1017–1020. [Google Scholar]
  69. Sha, Y.G.; Brebrick, R.F. Explicit incorporation of the energy-band structure into an analysis of the defect chemistry of PbTe and SnTe. J. Electron. Mater. 1989, 18, 421–443. [Google Scholar] [CrossRef]
  70. Rogacheva, E.; Dzyubenko, N.I. Solubility of impurities in nonstoichiometric SnTe. Izv. Akad. Nauk SSSR Neorg. Mater. 1986, 22, 760–761. [Google Scholar]
  71. Rogacheva, E.I.; Gorne, G.V.; Zhigareva, N.K.; Ivanova, A.B. Homogeneity region of tin monotelluride. Izv. Akad. Nauk SSSR, Neorg. Mater. 1991, 27, 267–270. [Google Scholar]
  72. Nakamura, Y.; Himuro, S.; Shimoji, M. Thermodynamic study on compound-forming molten alloys: The tin-tellurium system. Berichte der Bunsenges. Phys. Chem. Chem. Phys. 1980, 84, 240–244. [Google Scholar] [CrossRef]
  73. Predel, B.; Piehl, J.; Pool, M.J. Contribution to the thermodynamic properties of liquid binary alloys of Te with Sn, Pb and Bi. Z. Fuer Met. 1975, 66, 347–352. [Google Scholar]
  74. Amzil, A.; Mathieu, J.C.; Castanet, R. Experimental determination of the partial enthalpies of mixing of tin and tellurium in Sn-Te melts. J. Alloys Compd. 1996, 235, 124–127. [Google Scholar] [CrossRef]
  75. Blachnik, R.; Gather, B. Die Mischungsenthalpien im System Zinn-Tellur. Z. Fuer Met. 1983, 74, 172–176. [Google Scholar]
  76. Mcateer, J.H.; Seltz, H. Thermodynamic properties of the tellurides of Zinc, cadmium, tin and lead. J. Am. Chem. Soc. 1936, 58, 2081–2084. [Google Scholar] [CrossRef]
  77. Robinson, P.; Bever, M. On the thermodynamic properties of the tellurides of the cadmium, indium, tin, and lead. AIME Trans. 1966, 236, 814–817. [Google Scholar]
  78. Vecher, A.A.; Mechkovskii, L.A.; Skoropanov, A.S. Determination of heats of formation of some tellurides. Izv. Akad. Nauk SSSR Neorg. Mater. 1974, 10, 2140–2143. [Google Scholar]
  79. Misra, S. A Thermoanalytical investigation of the thermodynamic properties of tin telluride. J. Therm. Anal. 1975, 7, 309–316. [Google Scholar]
  80. Colin, B.R.; Drowart, J. Thermodynamic study of tin selenide and tin telluride using a mass spectrometer*. Trans. Faraday Soc. 1963, 60, 673–683. [Google Scholar] [CrossRef]
  81. Blachnik, R.; Igel, R.; Wallbrecht, P. Thermodynamische eigenschaften von zinnchalcogeniden. Z. Nat. 1974, 29, 1198–1201. [Google Scholar]
  82. Medzhidov, R.A.; Rasulov, S.M. Point defects contribution into SnTe and Sb/sub 2/Te/sub 3/ surplus enthalpy, heat capacity and entropy. Zh. Fiz. Khim. 1979, 53, 191–192. [Google Scholar]
  83. Yamaguchi, K.; Kameda, K.; Takeda, Y.; Itagaki, K. Measurements of high temperature heat content of the II-VI and IV-VI (II:Zn, Cd IV: Sn, Pb VI: Se, Te) compounds. Mater. Trans. JIM 1994, 35, 118–154. [Google Scholar] [CrossRef] [Green Version]
  84. Pashinkin, A.S.; Malkova, A.S.; Mikhailova, M.S. Standard enthalpy and heat capacity of solid tin telluride. Russ. J. Phys. Chem. A 2006, 80, 1342–1343. [Google Scholar] [CrossRef]
  85. Dedegkaev, T.T.; Duguzhev, S.M.; Zhukova, T.B.; Melekh, B.T.; Moshnikov, V.A. Production and investigation of composition and structure of new SnGa6Te10 compounds. Zhurnal Tekhnicheskoi Fiz. 1985, 55, 2408–2410. [Google Scholar]
  86. Gather, B.; Irle, E.; Blachnik, R. The excess enthalpies of liquid Ga-Ge-Te and Ga-Sn-Te alloys. J. Less-Common Met. 1987, 136, 183–191. [Google Scholar] [CrossRef]
  87. Rustamov, P.G.; Kuliev, B.B.; Aliyanov, M.A.; Kuliev, E.M. On Interaction of Tin Telluride with GaTe. Phys. Status Solidi 1970, 3, K139–K141. [Google Scholar] [CrossRef]
  88. Dovletov, K.; Ehrniyazov, K.; Malkova, A.S. Phase equilibria in the GaTe-SnTe-, InTe-SnTe systems. Izv. Akad. Nauk SSSR Neorg. Mater. 1976, 12, 1964–1968. [Google Scholar]
  89. Guittard, M.; Alapini, F.; Jaulmes, S.; Julien-Pouzol, M.; Flahaut, J. Sur une famille de tellurures ternaires formes par le gallium avec l’etain ii, le plomb ou l’indium i, de type SnGa6Te10. Mater. Res. Bull. 1978, 13, 1157–1161. [Google Scholar] [CrossRef]
  90. Alapini, F.; Flahaut, J.; Guittard, M.; Jaulmes, S.; Julien-Pouzol, M. Systeme gallium-tellure: Diagrammes de phases, étude structurale de GaTe, Ga2Te5 et de Ga6SnTe10. J. Solid State Chem. 1979, 28, 309–319. [Google Scholar] [CrossRef]
  91. Pelton, A.D. A general “geometric” thermodynamic model for multicomponent solutions. Calphad 2001, 25, 319–328. [Google Scholar] [CrossRef]
Figure 1. Calculated phase diagram of Ga-Sn along with experimental data from [37,38,39,40,41,42].
Metals 11 01363 g001
Figure 2. (a) Calculated activity of Ga (l) and Sn (l) in liquid at 1073 K along with experimental data from [42,45,46] and (b) mixing enthalpy of liquid at 723 K along with experimental data from [42,47,48,49,50,51].
Metals 11 01363 g002
Figure 3. (a) Calculated phase diagram of Sn-Te system along with experimental data and (b) enlarged homogeneity range of SnTe compound along with experimental data from [58,59,60,61,62,63,64,65,66,67,68,69,70,71].
Metals 11 01363 g003
Figure 4. Calculated thermodynamic properties at 1100 K (a) activity of Sn (l) and Te (l), (b) mixing enthalpy of liquid, (c) mixing entropy of liquid, and (d) partial enthalpy of Sn (l) and Te (l) in liquid solution along with respective experimental data from [63,64,72,73,74,75].
Metals 11 01363 g004
Figure 5. Calculated heat content (HT-H298.15K) of SnTe as function of temperature along with experimental data from [81,82,83].
Metals 11 01363 g005
Figure 6. Calculated (a) Ga-Te phase diagram and (b) integral enthalpy of mixing at 1123 K using thermodynamic description of Kumar et al. [29].
Metals 11 01363 g006
Figure 7. Calculated vertical section of (a) GaTe-SnTe and (b) Ga2Te3-SnTe quasi-binaries along with respective experimental data from [86,87,88,89].
Metals 11 01363 g007
Figure 8. Calculated enthalpy of mixing in liquid GaxSny-Te at 1203 K along with experimental data from [86].
Metals 11 01363 g008
Figure 9. Calculated liquidus projection in the Ga-Sn-Te system.
Metals 11 01363 g009
Figure 10. Calculated vertical section of (a) GaTe-SnTe, (b) Ga2Te3-SnTe, and (c) SnTe-Ga3Te4 quasi-binaries.
Metals 11 01363 g010
Table 1. Optimized model parameter of the Ga-Sn-Te system (All values are in J/mol).
Phase/Model Thermodynamic Parameters (J/mol)Ref.
Liquid (Sn, Ga, Te)
Modified Quasichemical Model
Z SnSn Sn = Z GaGa Ga = Z TeTe Te = Z SnGa Sn = Z SnGa Ga = Z SnTe Ga = Z SnTe Te = Z GaTe Ga 6 ; Z GaTe Te = 4 ;  
Δ g GaSn = 1200 This work
Δ g SnTe   = 22100 + 2.4 T + ( 19800 1.5 T ) X SnSn 8850 X SnSn 2 + 8100 X TeTe 5200 X TeTe 2 This work
Δ g GaTe = 38650 + 10.8 T + ( 13900     3.9 T )   X GaGa + 5000 X TeTe [29]
g GaTe ( Sn ) 001 = −8900 This work
BCT (Sn, Ga) ° G Sn BCT = ° G Sn SER
Regular Solution Model ° G Ga BCT = ° G Ga SER + 3846.001 50.527 T This work
L Sn , Ga BCT =   7500 0.8 T
SnTe (Sn, Va) (Te)
Compound Energy Formalism
G Sn : Te SnTe = ° G Sn SER + ° G Te SER 60127.45
G Va : Te SnTe = ° G Te SER + 10000This work
L Sn , Va : Te SnTe = 140000 26 T 129000 ( X Sn X Va )
Intermetallic Compounds
PhaseThermodynamic Parameters (J/mol)
GaTe G GaTe ° = 90741.7253 + 109.9049 T 22.8441 T ln ( T ) 8.8704 E - 2 T 2 + 12806.9 T 1 + 5 E - 5 T 3
(50 < T < 298)
[29]
92173.7944 + 204.1645 T 41.6750 T   ln ( T ) 1.4044 E - 2 T 2 945.6965 T 1 + 1.9559 E - 6 T 3
(298 < T < 1600)
Ga2Te3 G Ga 2 Te 3 ° = 228100.4698 + 415.3425 T 86.7723 T ln ( T ) 0.1081 T 2 + 49661 T 1 + 5.6667 E - 5 T 3
(50 < T < 298)
[29]
230848.0086 + 579.4559 T 118.5 T   ln ( T ) 0.0025 T 2
(298 < T < 1600)
Ga3Te4 G Ga 3 Te 4 ° = 327842.1951 + 533.2474 T 109.6164 T ln ( T ) 0.1967 T 2 + 62467.9 T 1 + 1.0667 E - 4 T 3
(50 < T < 298)
[29]
322021.8030 + 791.6204 T 160.1750 T ln ( T ) 0.0165 T 2 + 1.9559 E - 6 T 3 945.6965 T 1
(298 < T < 1600)
Ga2Te5 G Ga 2 Te 5 ° = 2 ° G Ga SER + 5 ° G Te SER 162080.1500 + 31.7668 T
(298 < T < 1600)
[29]
Ga6SnTe10 G Ga 6 SnTe 10 ° = 6 ° G Ga SER + ° G Sn SER + 10 ° G Te SER 657000 64.98 T
(298 < T < 4000)
This work
Table 2. Formation enthalpy of SnTe at 298.15 K.
Δ H 298.15   K f   ( kJ / mol ) MethodReference
−61.29PotentiometryMcateer & Harry [76]
−60.7CalorimetryRobinson & Bever [77]
−64.2CalorimetryVecher et al. [78]
−59.83CalorimetryMisra [79]
−61.08Mass spectrometerColin & Drowart [80]
−60.1CalculatedLiu et al. [56]
−60.1CalculatedPresent study
Table 3. Invariant reactions in Ga-Sn-Te system.
Sr. No.ReactionTypeCompositionT(K)
X G a X T e X S n
1 L + Ga 3 Te 4 + Ga 2 Te 3 Ga 6 SnTe 10 Peritectic0.2900.5560.154957.95
2 L + Ga 3 Te 4 + Ga 6 SnTe 10 SnTe Quasi Peritectic0.2400.5310.229904.13
3 L + SnTe Ga 3 Te 4 + GaTe Eutectic0.2430.5230.234901.28
4 L + Ga 2 Te 5 Te + Ga 2 Te 3 Quasi Peritectic0.0860.8840.03686.36
5 L + Ga 2 Te 3 Te + Ga 6 SnTe 10 Quasi Peritectic0.0720.8070.121654.76
6 L BCT + SnTe + GaTe Eutectic0.034.6E-40.967498.08
Publisher’s Note: MDPI stays neutral with regard to jurisdictional claims in published maps and institutional affiliations.

