
Analysis and Optimization of Process Parameters in Abrasive Waterjet Contour Cutting of AISI 304L


Abstract
:1. Introduction
2. Materials and Methods
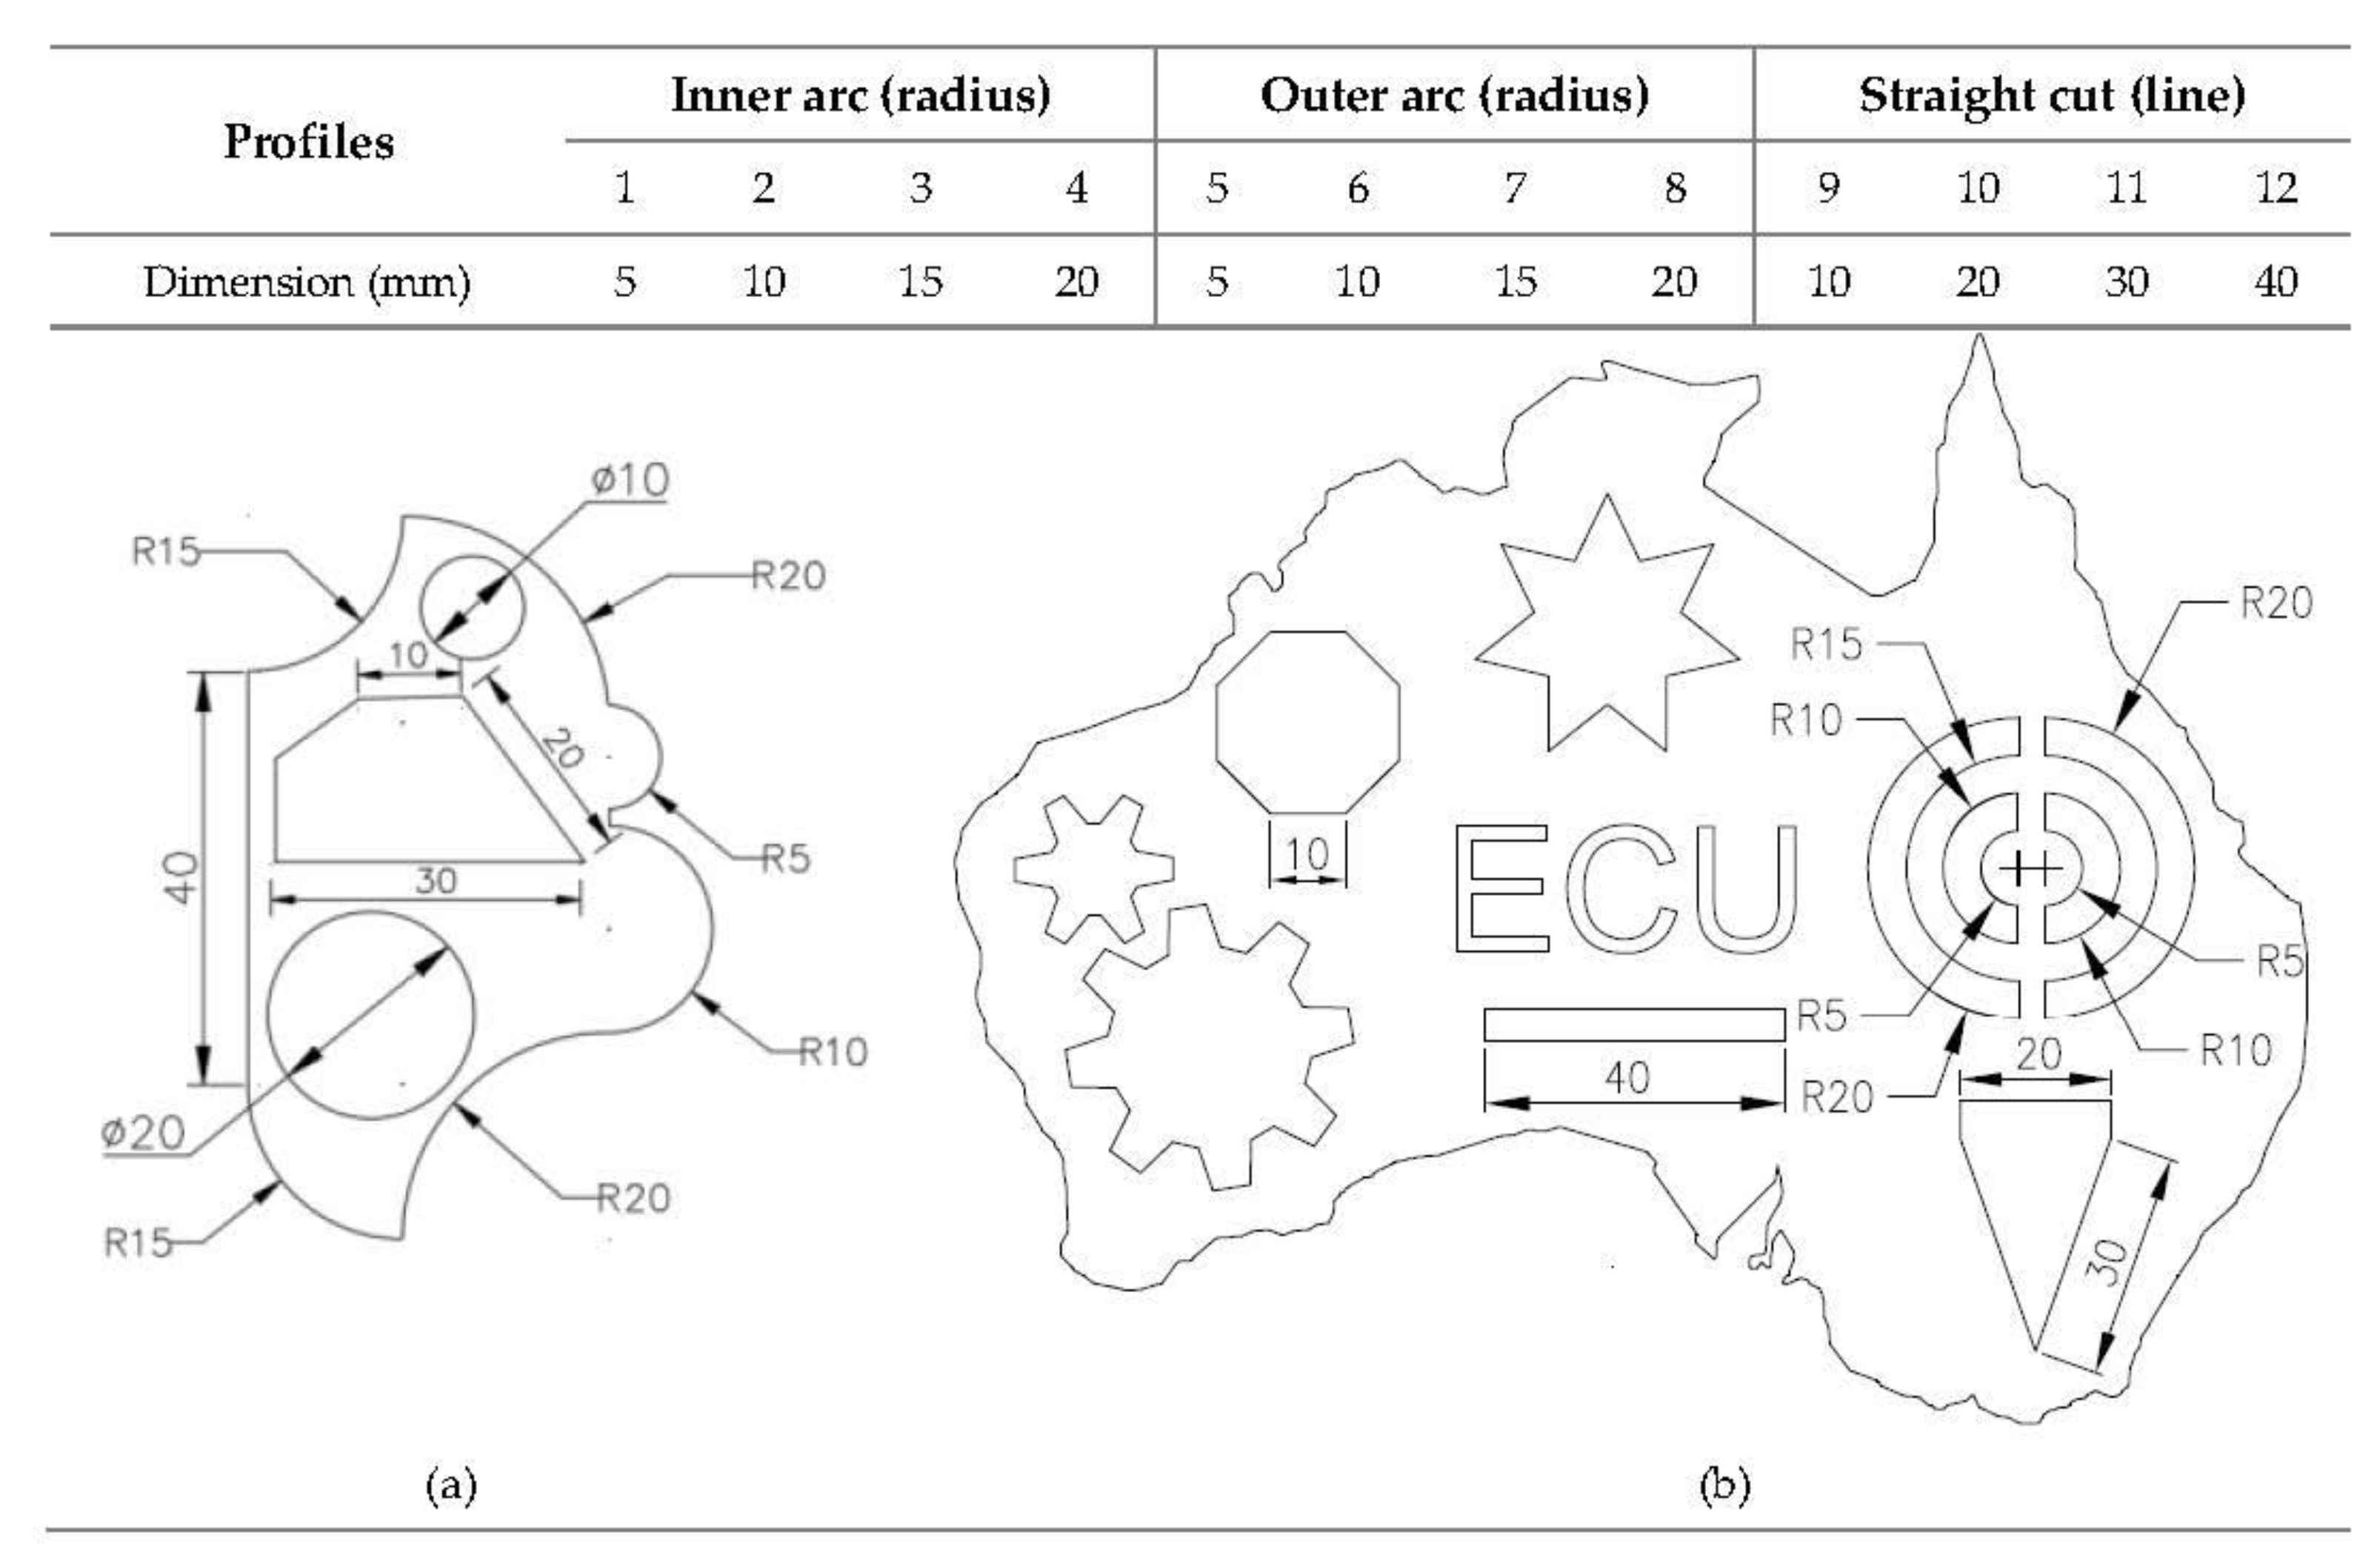
2.1. Workpiece and Contour Cutting Profiles

| Chemical Composition (wt %). | |||||||||
|---|---|---|---|---|---|---|---|---|---|
| Fe | C | Mn | Si | Mo | Co | Cr | Cu | Ni | Others |
| 70.780 | 0.025 | 1.140 | 0.410 | 0.360 | 0.210 | 18.40 | 0.180 | 8.190 | 0.305 |
| Properties of AISI 304L | |
|---|---|
| Hardness, Rockwell B | 82 |
| Tensile Strength, Ultimate, MPa | 564 |
| Tensile Strength, Yield, MPa | 210 |
| Elongation at Break % | 58% |
| Modulus of Elasticity, GPa | 193–200 |
2.2. AWJ Machining Setup and Parameters
2.3. Design of Experiment
3. Results and Discussions
3.1. Effects of Input Parameters on Surface Roughness and Material Removal Rate
3.2. Optimisation with Taguchi S/N Ratio
4. Confirmation Test
5. Conclusions
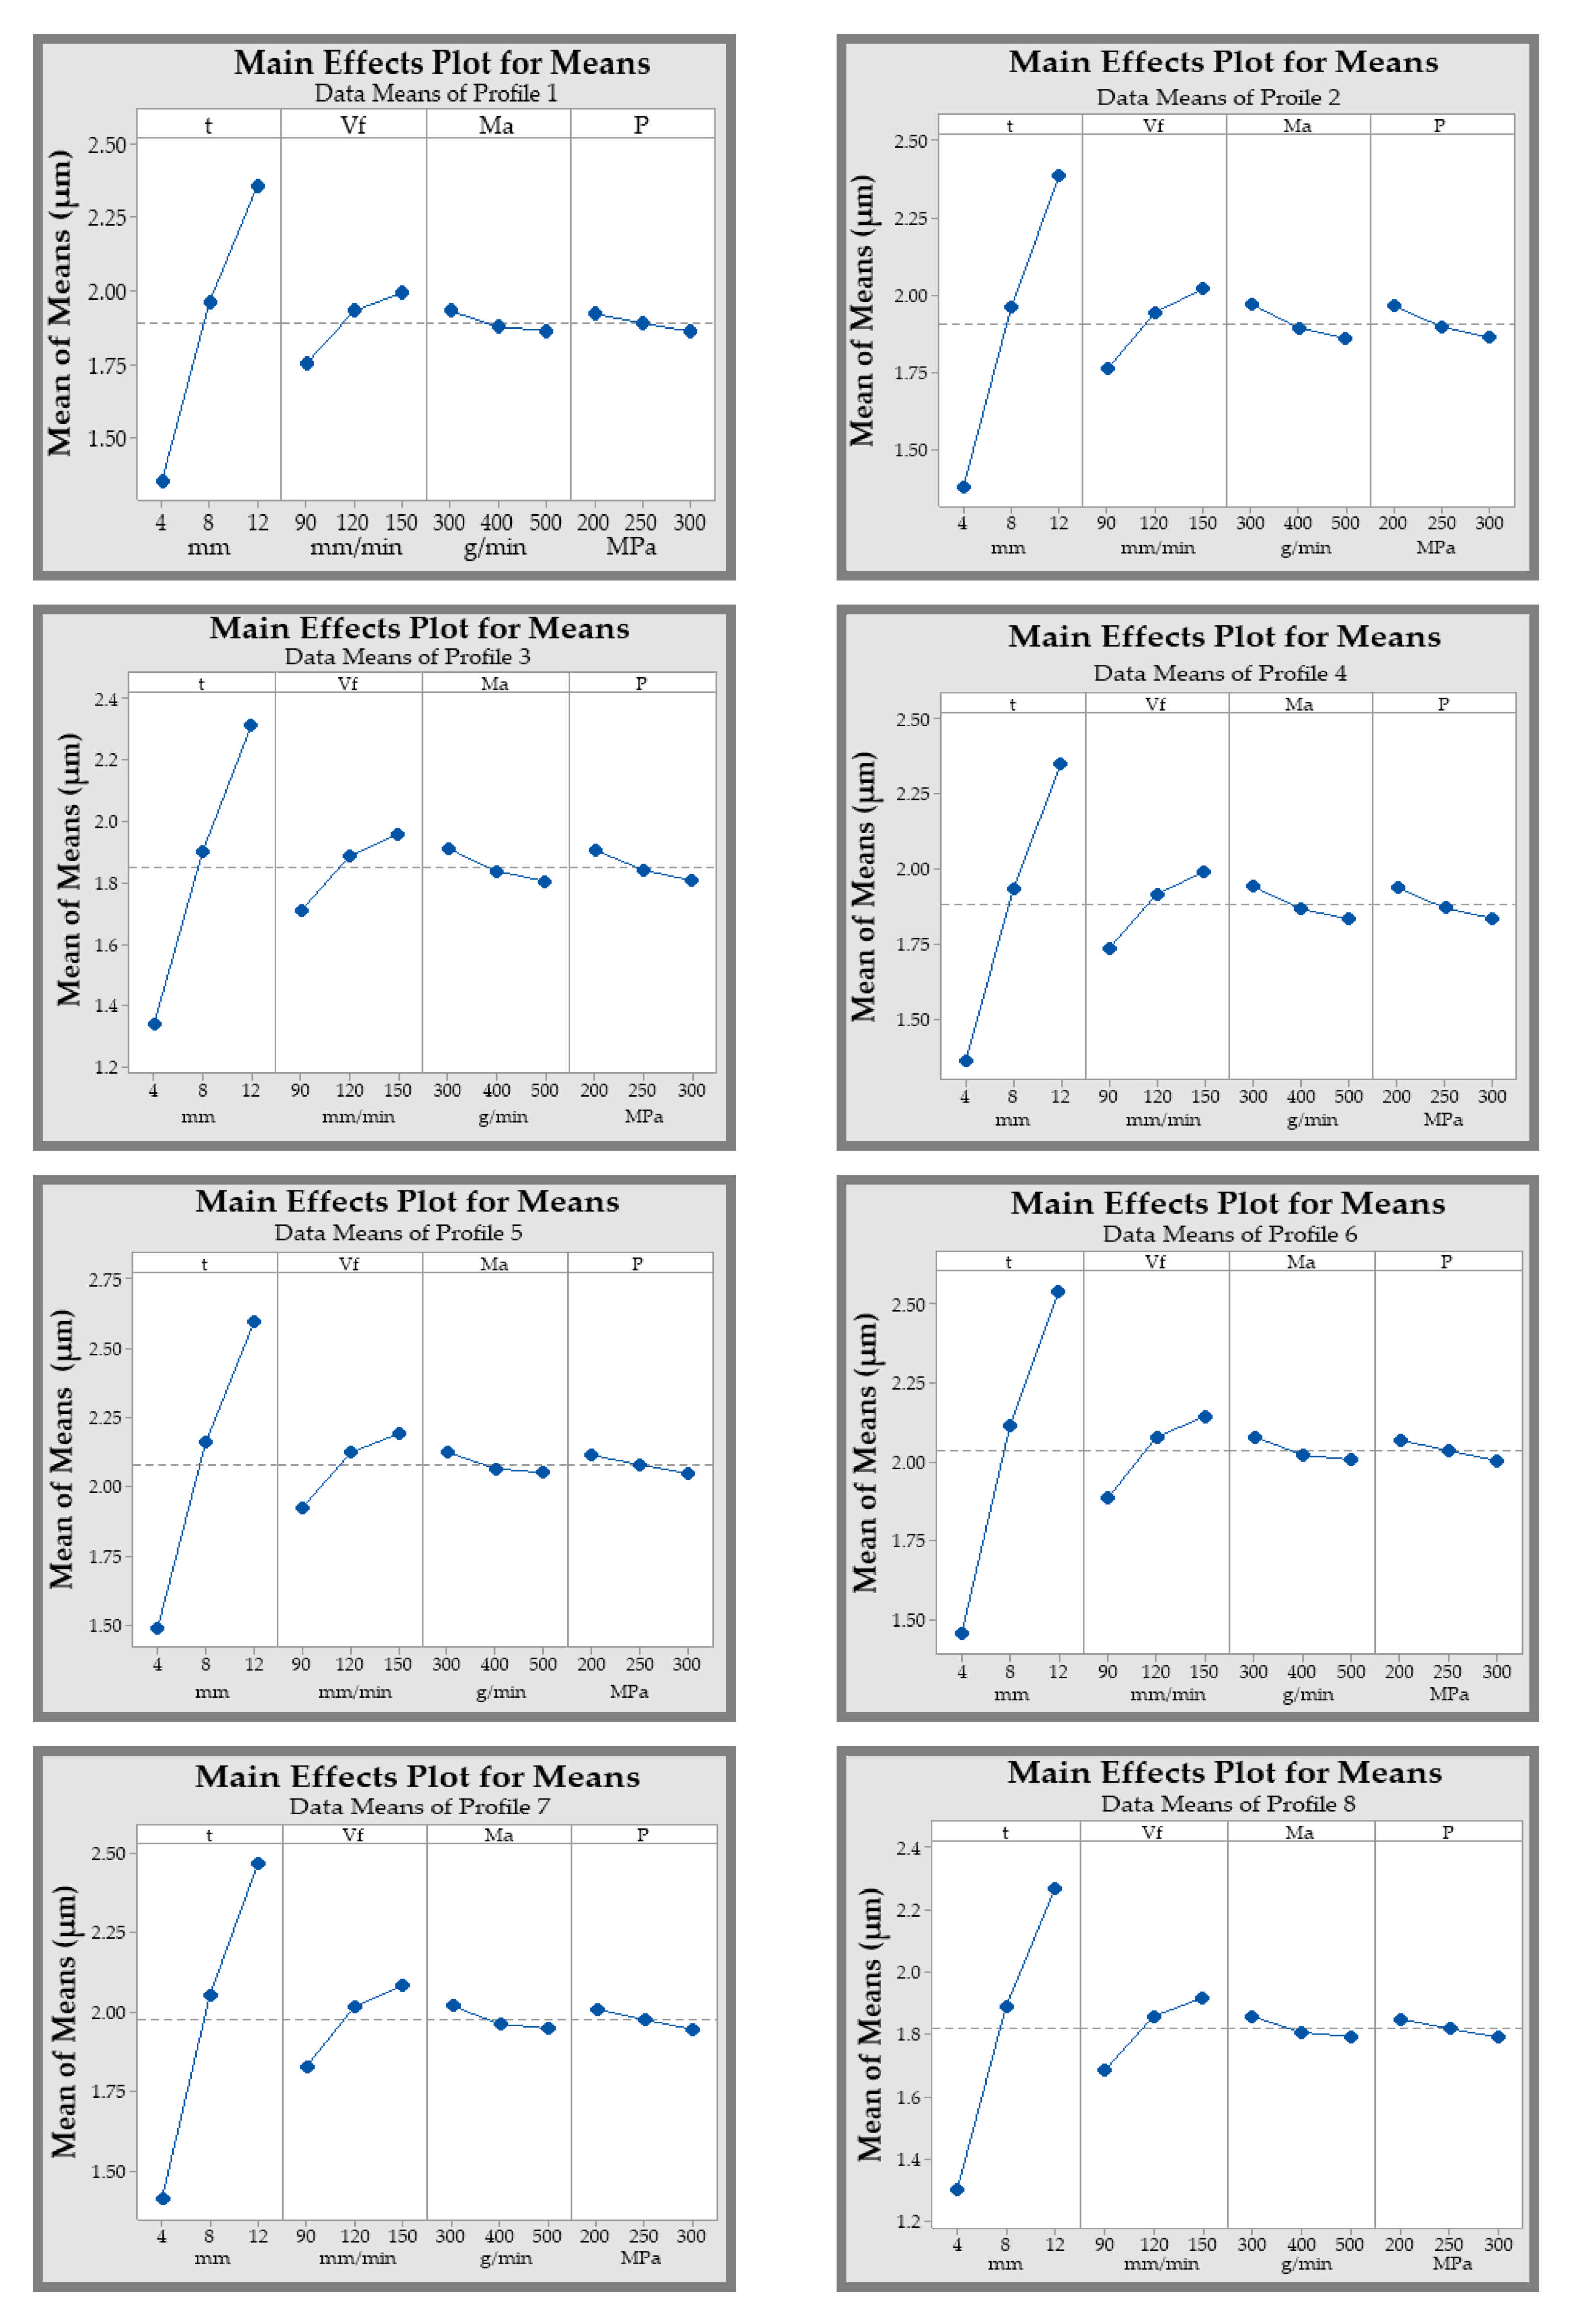
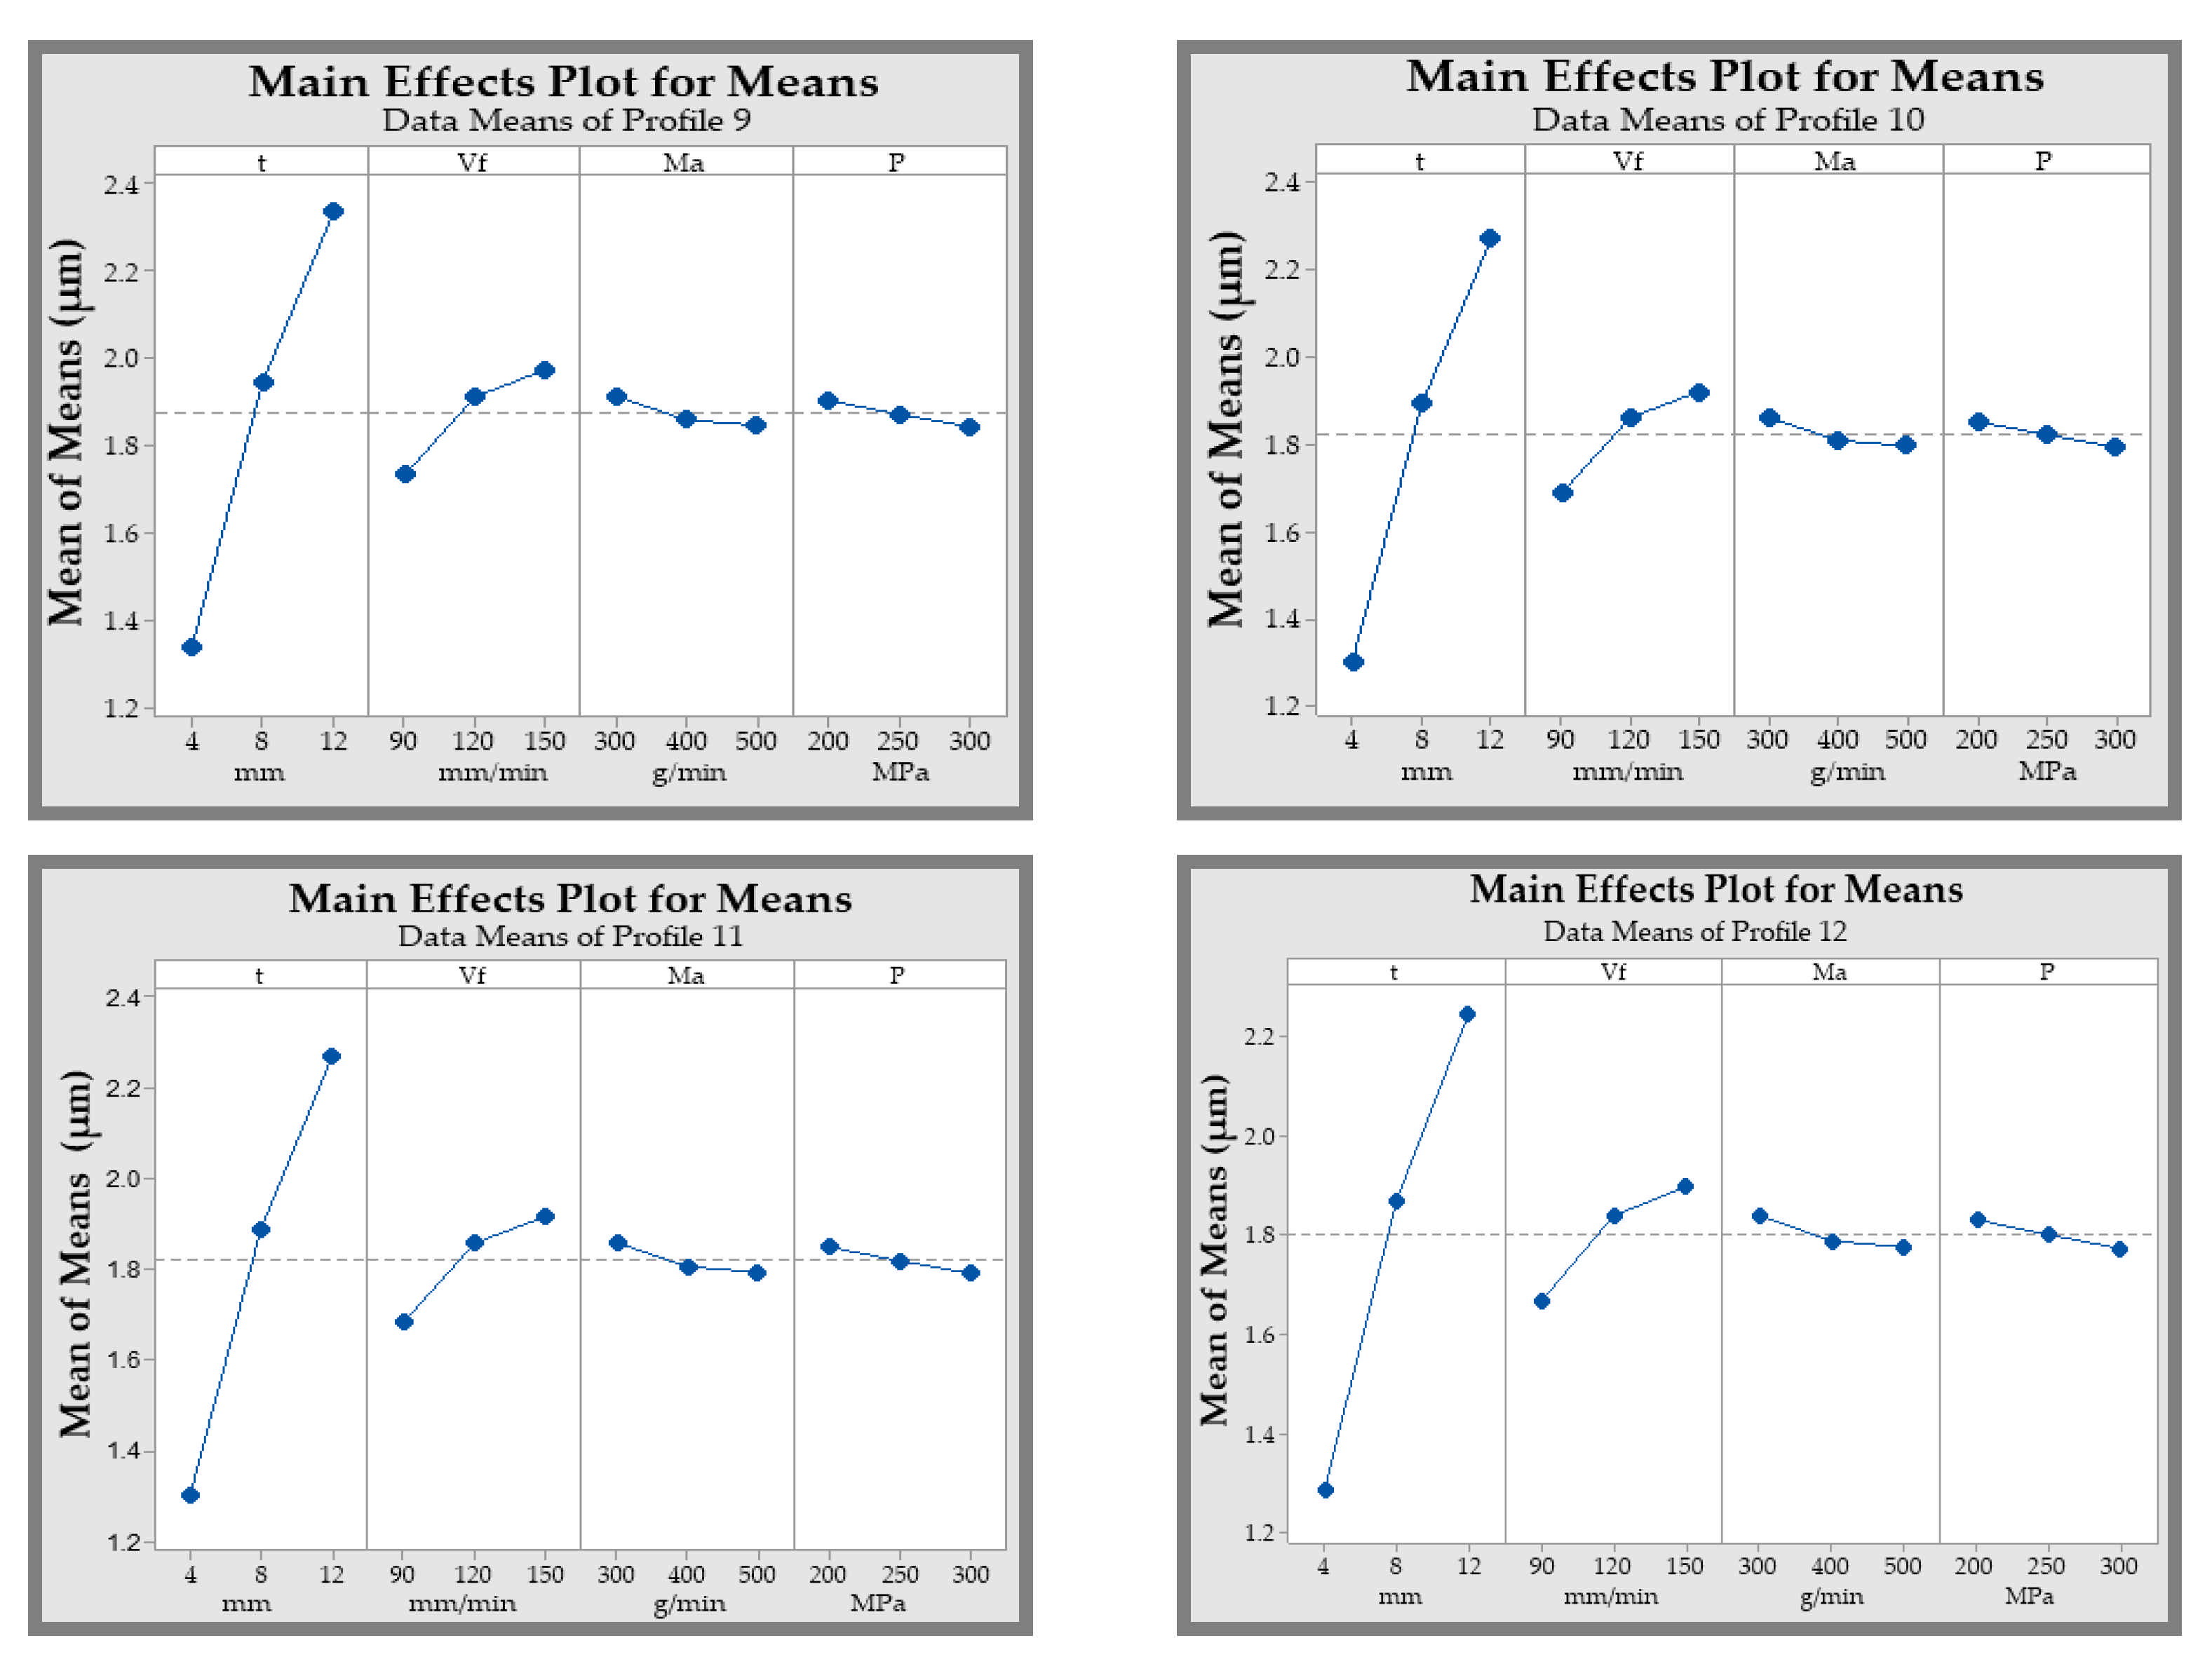
- A minimum value of surface roughness achieved, where 1.142 µm for 4 mm, 1.529 µm for 8 mm, and 1.993 µm for 12 mm material thicknesses according to L27 orthogonal array experiment setup. The average S/N ratios expressed similar results to all profiles, indicating the optimal combination of input parameters of Level 1 for traverse speed, Level 3 for abrasive mass flow rate and waterjet pressure at 90 mm/min, 500 g/min and 300 MPa respectively.
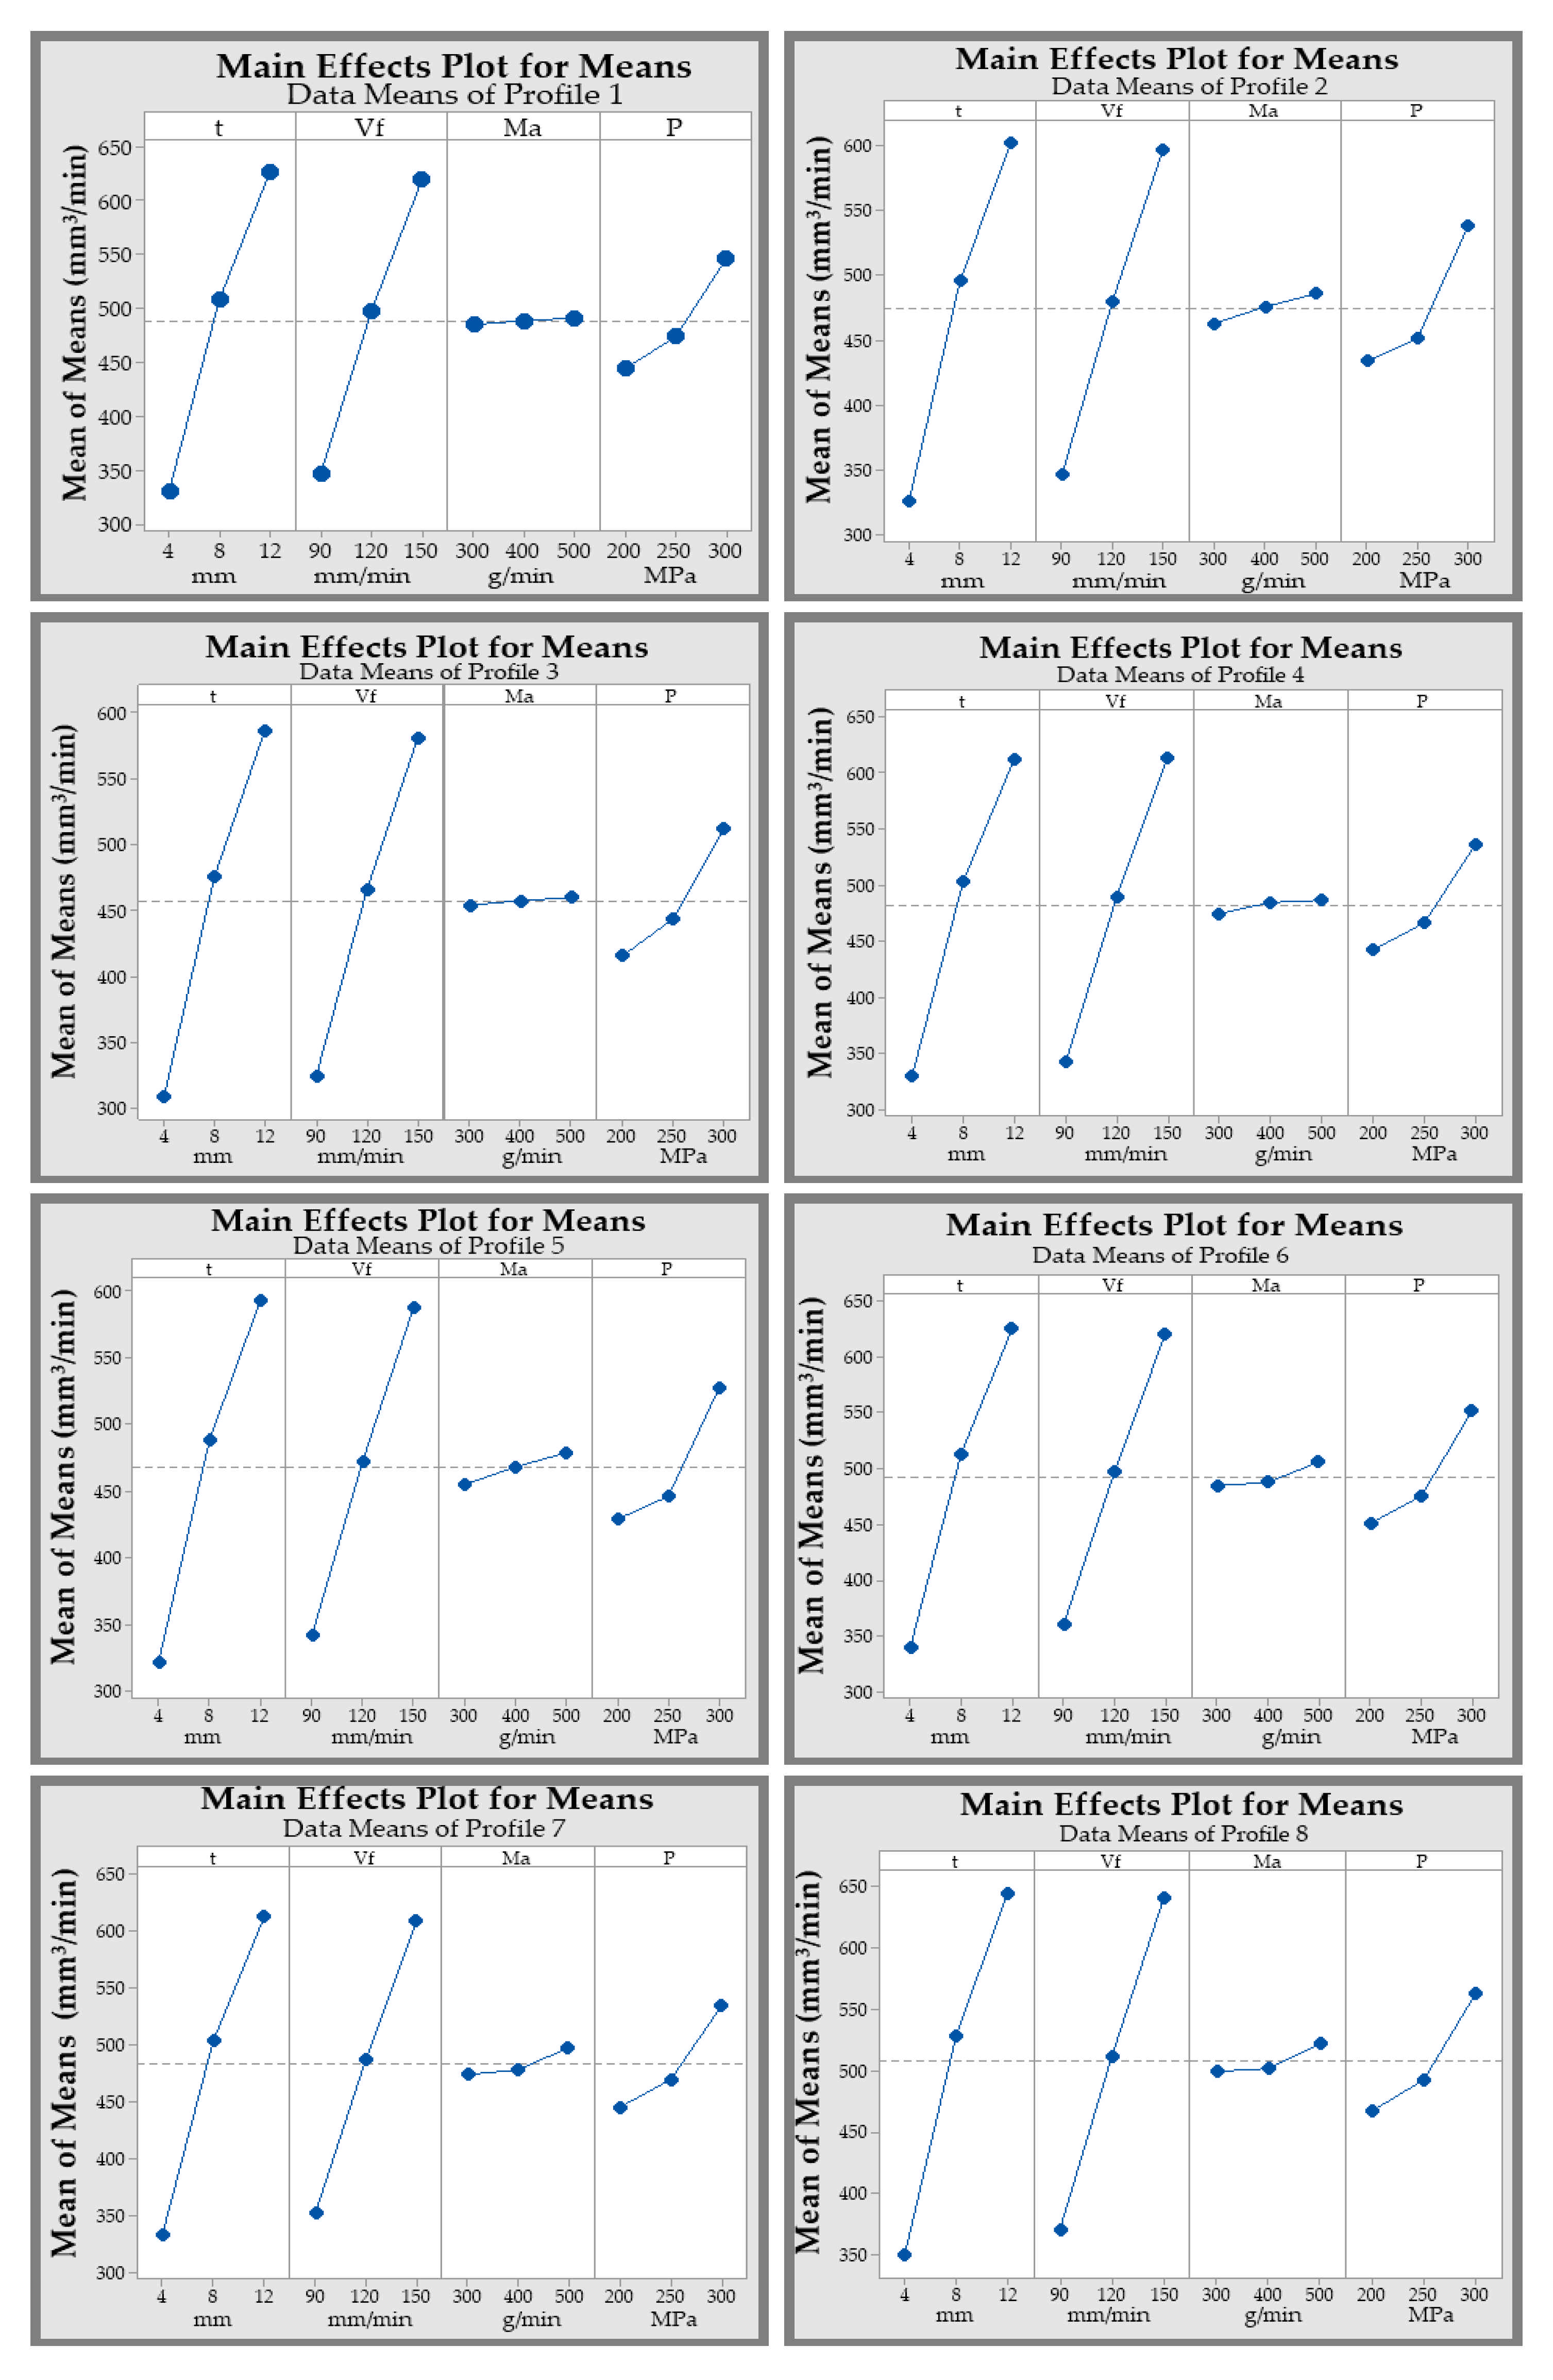
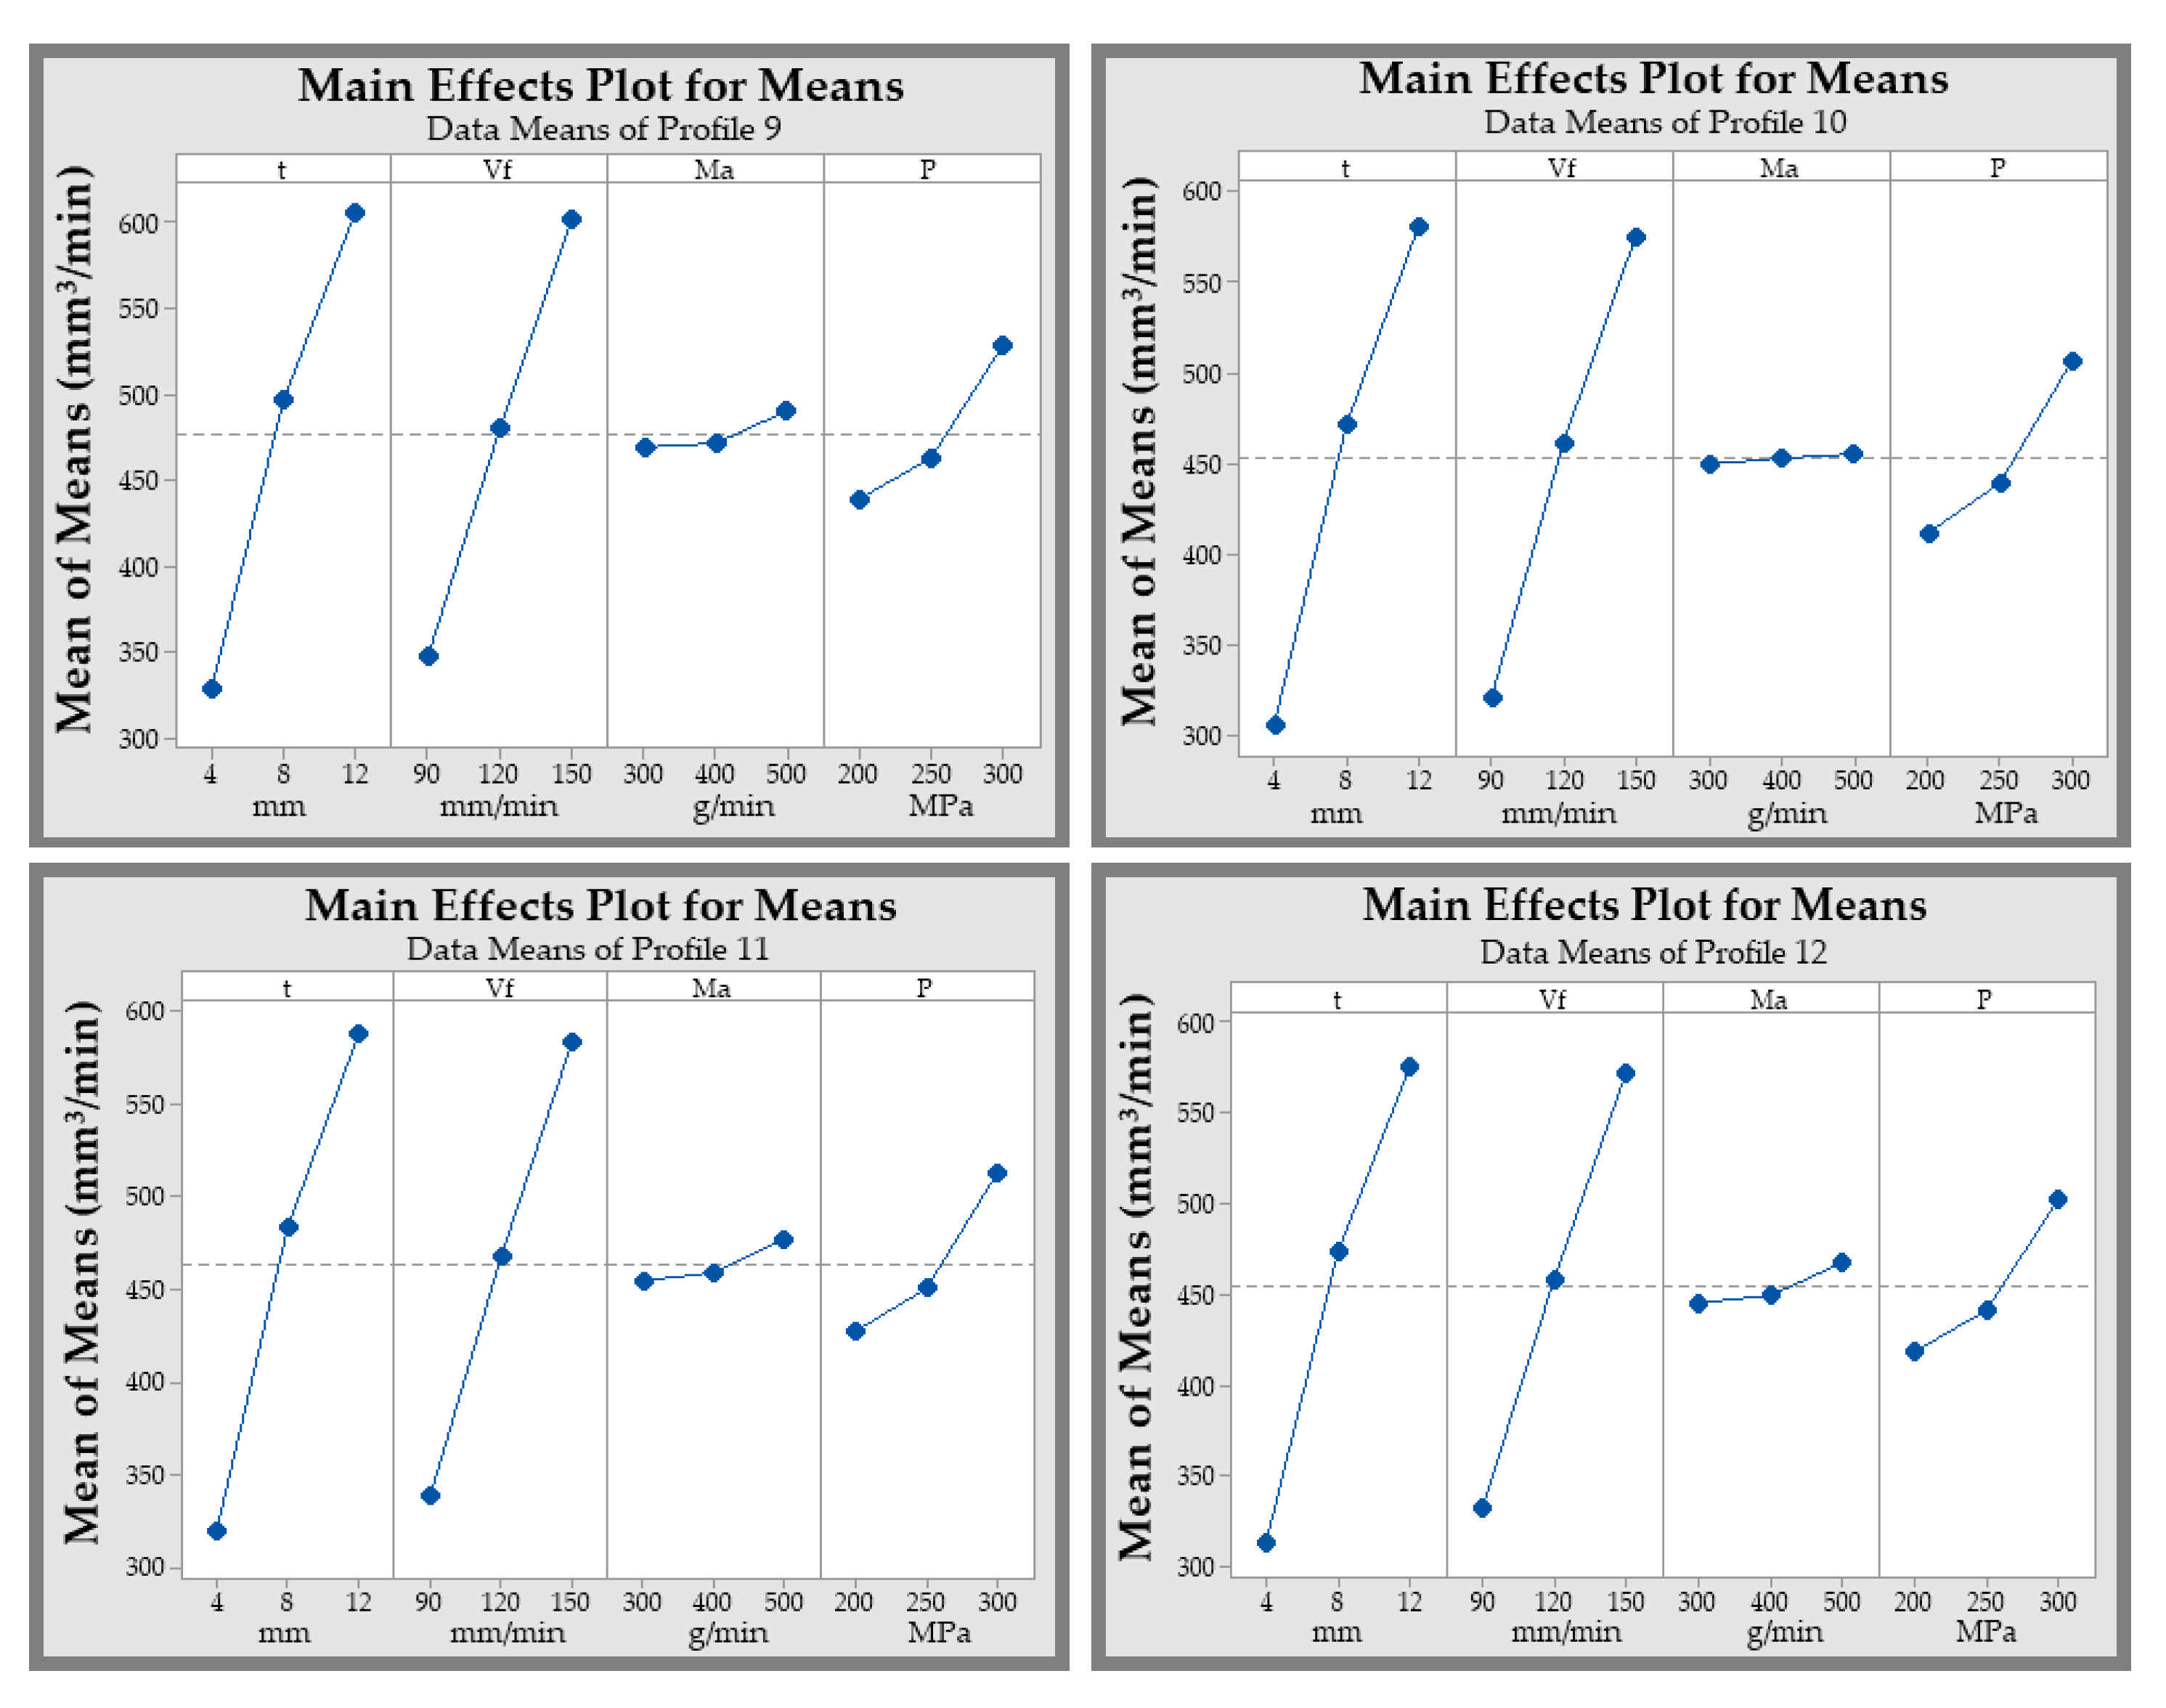
- The optimal settings observed for increasing material removal rate are traverse speed at Level 3 (150 mm/min), abrasive mass flow rate at Level 3 (500 g/min) and pressure at Level 3 (300 MPa). Increasing the value of these selected parameters was found to increase material thickness by approximately 70%.
- By employing analysis of variance, material thickness features as the most influencing and significant factor in governing responses on surface roughness and material removal rate, generating a contribution ranging 90.72–97.74% and 65.55–78.17% for all profiles, respectively.
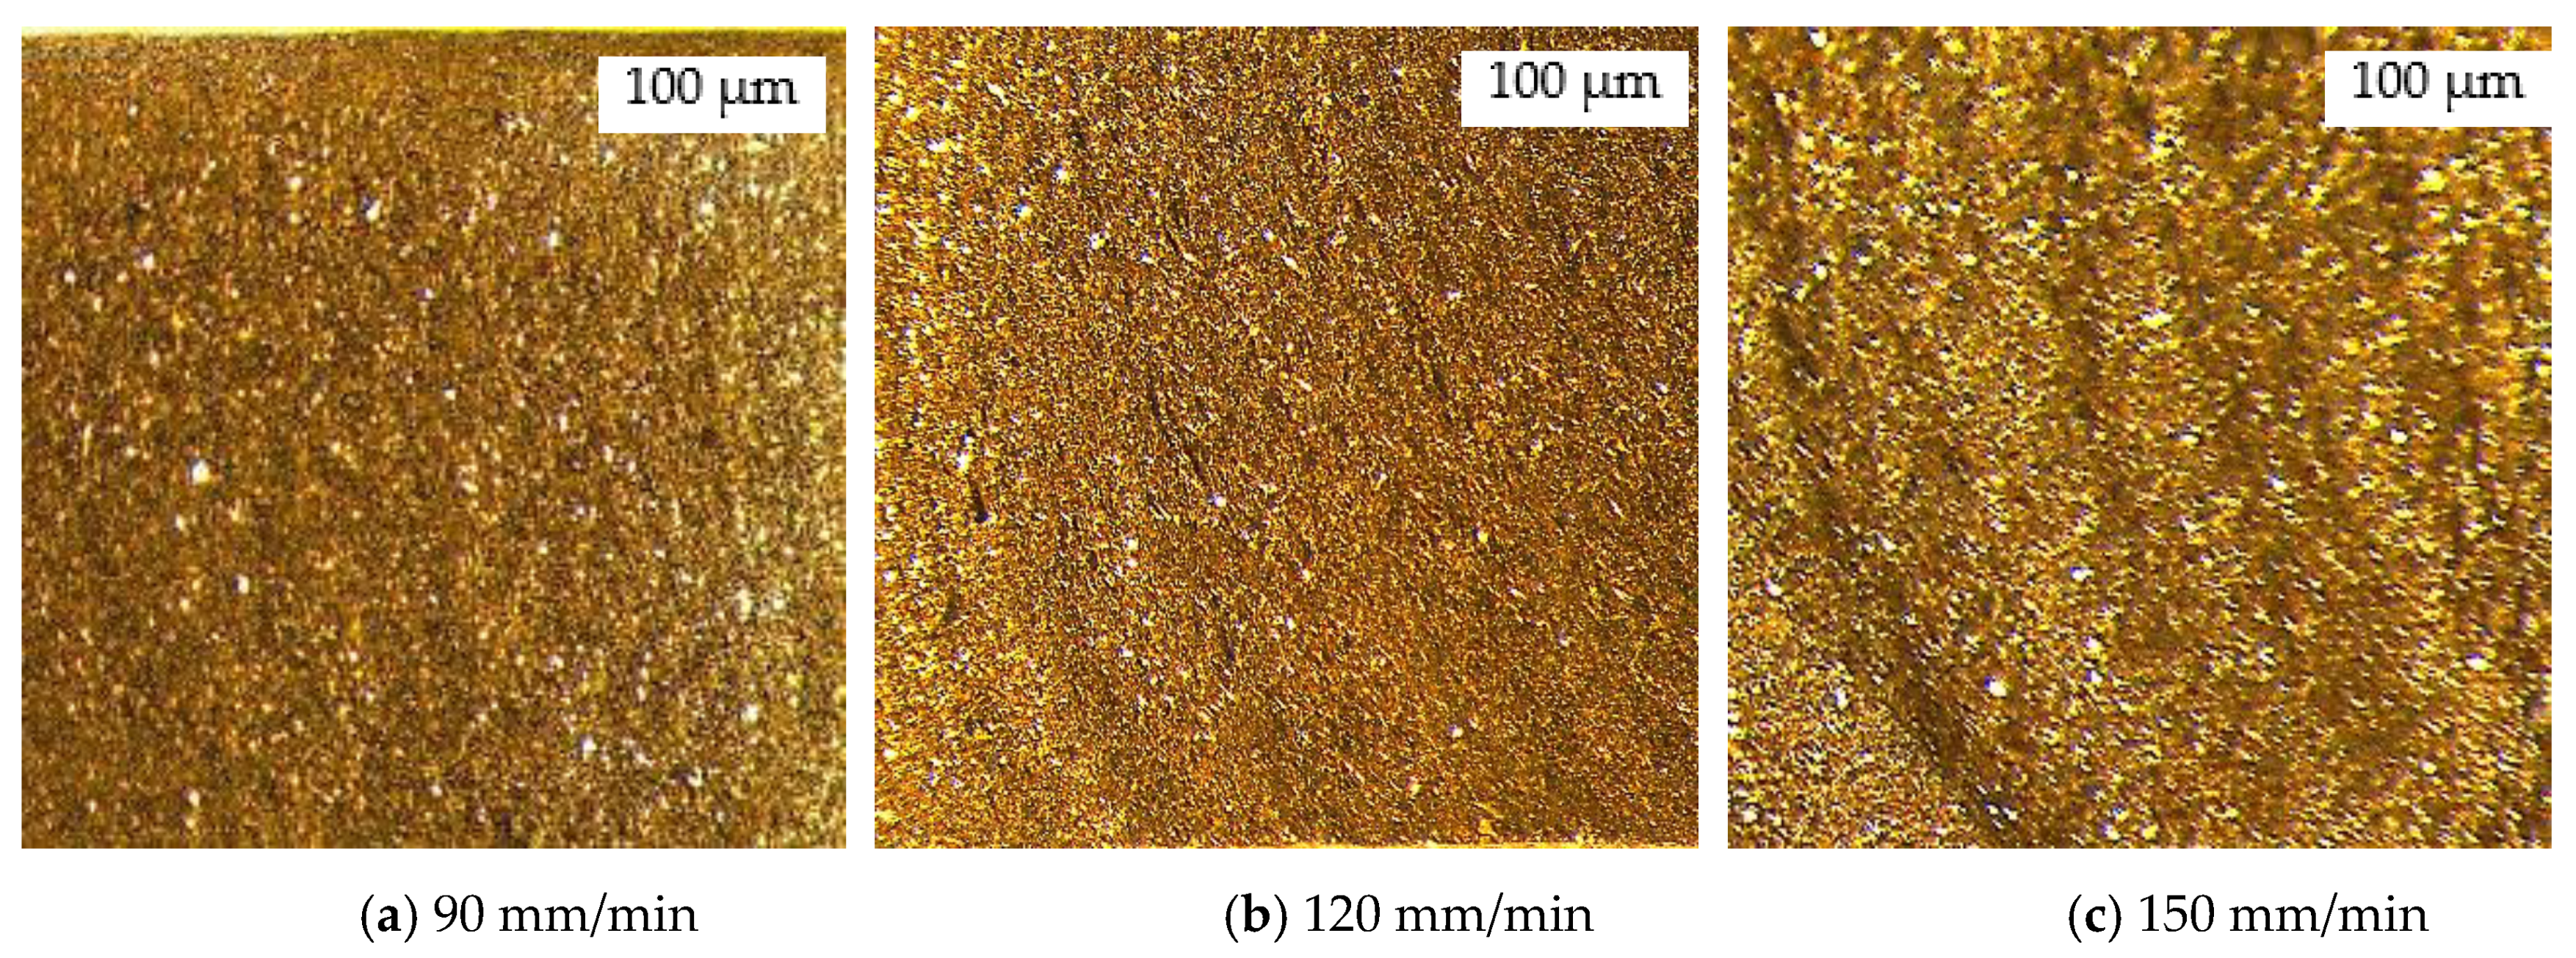
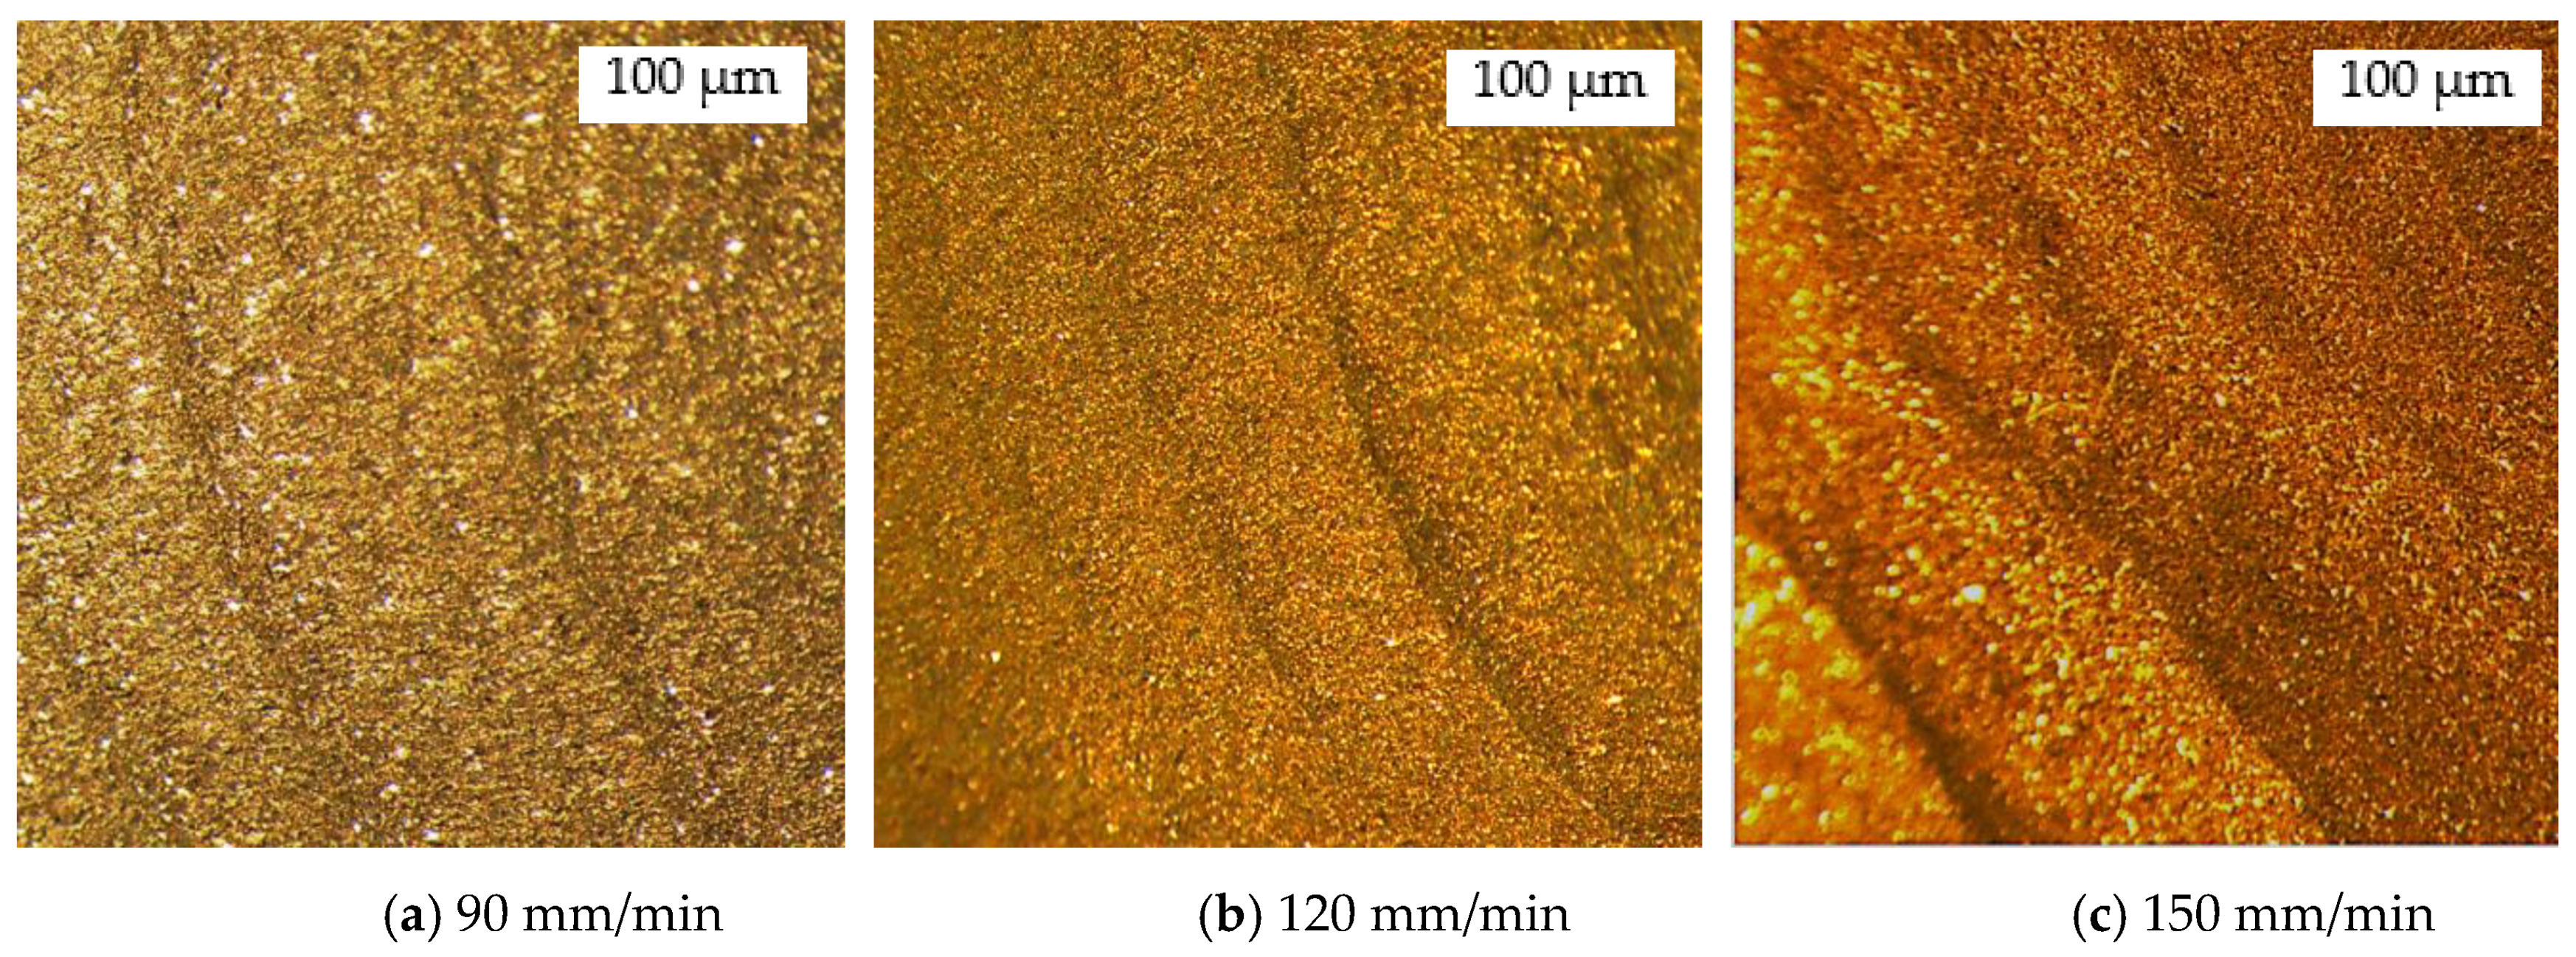
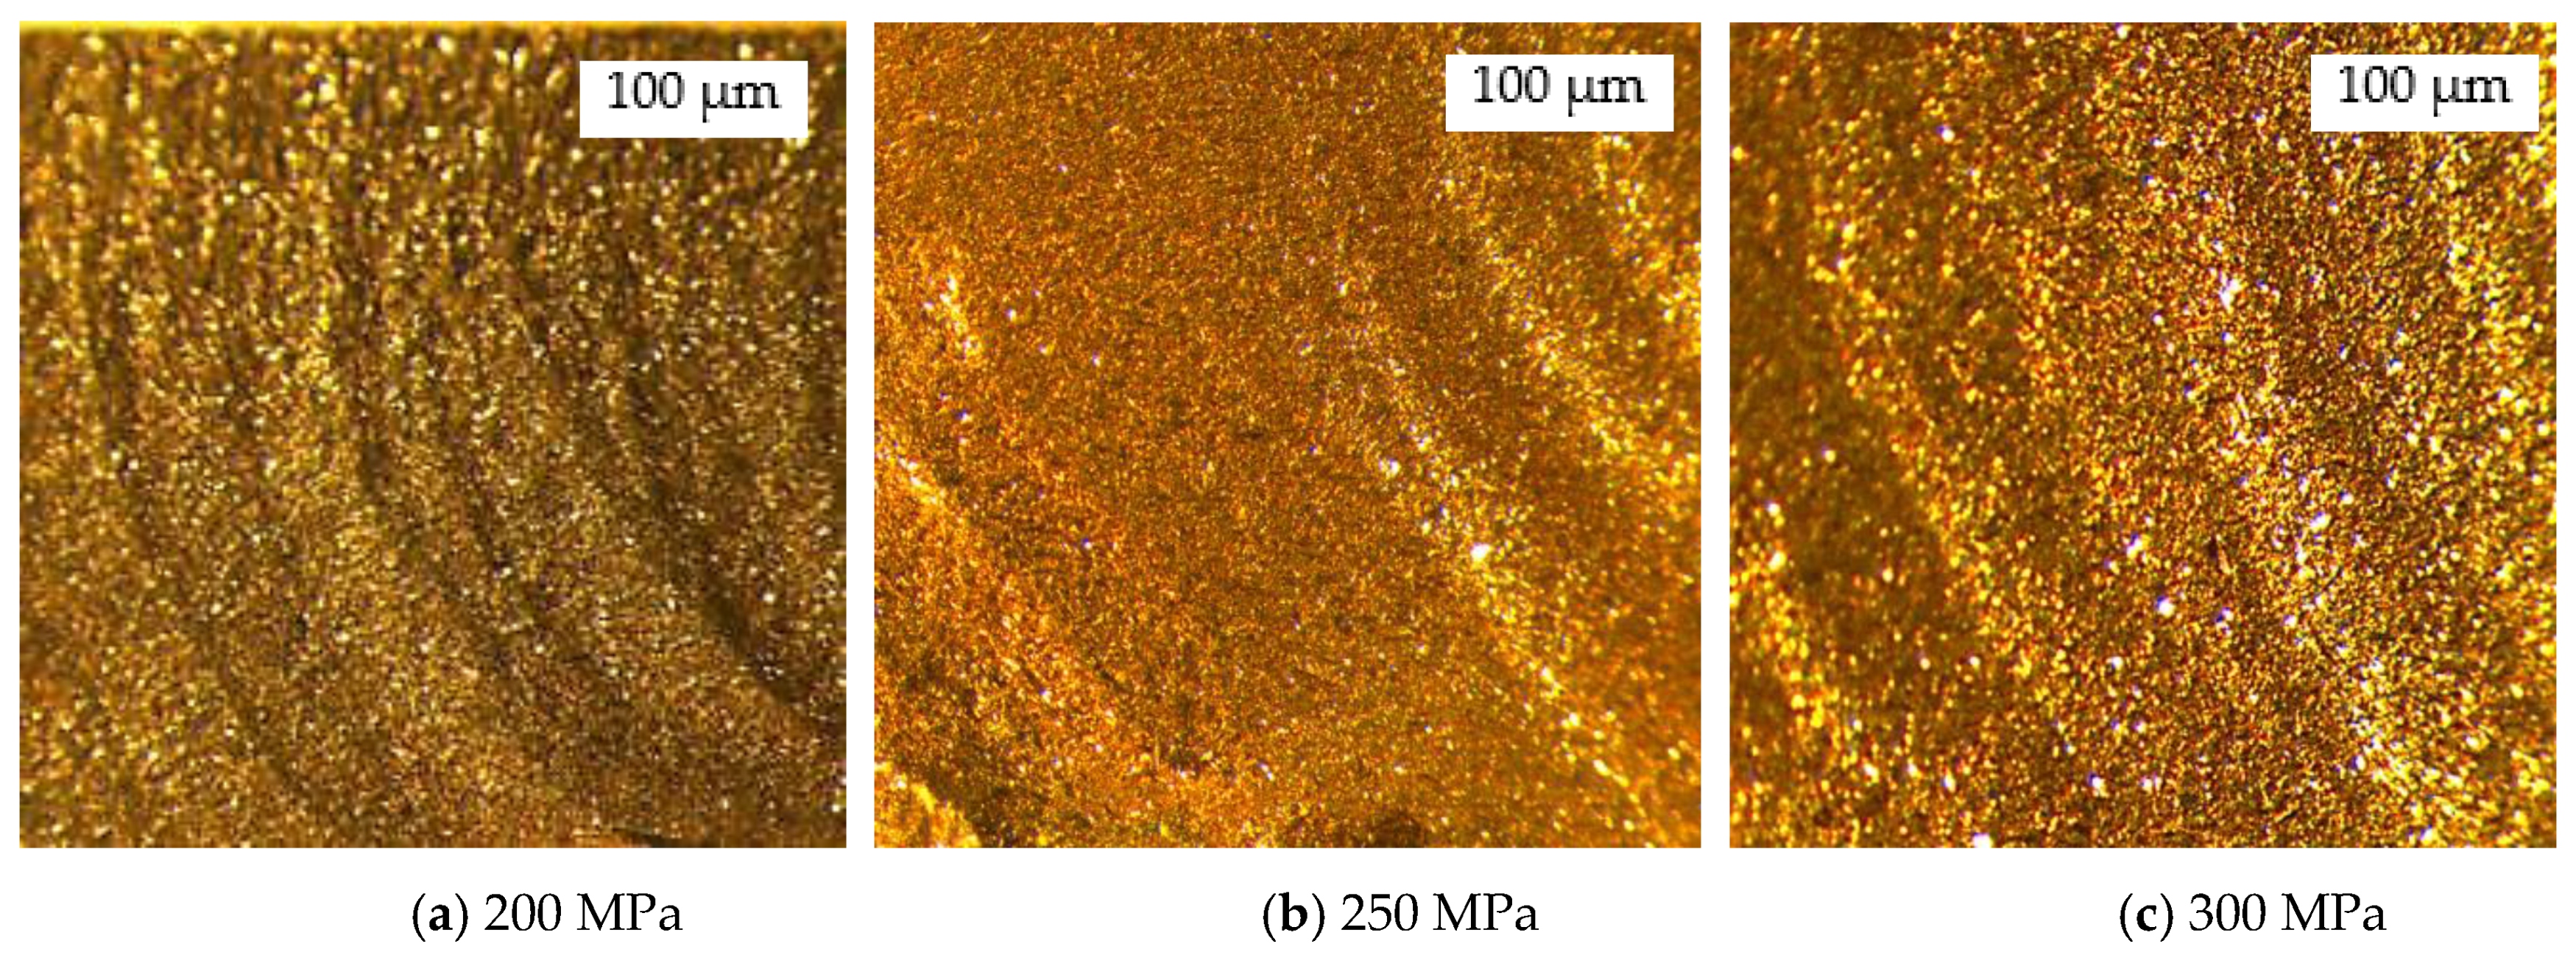
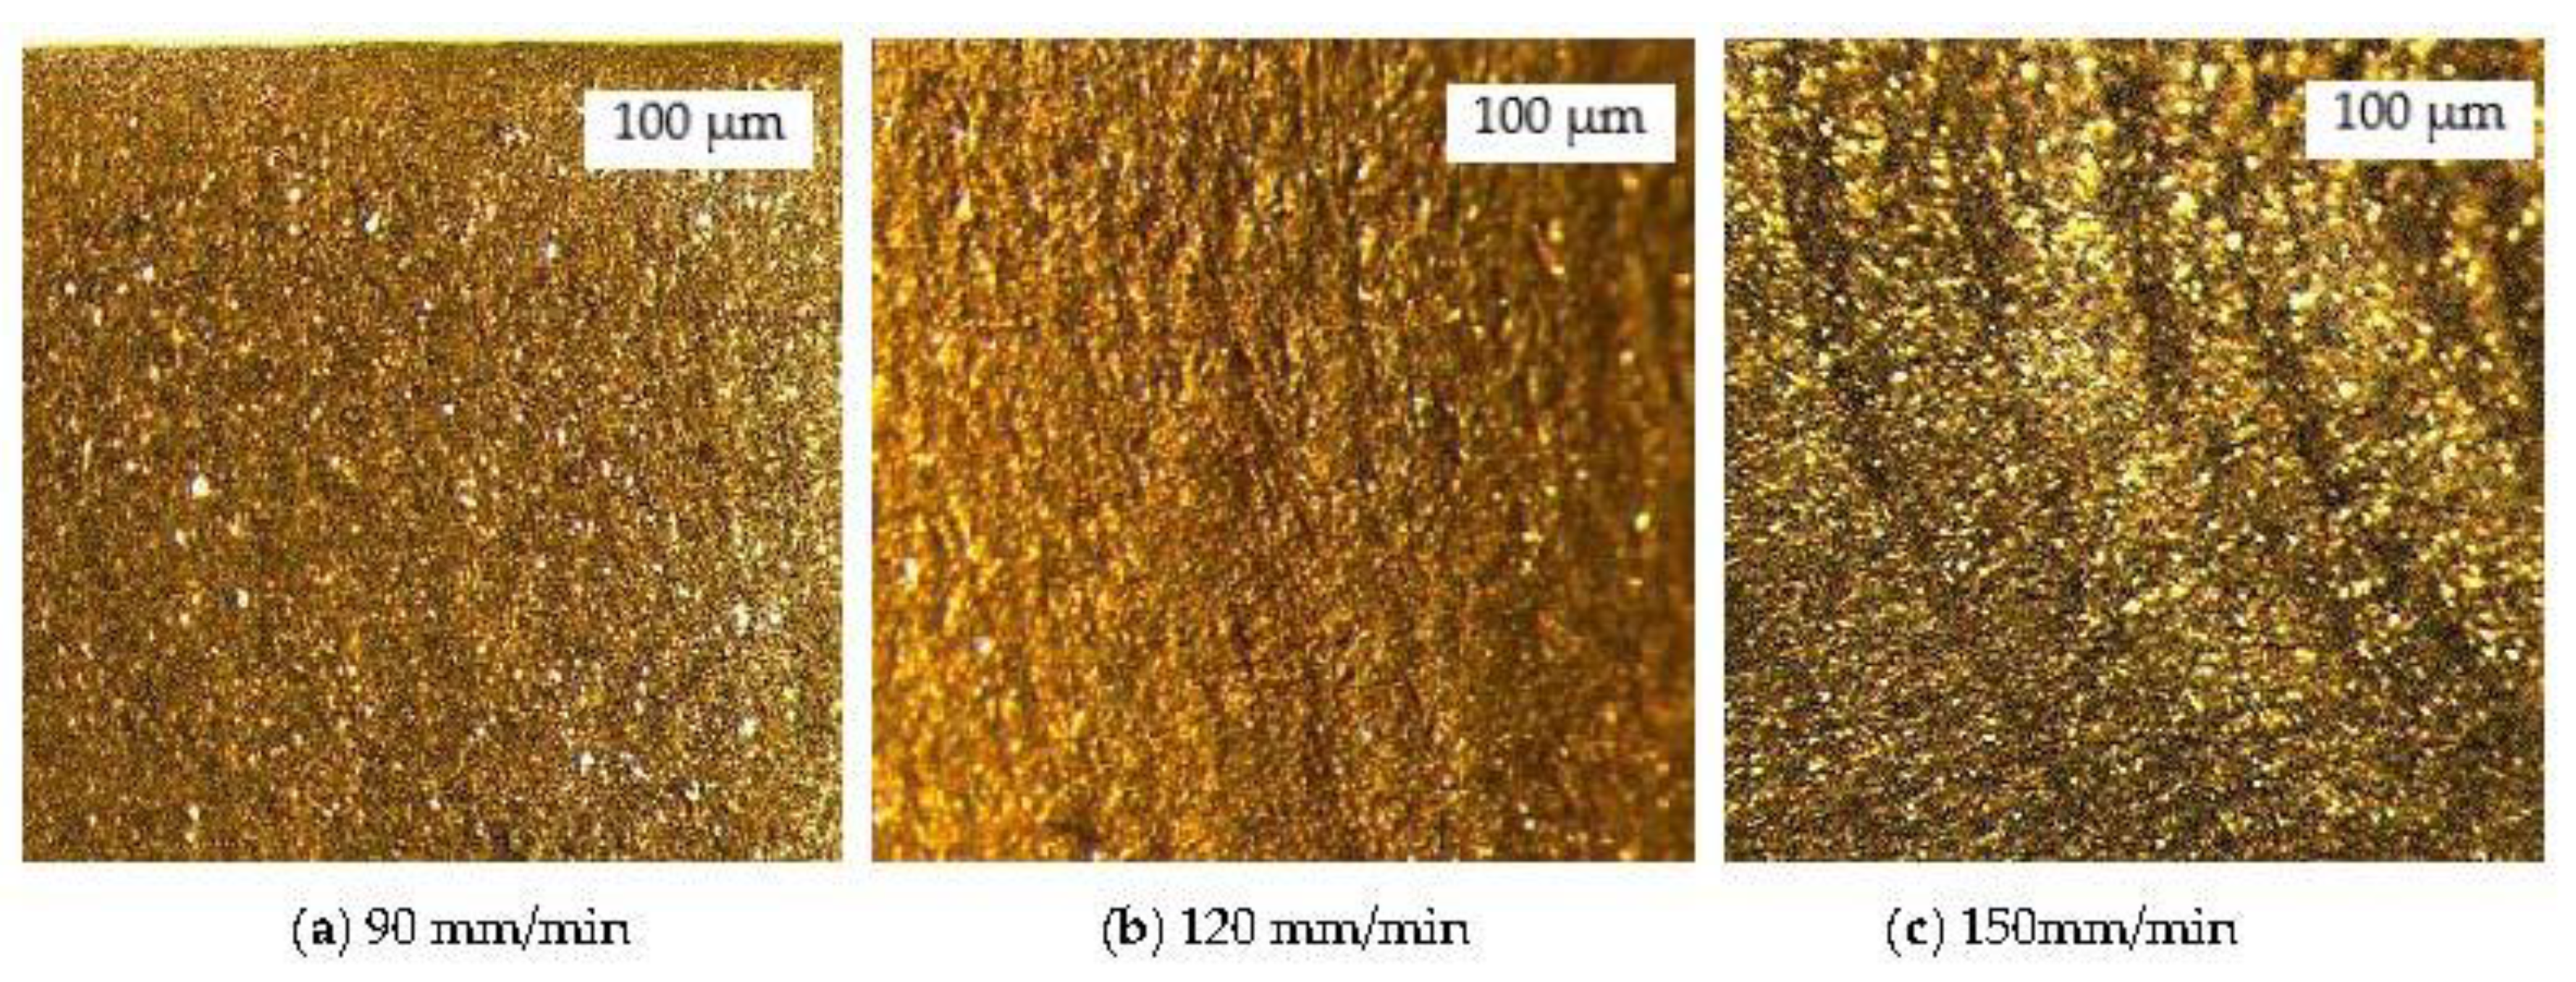
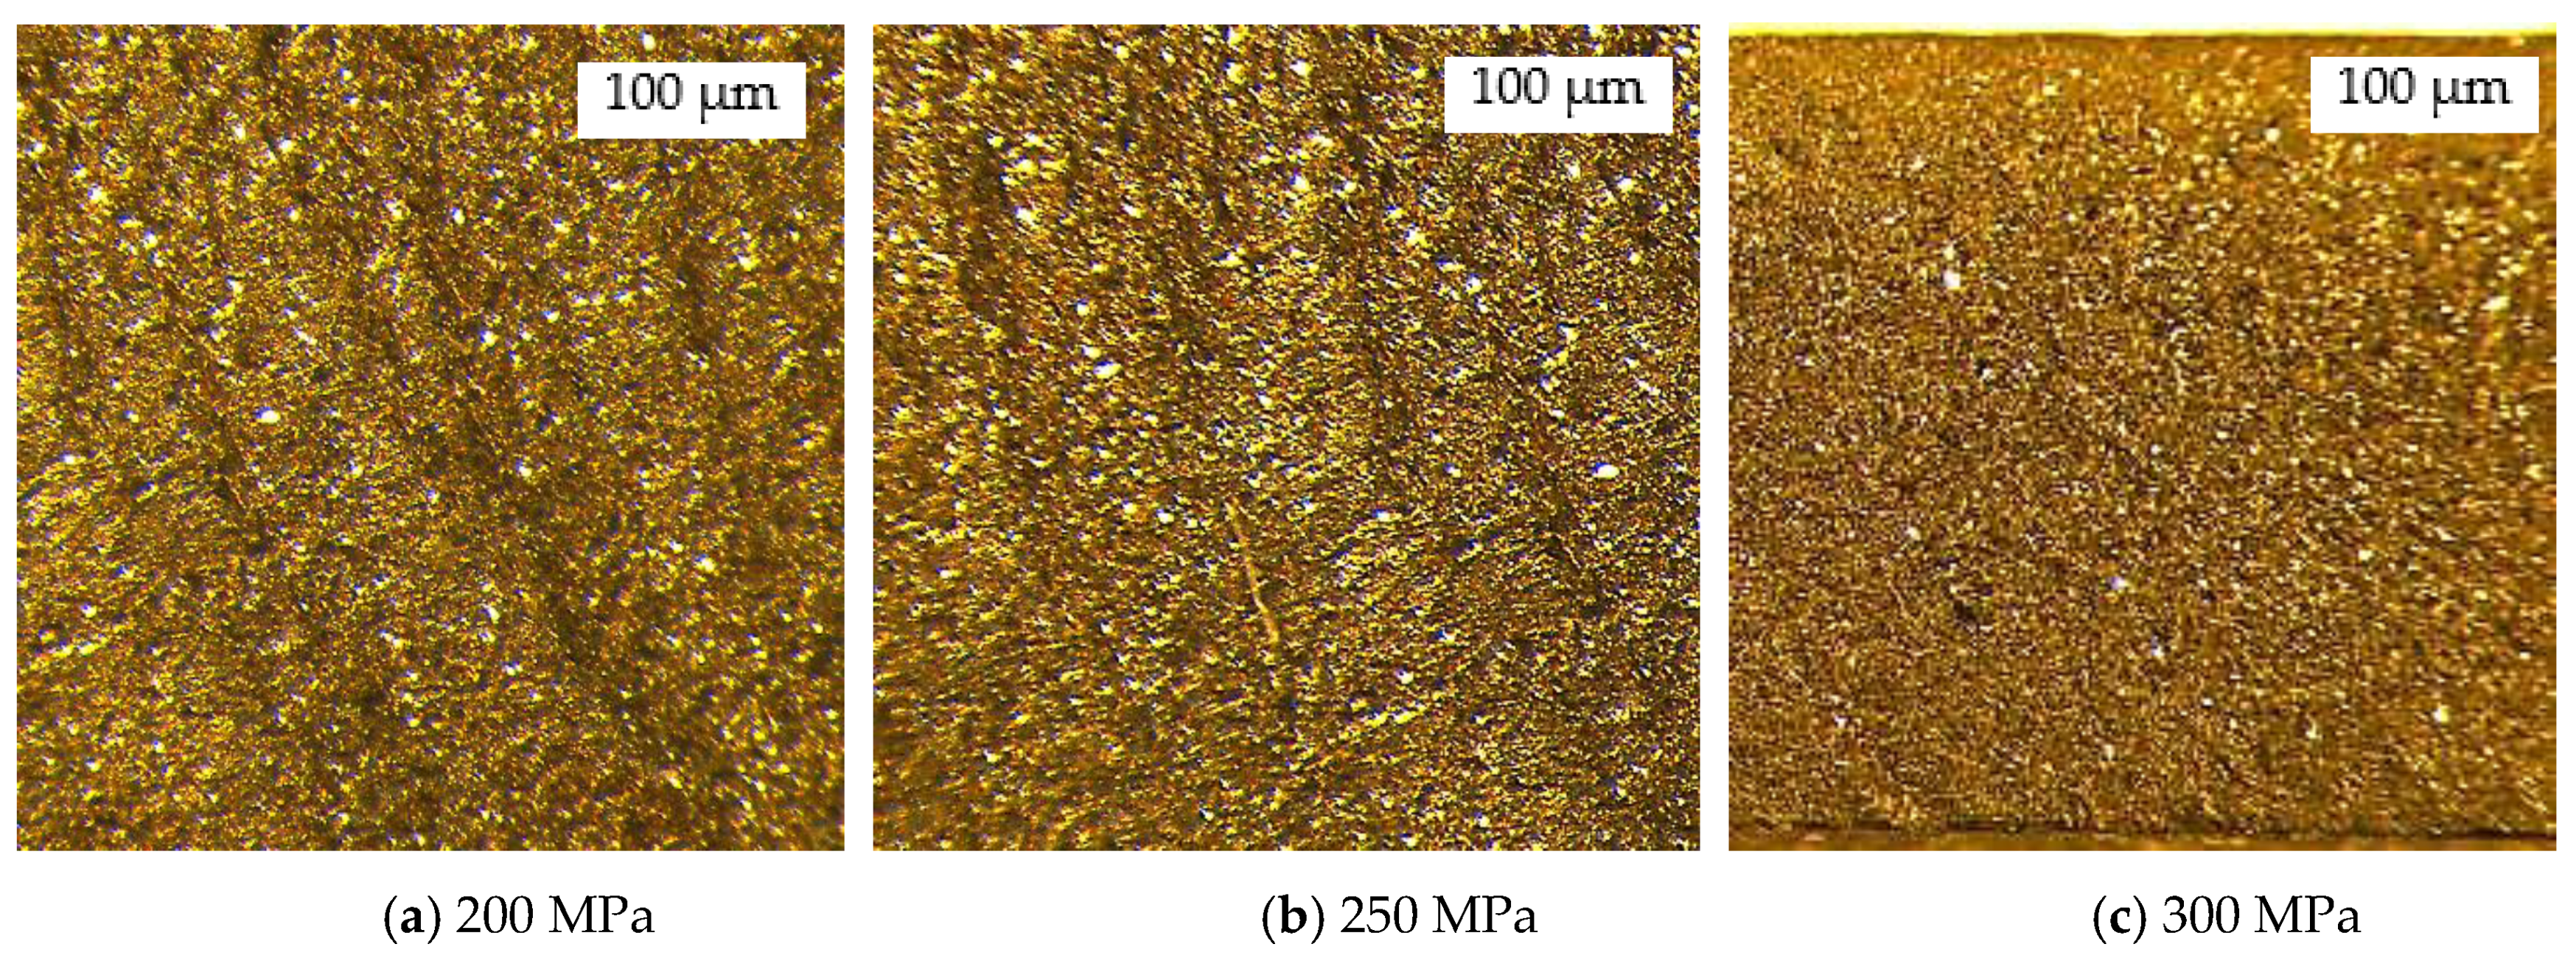
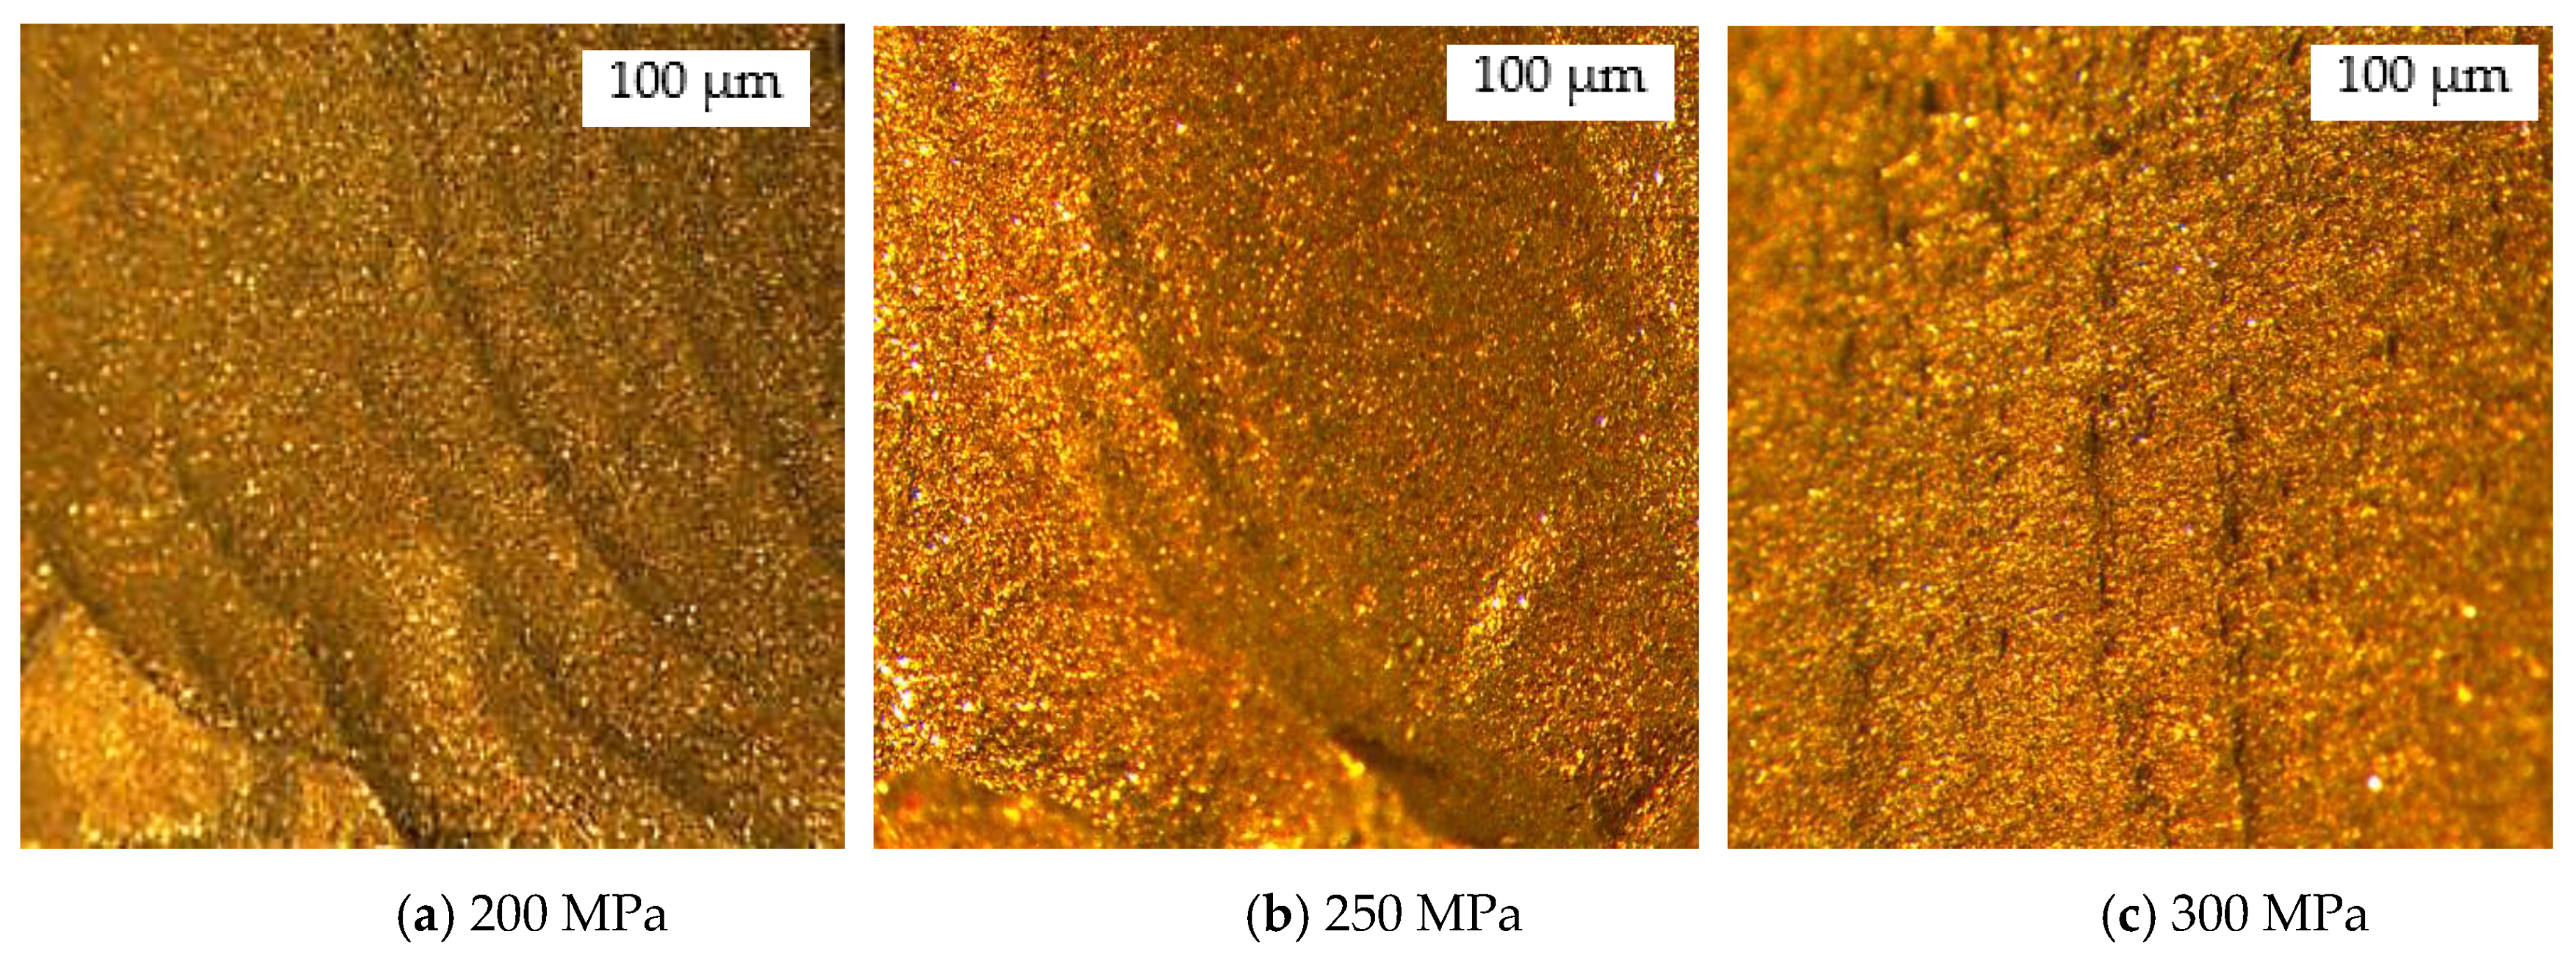
- An increasing level of waterjet pressure and abrasive mass flow rate denotes an improvement in contour cutting performance by decreasing the surface roughness. In contrast, an increasing speed of traverse and material thickness drives a negative impact, whereby it increases the roughness of the cut surface.
Author Contributions
Funding
Institutional Review Board Statement
Informed Consent Statement
Data Availability Statement
Acknowledgments
Conflicts of Interest
Abbreviations and Nomenclature
| Depth of cut | |
| ma | Abrasive mass flow rate |
| P | Water pressure |
| Ra | Surface roughness |
| Traverse speed | |
| Kerf width | |
| Kerf top width | |
| Kerf bottom width | |
| Thickness of the material | |
| AISI | Austenitic stainless steel |
| ANOVA | Analysis of variance |
| AWJM | Abrasive waterjet machining |
| MRR | Material removal rate |
Appendix A
| Exp. | Input Parameters | Signal to Noise Ratios (S/NR = dB) | ||||||||||||||
|---|---|---|---|---|---|---|---|---|---|---|---|---|---|---|---|---|
| No. | (mm) | (mm/min) | ma (g/min) | P (MPa) | Profiles | |||||||||||
| 1 | 2 | 3 | 4 | 5 | 6 | 7 | 8 | 9 | 10 | 11 | 12 | |||||
| 1 | 4 | 90 | 300 | 200 | −2.265 | −2.437 | −2.173 | −2.312 | −3.093 | −2.900 | −2.648 | −1.924 | −2.178 | −1.938 | −1.924 | −1.836 |
| 2 | 4 | 90 | 400 | 250 | −1.980 | −2.152 | −1.887 | −2.026 | −2.808 | −2.614 | −2.362 | −1.638 | −1.892 | −1.652 | −1.638 | −1.551 |
| 3 | 4 | 90 | 500 | 300 | −1.584 | −1.613 | −1.348 | −1.487 | −2.411 | −2.218 | −1.966 | −1.242 | −1.496 | −1.256 | −1.242 | −1.154 |
| 4 | 4 | 120 | 300 | 250 | −2.910 | −3.082 | −2.818 | −2.956 | −3.738 | −3.545 | −3.292 | −2.568 | −2.823 | −2.583 | −2.568 | −2.481 |
| 5 | 4 | 120 | 400 | 300 | −2.574 | −2.746 | −2.482 | −2.62 | −3.402 | −3.209 | −2.957 | −2.233 | −2.487 | −2.247 | −2.233 | −2.145 |
| 6 | 4 | 120 | 500 | 200 | −2.916 | −3.335 | −3.070 | −3.209 | −3.744 | −3.551 | −3.299 | −2.574 | −2.829 | −2.589 | −2.574 | −2.487 |
| 7 | 4 | 150 | 300 | 300 | −3.215 | −3.387 | −3.123 | −3.261 | −4.043 | −3.850 | −3.598 | −2.873 | −3.128 | −2.888 | −2.873 | −2.786 |
| 8 | 4 | 150 | 400 | 200 | −3.082 | −3.254 | −2.990 | −3.128 | −3.910 | −3.717 | −3.465 | −2.740 | −2.995 | −2.755 | −2.740 | −2.653 |
| 9 | 4 | 150 | 500 | 250 | −2.929 | −2.978 | −2.714 | −2.852 | −3.757 | −3.563 | −3.311 | −2.587 | −2.841 | −2.601 | −2.587 | −2.500 |
| 10 | 8 | 90 | 300 | 200 | −5.511 | −5.683 | −5.418 | −5.557 | −6.339 | −6.145 | −5.893 | −5.169 | −5.424 | −5.183 | −5.169 | −5.082 |
| 11 | 8 | 90 | 400 | 250 | −5.225 | −5.397 | −5.133 | −5.271 | −6.053 | −5.860 | −5.607 | −4.883 | −5.138 | −4.898 | −4.883 | −4.796 |
| 12 | 8 | 90 | 500 | 300 | −4.829 | −3.951 | −3.687 | −3.825 | −5.657 | −5.464 | −5.211 | −4.487 | −4.742 | −4.502 | −4.487 | −4.400 |
| 13 | 8 | 120 | 300 | 250 | −6.155 | −6.327 | −6.063 | −6.201 | −6.983 | −6.790 | −6.538 | −5.814 | −6.068 | −5.828 | −5.814 | −5.726 |
| 14 | 8 | 120 | 400 | 300 | −5.820 | −5.543 | −5.278 | −5.417 | −6.648 | −6.454 | −6.202 | −5.478 | −5.732 | −5.492 | −5.478 | −5.391 |
| 15 | 8 | 120 | 500 | 200 | −6.162 | −6.334 | −6.069 | −6.208 | −6.99 | −6.796 | −6.544 | −5.820 | −6.074 | −5.834 | −5.820 | −5.732 |
| 16 | 8 | 150 | 300 | 300 | −6.461 | −6.633 | −6.368 | −6.507 | −7.289 | −7.095 | −6.843 | −6.119 | −6.373 | −6.133 | −6.119 | −6.031 |
| 17 | 8 | 150 | 400 | 200 | −6.328 | −6.500 | −6.235 | −6.374 | −7.156 | −6.962 | −6.710 | −5.986 | −6.240 | −6.000 | −5.986 | −5.898 |
| 18 | 8 | 150 | 500 | 250 | −6.174 | −6.012 | −5.747 | −5.886 | −7.002 | −6.809 | −6.556 | −5.832 | −6.087 | −5.847 | −5.832 | −5.745 |
| 19 | 12 | 90 | 300 | 200 | −7.102 | −7.274 | −7.009 | −7.148 | −7.930 | −7.736 | −7.484 | −6.760 | −7.014 | −6.774 | −6.760 | −6.672 |
| 20 | 12 | 90 | 400 | 250 | −6.816 | −6.988 | −6.723 | −6.862 | −7.644 | −7.451 | −7.198 | −6.474 | −6.729 | −6.489 | −6.474 | −6.387 |
| 21 | 12 | 90 | 500 | 300 | −6.420 | −6.592 | −6.327 | −6.466 | −7.248 | −7.054 | −6.802 | −6.078 | −6.333 | −6.092 | −6.078 | −5.991 |
| 22 | 12 | 120 | 300 | 250 | −7.746 | −7.633 | −7.369 | −7.507 | −8.574 | −8.381 | −8.129 | −7.404 | −7.659 | −7.419 | −7.404 | −7.317 |
| 23 | 12 | 120 | 400 | 300 | −7.411 | −7.265 | −7.000 | −7.139 | −8.238 | −8.045 | −7.793 | −7.069 | −7.323 | −7.083 | −7.069 | −6.981 |
| 24 | 12 | 120 | 500 | 200 | −7.753 | −7.925 | −7.660 | −7.799 | −8.58 | −8.387 | −8.135 | −7.411 | −7.665 | −7.425 | −7.411 | −7.323 |
| 25 | 12 | 150 | 300 | 300 | −8.052 | −8.491 | −8.227 | −8.365 | −8.879 | −8.686 | −8.434 | −7.710 | −7.964 | −7.724 | −7.710 | −7.622 |
| 26 | 12 | 150 | 400 | 200 | −7.919 | −8.091 | −7.826 | −7.965 | −8.746 | −8.553 | −8.301 | −7.577 | −7.831 | −7.591 | −7.577 | −7.489 |
| 27 | 12 | 150 | 500 | 250 | −7.765 | −7.579 | −7.314 | −7.453 | −8.593 | −8.400 | −8.147 | −7.423 | −7.678 | −7.438 | −7.423 | −7.336 |
| Exp. | Input Parameters | Signal to Noise Ratios (S/NR = dB) | ||||||||||||||
|---|---|---|---|---|---|---|---|---|---|---|---|---|---|---|---|---|
| No. | (mm) | (mm/min) | ma (g/min) | P (MPa) | Profiles | |||||||||||
| 1 | 2 | 3 | 4 | 5 | 6 | 7 | 8 | 9 | 10 | 11 | 12 | |||||
| 1 | 4 | 90 | 300 | 200 | 47.00 | 46.60 | 46.50 | 46.90 | 46.50 | 47.10 | 47.00 | 47.50 | 46.90 | 46.40 | 46.70 | 46.50 |
| 2 | 4 | 90 | 400 | 250 | 47.10 | 47.10 | 46.50 | 47.40 | 47.00 | 47.90 | 47.80 | 48.20 | 47.70 | 46.40 | 47.50 | 47.30 |
| 3 | 4 | 90 | 500 | 300 | 47.10 | 48.20 | 46.60 | 46.80 | 48.00 | 48.10 | 47.80 | 48.20 | 47.60 | 46.50 | 47.40 | 47.20 |
| 4 | 4 | 120 | 300 | 250 | 50.90 | 50.50 | 50.30 | 50.80 | 50.40 | 51.00 | 50.90 | 51.30 | 50.80 | 50.30 | 50.60 | 50.40 |
| 5 | 4 | 120 | 400 | 300 | 51.10 | 50.90 | 50.50 | 50.80 | 50.70 | 50.80 | 50.50 | 50.90 | 50.40 | 50.40 | 50.10 | 49.90 |
| 6 | 4 | 120 | 500 | 200 | 51.00 | 51.50 | 50.40 | 51.80 | 51.50 | 52.00 | 52.00 | 52.40 | 51.80 | 50.30 | 51.60 | 51.40 |
| 7 | 4 | 150 | 300 | 300 | 52.30 | 51.90 | 51.80 | 52.20 | 51.80 | 52.40 | 52.10 | 52.50 | 52.00 | 51.70 | 51.70 | 51.50 |
| 8 | 4 | 150 | 400 | 200 | 52.10 | 51.80 | 51.50 | 52.10 | 51.70 | 52.10 | 52.00 | 52.50 | 51.90 | 51.50 | 51.70 | 51.50 |
| 9 | 4 | 150 | 500 | 250 | 52.30 | 51.80 | 51.70 | 52.00 | 51.70 | 52.10 | 52.00 | 52.40 | 51.90 | 51.60 | 51.60 | 51.50 |
| 10 | 8 | 90 | 300 | 200 | 51.70 | 51.30 | 51.10 | 51.50 | 51.20 | 51.80 | 51.70 | 52.10 | 51.60 | 51.00 | 51.30 | 51.10 |
| 11 | 8 | 90 | 400 | 250 | 51.70 | 51.50 | 51.10 | 51.90 | 51.40 | 52.00 | 51.90 | 52.40 | 51.80 | 51.00 | 51.60 | 51.40 |
| 12 | 8 | 90 | 500 | 300 | 51.60 | 52.10 | 51.10 | 51.30 | 51.90 | 52.00 | 51.70 | 52.10 | 51.60 | 51.00 | 51.30 | 51.10 |
| 13 | 8 | 120 | 300 | 250 | 53.20 | 52.80 | 52.70 | 53.20 | 52.70 | 53.30 | 53.20 | 53.60 | 53.10 | 52.60 | 52.80 | 52.70 |
| 14 | 8 | 120 | 400 | 300 | 53.40 | 53.20 | 52.80 | 53.10 | 53.00 | 53.10 | 52.70 | 53.10 | 52.60 | 52.70 | 52.40 | 52.20 |
| 15 | 8 | 120 | 500 | 200 | 53.50 | 52.80 | 52.90 | 53.10 | 52.70 | 53.30 | 53.20 | 53.70 | 53.10 | 52.80 | 52.90 | 52.70 |
| 16 | 8 | 150 | 300 | 300 | 56.30 | 55.90 | 55.80 | 56.00 | 55.70 | 55.80 | 55.50 | 55.90 | 55.40 | 55.70 | 55.10 | 55.00 |
| 17 | 8 | 150 | 400 | 200 | 56.70 | 56.40 | 56.10 | 56.70 | 56.30 | 56.90 | 56.80 | 57.20 | 56.70 | 56.00 | 56.50 | 56.30 |
| 18 | 8 | 150 | 500 | 250 | 56.70 | 56.90 | 56.20 | 57.20 | 56.80 | 57.40 | 57.30 | 57.70 | 57.20 | 56.10 | 56.90 | 56.70 |
| 19 | 12 | 90 | 300 | 200 | 52.60 | 52.20 | 52.00 | 52.50 | 52.10 | 52.70 | 52.60 | 53.00 | 52.50 | 51.90 | 52.30 | 52.10 |
| 20 | 12 | 90 | 400 | 250 | 52.60 | 52.40 | 52.10 | 52.80 | 52.40 | 53.00 | 52.90 | 53.30 | 52.80 | 52.00 | 52.50 | 52.30 |
| 21 | 12 | 90 | 500 | 300 | 52.70 | 53.10 | 52.10 | 52.40 | 52.90 | 53.00 | 52.70 | 53.10 | 52.50 | 52.10 | 52.30 | 52.10 |
| 22 | 12 | 120 | 300 | 250 | 56.50 | 56.10 | 55.90 | 56.40 | 56.00 | 56.60 | 56.50 | 56.90 | 56.40 | 55.80 | 56.10 | 56.00 |
| 23 | 12 | 120 | 400 | 300 | 56.70 | 56.40 | 56.10 | 56.30 | 56.20 | 56.30 | 55.90 | 56.40 | 55.80 | 56.00 | 55.60 | 55.40 |
| 24 | 12 | 120 | 500 | 200 | 56.50 | 56.00 | 56.00 | 56.30 | 55.90 | 56.50 | 56.40 | 56.80 | 56.30 | 55.90 | 56.10 | 55.90 |
| 25 | 12 | 150 | 300 | 300 | 57.90 | 57.50 | 57.30 | 57.70 | 57.30 | 57.90 | 57.60 | 58.20 | 57.60 | 57.20 | 57.20 | 57.00 |
| 26 | 12 | 150 | 400 | 200 | 57.70 | 57.40 | 57.10 | 57.60 | 57.30 | 57.40 | 57.30 | 57.70 | 57.20 | 57.00 | 56.90 | 56.80 |
| 27 | 12 | 150 | 500 | 250 | 57.90 | 57.20 | 57.30 | 57.60 | 57.10 | 57.80 | 57.60 | 58.20 | 57.60 | 57.20 | 57.40 | 57.20 |
| Profile 1 | Profile 2 | Profile 3 | Profile 4 | |||||||||||||
|---|---|---|---|---|---|---|---|---|---|---|---|---|---|---|---|---|
| Level | ma | P | ma | P | ma | P | ma | P | ||||||||
| 1 | −2.606 | −4.637 | −5.491 | −5.449 | −2.776 | −4.676 | −5.661 | −5.648 | −2.512 | −4.412 | −5.396 | −5.383 | −2.650 | −4.550 | −5.535 | −5.522 |
| 2 | −5.852 | −5.494 | −5.239 | −5.300 | −5.820 | −5.577 | −5.326 | −5.350 | −5.555 | −5.312 | −5.062 | −5.085 | −5.694 | −5.451 | −5.200 | −5.224 |
| 3 | −7.442 | −5.769 | −5.170 | −5.152 | −7.537 | −5.881 | −5.146 | −5.136 | −7.273 | −5.616 | −4.882 | −4.871 | −7.411 | −5.755 | −5.020 | −5.010 |
| Delta | 4.836 | 1.133 | 0.321 | 0.297 | 4.761 | 1.204 | 0.515 | 0.512 | 4.761 | 1.204 | 0.515 | 0.512 | 4.761 | 1.204 | 0.515 | 0.512 |
| Rank | 1 | 2 | 3 | 4 | 1 | 2 | 3 | 4 | 1 | 2 | 3 | 4 | 1 | 2 | 3 | 4 |
| Profile 5 | Profile 6 | Profile 7 | Profile 8 | |||||||||||||
| Level | ma | P | ma | P | ma | P | ma | P | ||||||||
| 1 | −3.434 | −5.465 | −6.319 | −6.276 | −3.241 | −5.271 | −6.125 | −6.083 | −2.989 | −5.019 | −5.873 | −5.831 | −2.264 | −4.295 | −5.149 | −5.107 |
| 2 | −6.679 | −6.322 | −6.067 | −6.128 | −6.486 | −6.129 | −5.874 | −5.935 | −6.234 | −5.876 | −5.622 | −5.682 | −5.510 | −5.152 | −4.897 | −4.958 |
| 3 | −8.270 | −6.597 | −5.998 | −5.979 | −8.077 | −6.404 | −5.805 | −5.786 | −7.825 | −6.152 | −5.552 | −5.534 | −7.101 | −5.427 | −4.828 | −4.810 |
| Delta | 4.836 | 1.133 | 0.321 | 0.297 | 4.836 | 1.133 | 0.321 | 0.297 | 4.836 | 1.133 | 0.321 | 0.297 | 4.836 | 1.133 | 0.321 | 0.297 |
| Rank | 1 | 2 | 3 | 4 | 1 | 2 | 3 | 4 | 1 | 2 | 3 | 4 | 1 | 2 | 3 | 4 |
| Profile 9 | Profile 10 | Profile 11 | Profile 12 | |||||||||||||
| Level | ma | P | ma | P | ma | P | ma | P | ||||||||
| 1 | −2.519 | −4.550 | −5.404 | −5.361 | −2.264 | −4.295 | −5.149 | −5.107 | −2.177 | −4.208 | −5.062 | −5.019 | −2.279 | −4.309 | −5.164 | −5.121 |
| 2 | −5.764 | −5.407 | −5.152 | −5.213 | −5.510 | −5.152 | −4.897 | −4.958 | −5.422 | −5.065 | −4.810 | −4.871 | −5.524 | −5.167 | −4.912 | −4.973 |
| 3 | −7.355 | −5.682 | −5.083 | −5.064 | −7.101 | −5.427 | −4.828 | −4.810 | −7.013 | −5.340 | −4.741 | −4.722 | −7.115 | −5.442 | −4.843 | −4.824 |
| Delta | 4.836 | 1.133 | 0.321 | 0.297 | 4.836 | 1.133 | 0.321 | 0.297 | 4.836 | 1.133 | 0.321 | 0.297 | 4.836 | 1.133 | 0.321 | 0.297 |
| Rank | 1 | 2 | 3 | 4 | 1 | 2 | 3 | 4 | 1 | 2 | 3 | 4 | 1 | 2 | 3 | 4 |
| Profile 1 | Profile 2 | Profile 3 | Profile 4 | |||||||||||||
|---|---|---|---|---|---|---|---|---|---|---|---|---|---|---|---|---|
| Level | ma | P | ma | P | ma | P | ma | P | ||||||||
| 1 | 50.10 | 50.46 | 53.16 | 52.44 | 50.05 | 50.50 | 52.76 | 52.28 | 49.53 | 49.90 | 52.59 | 51.87 | 50.09 | 50.38 | 52.99 | 52.42 |
| 2 | 53.87 | 53.64 | 53.22 | 53.04 | 53.66 | 53.36 | 53.02 | 52.66 | 53.30 | 53.07 | 52.66 | 52.47 | 53.77 | 53.53 | 53.18 | 52.95 |
| 3 | 55.68 | 55.55 | 53.26 | 54.17 | 55.37 | 55.21 | 53.30 | 54.14 | 55.11 | 54.98 | 52.69 | 53.61 | 55.50 | 55.44 | 53.18 | 53.98 |
| Delta | 5.58 | 5.08 | 0.10 | 1.74 | 5.32 | 4.71 | 0.54 | 1.86 | 5.58 | 5.08 | 0.10 | 1.74 | 5.41 | 5.06 | 0.20 | 1.55 |
| Rank | 1 | 2 | 4 | 3 | 1 | 2 | 4 | 3 | 1 | 2 | 4 | 3 | 1 | 2 | 4 | 3 |
| Profile 5 | Profile 6 | Profile 7 | Profile 8 | |||||||||||||
| Level | ma | P | ma | P | ma | P | ma | P | ||||||||
| 1 | 49.92 | 50.37 | 52.63 | 52.18 | 50.41 | 50.85 | 53.18 | 52.64 | 50.23 | 50.68 | 53.01 | 52.52 | 50.65 | 51.09 | 53.45 | 52.94 |
| 2 | 53.53 | 53.23 | 52.89 | 52.56 | 53.96 | 53.67 | 53.28 | 53.12 | 53.79 | 53.49 | 53.11 | 53.00 | 54.20 | 53.91 | 53.53 | 53.42 |
| 3 | 55.24 | 55.08 | 53.17 | 53.95 | 55.69 | 55.54 | 53.59 | 54.30 | 55.51 | 55.37 | 53.42 | 54.01 | 55.96 | 55.81 | 53.83 | 54.44 |
| Delta | 5.32 | 4.71 | 0.54 | 1.77 | 5.28 | 4.69 | 0.41 | 1.67 | 5.28 | 4.69 | 0.41 | 1.49 | 5.30 | 4.72 | 0.38 | 1.50 |
| Rank | 1 | 2 | 4 | 3 | 1 | 2 | 4 | 3 | 1 | 2 | 4 | 3 | 1 | 2 | 4 | 3 |
| Profile 9 | Profile 10 | Profile 11 | Profile 12 | |||||||||||||
| Level | ma | P | ma | P | ma | P | ma | P | ||||||||
| 1 | 50.11 | 50.56 | 52.91 | 52.41 | 49.45 | 49.81 | 52.51 | 51.78 | 49.88 | 50.32 | 52.65 | 52.17 | 49.70 | 50.14 | 52.47 | 51.98 |
| 2 | 53.67 | 53.37 | 52.99 | 52.89 | 53.22 | 52.98 | 52.57 | 52.38 | 53.43 | 53.13 | 52.75 | 52.65 | 53.25 | 52.95 | 52.57 | 52.46 |
| 3 | 55.42 | 55.27 | 53.30 | 53.91 | 55.02 | 54.89 | 52.61 | 53.52 | 55.16 | 55.01 | 53.06 | 53.65 | 54.97 | 54.83 | 52.88 | 53.47 |
| Delta | 5.30 | 4.72 | 0.38 | 1.50 | 5.58 | 5.08 | 0.10 | 1.74 | 5.28 | 4.69 | 0.41 | 1.49 | 5.28 | 4.69 | 0.41 | 1.49 |
| Rank | 1 | 2 | 4 | 3 | 1 | 2 | 4 | 3 | 1 | 2 | 4 | 3 | 1 | 2 | 4 | 3 |
References
- Miao, X.; Wu, M.; Qiang, Z.; Wang, Q.; Miao, X. Study on optimization of a simulation method for abrasive water jet machining. Int. J. Adv. Manuf. Technol. 2017, 93, 587–593. [Google Scholar] [CrossRef]
- Alsoufi, M.S. State-of-the-art in abrasive water jet cutting technology and the promise for micro-and nano-machining. Int. J. Mech. Eng. Appl. 2017, 5, 1. [Google Scholar] [CrossRef] [Green Version]
- El-Domiaty, A.; Shabara, M.; Abdel-Rahman, A.; Al-Sabeeh, A. On the modelling of abrasive waterjet cutting. Int. J. Adv. Manuf. Technol. 1996, 12, 255–265. [Google Scholar] [CrossRef]
- Radovanovic, M. Multi-Objective Optimization of Abrasive Water Jet Cutting Using MOGA. Procedia Manuf. 2020, 47, 781–787. [Google Scholar] [CrossRef]
- Kechagias, J.; Petropoulos, G.; Vaxevanidis, N. Application of Taguchi design for quality characterization of abrasive water jet machining of TRIP sheet steels. Int. J. Adv. Manuf. Technol. 2012, 62, 635–643. [Google Scholar] [CrossRef]
- Veerappan, G.; Ravichandran, M. Experimental investigations on abrasive water jet machining of nickel-based superalloy. J. Braz. Soc. Mech. Sci. Eng. 2019, 41, 1–12. [Google Scholar] [CrossRef]
- Begic-Hajdarevic, D.; Cekic, A.; Mehmedovic, M.; Djelmic, A. Experimental study on surface roughness in abrasive water jet cutting. Procedia Eng. 2015, 100, 394–399. [Google Scholar] [CrossRef] [Green Version]
- Bhandarkar, V.; Singh, V.; Gupta, T. Experimental analysis and characterization of abrasive water jet machining of Inconel 718. Mater. Today Proc. 2020, 23, 647–650. [Google Scholar] [CrossRef]
- Lehocka, D.; Botko, F.; Klich, J.; Sitek, L.; Hvizdos, P.; Fides, M.; Cep, R. Effect of pulsating water jet disintegration on hardness and elasticity modulus of austenitic stainless steel AISI 304L. Int. J. Adv. Manuf. Technol. 2020, 107, 1–12. [Google Scholar] [CrossRef]
- Supriya, S.; Srinivas, S. Machinability studies on stainless steel by abrasive water jet-Review. Mater. Today Proc. 2018, 5, 2871–2876. [Google Scholar] [CrossRef]
- Desu, R.K.; Krishnamurthy, H.N.; Balu, A.; Gupta, A.K.; Singh, S.K. Mechanical properties of Austenitic Stainless Steel 304L and 316L at elevated temperatures. J. Mater. Res. Technol. 2016, 5, 13–20. [Google Scholar] [CrossRef] [Green Version]
- Barabas, S.A.; Florescu, A. Optimization Method of Abrasive Water Jet Cutting of Welded Overlay Materials. Metals 2019, 9, 1046. [Google Scholar] [CrossRef] [Green Version]
- Kuntoğlu, M.; Acar, O.; Gupta, M.K.; Sağlam, H.; Sarikaya, M.; Giasin, K.; Pimenov, D.Y. Parametric Optimization for Cutting Forces and Material Removal Rate in the Turning of AISI 5140. Machines 2021, 9, 90. [Google Scholar] [CrossRef]
- Kuntoğlu, M.; Aslan, A.; Pimenov, D.Y.; Giasin, K.; Mikolajczyk, T.; Sharma, S. Modeling of cutting parameters and tool geometry for multi-criteria optimization of surface roughness and vibration via response surface methodology in turning of AISI 5140 steel. Materials 2020, 13, 4242. [Google Scholar] [CrossRef]
- Natarajan, Y.; Murugesan, P.K.; Mohan, M.; Khan, S.A.L.A. Abrasive Water Jet Machining process: A state of art of review. J. Manuf. Process. 2020, 49, 271–322. [Google Scholar] [CrossRef]
- Aamir, M.; Giasin, K.; Tolouei-Rad, M.; Vafadar, A. A review: Drilling performance and hole quality of aluminium alloys for aerospace applications. J. Mater. Res. Technol. 2020, 9, 12484–12500. [Google Scholar] [CrossRef]
- Sutowska, M.; Kapłonek, W.; Pimenov, D.Y.; Gupta, M.K.; Mia, M.; Sharma, S. Influence of variable radius of cutting head trajectory on quality of cutting kerf in the abrasive water jet process for soda–lime glass. Materials 2020, 13, 4277. [Google Scholar] [CrossRef]
- Liu, X.; Liang, Z.; Wen, G.; Yuan, X. Waterjet machining and research developments: A review. Int. J. Adv. Manuf. Technol. 2019, 102, 1257–1335. [Google Scholar] [CrossRef]
- Singh, D.; Chaturvedi, V. Investigation of optimal processing condition for abrasive water jet machining for stainless steel AISI 304 using grey relational analysis coupled with S/N ratio. Appl. Mech. Mater. 2014, 592–594, 438–443. [Google Scholar] [CrossRef]
- Löschner, P.; Jarosz, K.; Niesłony, P. Investigation of the effect of cutting speed on surface quality in abrasive water jet cutting of 316L stainless steel. Procedia Eng. 2016, 149, 276–282. [Google Scholar] [CrossRef] [Green Version]
- Karthik, K.; Sundarsingh, D.S.; Harivignesh, M.; Karthick, R.G.; Praveen, M. Optimization of machining parameters in abrasive water jet cutting of stainless steel 304. Mater. Today Proc. 2021, 46, 1384–1389. [Google Scholar] [CrossRef]
- Kmec, J.; Gombár, M.; Harničárová, M.; Valíček, J.; Kušnerová, M.; Kříž, J.; Kadnár, M.; Karková, M.; Vagaská, A. The Predictive Model of Surface Texture Generated by Abrasive Water Jet for Austenitic Steels. Appl. Sci. 2020, 10, 3159. [Google Scholar] [CrossRef]
- Hlaváč, L.M.; Hlaváčová, I.M.; Geryk, V.; Plančár, Š. Investigation of the taper of kerfs cut in steels by AWJ. Int. J. Adv. Manuf. Technol. 2015, 77, 1811–1818. [Google Scholar] [CrossRef]
- Aamir, M.; Tu, S.; Tolouei-Rad, M.; Giasin, K.; Vafadar, A. Optimization and modeling of process parameters in multi-hole simultaneous drilling using taguchi method and fuzzy logic approach. Materials 2020, 13, 680. [Google Scholar] [CrossRef] [PubMed] [Green Version]
- Lin, C. Use of the Taguchi method and grey relational analysis to optimize turning operations with multiple performance characteristics. Mater. Manuf. Process. 2004, 19, 209–220. [Google Scholar] [CrossRef]
- Maneiah, D.; Shunmugasundaram, M.; Reddy, A.R.; Begum, Z. Optimization of machining parameters for surface roughness during abrasive water jet machining of aluminium/magnesium hybrid metal matrix composites. Mater. Today Proc. 2020, 27, 1293–1298. [Google Scholar] [CrossRef]
- Sharma, M.K.; Chaudhary, H.; Kumar, A. Optimization of abrasive waterjet machining process parameters on aluminium AL-6061. Int. J. Sci. Res. 2017, 6, 869–874. [Google Scholar]
- Otto, K.N.; Antonsson, E.K. Extensions to the Taguchi method of product design. J. Mech. Des. 1993, 115, 5–13. [Google Scholar] [CrossRef] [Green Version]
- Jiang, W.; Cao, Y.; Jiang, Y.; Liu, Y.; Mao, Q.; Zhou, H.; Liao, X.; Zhao, Y. Effects of nanostructural hierarchy on the hardness and thermal stability of an austenitic stainless steel. J. Mater. Res. Technol. 2021, 12, 376–384. [Google Scholar] [CrossRef]
- Kaladhar, M.; Subbaiah, K.V.; Rao, C.S. Machining of austenitic stainless steels—A review. Int. J. Mach. Mach. Mater. 2012, 12, 178–192. [Google Scholar] [CrossRef]
- Ramana, M.V.; Kumar, B.R.; Krishna, M.; Rao, M.V.; Kumar, V. Optimization and influence of process parameters of dissimilar SS304L–SS430 joints produced by Robotic TIG welding. Mater. Today Proc. 2020, 23, 479–482. [Google Scholar] [CrossRef]
- Llanto, J.M.; Tolouei-Rad, M.; Vafadar, A.; Aamir, M. Impacts of Traverse Speed and Material Thickness on Abrasive Waterjet Contour Cutting of Austenitic Stainless Steel AISI 304L. Appl. Sci. 2021, 11, 4925. [Google Scholar] [CrossRef]
- Wang, S.; Zhang, S.; Wu, Y.; Yang, F. A key parameter to characterize the kerf profile error generated by abrasive water-jet. Int. J. Adv. Manuf. Technol. 2017, 90, 1265–1275. [Google Scholar] [CrossRef]
- Pawar, P.J.; Vidhate, U.S.; Khalkar, M.Y. Improving the quality characteristics of abrasive water jet machining of marble material using multi-objective artificial bee colony algorithm. J. Comput. Des. Eng. 2018, 5, 319–328. [Google Scholar] [CrossRef]
- Hlavac, L.M.; Hlavacova, I.M.; Arleo, F.; Vigano, F.; Annoni, M.P.G.; Geryk, V. Shape distortion reduction method for abrasive water jet (AWJ) cutting. Precis. Eng. 2018, 53, 194–202. [Google Scholar] [CrossRef]
- Kumar, R.; Chattopadhyaya, S.; Dixit, A.R.; Bora, B.; Zelenak, M.; Foldyna, J.; Hloch, S.; Hlavacek, P.; Scucka, J.; Klich, J. Surface integrity analysis of abrasive water jet-cut surfaces of friction stir welded joints. Int. J. Adv. Manuf. Technol. 2017, 88, 1687–1701. [Google Scholar] [CrossRef]
- Uthayakumar, M.; Khan, M.A.; Kumaran, S.T.; Slota, A.; Zajac, J. Machinability of nickel-based superalloy by abrasive water jet machining. Mater. Manuf. Process. 2016, 31, 1733–1739. [Google Scholar] [CrossRef]
- Rao, R.V.; Rai, D.P.; Balic, J. Multi-objective optimization of abrasive waterjet machining process using Jaya algorithm and PROMETHEE Method. J. Intell. Manuf. 2019, 30, 2101–2127. [Google Scholar] [CrossRef]
- Khan, M.A.; Gupta, K. Machinability Studies on Abrasive Water Jet Machining of Low Alloy Steel for Different Thickness. IOP Conf. Ser. Mater. Sci. Eng. 2020, 709, 044099. [Google Scholar] [CrossRef]
- Llanto, J.M.; Tolouei-Rad, M.; Vafadar, A.; Aamir, M. Recent Progress Trend on Abrasive Waterjet Cutting of Metallic Materials: A Review. Appl. Sci. 2021, 11, 3344. [Google Scholar] [CrossRef]
- Gnanavelbabu, A.; Saravanan, P.; Rajkumar, K.; Karthikeyan, S. Experimental investigations on multiple responses in abrasive waterjet machining of Ti-6Al-4V alloy. Mater. Today Proc. 2018, 5, 13413–13421. [Google Scholar] [CrossRef]
- Barad, M. Taguchi Experimental-Design Techniques—Revisited. In Transformation of Science and Technology into Productive Power, Supplement; Taylor & Francis Ltd.: Oxfordshire, UK, 1991; pp. 1101–1104. [Google Scholar]
- Patel Gowdru Chandrashekarappa, M.; Kumar, S.; Pimenov, D.Y.; Giasin, K. Experimental Analysis and Optimization of EDM Parameters on HcHcr Steel in Context with Different Electrodes and Dielectric Fluids Using Hybrid Taguchi-Based PCA-Utility and CRITIC-Utility Approaches. Metals 2021, 11, 419. [Google Scholar] [CrossRef]
- Aamir, M.; Tolouei-Rad, M.; Giasin, K.; Vafadar, A. Machinability of Al2024, Al6061, and Al5083 alloys using multi-hole simultaneous drilling approach. J. Mater. Res. Technol. 2020, 9, 10991–11002. [Google Scholar] [CrossRef]
- Aamir, M.; Giasin, K.; Tolouei-Rad, M.; Ud Din, I.; Hanif, M.I.; Kuklu, U.; Pimenov, D.Y.; Ikhlaq, M. Effect of Cutting Parameters and Tool Geometry on the Performance Analysis of One-Shot Drilling Process of AA2024-T3. Metals 2021, 11, 854. [Google Scholar] [CrossRef]
- Aamir, M.; Tolouei-Rad, M.; Giasin, K.; Vafadar, A. Feasibility of tool configuration and the effect of tool material, and tool geometry in multi-hole simultaneous drilling of Al2024. Int. J. Adv. Manuf. Technol. 2020, 111, 861–879. [Google Scholar] [CrossRef]
- Sasikumar, K.; Arulshri, K.; Ponappa, K.; Uthayakumar, M. A study on kerf characteristics of hybrid aluminium 7075 metal matrix composites machined using abrasive water jet machining technology. Proc. Inst. Mech. Eng. Part B J. Eng. Manuf. 2018, 232, 690–704. [Google Scholar] [CrossRef]
- Yu, Y.; Sun, T.; Yuan, Y.; Gao, H.; Wang, X. Experimental investigation into the effect of abrasive process parameters on the cutting performance for abrasive waterjet technology: A case study. Int. J. Adv. Manuf. Technol. 2020, 107, 2757–2765. [Google Scholar] [CrossRef]
- Selvan, M.C.P.; Raju, N.M.S.; Sachidananda, H. Effects of process parameters on surface roughness in abrasive waterjet cutting of aluminium. Front. Mech. Eng. 2012, 7, 439–444. [Google Scholar] [CrossRef]
- Thamizhvalavan, P.; Arivazhagan, S.; Yuvaraj, N.; Ramesh, B. Machinability study of abrasive aqua jet parameters on hybrid metal matrix composite. Mater. Manuf. Process. 2019, 34, 321–344. [Google Scholar] [CrossRef]
- Ishfaq, K.; Ahmad Mufti, N.; Ahmed, N.; Pervaiz, S. Abrasive waterjet cutting of cladded material: Kerf taper and MRR analysis. Mater. Manuf. Process. 2019, 34, 544–553. [Google Scholar] [CrossRef]
- Hashish, M. Optimization Factors in Abrasive-Waterjet Machining. J. Eng. Ind. ASME 1991, 113, 29–37. [Google Scholar] [CrossRef]
- Liu, S.; Zhou, F.; Li, H.; Chen, Y.; Wang, F.; Guo, C. Experimental Investigation of Hard Rock Breaking Using a Conical Pick Assisted by Abrasive Water Jet. Rock Mech. Rock Eng. 2020, 59, 1–10. [Google Scholar] [CrossRef]


| Abrasive Waterjet Conditions | Details | Range/Values |
|---|---|---|
| OMAX MAXIEM 1515 | ||
| Max Pressure, MPA | 413.7 | |
| Max Traverse Speed, mm/min | 12,700 | |
| Table Size (L × W), mm | 2235 × 1727 | |
| XY Cutting Envelope, mm | 1575 × 1575 | |
| z-Axis travel, mm | 305 | |
| Variable cutting input parameters | ||
| Abrasive mass flow rate, g/min | 300, 400, 500 | |
| Waterjet pressure, MPa | 200, 250,300 | |
| Traverse speed, mm/min | 90, 120, 150 | |
| Material thickness, mm | 4, 8, 12 | |
| Constant cutting input parameters | ||
| Orifice diameter, mm | 2.8 | |
| Abrasive type | Garnet | |
| Abrasive mesh number, # | 80 | |
| Standoff distance, mm | 1.5 |
| Exp. | Input Parameters | |||
|---|---|---|---|---|
| No. | Material Thickness, (mm) | Traverse Speed, (mm/min) | Abrasive Mass Flow Rate, ma (g/min) | Waterjet Pressure, P (MPa) |
| 1 | 4 | 90 | 300 | 200 |
| 2 | 4 | 90 | 400 | 250 |
| 3 | 4 | 90 | 500 | 300 |
| 4 | 4 | 120 | 300 | 250 |
| 5 | 4 | 120 | 400 | 300 |
| 6 | 4 | 120 | 500 | 200 |
| 7 | 4 | 150 | 300 | 300 |
| 8 | 4 | 150 | 400 | 200 |
| 9 | 4 | 150 | 500 | 250 |
| 10 | 8 | 90 | 300 | 200 |
| 11 | 8 | 90 | 400 | 250 |
| 12 | 8 | 90 | 500 | 300 |
| 13 | 8 | 120 | 300 | 250 |
| 14 | 8 | 120 | 400 | 300 |
| 15 | 8 | 120 | 500 | 200 |
| 16 | 8 | 150 | 300 | 300 |
| 17 | 8 | 150 | 400 | 200 |
| 18 | 8 | 150 | 500 | 250 |
| 19 | 12 | 90 | 300 | 200 |
| 20 | 12 | 90 | 400 | 250 |
| 21 | 12 | 90 | 500 | 300 |
| 22 | 12 | 120 | 300 | 250 |
| 23 | 12 | 120 | 400 | 300 |
| 24 | 12 | 120 | 500 | 200 |
| 25 | 12 | 150 | 300 | 300 |
| 26 | 12 | 150 | 400 | 200 |
| 27 | 12 | 150 | 500 | 250 |
| Exp. | Input Parameters | Output Parameter (Ra = µm) | ||||||||||||||
|---|---|---|---|---|---|---|---|---|---|---|---|---|---|---|---|---|
| No. | (mm) | (mm/min) | ma (g/min) | P (MPa) | Profiles | |||||||||||
| 1 | 2 | 3 | 4 | 5 | 6 | 7 | 8 | 9 | 10 | 11 | 12 | |||||
| 1 | 4 | 90 | 300 | 200 | 1.298 | 1.324 | 1.284 | 1.305 | 1.428 | 1.396 | 1.356 | 1.248 | 1.285 | 1.250 | 1.248 | 1.235 |
| 2 | 4 | 90 | 400 | 250 | 1.256 | 1.281 | 1.243 | 1.263 | 1.382 | 1.351 | 1.313 | 1.208 | 1.243 | 1.210 | 1.208 | 1.195 |
| 3 | 4 | 90 | 500 | 300 | 1.200 | 1.204 | 1.168 | 1.187 | 1.320 | 1.291 | 1.254 | 1.154 | 1.188 | 1.156 | 1.154 | 1.142 |
| 4 | 4 | 120 | 300 | 250 | 1.398 | 1.426 | 1.383 | 1.405 | 1.538 | 1.504 | 1.461 | 1.344 | 1.384 | 1.346 | 1.344 | 1.331 |
| 5 | 4 | 120 | 400 | 300 | 1.345 | 1.372 | 1.331 | 1.352 | 1.480 | 1.447 | 1.406 | 1.293 | 1.332 | 1.295 | 1.293 | 1.280 |
| 6 | 4 | 120 | 500 | 200 | 1.399 | 1.468 | 1.424 | 1.447 | 1.539 | 1.505 | 1.462 | 1.345 | 1.385 | 1.347 | 1.345 | 1.332 |
| 7 | 4 | 150 | 300 | 300 | 1.448 | 1.477 | 1.433 | 1.456 | 1.593 | 1.558 | 1.513 | 1.392 | 1.434 | 1.394 | 1.392 | 1.378 |
| 8 | 4 | 150 | 400 | 200 | 1.426 | 1.455 | 1.411 | 1.434 | 1.569 | 1.534 | 1.490 | 1.371 | 1.412 | 1.373 | 1.371 | 1.357 |
| 9 | 4 | 150 | 500 | 250 | 1.401 | 1.409 | 1.367 | 1.389 | 1.541 | 1.507 | 1.464 | 1.347 | 1.387 | 1.349 | 1.347 | 1.333 |
| 10 | 8 | 90 | 300 | 200 | 1.886 | 1.924 | 1.866 | 1.896 | 2.075 | 2.029 | 1.971 | 1.813 | 1.867 | 1.816 | 1.813 | 1.795 |
| 11 | 8 | 90 | 400 | 250 | 1.825 | 1.861 | 1.806 | 1.835 | 2.007 | 1.963 | 1.907 | 1.755 | 1.807 | 1.757 | 1.755 | 1.737 |
| 12 | 8 | 90 | 500 | 300 | 1.744 | 1.576 | 1.529 | 1.553 | 1.918 | 1.876 | 1.822 | 1.676 | 1.726 | 1.679 | 1.676 | 1.660 |
| 13 | 8 | 120 | 300 | 250 | 2.031 | 2.072 | 2.010 | 2.042 | 2.234 | 2.185 | 2.123 | 1.953 | 2.011 | 1.956 | 1.953 | 1.933 |
| 14 | 8 | 120 | 400 | 300 | 1.954 | 1.893 | 1.836 | 1.866 | 2.150 | 2.102 | 2.042 | 1.879 | 1.935 | 1.882 | 1.879 | 1.860 |
| 15 | 8 | 120 | 500 | 200 | 2.033 | 2.073 | 2.011 | 2.044 | 2.236 | 2.187 | 2.124 | 1.954 | 2.012 | 1.958 | 1.954 | 1.935 |
| 16 | 8 | 150 | 300 | 300 | 2.104 | 2.146 | 2.082 | 2.115 | 2.314 | 2.263 | 2.199 | 2.023 | 2.083 | 2.026 | 2.023 | 2.003 |
| 17 | 8 | 150 | 400 | 200 | 2.072 | 2.113 | 2.050 | 2.083 | 2.279 | 2.229 | 2.165 | 1.992 | 2.051 | 1.995 | 1.992 | 1.972 |
| 18 | 8 | 150 | 500 | 250 | 2.036 | 1.998 | 1.938 | 1.969 | 2.239 | 2.19 | 2.127 | 1.957 | 2.015 | 1.960 | 1.957 | 1.938 |
| 19 | 12 | 90 | 300 | 200 | 2.265 | 2.310 | 2.241 | 2.277 | 2.492 | 2.437 | 2.367 | 2.178 | 2.242 | 2.181 | 2.178 | 2.156 |
| 20 | 12 | 90 | 400 | 250 | 2.192 | 2.236 | 2.169 | 2.203 | 2.411 | 2.358 | 2.290 | 2.107 | 2.170 | 2.111 | 2.107 | 2.086 |
| 21 | 12 | 90 | 500 | 300 | 2.094 | 2.136 | 2.072 | 2.105 | 2.303 | 2.253 | 2.188 | 2.013 | 2.073 | 2.017 | 2.013 | 1.993 |
| 22 | 12 | 120 | 300 | 250 | 2.440 | 2.408 | 2.336 | 2.373 | 2.684 | 2.625 | 2.549 | 2.345 | 2.415 | 2.349 | 2.345 | 2.322 |
| 23 | 12 | 120 | 400 | 300 | 2.347 | 2.308 | 2.239 | 2.275 | 2.582 | 2.525 | 2.453 | 2.256 | 2.324 | 2.260 | 2.256 | 2.234 |
| 24 | 12 | 120 | 500 | 200 | 2.441 | 2.490 | 2.415 | 2.454 | 2.685 | 2.626 | 2.551 | 2.347 | 2.417 | 2.351 | 2.347 | 2.324 |
| 25 | 12 | 150 | 300 | 300 | 2.527 | 2.658 | 2.578 | 2.620 | 2.780 | 2.718 | 2.641 | 2.429 | 2.502 | 2.433 | 2.429 | 2.405 |
| 26 | 12 | 150 | 400 | 200 | 2.488 | 2.538 | 2.462 | 2.502 | 2.737 | 2.677 | 2.600 | 2.392 | 2.464 | 2.396 | 2.392 | 2.368 |
| 27 | 12 | 150 | 500 | 250 | 2.445 | 2.393 | 2.321 | 2.359 | 2.689 | 2.630 | 2.555 | 2.350 | 2.420 | 2.354 | 2.350 | 2.327 |
| Exp. | Input Parameters | Output Parameter (MRR = mm³/min) | ||||||||||||||
|---|---|---|---|---|---|---|---|---|---|---|---|---|---|---|---|---|
| No. | (mm) | (mm/min) | ma (g/min) | P (MPa) | Profiles | |||||||||||
| 1 | 2 | 3 | 4 | 5 | 6 | 7 | 8 | 9 | 10 | 11 | 12 | |||||
| 1 | 4 | 90 | 300 | 200 | 224.50 | 214.20 | 210.30 | 220.70 | 212.10 | 227.10 | 224.80 | 236.10 | 221.90 | 208.20 | 215.80 | 211.30 |
| 2 | 4 | 90 | 400 | 250 | 225.60 | 225.30 | 211.30 | 234.30 | 223.10 | 248.60 | 246.10 | 258.40 | 242.90 | 209.20 | 236.20 | 231.30 |
| 3 | 4 | 90 | 500 | 300 | 227.40 | 257.00 | 213.00 | 219.40 | 250.60 | 254.40 | 244.30 | 256.00 | 240.60 | 210.90 | 234.50 | 229.60 |
| 4 | 4 | 120 | 300 | 250 | 351.10 | 335.10 | 328.90 | 348.50 | 331.70 | 355.20 | 351.60 | 369.20 | 347.00 | 325.60 | 337.50 | 330.50 |
| 5 | 4 | 120 | 400 | 300 | 358.20 | 351.90 | 335.50 | 345.60 | 343.10 | 348.30 | 334.40 | 350.50 | 329.40 | 332.20 | 321.00 | 314.30 |
| 6 | 4 | 120 | 500 | 200 | 353.60 | 377.50 | 331.20 | 388.80 | 373.70 | 400.10 | 396.10 | 415.90 | 391.00 | 327.90 | 380.30 | 372.30 |
| 7 | 4 | 150 | 300 | 300 | 413.00 | 395.00 | 386.90 | 406.50 | 387.00 | 418.70 | 401.90 | 421.20 | 395.90 | 383.00 | 385.80 | 377.80 |
| 8 | 4 | 150 | 400 | 200 | 403.40 | 390.00 | 377.80 | 401.70 | 386.10 | 404.00 | 400.00 | 420.00 | 394.80 | 374.10 | 384.00 | 376.00 |
| 9 | 4 | 150 | 500 | 250 | 411.70 | 390.90 | 385.60 | 398.50 | 385.10 | 401.80 | 397.80 | 417.70 | 392.60 | 381.80 | 381.90 | 373.90 |
| 10 | 8 | 90 | 300 | 200 | 383.40 | 365.90 | 359.20 | 376.90 | 362.30 | 387.90 | 384.00 | 403.20 | 379.00 | 355.60 | 368.70 | 361.00 |
| 11 | 8 | 90 | 400 | 250 | 384.70 | 377.20 | 360.40 | 392.20 | 373.40 | 399.80 | 395.80 | 415.60 | 390.60 | 356.80 | 380.00 | 372.00 |
| 12 | 8 | 90 | 500 | 300 | 381.10 | 403.80 | 357.00 | 367.70 | 393.70 | 399.70 | 383.70 | 402.20 | 378.00 | 353.50 | 368.40 | 360.70 |
| 13 | 8 | 120 | 300 | 250 | 458.20 | 437.30 | 429.20 | 454.80 | 432.90 | 461.50 | 456.90 | 479.80 | 451.00 | 424.90 | 438.60 | 429.50 |
| 14 | 8 | 120 | 400 | 300 | 467.40 | 456.10 | 437.80 | 450.90 | 444.70 | 451.50 | 433.40 | 454.20 | 427.00 | 433.40 | 416.10 | 407.40 |
| 15 | 8 | 120 | 500 | 200 | 472.00 | 437.50 | 442.20 | 450.60 | 433.10 | 463.80 | 459.10 | 482.10 | 453.20 | 437.70 | 440.80 | 431.60 |
| 16 | 8 | 150 | 300 | 300 | 656.00 | 626.10 | 614.50 | 632.90 | 610.40 | 619.80 | 595.00 | 623.60 | 586.20 | 608.30 | 571.20 | 559.30 |
| 17 | 8 | 150 | 400 | 200 | 682.20 | 661.10 | 639.00 | 680.90 | 654.50 | 700.80 | 693.80 | 728.40 | 684.70 | 632.70 | 666.00 | 652.10 |
| 18 | 8 | 150 | 500 | 250 | 687.50 | 696.20 | 644.00 | 724.00 | 689.20 | 737.90 | 730.60 | 767.10 | 721.10 | 637.60 | 701.30 | 686.70 |
| 19 | 12 | 90 | 300 | 200 | 426.50 | 407.10 | 399.50 | 419.30 | 403.00 | 431.50 | 427.20 | 448.50 | 421.60 | 395.50 | 410.10 | 401.60 |
| 20 | 12 | 90 | 400 | 250 | 428.60 | 419.10 | 401.50 | 435.90 | 414.90 | 444.20 | 439.80 | 461.80 | 434.10 | 397.50 | 422.20 | 413.40 |
| 21 | 12 | 90 | 500 | 300 | 432.00 | 452.30 | 404.70 | 416.80 | 441.00 | 447.80 | 429.90 | 450.50 | 423.50 | 400.60 | 412.70 | 404.10 |
| 22 | 12 | 120 | 300 | 250 | 667.00 | 636.60 | 624.80 | 662.10 | 630.20 | 674.80 | 668.10 | 701.50 | 659.40 | 618.60 | 641.30 | 628.00 |
| 23 | 12 | 120 | 400 | 300 | 680.60 | 659.50 | 637.50 | 656.60 | 643.10 | 652.90 | 626.80 | 656.90 | 617.50 | 631.10 | 601.80 | 589.20 |
| 24 | 12 | 120 | 500 | 200 | 671.80 | 631.20 | 629.30 | 650.10 | 624.90 | 669.00 | 662.30 | 695.50 | 653.70 | 623.00 | 635.90 | 622.60 |
| 25 | 12 | 150 | 300 | 300 | 784.70 | 748.90 | 735.10 | 763.70 | 734.00 | 785.90 | 754.50 | 811.40 | 761.80 | 725.40 | 724.30 | 709.20 |
| 26 | 12 | 150 | 400 | 200 | 766.40 | 741.40 | 717.90 | 757.10 | 730.20 | 740.50 | 733.10 | 769.70 | 723.50 | 710.70 | 703.70 | 689.10 |
| 27 | 12 | 150 | 500 | 250 | 782.20 | 726.50 | 732.70 | 755.60 | 719.20 | 779.60 | 754.50 | 810.40 | 762.70 | 727.70 | 731.00 | 725.50 |
| ANOVA | Profile 1 | Profile 2 | Profile 3 | Profile 4 | Profile 5 | Profile 6 | ||||||
|---|---|---|---|---|---|---|---|---|---|---|---|---|
| Source | Contribution (%) | p-Value | Contribution (%) | p-Value | Contribution (%) | p-Value | Contribution (%) | p-Value | Contribution (%) | p-Value | Contribution (%) | p-Value |
| ma | 0.22 | 0.057 | 1.60 | 0.008 | 0.12 | 0.005 | 1.02 | 0.051 | 0.29 | 0.064 | 0.49 | 0.016 |
| p | 0.94 | 0.011 | 2.23 | 0.002 | 2.74 | 0.001 | 1.88 | 0.047 | 0.76 | 0.011 | 0.92 | 0.001 |
| 0.11 | 0.28 | 0.17 | 0.517 | 1.65 | 0.161 | 0.86 | 0.27 | 0.06 | 0.134 | 0.24 | 0.101 | |
| 97.26 | 0 | 93.71 | 0 | 93.42 | 0 | 90.72 | 0 | 97.73 | 0 | 97.51 | 0 | |
| Error | 1.47 | 2.28 | 2.07 | 5.51 | 1.15 | 0.83 | ||||||
| Total | 100.00 | 100.00 | 100.00 | 100.00 | 100.00 | 100.00 | ||||||
| ANOVA | Profile 7 | Profile 8 | Profile 9 | Profile 10 | Profile 11 | Profile 12 | ||||||
| Source | Contribution (%) | p-Value | Contribution (%) | p-Value | Contribution (%) | p-Value | Contribution (%) | p-Value | Contribution (%) | p-Value | Contribution (%) | p-Value |
| ma | 0.43 | 0.026 | 0.50 | 0.022 | 0.11 | 0.045 | 0.42 | 0.021 | 0.58 | 0.015 | 0.70 | 0.015 |
| p | 1.11 | 0.001 | 1.33 | 0 | 0.93 | 0.009 | 0.80 | 0.002 | 1.33 | 0 | 1.73 | 0 |
| 0.19 | 0.171 | 0.80 | 0.475 | 0.25 | 0.215 | 0.24 | 0.09 | 0.15 | 0.263 | 0.08 | 0.575 | |
| 97.42 | 0 | 96.43 | 0 | 97.36 | 0 | 97.74 | 0 | 96.97 | 0 | 96.30 | 0 | |
| Error | 0.85 | 0.94 | 1.36 | 0.79 | 0.97 | 1.19 | ||||||
| Total | 100.00 | 100.00 | 100.00 | 100.00 | 100.00 | 100.00 | ||||||
| ANOVA | Profile 1 | Profile 2 | Profile 3 | Profile 4 | Profile 5 | Profile 6 | ||||||
|---|---|---|---|---|---|---|---|---|---|---|---|---|
| Source | Contribution (%) | p-Value | Contribution (%) | p-Value | Contribution (%) | p-Value | Contribution (%) | p-Value | Contribution (%) | p-Value | Contribution (%) | p-Value |
| ma | 0.21 | 0.445 | 0.22 | 0.377 | 0.28 | 0.296 | 0.34 | 0.007 | 0.31 | 0.263 | 0.20 | 0.373 |
| p | 12.29 | 0 | 10.65 | 0.000 | 11.58 | 0.000 | 7.88 | 0.000 | 11.53 | 0.000 | 10.97 | 0.000 |
| 18.62 | 0 | 17.03 | 0.000 | 16.83 | 0.000 | 13.15 | 0.000 | 16.36 | 0.000 | 14.86 | 0.000 | |
| 66.68 | 0 | 70.16 | 0.000 | 69.36 | 0.000 | 78.17 | 0.000 | 69.86 | 0.000 | 72.20 | 0.000 | |
| Error | 2.19 | 1.95 | 1.95 | 0.46 | 1.93 | 1.76 | ||||||
| Total | 100.00 | 100.00 | 100.00 | 100.00 | 100.00 | 100.00 | ||||||
| ANOVA | Profile 7 | Profile 8 | Profile 9 | Profile 10 | Profile 11 | Profile 12 | ||||||
| Source | Contribution (%) | p-Value | Contribution (%) | p-Value | Contribution (%) | p-Value | Contribution (%) | p-Value | Contribution (%) | p-Value | Contribution (%) | Source |
| ma | 0.34 | 0.233 | 0.31 | 0.264 | 1.26 | 0.072 | 1.45 | 0.048 | 1.32 | 0.068 | 1.31 | 0.084 |
| p | 11.39 | 0.000 | 11.04 | 0.000 | 11.60 | 0.000 | 12.19 | 0.000 | 12.65 | 0.000 | 10.41 | 0.000 |
| 17.18 | 0.000 | 14.37 | 0.000 | 15.80 | 0.000 | 16.87 | 0.000 | 16.69 | 0.000 | 14.34 | 0.000 | |
| 69.17 | 0.000 | 72.32 | 0.000 | 67.61 | 0.000 | 65.86 | 0.000 | 65.55 | 0.000 | 69.78 | 0.000 | |
| Error | 1.92 | 1.96 | 3.73 | 3.63 | 3.79 | 4.15 | ||||||
| Total | 100.00 | 100.00 | 100.00 | 100.00 | 100.00 | 100.00 |
| Input Process Parameters | Optimum Values | Condition | Surface Roughness (µm) | ||
|---|---|---|---|---|---|
| Abrasive flow rate (g/min) | 500 | ↑ | Condition: minimised | ||
| Waterjet pressure (MPa) | 300 | ↑ | = 4 mm | = 8 mm | = 12 mm |
| Traverse speed (mm/min) | 90 | ↓ | 1.142 | 1.529 | 1.993 |
| Input Process Parameters | Optimum Values | Condition | Material Removal Rate (mm³/min) | ||
|---|---|---|---|---|---|
| Abrasive flow rate (g/min) | 500 | ↑ | Condition: maximised | ||
| Waterjet pressure (MPa) | 300 | ↑ | = 4 mm | = 8 mm | = 12 mm |
| Traverse speed (mm/min) | 150 | ↑ | 421.2 | 767.1 | 811.4 |
Publisher’s Note: MDPI stays neutral with regard to jurisdictional claims in published maps and institutional affiliations. |
© 2021 by the authors. Licensee MDPI, Basel, Switzerland. This article is an open access article distributed under the terms and conditions of the Creative Commons Attribution (CC BY) license (https://creativecommons.org/licenses/by/4.0/).
Share and Cite
Llanto, J.M.; Vafadar, A.; Aamir, M.; Tolouei-Rad, M. Analysis and Optimization of Process Parameters in Abrasive Waterjet Contour Cutting of AISI 304L. Metals 2021, 11, 1362. https://doi.org/10.3390/met11091362
Llanto JM, Vafadar A, Aamir M, Tolouei-Rad M. Analysis and Optimization of Process Parameters in Abrasive Waterjet Contour Cutting of AISI 304L. Metals. 2021; 11(9):1362. https://doi.org/10.3390/met11091362
Chicago/Turabian StyleLlanto, Jennifer Milaor, Ana Vafadar, Muhammad Aamir, and Majid Tolouei-Rad. 2021. "Analysis and Optimization of Process Parameters in Abrasive Waterjet Contour Cutting of AISI 304L" Metals 11, no. 9: 1362. https://doi.org/10.3390/met11091362
APA StyleLlanto, J. M., Vafadar, A., Aamir, M., & Tolouei-Rad, M. (2021). Analysis and Optimization of Process Parameters in Abrasive Waterjet Contour Cutting of AISI 304L. Metals, 11(9), 1362. https://doi.org/10.3390/met11091362