1. Introduction
One of the fundamental questions of physics and materials science is the prediction of the physical and chemical properties of materials based on the periodic law and the correlation of properties. Periodic changes in the values of Young’s modulus, shear modulus, bulk modulus of elasticity, and compressibility, with continuous growth of their positions in the periodic table of elements Z, are already well known [
1,
2]. In [
3], the dependence of the work function of an electron on the atomic number of an element was constructed. A certain periodicity is observed depending on the value of the work function of the electron of metals on the atomic number. The maxima correspond to d-metals with an face-centered cubic (FCC) structure (rhodium, palladium, iridium, and platinum), while local minima are observed in the regions of niobium and rhenium. Numerous estimates of the theoretical strength of metals lead to an approximate relationship between theoretical strength and Young’s modulus and shear moduli.
It should be noted that there are no simple relationships common to all polycrystalline materials and their mechanical properties (hardness, yield strength, ultimate strength, relative elongation, elastic characteristics, shear modulus G, Young’s modulus E, and bulk modulus B). The existence of some tendencies links the elastic and plastic properties of metals, for example, according to the criterion in [
1]; the higher the B/G ratio of the metal under consideration, the greater its plasticity. Information about the characteristics of elasticity and their relationship with other properties of the material sheds light on the essence of many physical and mechanical properties of the material. The elastic interaction of crystal lattice defects is a natural method for describing changes in microstructure and processes occurring in a material under load.
The problem of an adequate physical comprehension of a solid’s plasticity nature remains relevant. For progress in this area, information on the existence and form of dependencies of metals plasticity characteristics on their positions in the periodic table of elements, and with particular relevance to the strong dependence of some physical properties on atomic numbers, is important, as was pointed out by Hume-Rothery [
1], King [
2], Grigorovich [
3], and Grimwall et al. [
4].
The modern model of plasticity phenomena, developed in [
5], is as follows: The spatiotemporal distributions of localized deformation nuclei, called localized plasticity patterns [
6], are formed at all the work hardening stages. The pattern origin is explained by how the self-organization of the defect (dislocation) ensembles in the deforming medium by means of macroscopic deformation localization [
7]. Similar patterns are projections of plastic flow autowaves, emerging at each stage of work and hardening on the surface of the test specimen. The autowaves are characterized by spatial (autowave length), λ ≈ 10
–2 m, and temporal scales (autowave period), T ≈ 10
2 s, and propagate with velocity 10
–5 ≤
Vaw = λ/T ≤ 10
–4 m/s. The product (
λ·Vaw) is referred to as the plasticity parameter and characterizes the plastic flow at a macroscopic scale level.
It is well known that the total strain is the sum of the plastic and the elastic parts. Elastic field redistribution by deformation occurs by the transverse elastic waves, with the velocity, It is correct
Vt = 2χωD ≈ 10
3 m/s. Here,
χ ≈ 10
−10 m is the interplanar spacing,
ωD = kBθD/ℏ ≈ 10
13 Hz is Debye’s frequency,
θD is Debye’s temperature [
8],
ℏ =
h/2π and
kB are Planck’s and Boltzmann’s constants, respectively. When describing the plastic flow, a problem arises of matching the characteristic scales
λ and
χ ≪
λ and the velocities
Vaw and,
Vt ≫
Vaw. It was shown earlier that quantities,
λ,
χ,
Vaw and
Vt, are related by the elastic–plastic strain invariant [
5]:
It reflects the mutual causality of the elastic and plastic deformation processes in the medium in the course of plastic flow [
5].
The major aim of this paper is the search for a correlation of the invariant Ẑ and the plasticity parameter (λ·Vaw), with the position of the metal in the periodic table of elements.
2. Materials and Methods
The studies of localized plastic flow were performed for nineteen metals from the 3rd, 4th, 5th, and 6th periods of the periodic table of elements. They are listed in
Table 1. The numbers of conduction electrons
n per unit cell (the electron density) [
9] are also given. The position of the elements in the periodic table is defined by the electron structure of the atoms. Thus, the number
N of the period gives the number of electron shells of the corresponding atoms, just as the group number
n for investigated metals, except transition metals Fe, Co, and Ni, coincides with electron density (see above).
Specimens with a 2 mm × 10 mm × 50 mm gage portion were subjected to tensile tests at a rate = 6.7 × 10⁻⁵ s–1 and 300 K on an Instron-185 tensile-testing machine (Instron, London, UK, and stress σ-strain ε curves were recorded. The tension strength test on metals was according to ASTM E8/E8M.
The autowave characteristics of the localized plastic strain required for the analysis were obtained from patterns of localized plasticity recorded by the speckle photographic method of deformation field analysis during elongation of flat samples described in detail in [
10].
The distribution of the local deformation components over the specimen surface was realized from localized plastic flow pictures, and their shape was dependent on the operating law of strain hardening [
10]. These pictures are the projection of a wave deformation process on the specimen surface. The step-by-step detection of displacement fields r (x, y), when a sequence of two exposure speckle photographs, each of which corresponds to a total-strain increment, Δ
εtot ≈ 0.2%, is taken along a flow curve, allowed us to analyze the run-time of plastic flow. Speckle images were taken along axes x and y at a step of 0.5 mm. The local strain distributions thus obtained characterize the local strain increment when the total tensile strain increases by Δ
εtot (rather than the total strain from the beginning of loading). Therefore, the absence of strain in the next speckle photograph only indicates the absence of a plastic deformation increment in the region under study at the given deformation step. An important problem is the contribution of plastic deformation in its localization zones to the total strain increment per loading step between two adjacent speckle photographs. A simple estimation demonstrates that the entire plastic deformation of a specimen concentrates in exactly these zones at a given time.
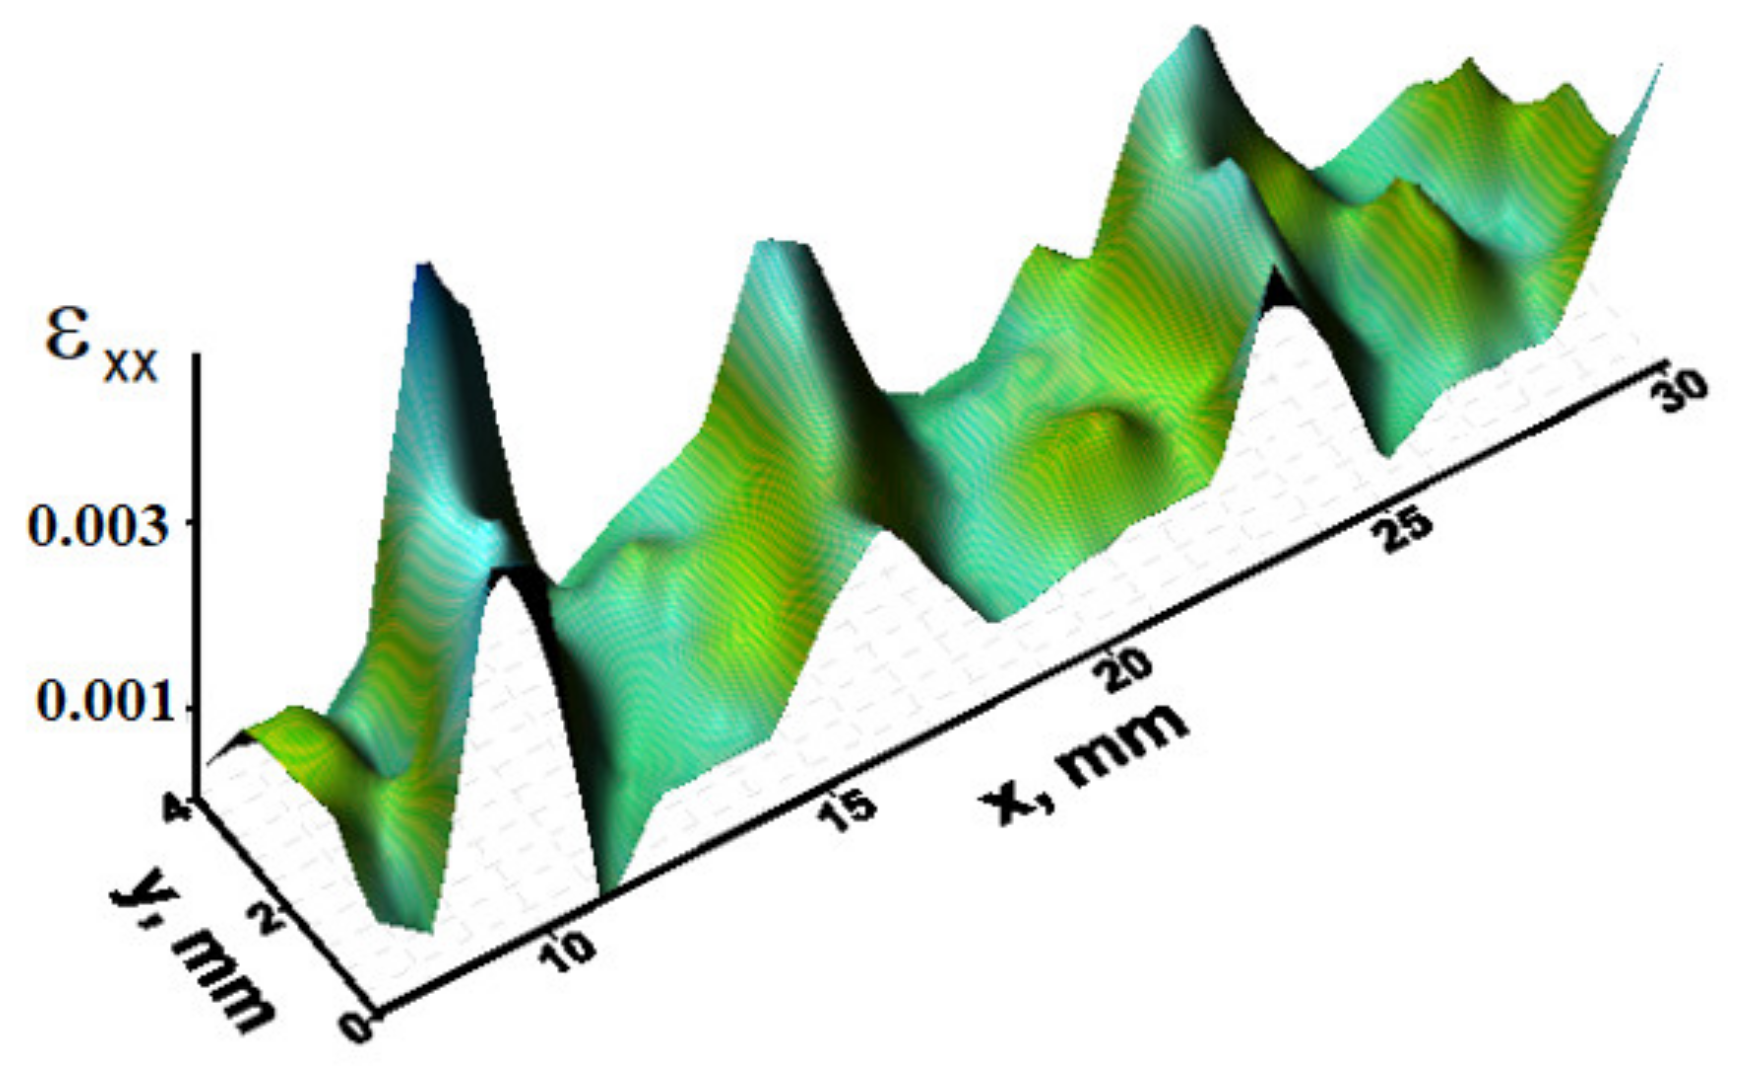
The plastic deformation of a specimen during tension is localized in a few relatively thin layers, and total strain should be considered as the sum of the strain contributions in all zones (see example in
Figure 1). The kinetic characteristics of the development of macroscopically localized plasticity (the wavelengths
λ and velocities
Vaw) were found from the dependences of the coordinates of the detected deformation zones on the deformation time [
10]. Since the total strain during tension at a constant rate is proportional to time (
εtot~
t), we can determine the position
X of the deformation localization zone (or several zones)
εxx along the specimen length during deformation, using the slope of the X–t curve, and calculate the velocity of the localized plastic flow zone,
Vaw =
dX/
dt. The values for interplanar spacing χ and transverse elastic waves, with the velocity
Vt, were taken from numerous handbooks (see, for example, [
11]).
3. Results
The experimental data provides persuasive evidence of the existence of correlations between the plasticity phenomena in solids and the element’s position in the periodic table of elements.
Our analysis demonstrated that the plasticity parameter, (
λ·Vaw) oscillates in its average value at least within
12Mg ≤ Z ≤
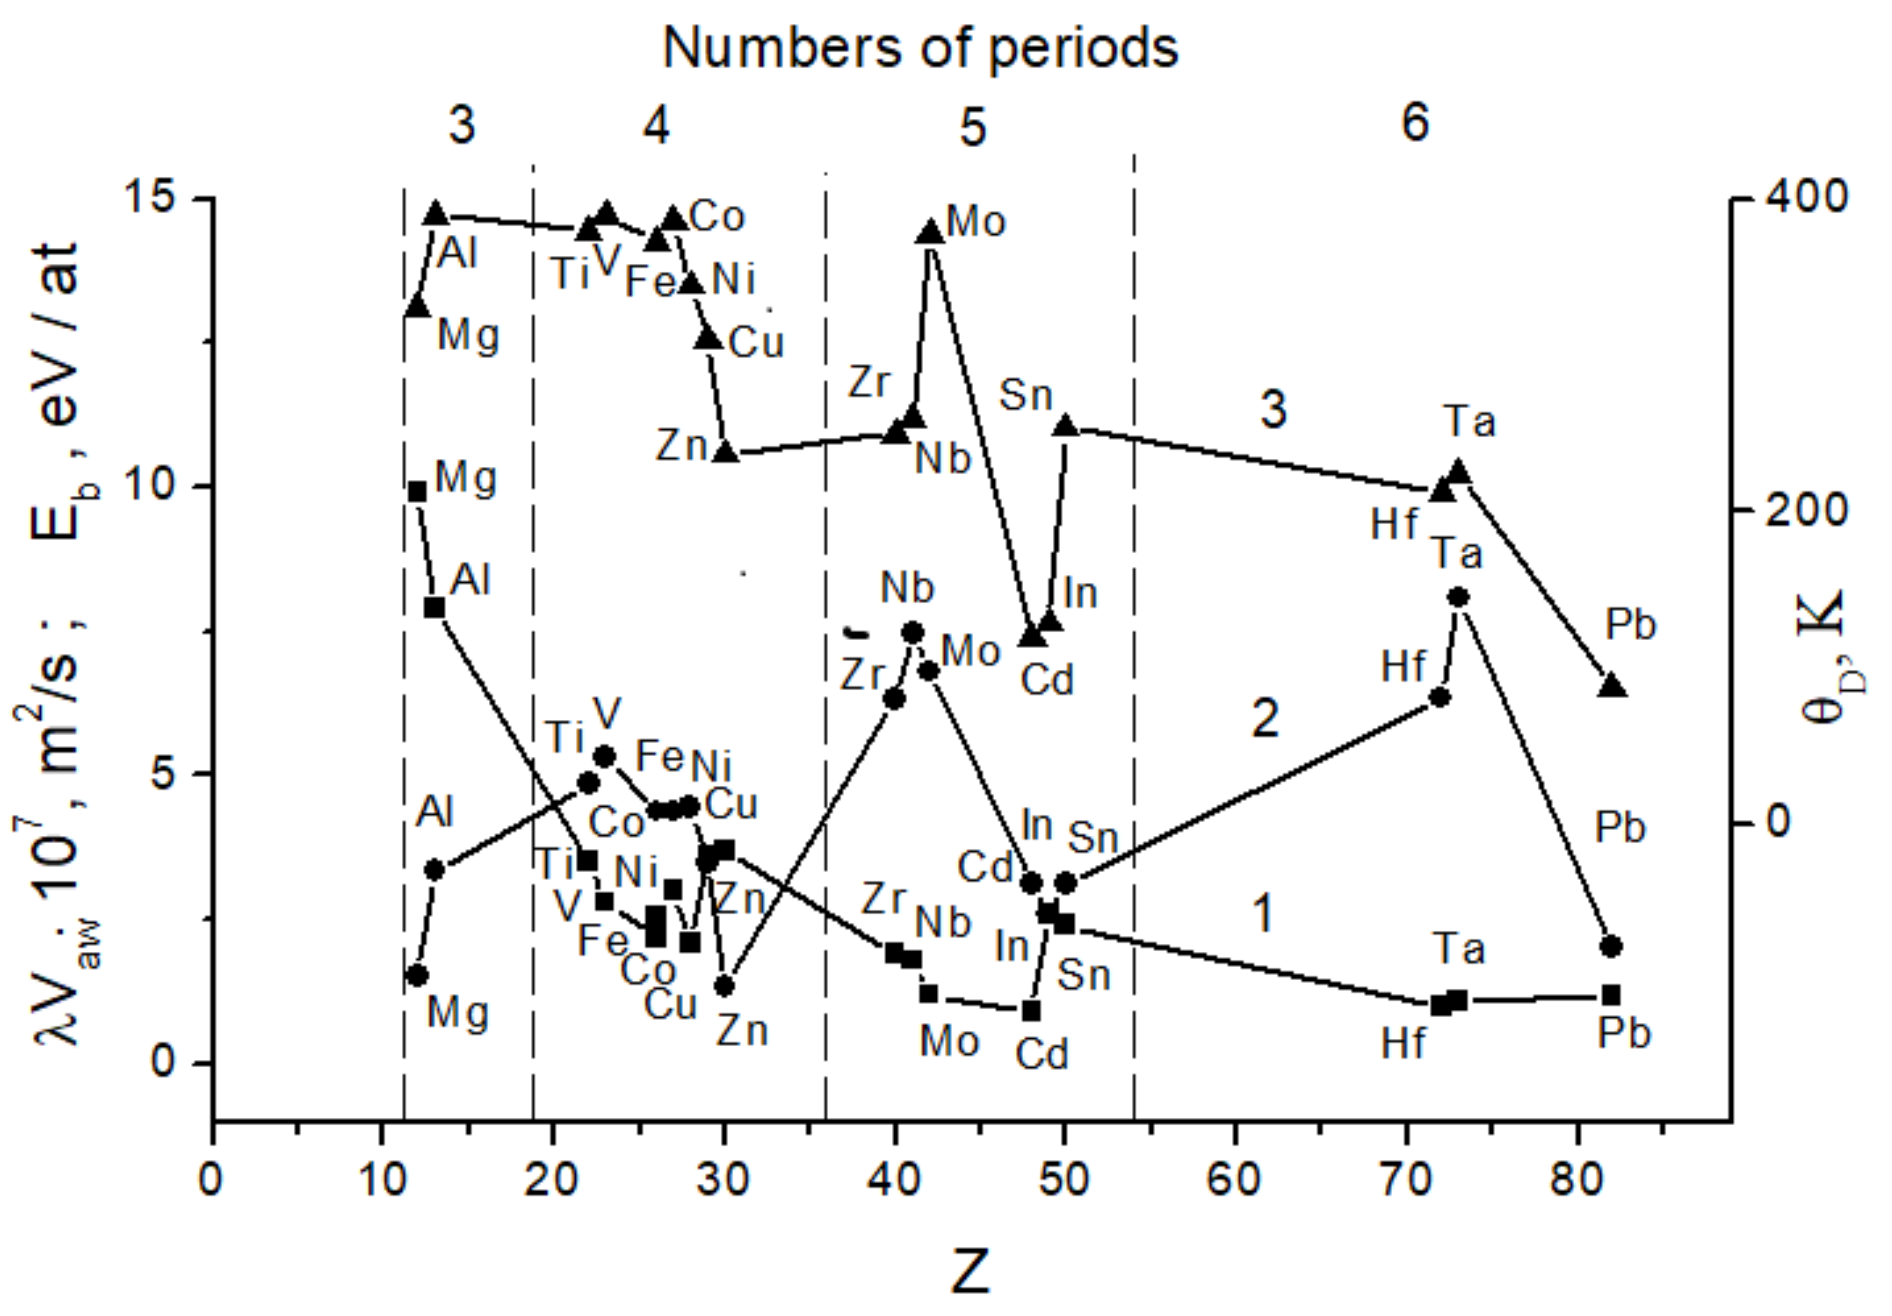
82Pb (where Z is the atomic number of the element). Similar oscillating behavior is typical for certain independently determined lattice characteristics, such as Debye’s temperature, binding energy, elastic modulus, electron work function, etc. In
Figure 2, we compare the periodic variation of the plasticity parameter (
λ·Vaw) with the atomic number
Z of the element, and the same for binding energy,
Eb, and Debye’s temperature,
θD [
3]. Therefore, these observations show that the electron structure of an atom plays a significant part in metal plasticity.
Experimental studies of localized plastic flow were carried out on various metals belonging to periods 4–6 of Mendeleev’s periodic table of elements. The quantities characterizing the process of localized plastic deformation—the length and velocity of propagation of the phase autowave—were measured using the speckle photography technique. Analysis of the data set obtained for the stages of linear strain hardening made it possible to establish that, as the element number increases within 12 < Z < 82, the dependence of the plasticity parameter (
λ·Vaw) on the atomic number of the element Z oscillates relative to the average value. It was found that these oscillations correlate with the regularities of behavior with increasing Z of a number of independently defined lattice characteristics, such as, Debye’s temperature, density, melting point, elastic moduli, ionization potential, and some others [
1,
8]. As an example, the correlation of the discussed dependences is illustrated by those shown in
Figure 2, including, in-phase behavior of the plasticity parameter (
λ·Vaw) and reference data for Debye’s temperature and binding energy as functions of the atomic number of the studied elements. Debye’s temperature is directly expressed in terms of the speed of sound propagation and, therefore, in terms of the elastic characteristics of a rigid body. Consequently, the symbate oscillations of the dependences in
Figure 2 confirm the relationship between the elastic and plastic properties of the deformable medium.
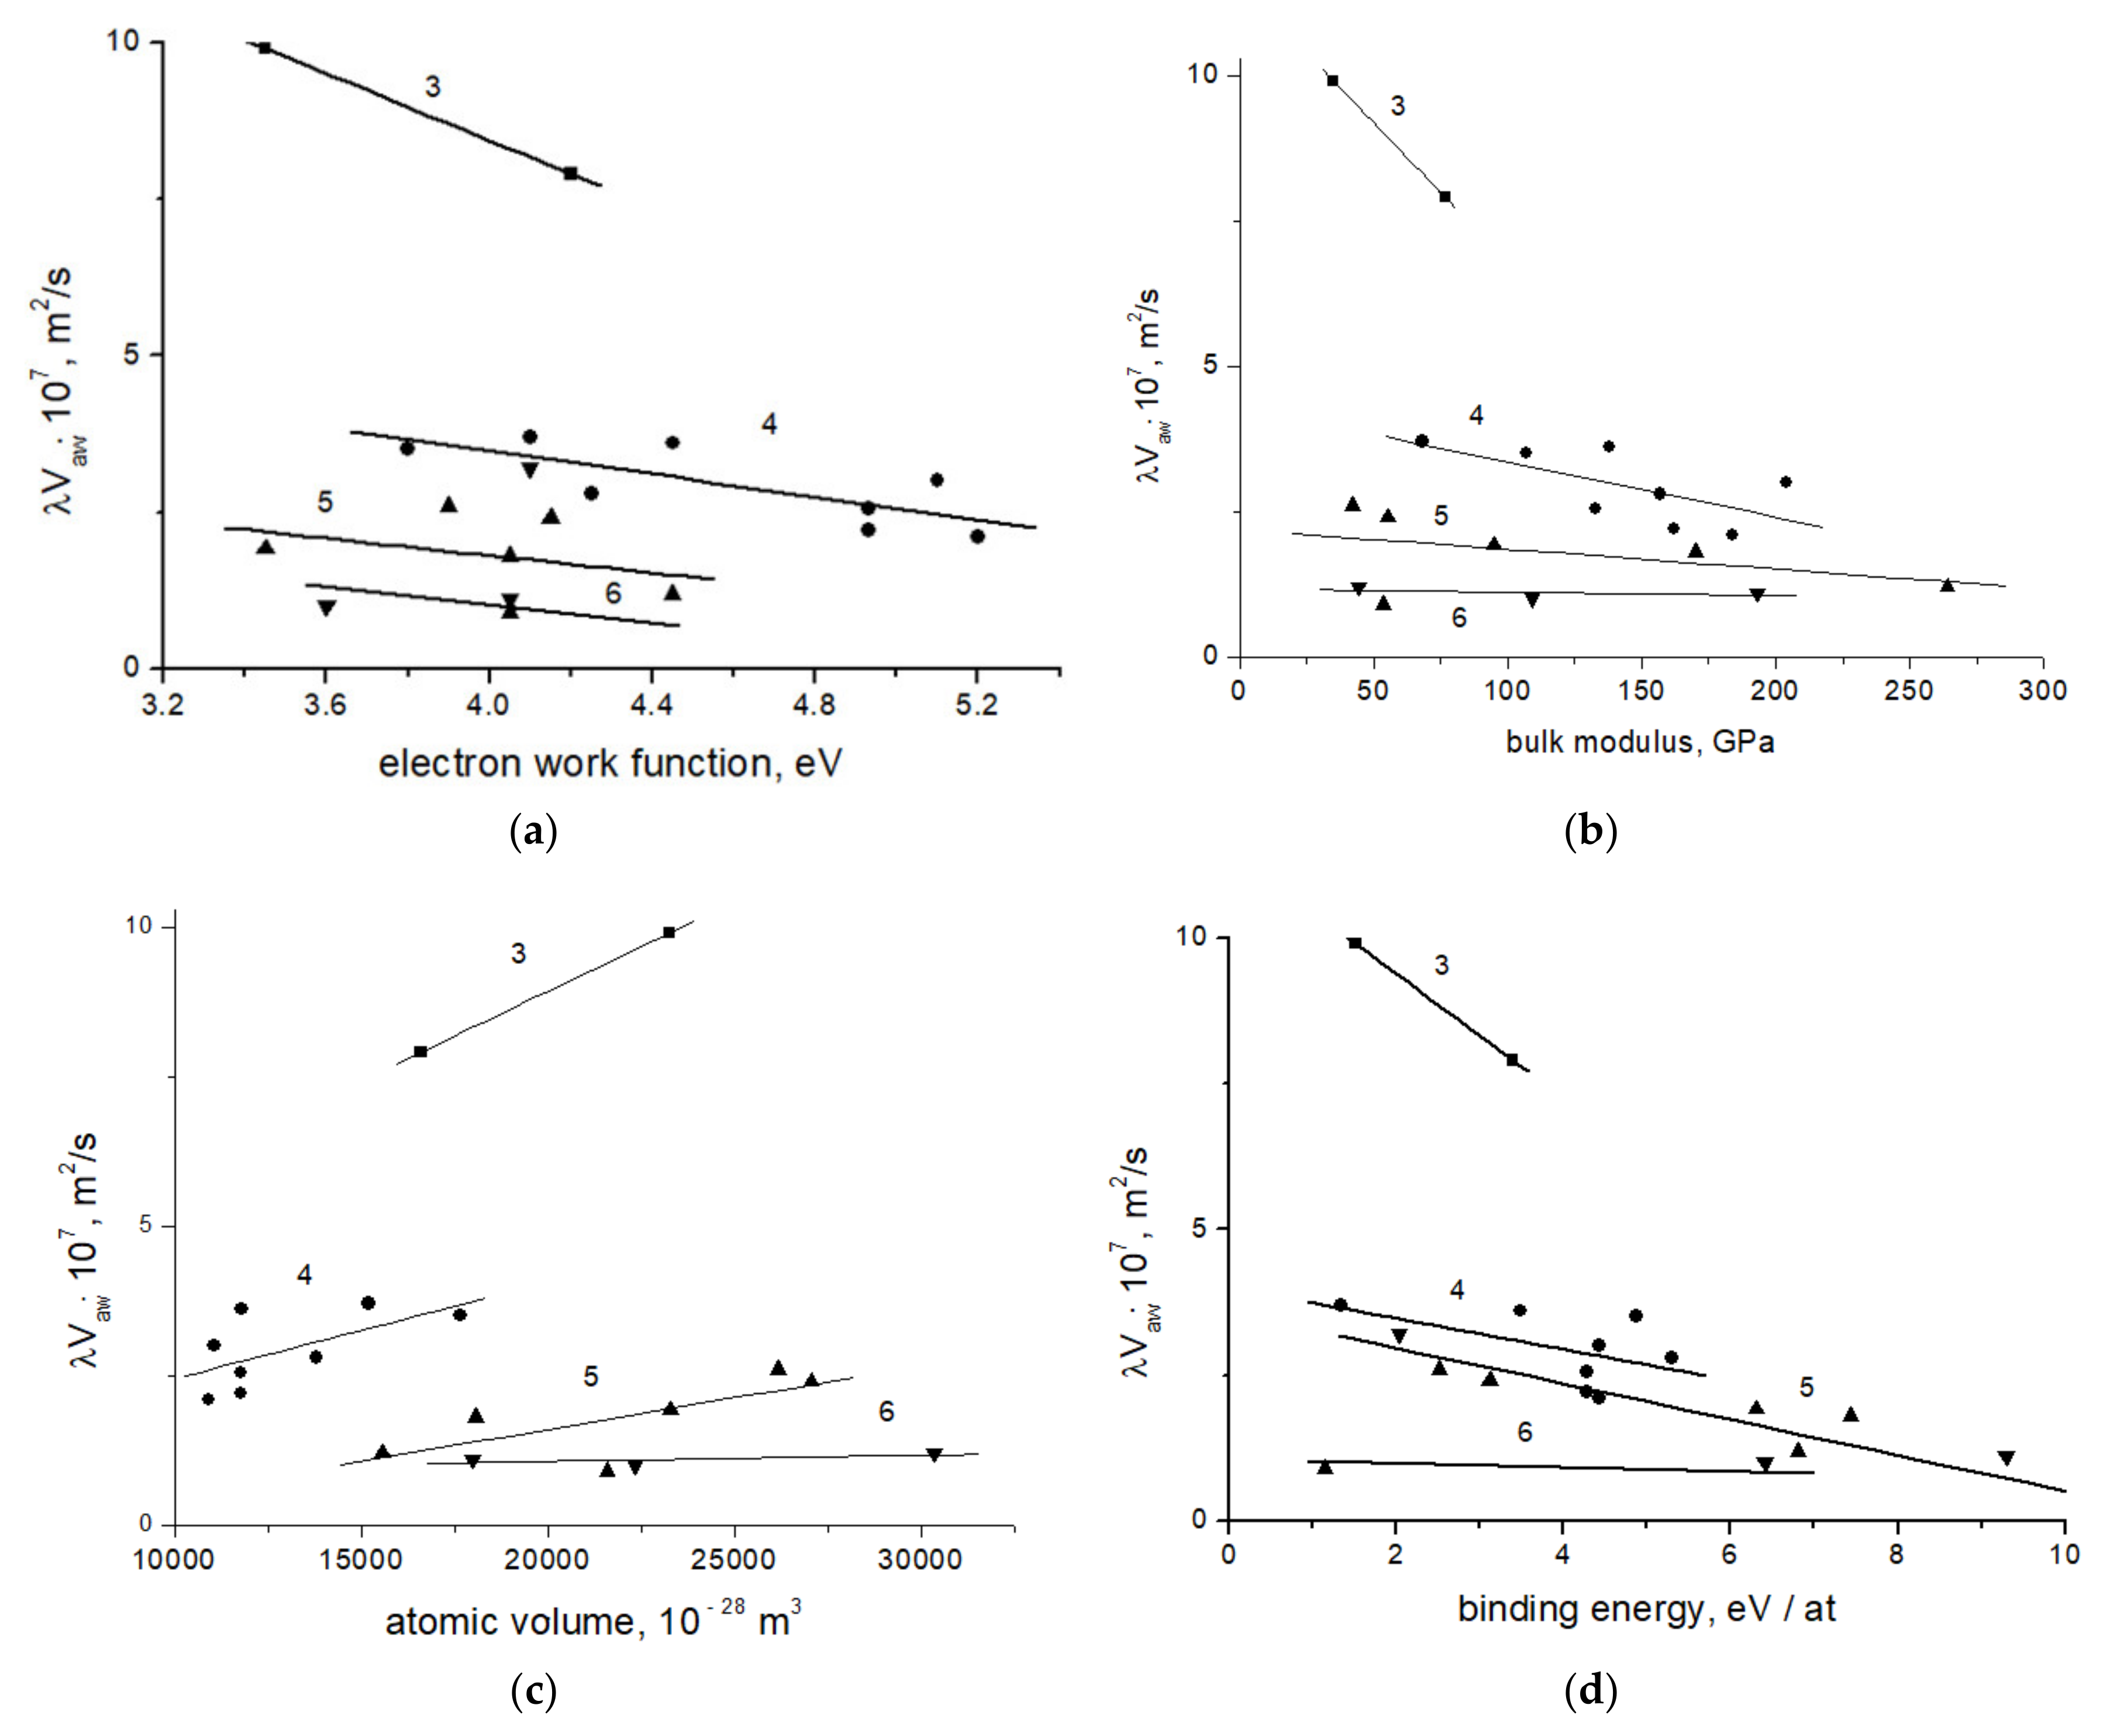
There are linear correlations between plasticity parameter (
λ·Vaw), on the one hand, and certain physical properties of the investigated metals, on the other. Typical examples of similar correlations are shown in
Figure 3a–d. From this data, it follows that the discussed dependencies vary according to the period number of the
N of the investigated metal. Moreover, these findings are interesting because they concern both electron (
Figure 3a) and ionic (
Figure 3b–d) subsystems of metals.
From the literature changes in the values of binding energy, bulk modulus of elasticity, and atomic volume are well known, with a continuous increase in the serial number Z [
1,
3]. Typically, many characteristics of metals are measured in their elastic state [
12]. With the presented data on the characteristics of plasticity and with the knowledge of the methods of extracting the information contained in them, researchers can obtain a large array of information about the properties of the material under consideration. This prompted the collection of information and the systematization of data on linear correlations between the characteristics of plasticity and other properties of metals, such as: work function of an electron, binding energy, bulk modulus of elasticity, and atomic volume, which are shown in
Figure 3. As can be seen, the plasticity parameter in each period decreases with an increase in the electron work function, binding energy, and bulk modulus of elasticity, and increases with an increase in the atomic volume.
The data in
Table 1 show that the experimental values of the invariant
for the 3rd–6th periods of the periodic table differ somewhat from each other. The significance of these differences between pairs was evaluated statistically using paired data using Student’s
t-test with a 90% confidence level [
13].
As these evaluations showed, the differences between ,, and are insignificant.
Based in this, one can suggest that these values belong to one general population. Averaging over all nineteen metals yields,
coincides with the value taken together in [
5] for metals and nonmetallic materials. This means that invariant
Ẑ (1) is independent of the number of the period in the periodic table.
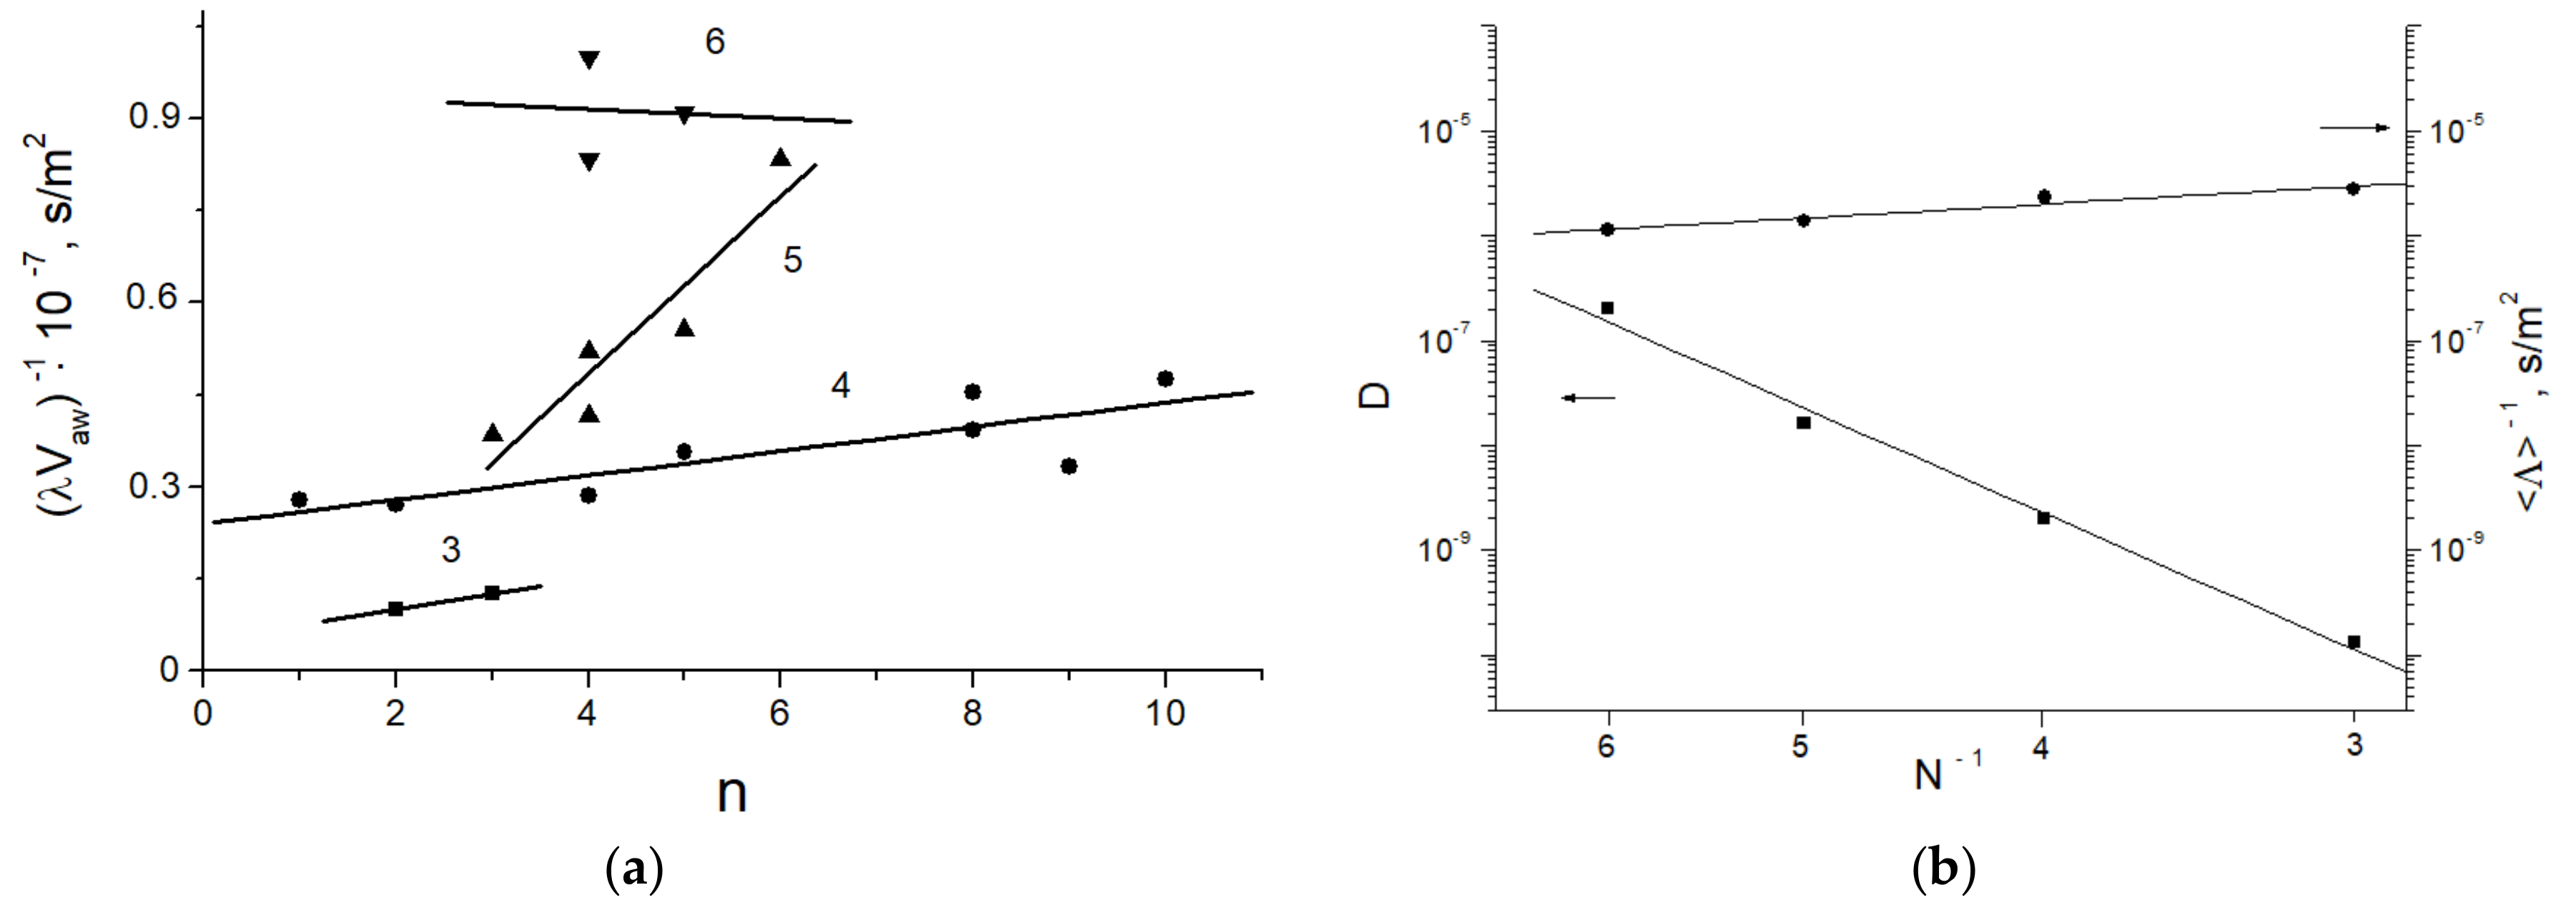
Analysis of the behavior of the plasticity parameter within each period of the periodic table demonstrated that the value (
λ·Vaw)
−1 is proportional to the number
n of the conduction electrons per unit cell of the metal, as shown in
Figure 4a. A relationship of this type was already described in [
14], but it only became possible to highlight the separation over the periods of the periodic table of elements after investigation of a sufficient number of metals.
Within each investigated period, the linear dependence:
was observed, where the empirical coefficients
C and
D differed for the elements of the 3rd–6th periods. The value of
D in
Figure 4a denotes the slope of straight lines for different periods. The maximum value corresponds to the 5th period, the minimum value corresponds to the 6th period. Their physical sense is not discussed here. Experimental data analysis showed that coefficient
D in Equation (2) depended on the period number,
N, as:
In other words,
. Here, the number
N takes the values 3, 4, 5, and 6, while
D0 and
q are constants. Equation (3) is illustrated in
Figure 4b.
The explanation of the results above is focused on comparison of the invariant values for different periods and elucidation of the nature of the dependence of the autowave plasticity parameter (λ·Vaw) on the electron density n for the metals, i.e., on the position of these elements in the periodic table of elements.
4. Discussion
It follows from
Figure 4a and Equation (2) that
(λ·Vaw)−1~n for metals of the 3rd–6th periods. The physical meaning of this proportionality results from the fact that one can easily go from the plasticity parameter (
λ·Vaw)
−1 to de Broglie’s formula [
12] for the effective mass:
Then, it follows from
Figure 4a, that
mef~n. This fact was found earlier [
14,
15], where the effective mass was related to a quasi-particle associated with the localized plastic flow autowave and named autolocalizon.
The average effective masses calculated from Equation (4) yield ‹
mef› = 1.8 ± 0.3 ≈ 2 a.m.u. (see
Table 2). The differences among the average values ‹
mef›i for 3rd–6th periods turn out to be statistically insignificant [
13]. Statistical analysis using the procedure described in [
13] has shown that the distribution of the
mef values about the average value is normal.
To explain the origin of the effective mass
mef, one must recall that plastic flow is the result of dislocation jumps between local barriers [
16]. The waiting time of the jump, Θ, is thermally activated. The time of the jump is τ ≪ Θ. It is essential that dislocations are immobile during time Θ, and the plastic deformation at that time does not increase. It increases by dislocation jumps during time τ, and their dynamics are controlled by the viscosity of phonon and electron gases [
17,
18].
To discuss the nature of the effective mass
mef, two regimes of dislocation motion should be considered. Let,
Vdisl = const and,
, the viscous drag force per unit length of the dislocation line will be:
where
Pa·s [
17] is the viscous drag coefficient for dislocation. This coefficient for metallic crystals is determined by the properties of the electron and phonon gases [
17,
18].
In a more realistic case, when
Vdisl =≠ const, the inertial term
Fin arises being proportional to the dislocation acceleration
. In this case, the total drag force per unit length of the dislocation line would be written [
19]:
In metals, the contributions of the phonon and electron gases into the viscous dislocation drag coefficient are additive [
17], i.e.,
. Thus, it follows from Equation (6) that:
Here,
ν is the acting frequency of deformation. In this case,
B/ν and can be interpreted as the attached mass per unit dislocation length. This conclusion agrees with Eshelby’s opinion [
20] that the dislocation motion is similar to the motion of the Newtonian particles. In this case, the third and fourth terms on the right-hand side of Equation (7) define the attached mass, that is:
Thus, the value,
mef, can be regarded as the attached mass associated with the accelerated motion of plasticity carriers (dislocations) in the viscous medium [
16,
17].
The term
Be/ν has special interest in Equation (8). According to the data presented in [
17], the viscosity of the electron gas is proportional to electron density, that is,
Be ~ n. From here, the explanation follows of the proportionality,
(λ·Vaw)−1~ mef ~ n where it describes the influence of the electron gas density to the dislocation motion drag. As for the role of the attached mass associated with the phonon gas viscosity,
Bph/ν, it weakly depends on the properties of metals at temperatures,
T > θD [
8].
The correlations in
Figure 4a are manifested through the change in the characteristics of localized plasticity autowave motion at the linear work hardening stage depending on electron density. They are explained by the contribution of the electron gas to dislocation drag. The obtained data indicate directly that the nature of the electron gas contribution to dislocation drag is more complex in character than the traditional theories of this effect originally envisaged.
It follows from the data obtained that the relation:
holds true for the elements of the 3rd–6th periods, as shown in
Figure 5. An especially interesting trait is found for the elements of the 4th and 5th periods, where eight and six metals were investigated, respectively. It is of importance that the constant
χ* is close to the interplanar distance corresponding to the maximal intensities of
X-ray reflection for potassium and rubidium, from which the 4th and 5th periods begin. It was established, for the 4th period, 0.37
0.375 nm, and for the 5th period, 0.45
0.433 nm. This consideration creates a possibility of predicting the character of plastic flow patterns in metals, using their lattice characteristics only.
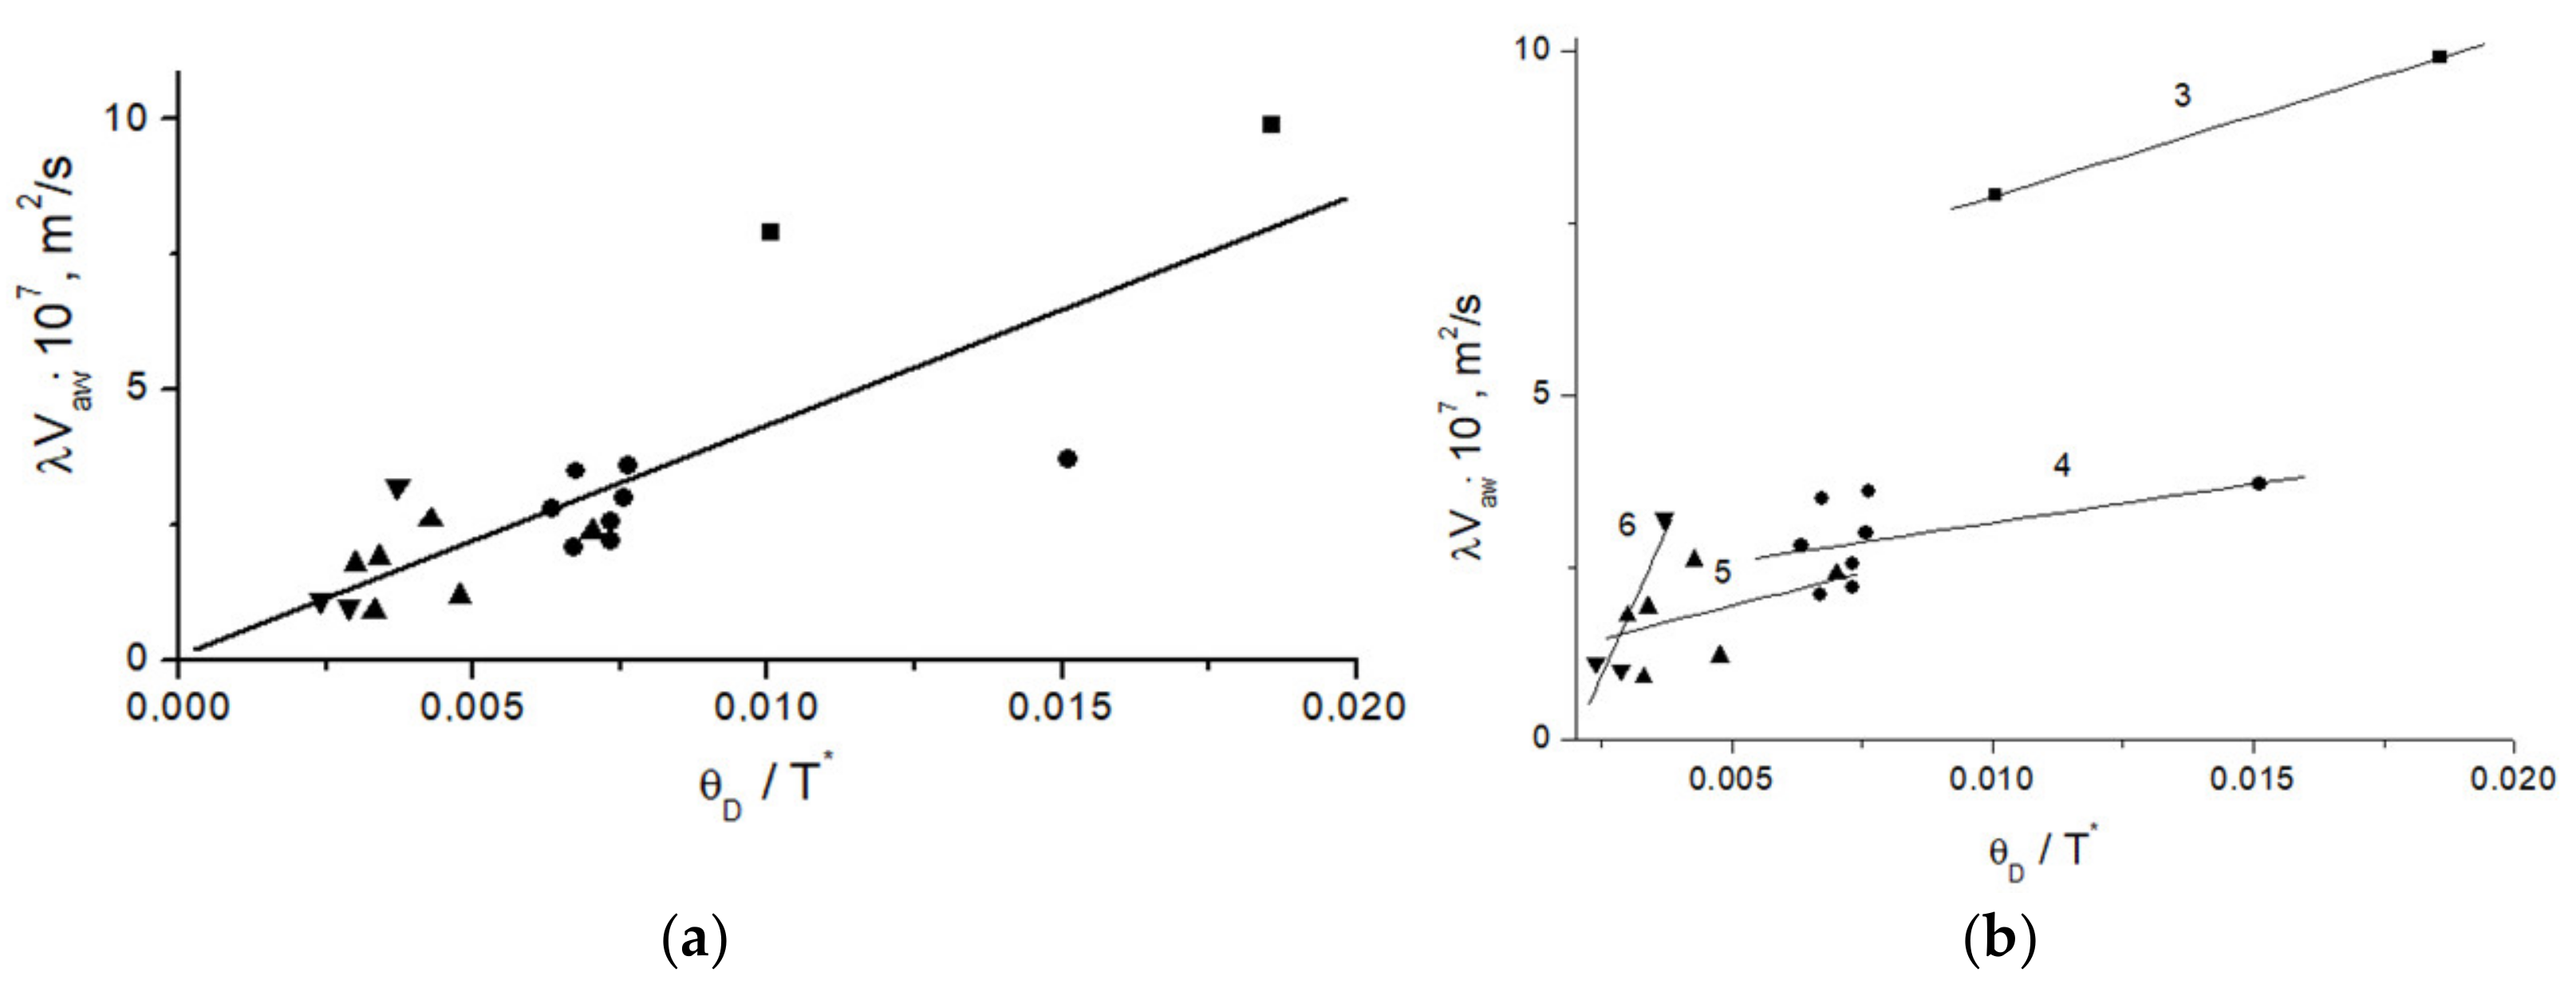
The experiments showed that the plasticity parameter, (
λ·Vaw) increases with Debye’s temperature,
θD, as shown in
Figure 6a. It is convenient, here, to introduce a characteristic temperature,
T* = Eb/kB, and to use then the dimensionless temperature,
θD/T*. Then, the dependence of, (
λ·Vaw) on
θD/T* is:
where coefficient, Λ = (4.4 ± 1.3)·10
−5 m
2/s, and the correlation coefficient between values, (
λ·Vaw) and
θD/T* is close to 0.8.
To understand the physical meaning of Equation (10), we use the following consideration. There are a number of consequences from invariant (1) describing the various features of plastic flow [
5]. One can suppose that Equation (10) is one of these consequences. As a result, Equation (1) can be rewritten in the form:
Using the above introduced relations,
and
, we obtain:
that is, Equation (12) follows from Equation (1). In this case, we have:
Now, one can calculate the quantities of
, using the published values
χ and
Eb for all the metals. The results of calculations are shown in
Table 2. The average coefficient is,
m
2/s; the difference between this quantity and the coefficient in Equation (10) is not statistically significant, according to the statistical procedure [
13].
One can present the dependence
in another manner. In reality, the averaging of values Λ for metals of one period, as it is shown in
Table 2, allows one to find the quantities
for every period, as shown in
Figure 4b,
(or
). The values found are significantly different. This allows one to break the dependence,
into four parts by the period number, as shown in
Figure 6b.
The above considerations point to the existence of a relationship between the plasticity parameter (
λ·Vaw) and the lattice properties. Moreover, the appearance of Planck’s constant,
h, in Equation (13), together with typical mechanical characteristics, confirms the appropriateness of the use of quantum mechanical ideas in plasticity physics, as was proposed by us in [
15,
21].


