1. Introduction
Refractory metal high entropy superalloys (RSAs), which are a group of alloys developed from the high entropy alloy (HEA) compositional premise, have shown promise as novel high temperature materials. They comprise combinations of mutually soluble bcc refractory metals, such as Mo, Nb and Ta that have high melting points, along with lighter elements such as Ti, Zr and Al, the latter of which can induce B2 ordering. These alloys have demonstrated greater high temperature compressive strengths and lower densities than several commonly used polycrystalline Ni-based superalloys [
1,
2]. The impressive high temperature strengths were thought to be derived from the dual phase intergranular microstructure comprising nanoscale cuboidal and plate-like bcc precipitates within an ordered B2 superlattice matrix [
2,
3,
4,
5,
6]. This fine-scale, ordered/disordered microstructure has drawn comparisons to the γ-γ′ microstructure of Ni-based superalloys, despite the bcc basis of RSAs distinguishing them from the fcc-based Ni-based superalloys [
2,
3,
4,
5,
6]. Critically, the microstructural configuration of the ordered and disordered phases in RSAs are inverse to that found in Ni-based superalloys, with an ordered B2 matrix phase, which is a concern for the room temperature ductility. Nevertheless, given the morphological and crystallographic similarities between the two phases in RSAs, it has been suggested that they may be able to exploit similar strengthening mechanisms that have led to the success of Ni-based superalloys in high temperature applications. However, despite significant global research activity, several key challenges remain in the development of commercially viable RSAs. Among these challenges, it is generally accepted that greater control over the microstructural formation is required in order to produce materials with a ductile bcc matrix phase and stable superlattice precipitates [
2,
5,
7,
8,
9,
10,
11,
12].
The nano-scale microstructures in RSAs are believed to form via a spinodal decomposition during cooling to produce two coherent bcc phases, one of which undergoes an ordering transition to form the B2 phase [
5,
8,
10,
13,
14]. Spinodal decomposition occurs when the second derivative of the Gibbs energy curve with composition within a miscibility gap is negative. This allows progressive phase separation to occur by uphill diffusion. Within the constituent binary and ternary systems of RSAs there are multiple bcc + bcc miscibility gaps, including Ta-Zr, Nb-Zr and Mo-Ti-Zr, which have the potential to contribute to the formation of the nanoscale microstructures observed in RSAs. It should be noted that the Mo-Zr binary system does not contain a miscibility gap due to the formation of the Mo
2Zr laves phase. Detailed analysis of the fine two-phase microstructure of the exemplar RSA, AlMo
0.5NbTa
0.5TiZr, has shown the B2 matrix phase to be enriched in Al and Zr, whilst the bcc regions were richer in the refractory components Nb, Mo, and Ta [
1,
3]. The Ti content was very similar between the two phases, with a slight preference for the Zr and Al-rich phase. Consequently, it has been proposed that the formation of the two-phase microstructure in AlMo
0.5NbTa
0.5TiZr is driven by the miscibility gaps between the refractory metals, particularly Ta or Nb, and Zr [
5].
However, it should be noted that significant variation occurs in the temperature and composition range of the bcc + bcc miscibility gaps in refractory metal-Zr systems. The binary Ta-Zr miscibility gap extends up to ~1783 °C, whilst the Nb-Zr miscibility gap is present only below ~988 °C [
15,
16]. Consequently, the thermodynamic driving force for spinodal decomposition is likely to be greater in the Ta-Zr system than in the Nb-Zr system. A recent study of the Ta-Ti-Zr constituent RSA system demonstrated that the Ta-Zr miscibility gap produces nano-scale cuboidal RSA morphologies through spinodal decomposition [
10]. However, given the wide variation in the extent of refractory metal-Zr miscibility gaps, it is not known whether similar microstructures can result from other refractory metal-Zr interactions. Crucially, a greater understanding of the effect of the interactions of different refractory elements on the microstructure of RSAs is necessary to aid the design of future alloys with optimised properties.
Isolating the effects of individual elements within RSAs is challenging due to the inherent compositional complexity of these materials. One approach to mitigate this is to investigate simplified constituent systems that behave in a similar manner to the multicomponent alloys. Recently, this approach has been used to study the influence of the Ta-Zr miscibility gap on the phase morphologies observed in RSAs and to assess the role of Al in the formation of the ordered B2 structure [
10,
13]. A similar approach is adopted here, where a systematic series of alloys from the Nb-Ti-Zr system have been used to study the role of the Nb-Zr miscibility gap on microstructural development. Existing ternary phase diagrams indicate that a miscibility gap exists within the Nb-Ti-Zr system [
17,
18,
19,
20,
21] and potential spinodal microstructures have been observed in an equiatomic alloy [
22]. However, there are significant variations between the phase diagrams produced by these different studies, particularly with respect to the temperature and composition ranges over which the miscibility gap exists. Consequently, it is crucial to resolve these discrepancies in order to develop a better understanding of how elemental contributions may influence the microstructural formation and evolution in the more complex RSAs.
4. Discussion
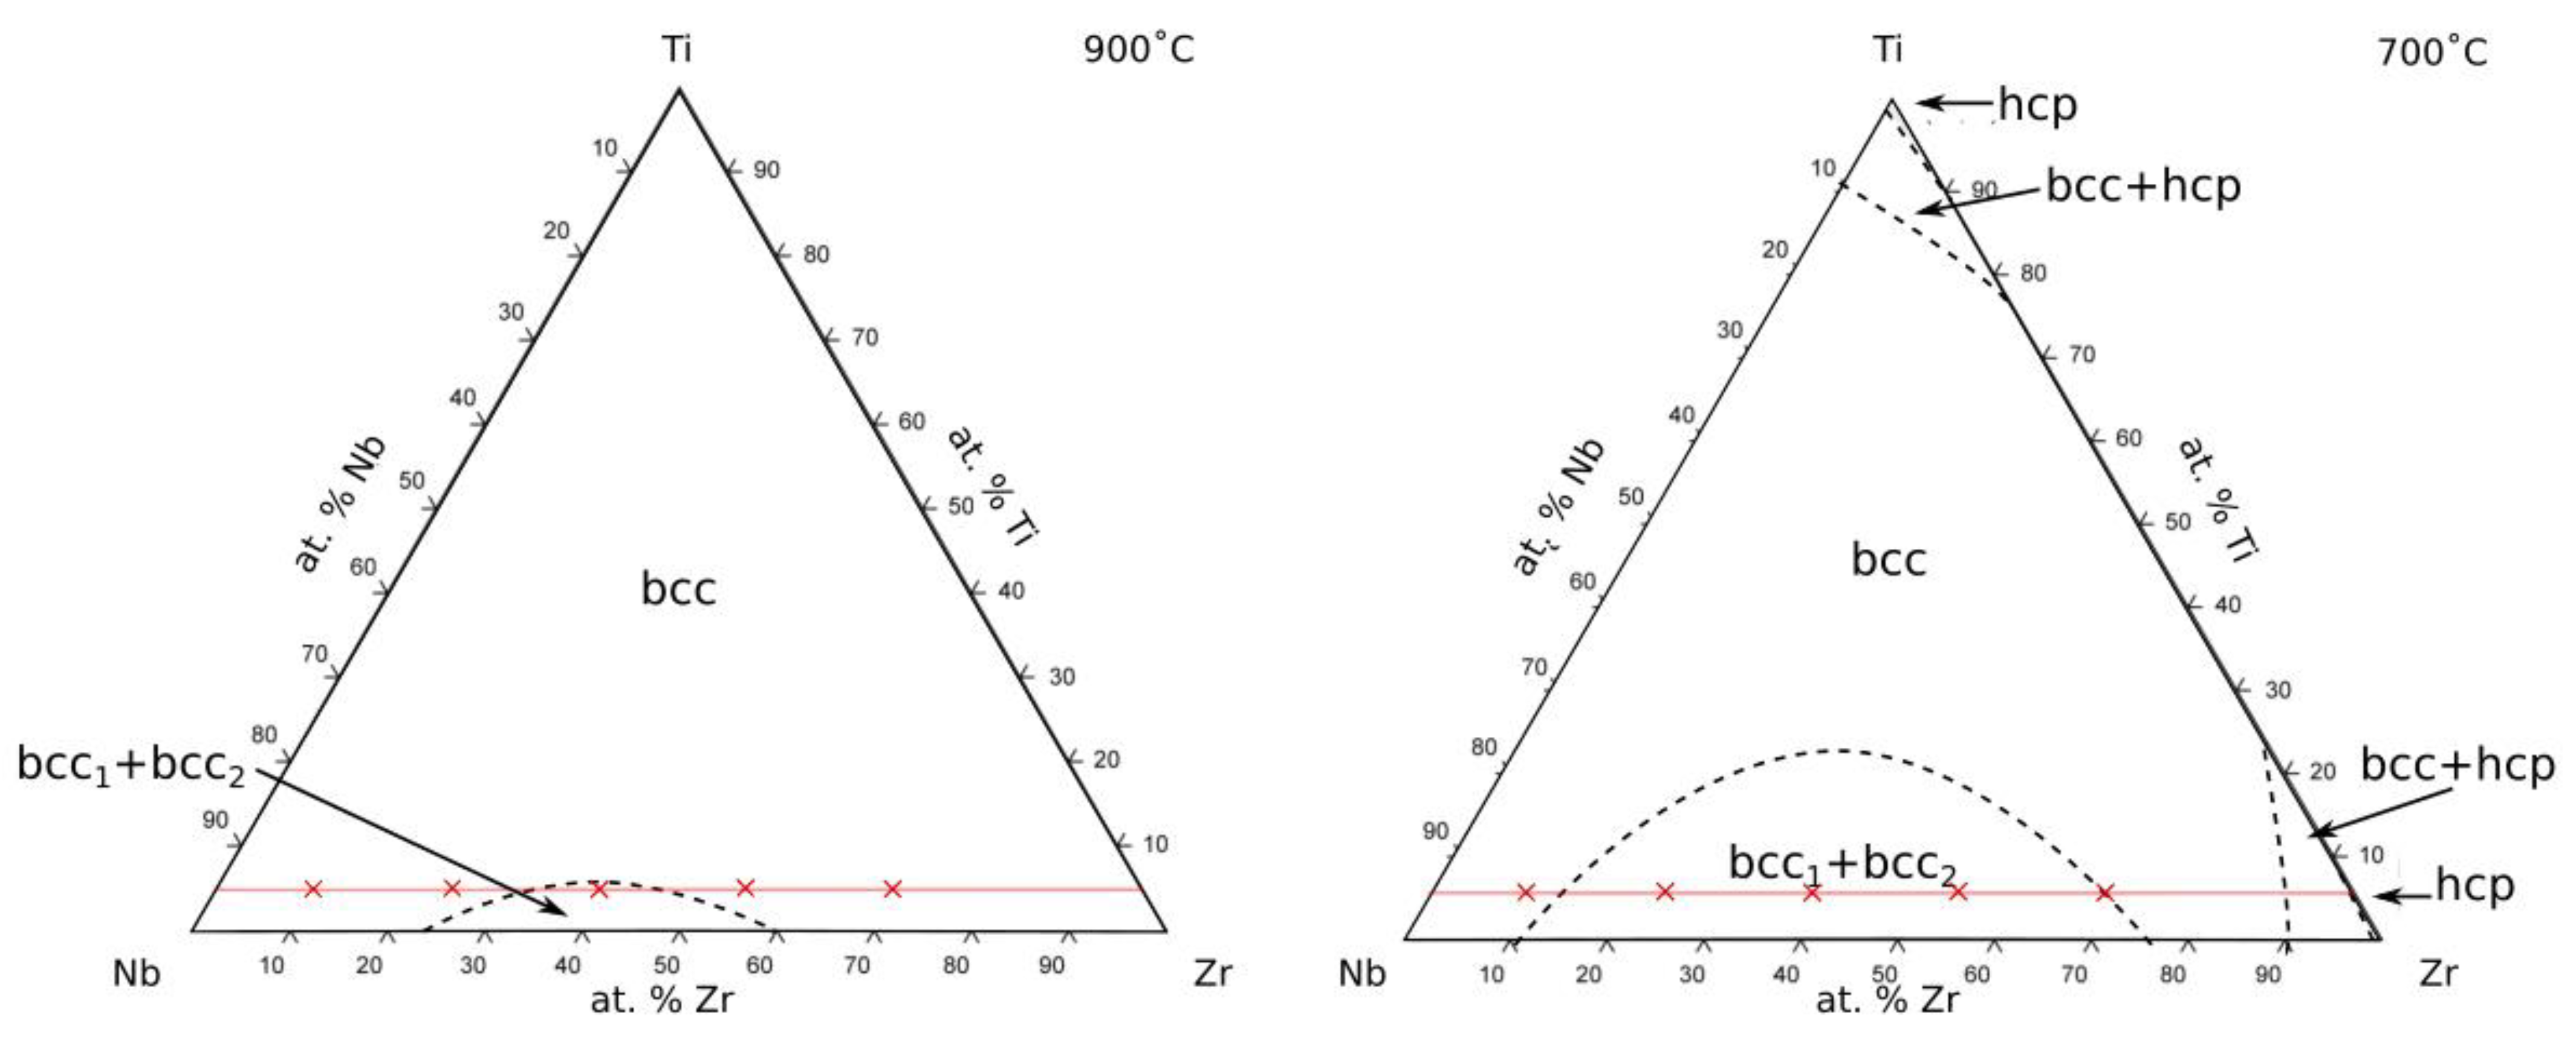
All of the alloys considered in this study are located within a single phase field when exposed at temperatures above 1000 °C, consistent with existing phase diagrams. However, discrepancies between the predicted and observed phases occurred following exposures at 900 and 700 °C. At 900 °C, all of the alloys were expected to reside in a single bcc phase field, except Alloy 5540 which was predicted to lie just within the bcc + bcc region,
Figure 1. Despite this, decomposition of the alloys was not observed at 900 °C, suggesting that a single bcc phase field extended across the entirety of the compositional space investigated here. Therefore, it would appear that the bcc + bcc solvus is lower than shown by Doi et al. [
17] and more consistent with the prediction of Lin et al. [
20] and Kumar et al. [
19] that show Alloy 5540 to be right on the edge of the phase field at 900 °C. The results here suggest that the position of the solvus is such that the composition of Alloy 5540 was just outside the miscibility gap at 900 °C.
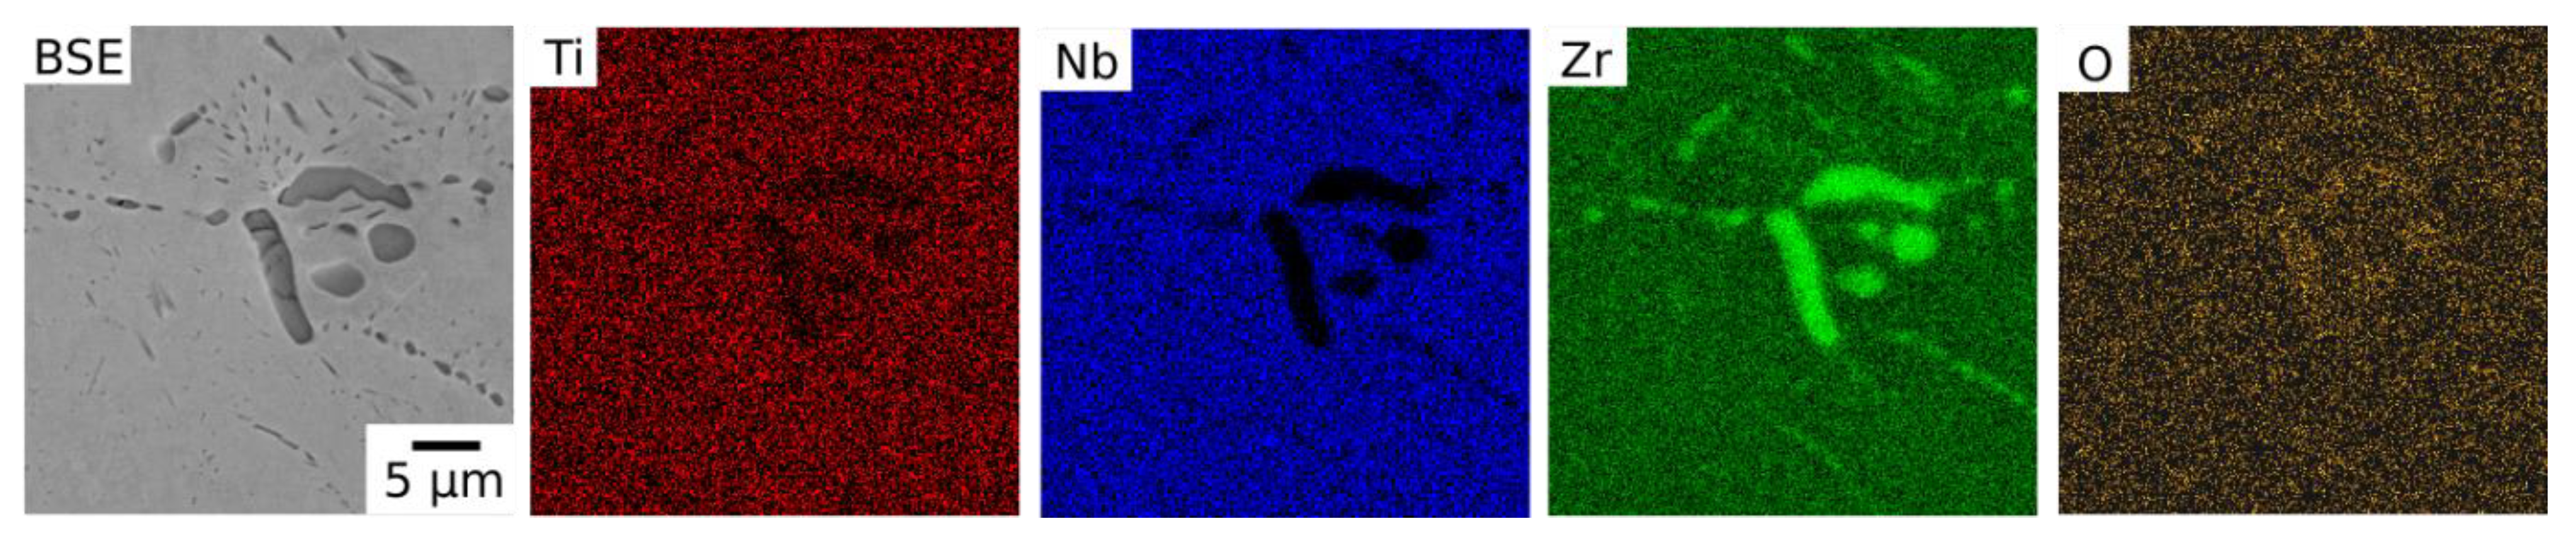
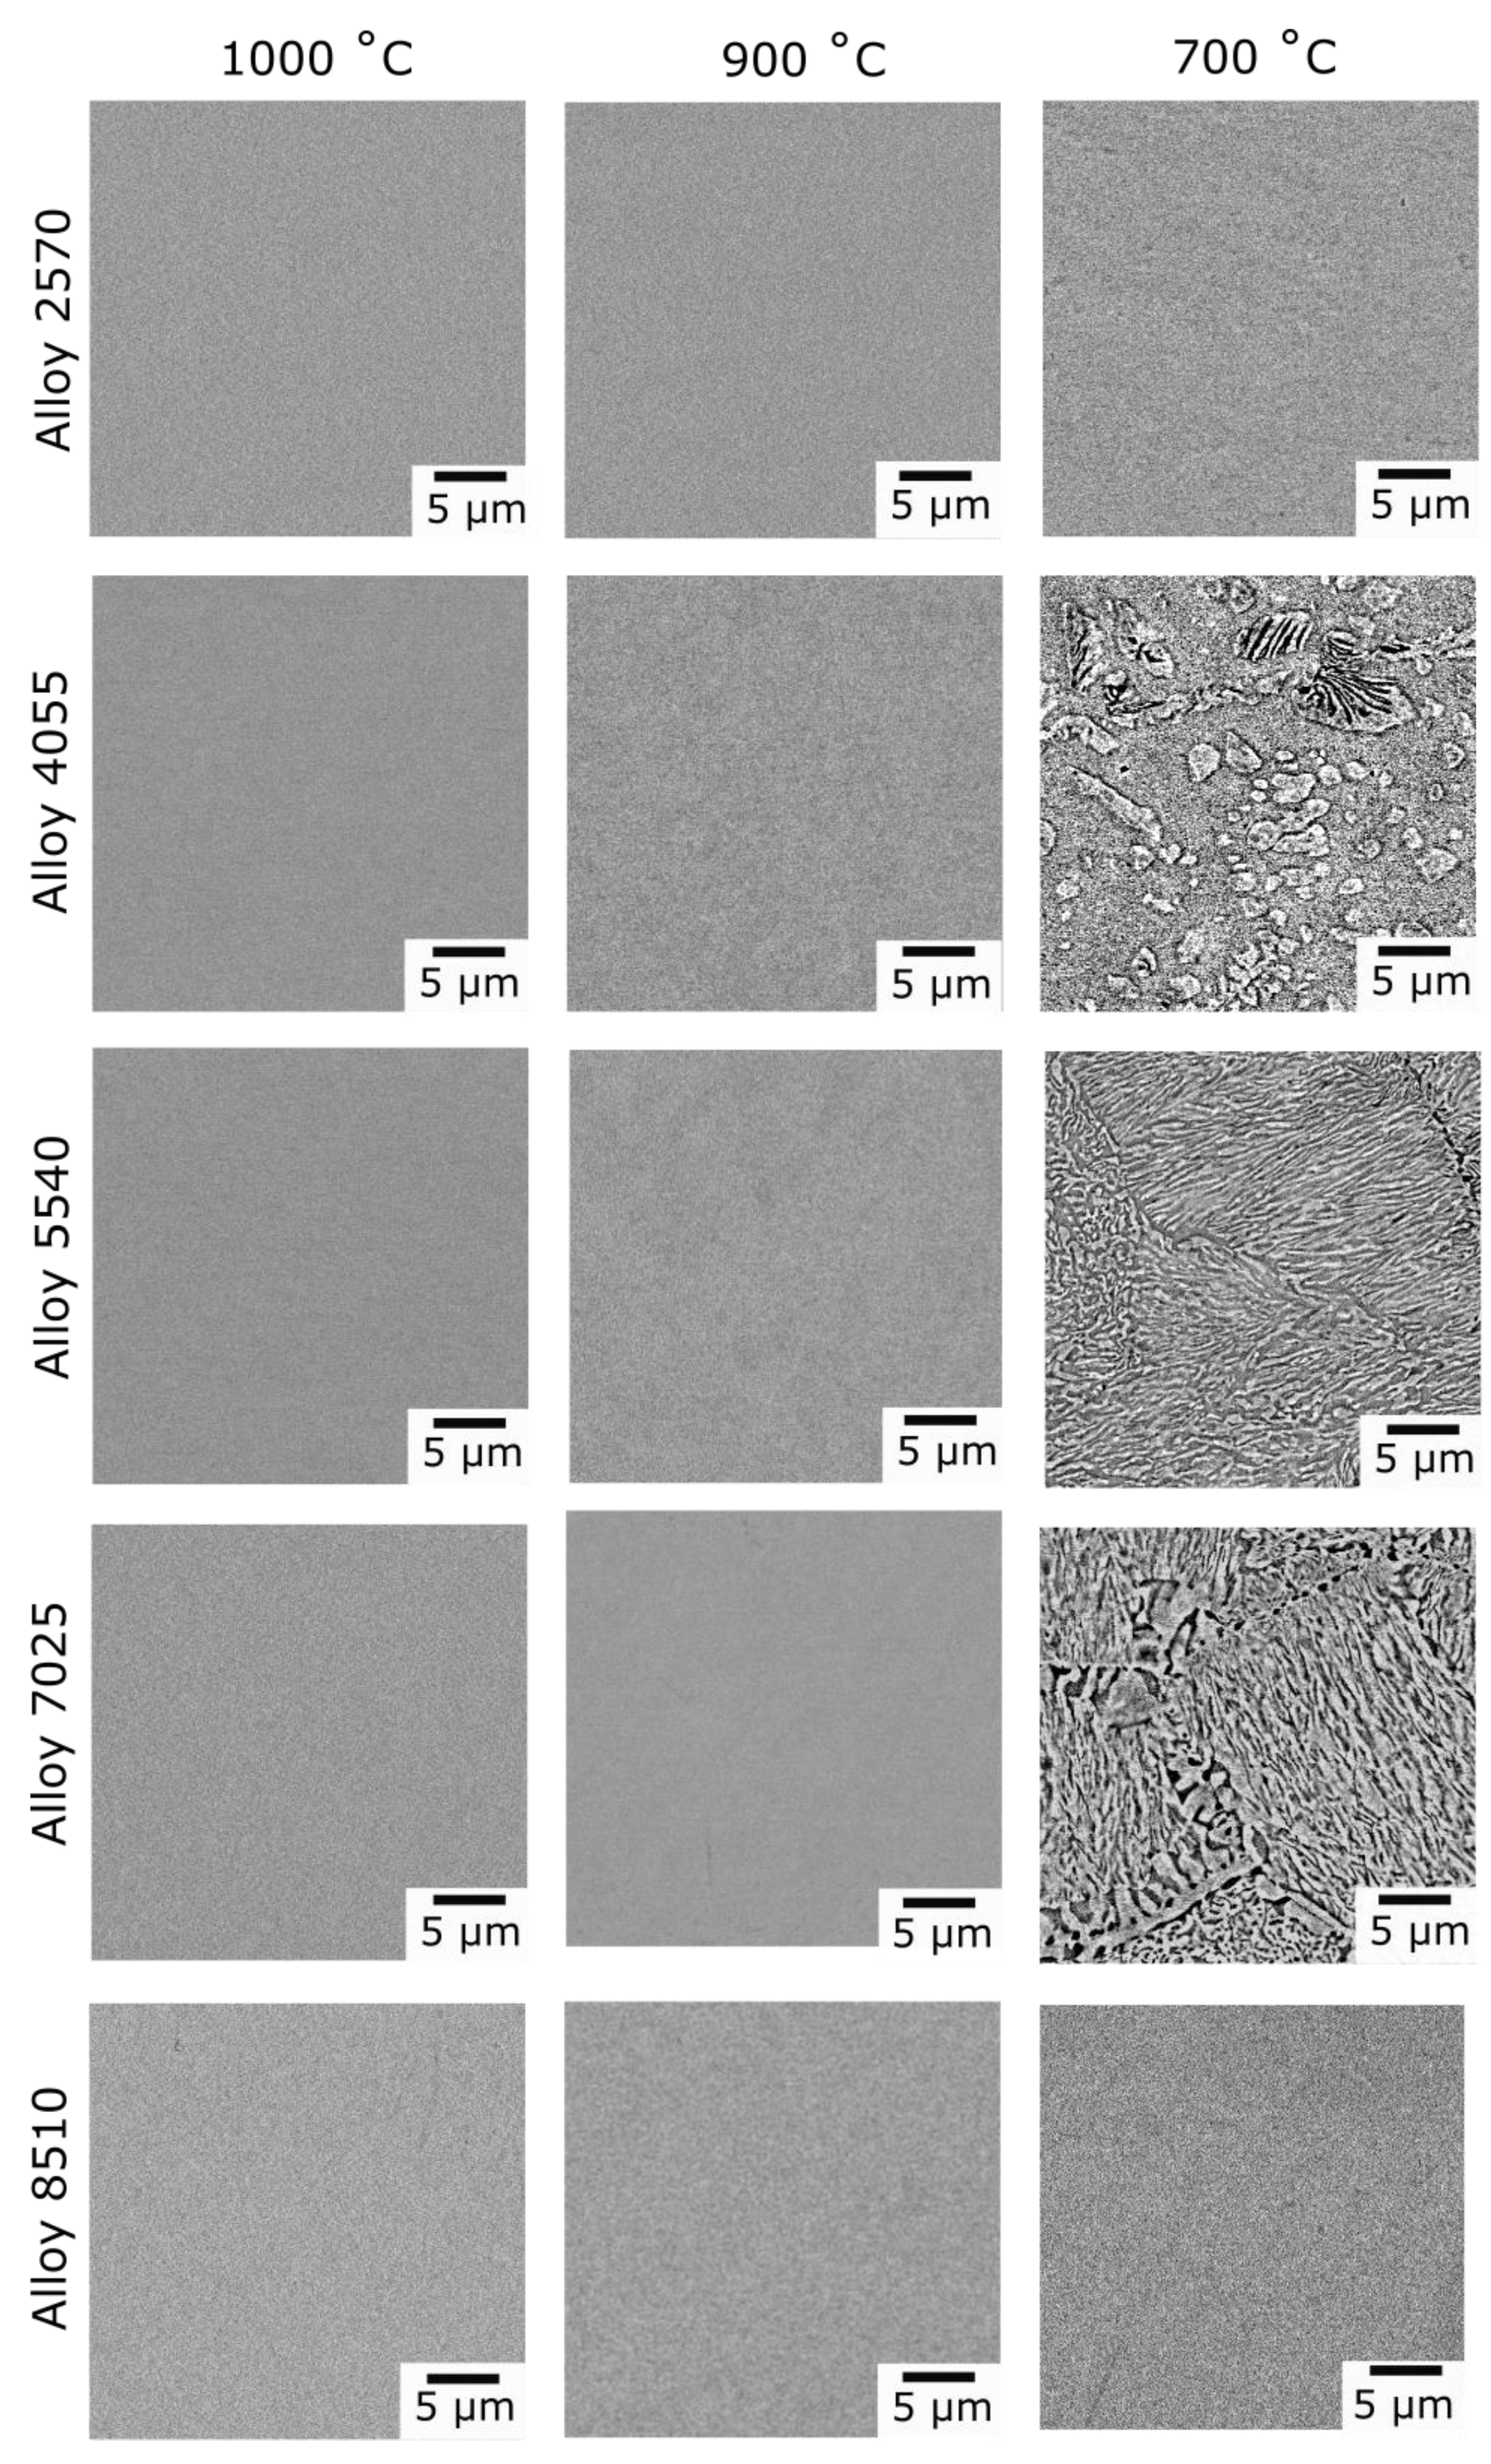
At 700 °C, the published isothermal sections suggest that Alloys 4055, 5540 and 7025 should all be within the bcc + bcc region. The experimental observations made in this study were in good agreement with this, as two phases were observed within the grain interiors of these alloys, both of which had bcc structures. However, an additional dark contrast Zr-rich grain boundary phase was present in all three alloys,
Figure 4, which was determined to have a hexagonal crystal structure,
Figure 9, with lattice parameters consistent with α-Zr. The presence of grain boundary phases may also be facilitated by the lower energy required for nucleation on the boundaries. This phase was also slightly enriched in O. The presence of a third Zr-rich phase is inconsistent with the predicted phase diagrams, however, these ternary diagrams do not consider the influence of O.
The dual bcc phase field has been proposed to be the precursor to forming the bcc+B2 microstructure observed in RSAs [
8,
10,
13]. In RSAs, quenched microstructures consist of aligned bcc and B2 phases with small lattice parameter misfits of ~1%, leading to a cube-cube arrangement and cuboidal precipitate morphologies [
3]. This was also observed to be the case in the Ta-Ti-Zr constituent system, which exhibited a nanoscale cuboidal precipitate morphology following quenching and a blocky morphology following long duration thermal exposure at 700 °C, with a misfit of 2.6–2.7% between the bcc phases [
10]. However, here, following long duration exposure at 700 °C, precipitates with rounded and curved lamellar morphologies were observed in alloys from the Ti-Nb-Zr system,
Figure 4. In depth analysis of these intragranular microstructures using electron diffraction revealed that both the matrix and precipitates had bcc structures and were aligned in a cube-cube relationship,
Figure 8 and
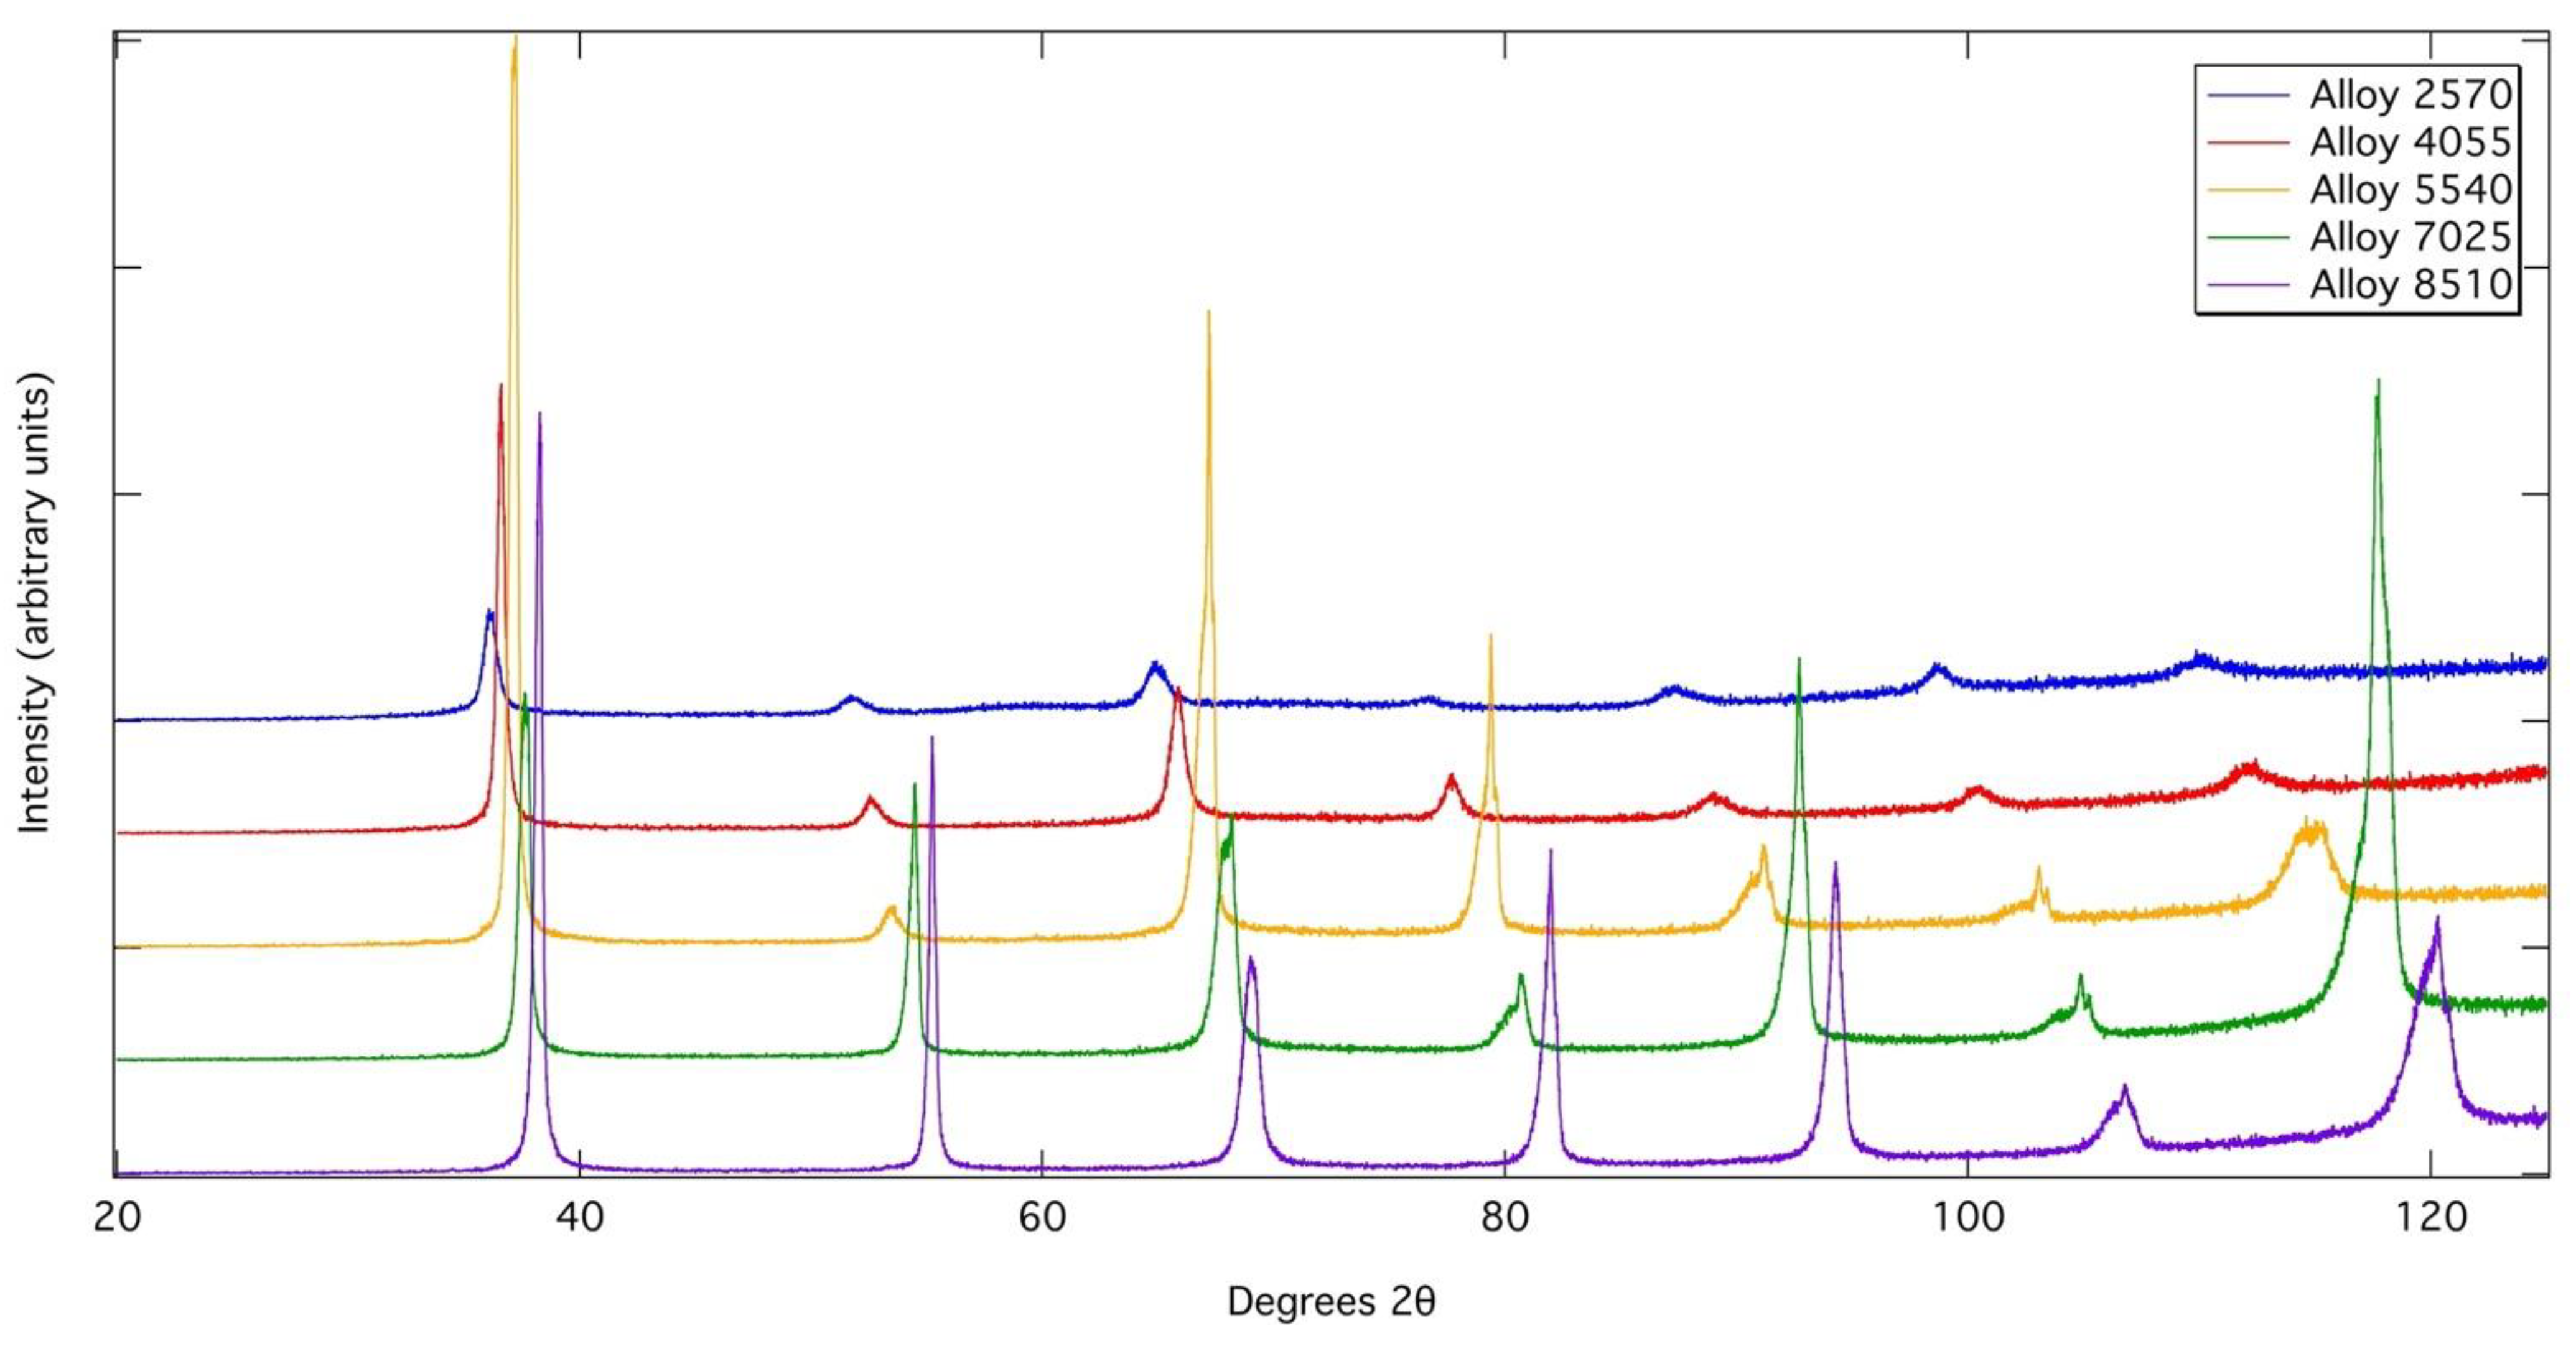
Figure 9. However, in contrast to RSAs and the Ta-Ti-Zr system, both electron and X-ray diffraction data showed that there was a significant difference in lattice parameters, which is most clearly visible in
Figure 9. Using Equation (1) below [
26], where δ is misfit and
a1 and
a2 are the lattice parameters the two phases, the misfit between the two bcc phases following exposure at 700 °C was found to be between 4.7 and 5.0%. This misfit is far greater than that in either RSAs or the Ta-Ti-Zr system and is likely to prevent coherent precipitate-matrix interfaces. Consequently, the effect of lattice symmetry on precipitate morphology will be reduced, leading to the more rounded morphologies observed here. Large misfit between phases is undesirable in alloys for use at high temperature, as it encourages precipitate coarsening and the incoherent interface can limit the effect of precipitate and order hardening mechanisms. To rectify this, further compositional modifications within the Ti-Nb-Zr system or with other elements may produce bcc phases with a lower misfit. The Ti content in both bcc phases was very similar,
Table 1, and therefore the difference in lattice parameter must be associated with the variation of Nb and Zr. Zr is known to have a strong effect on the lattice parameter [
23], whilst dependence on the Nb content is less significant [
27]. Therefore, it may be of benefit to design RSAs with a less marked Zr variation across the miscibility gap.
Whilst phase diagrams document the thermodynamically stable phases, they do not always account for metastable phases or the route of phase formation. The proposed microstructural formation route of the fine-scale two-phase features typical of RSAs is that of a spinodal decomposition. This process proceeds by the decomposition of a single phase bcc, which is thermodynamically stable at high temperature, into two bcc phases upon cooling, one of which then undergoes a subsequent ordering to produce a mixture of B2 and bcc phases [
8,
10,
13]. The presence of a miscibility gap within the Ti-Nb-Zr system does not necessarily mean the system exhibits spinodal behaviour as strain energy can inhibit decomposition occurring during cooling [
28,
29]. Consequently, the high misfit between the two product bcc phases in this system may be sufficient to suppress spinodal decomposition.
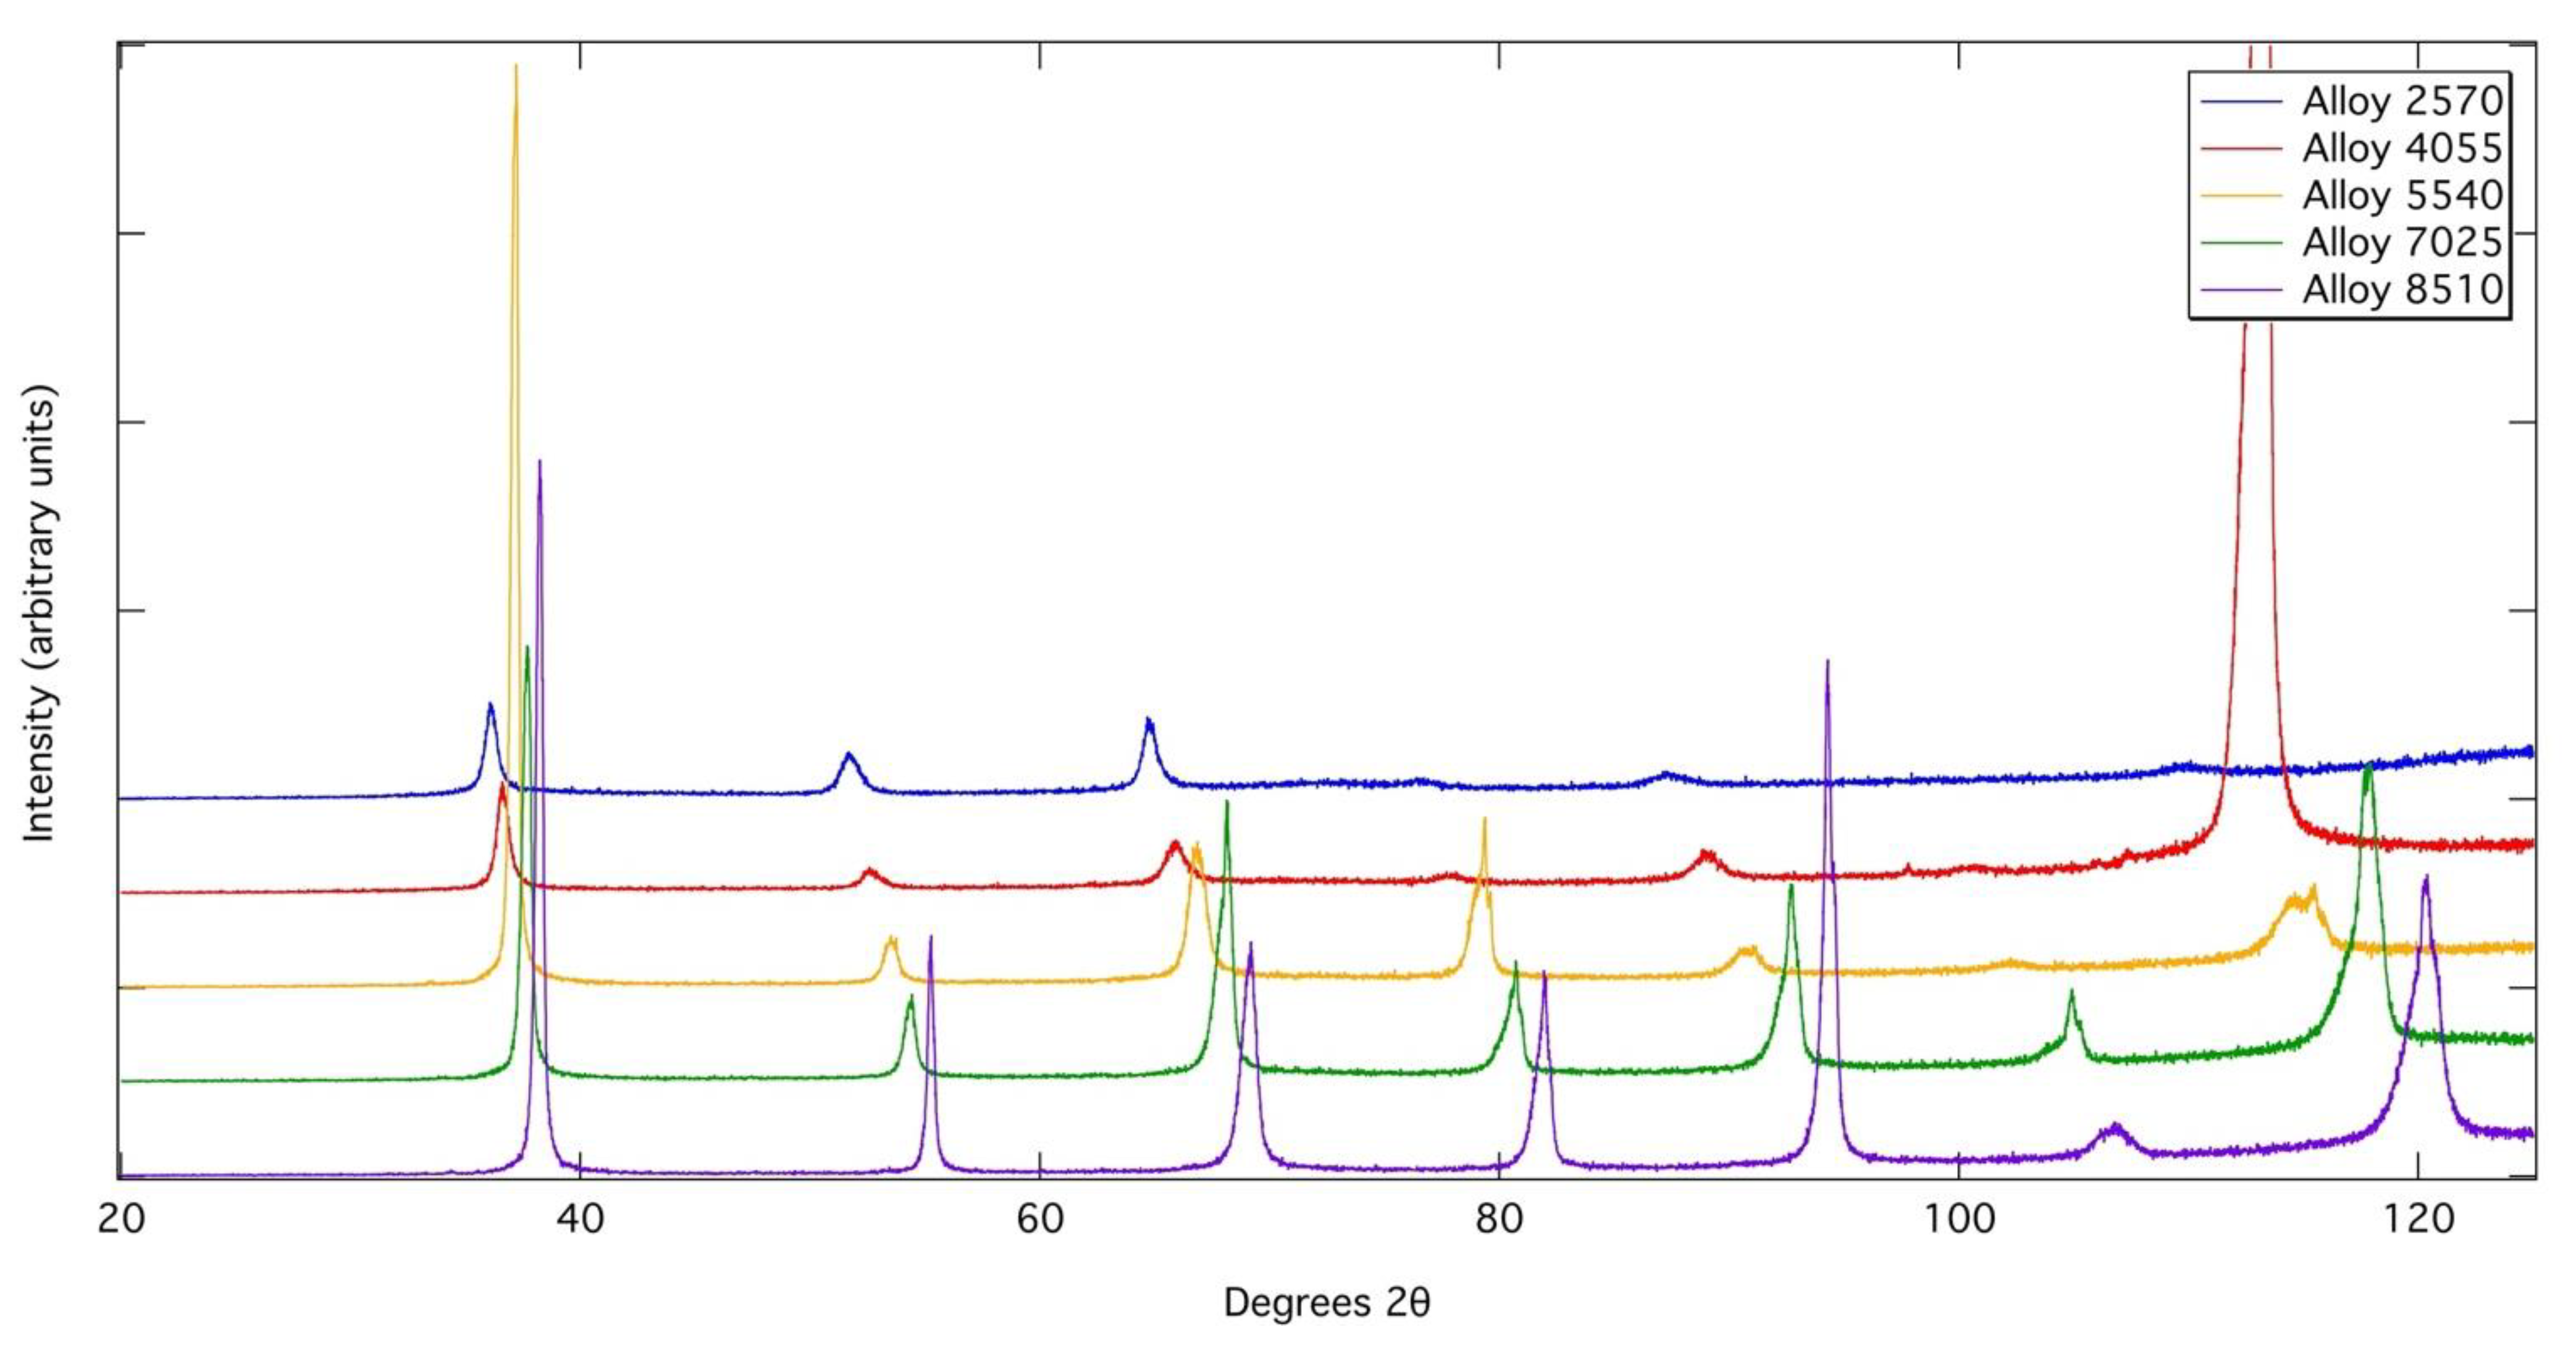
However, asymmetric peak profiles were observed in the XRD profiles of Alloys 4055, 5540, 7025 and 8510 following heat treatment, which could be rationalised by fitting with two bcc phases of very close lattice parameter in TOPAS Academic. This could suggest that a spinodal breakdown occurred during cooling from the heat treatment temperatures to form two bcc phases of very similar lattice parameters. However, other phases, such as the omega phase in Ti-rich alloys can also cause similar asymmetric peak profiles. Despite these asymmetries in the XRD peak profiles, no evidence of a two-phase nanoscale microstructure could be observed within the resolution of the imaging used (~10 nm), even following slow cooling from above the solvus temperature. Though it should be noted that the close atomic numbers of Nb and Zr give low compositional contrast. In addition, the equilibrium phase compositions determined from the samples exposed at 700 °C suggest that, at this temperature, Alloy 8510 lies outside of the miscibility gap and so it is not considered likely that this alloy could undergo a spinodal transformation. As such, from the data presented here, it is not possible to conclusively confirm whether or not spinodal decomposition occurs in this system. Given that spinodal decomposition has been shown to occur in similar alloys derived from the Ta-Ti-Zr system, it may be inferred that care must be taken in balancing the Nb and Ta contents of RSAs to ensure that the desired level precipitation is achieved.
Author Contributions
Conceptualization, N.G.J. and T.E.W.; Methodology, N.G.J. and T.E.W.; Formal Analysis, T.E.W.; Investigation, G.J.W., T.E.W. and E.J.P.; Resources, N.G.J.; Writing—Original Draft Preparation, T.E.W. and N.G.J.; Writing—Review and Editing, H.J.S., G.J.W. and E.J.P.; Visualization, T.E.W.; Supervision, N.G.J.; Project Administration, N.G.J.; Funding Acquisition, H.J.S. and N.G.J. All authors have read and agreed to the published version of the manuscript.
Funding
T.E.W., N.G.J. and H.J.S. would like to acknowledge support from the EPSRC/Rolls-Royce Strategic Partnership (EP/M005607/1). The support of the Henry Royce Institute for access to the FEI Talos electron microscope at Royce@Manchester (EP/R00661X/1, EP/S019367/1, EP/P025021/1 and EP/P025498/1) is also gratefully acknowledged, as is the same funding for EJP’s Research Area Lead position at the Institute.
Institutional Review Board Statement
Not applicable.
Informed Consent Statement
Not applicable.
Data Availability Statement
Acknowledgments
Preparation of the TEM sample was performed via FIB-liftout by G. West at the WMG, University of Warwick.
Conflicts of Interest
The authors declare no conflict of interest.
References
- Senkov, O.; Isheim, D.; Seidman, D.; Pilchak, A. Development of a Refractory High Entropy Superalloy. Entropy 2016, 18, 102. [Google Scholar] [CrossRef]
- Miracle, D.B.; Tsai, M.-H.; Senkov, O.N.; Soni, V.; Banerjee, R. Refractory high entropy superalloys (RSAs). Scr. Mater. 2020, 187, 445–452. [Google Scholar] [CrossRef]
- Jensen, J.K.; Welk, B.A.; Williams, R.E.A.; Sosa, J.M.; Huber, D.E.; Senkov, O.N.; Viswanathan, G.B.; Fraser, H.L. Characterization of the microstructure of the compositionally complex alloy Al1Mo0.5Nb1Ta0.5Ti1Zr1. Scr. Mater. 2016, 121, 1–4. [Google Scholar] [CrossRef]
- Miracle, D.B.; Senkov, O.N. A critical review of high entropy alloys and related concepts. Acta Mater. 2017, 122, 448–511. [Google Scholar] [CrossRef] [Green Version]
- Senkov, O.N.; Jensen, J.K.; Pilchak, A.L.; Miracle, D.B.; Fraser, H.L. Compositional variation effects on the microstructure and properties of a refractory high-entropy superalloy AlMo0.5NbTa0.5TiZr. Mater. Des. 2018, 139, 498–511. [Google Scholar] [CrossRef]
- Gorsse, S.; Couzinié, J.-P.; Miracle, D.B. From high-entropy alloys to complex concentrated alloys. Comptes Rendus Phys. 2018, 19, 721–736. [Google Scholar] [CrossRef]
- Soni, V.; Senkov, O.N.; Gwalani, B.; Miracle, D.B.; Banerjee, R. Microstructural Design for Improving Ductility of An Initially Brittle Refractory High Entropy Alloy. Sci. Rep. 2018, 8, 8816. [Google Scholar] [CrossRef] [Green Version]
- Soni, V.; Gwalani, B.; Alam, T.; Dasari, S.; Zheng, Y.; Senkov, O.N.; Miracle, D.; Banerjee, R. Phase inversion in a two-phase, BCC+B2, refractory high entropy alloy. Acta Mater. 2020, 185, 89–97. [Google Scholar] [CrossRef]
- Soni, V.; Gwalani, B.; Senkov, O.N.; Viswanathan, B.; Alam, T.; Miracle, D.B.; Banerjee, R. Phase stability as a function of temperature in a refractory high-entropy alloy. J. Mater. Res. 2018, 33, 3235–3246. [Google Scholar] [CrossRef]
- Whitfield, T.E.; Pickering, E.J.; Christofidou, K.A.; Jones, C.N.; Stone, H.J.; Jones, N.G. Elucidating the microstructural development of refractory metal high entropy superalloys via the Ti-Ta-Zr constituent system. J. Alloys Compd. 2020, 818, 152935. [Google Scholar] [CrossRef]
- Whitfield, T.E.; Pickering, E.J.; Talbot, C.E.; Jones, C.N.; Stone, H.J.; Jones, N.G. Observation of a refractory metal matrix containing Zr-Ti-rich precipitates in a Mo0.5NbTa0.5TiZr high entropy alloy. Scr. Mater. 2020, 180, 71–76. [Google Scholar] [CrossRef]
- Whitfield, T.E.; Pickering, E.J.; Owen, L.R.; Senkov, O.N.; Miracle, D.B.; Stone, H.J.; Jones, N.G. An assessment of the thermal stability of refractory high entropy superalloys. J. Alloys Compd. 2020, 857, 157583. [Google Scholar] [CrossRef]
- Whitfield, T.E.; Pickering, E.J.; Owen, L.R.; Jones, C.N.; Stone, H.J.; Jones, N.G. The effect of Al on the formation and stability of a BCC - B2 microstructure in a refractory metal high entropy superalloy system. Materialia 2020, 13, 100858. [Google Scholar] [CrossRef]
- Whitfield, T.E.; Stone, H.J.; Jones, C.N.; Jones, N.G. Microstructural Degradation of the AlMo0.5NbTa0.5TiZr Refractory Metal High-Entropy Superalloy at Elevated Temperatures. Entropy 2021, 23, 80. [Google Scholar] [CrossRef] [PubMed]
- Okamoto, H. Ta-Zr (Tantalum-Zirconium). J. Phase Equilibria 1996, 17, 555. [Google Scholar] [CrossRef]
- Abriata, J.P.; Bolcich, J.C. The Nb-Zr (Niobium-Zirconium) System. Bull. Alloy Phase Diagr. 1982, 3, 34–44. [Google Scholar] [CrossRef]
- Doi, T.; Ishida, H.; Umezawa, T. Study of Nb-Zr-Ti Phase Diagram (Studies of a Hard Superconductor, II). J. Jpn. Inst. Met. Mater. 1996, 30, 139–145. [Google Scholar] [CrossRef] [Green Version]
- Doi, T.; Kitada, M.; Ishida, F. Isothermal Phase Diagram of the Nb-Zr-Ti Ternary System at 570 °C (Supplement). J. Jpn. Inst. Met. Mater. 1968, 32, 684–685. [Google Scholar] [CrossRef]
- Kumar, K.C.H.; Wollants, P.; Delaey, L. Thermodynamic assessment of the Ti-Zr system and calculation of the Nb-Ti-Zr phase diagram. J. Alloys Compd. 1994, 206, 121–127. [Google Scholar] [CrossRef]
- Lin, L.; Delaey, L.; Van Der Biest, O.; Wollants, P. Calculation of Isothermal Sections of Three Ternary Ti-Zr-X Systems. Scr. Mater. 1996, 34, 1411–1416. [Google Scholar] [CrossRef]
- Tokunaga, T.; Matsumoto, S.; Ohtani, H.; Hasebe, M. Thermodynamic Calculation of Phase Equilibria in the Nb-Ni-Ti-Zr Quaternary System. Mater. Trans. 2007, 48, 89–96. [Google Scholar] [CrossRef] [Green Version]
- Hu, Y.-M.; Liu, X.-D.; Guo, N.-N.; Wang, L.; Su, Y.-Q.; Guo, J.-J. Microstructure and mechanical properties of NbZrTi and NbHfZrTi alloys. Rare Met. 2019, 38, 840–847. [Google Scholar] [CrossRef]
- Pang, E.L.; Pickering, E.J.; Baik, S.I.; Seidman, D.N.; Jones, N.G. The effect of zirconium on the omega phase in Ti-24Nb-[0-8]Zr (at.%) alloys. Acta Mater. 2018, 153, 62–70. [Google Scholar] [CrossRef]
- Bennett, J.M.; Pickering, E.J.; Barnard, J.S.; Rugg, D.; Stone, H.J.; Jones, N.G. Observation of a new B2 structured phase in Ti-15Mo (wt%). Mater. Charact. 2018, 142, 523–530. [Google Scholar] [CrossRef]
- Collings, E.W. The Physical Metallurgy of Titanium Alloys; American Society for Metals: Russell, OH, USA, 1984. [Google Scholar]
- Reed, R.C. The Superalloys: Fundamentals and Applications; Fundamentals and Applications; Cambridge University Press: Cambridge, UK, 2006; pp. 33–120. [Google Scholar]
- Moreno, J.J.G.; Bönisch, M.; Panagiotopoulos, N.T.; Calin, M.; Papageorgiou, D.G.; Gebert, A.; Eckert, J.; Evangelakis, G.A.; Lekka, C.E. Ab-initio and experimental study of phase stability of Ti-Nb alloys. J. Alloys Compd. 2017, 696, 481–489. [Google Scholar] [CrossRef]
- Rundman, K.B.; Hilliard, J.E. Early stages of spinodal decomposition in an aluminium-zinc alloy. Acta Metall. 1967, 15, 1025–1033. [Google Scholar] [CrossRef]
- Cahn, J.W. On spinodal decomposition. Acta Metall. 1961, 9, 795–801. [Google Scholar] [CrossRef]
Figure 1.
Predicted Ti-Ta-Zr phase diagram at 900 °C and 700 °C (adapted from [
20]) with the nominal composition of the alloys investigated in this study superimposed as red crosses. The red lines indicate the fixed Ti content of the alloys studied.
Figure 2.
X-ray diffraction patterns obtained from each alloy after solution heat treatment solutioned.
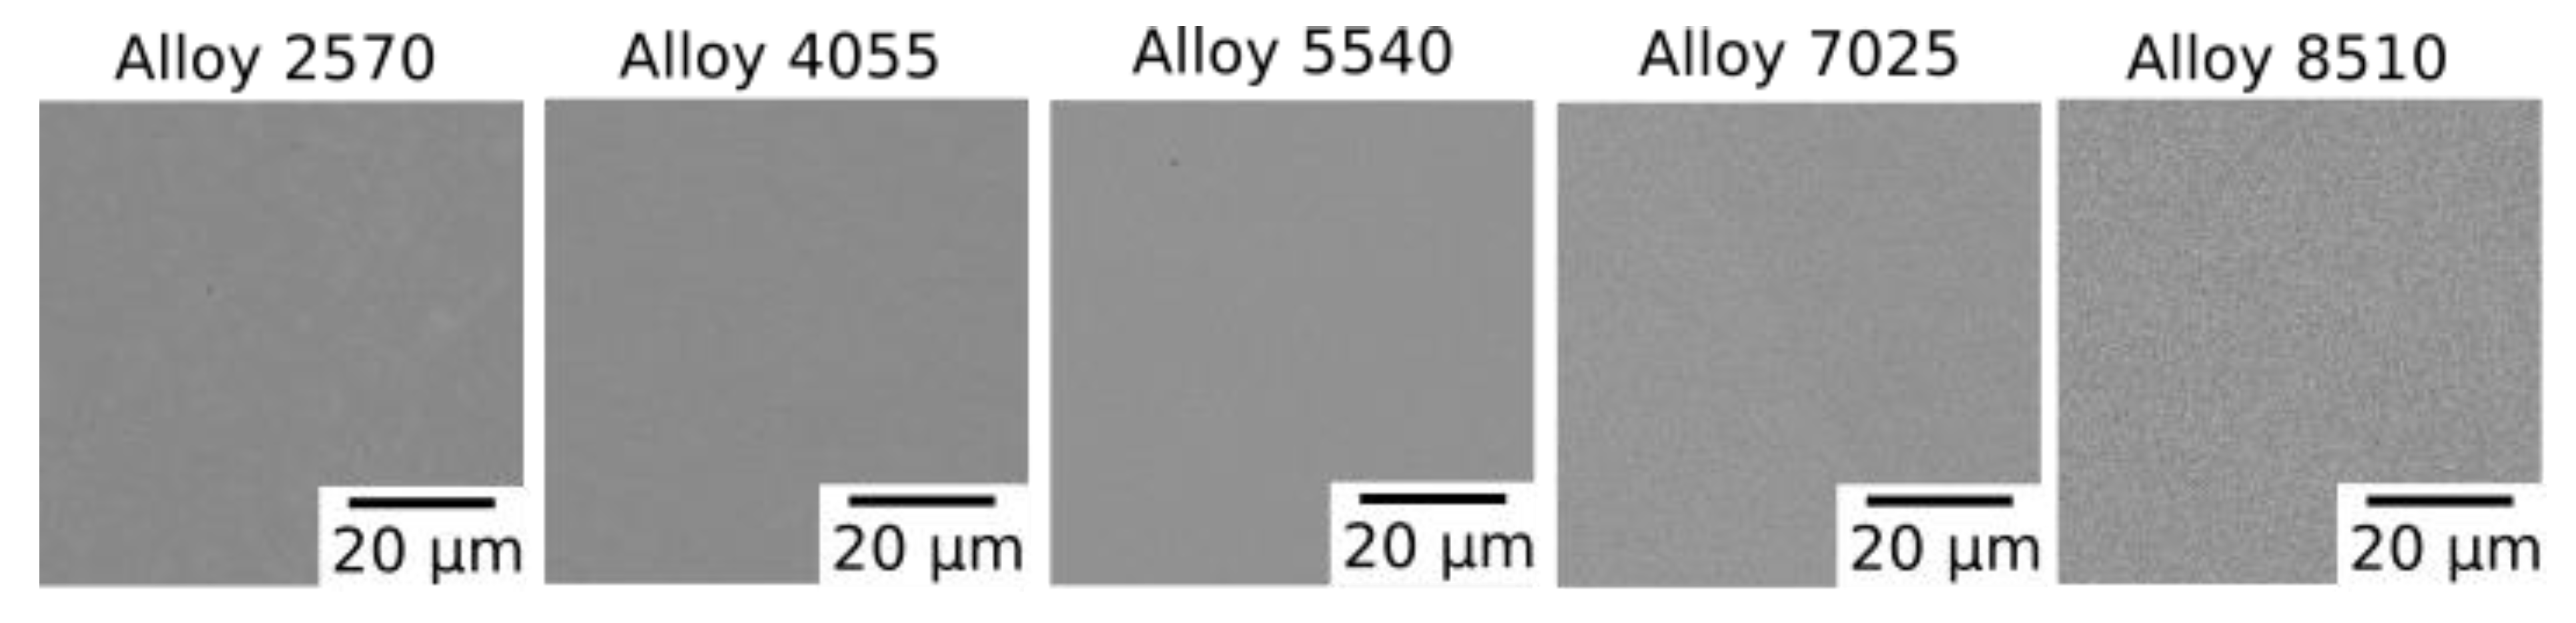
Figure 3.
BSE images of each of the alloys in the solutioned condition.
Figure 4.
BSE images of Alloys 2570 (Ti-25Nb-70Zr at.%), 4055 (Ti-40Nb-55Zr at.%), 5540 (Ti-55Nb-40Zr at.%), 7025 (Ti-70Nb-25Zr at.%), and 8510 (Ti-85Nb-10Zr at.%) following exposure at 1000, 900 and 700 °C for 1000 h.
Figure 5.
BSE image of a grain boundary region in Alloy 7025 (Ti-70Nb-25Zr at.%) following exposure at 900 °C for 1000 h showing the dark BSE contrast phase observed in the vicinity of grain boundaries and corresponding EDX elemental distribution maps for Ti, Nb, Zr and O.
Figure 6.
X-ray diffraction patterns acquired from each of the alloys following exposure at 900 °C for 1000 h.
Figure 7.
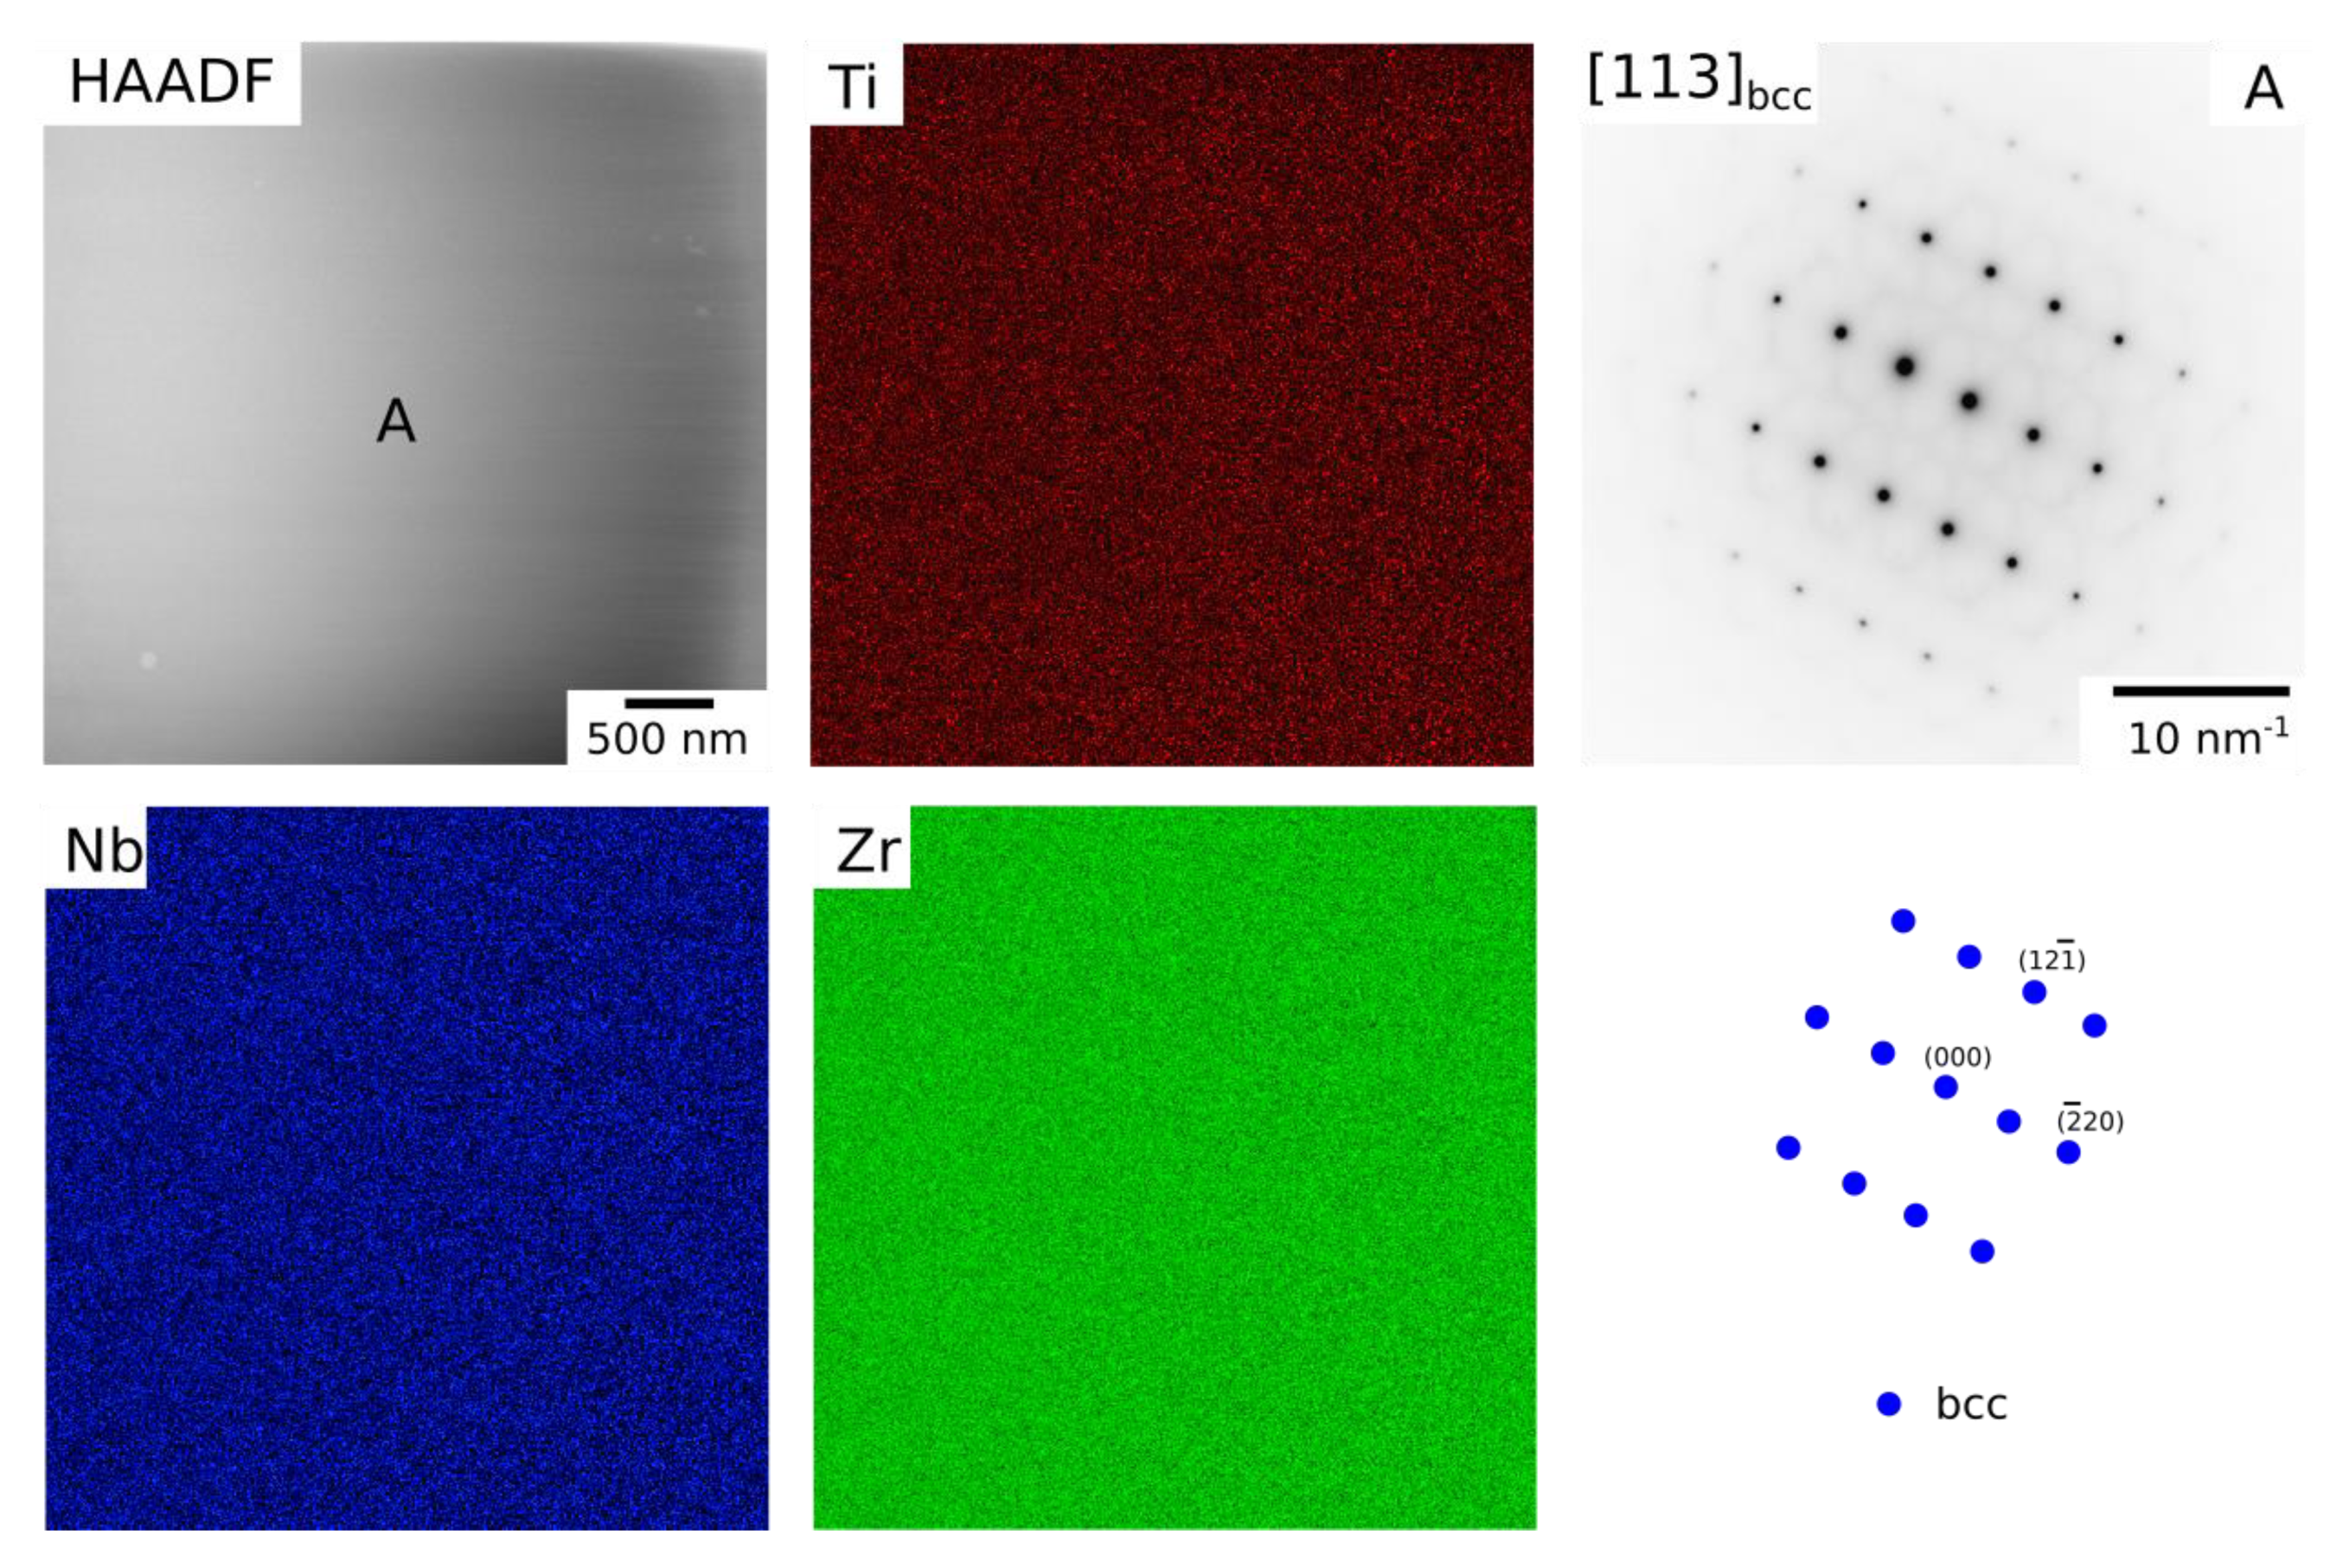
TEM HAADF image and STEM EDX elemental distribution maps for Ti, Nb and Zr acquired for Alloy 2570 (Ti-25Nb-70Zr at.%) following exposure at 700 °C for 1000 h. An SADP corresponding to the region labelled A contains bcc reflections consistent with the [113] zone axis, as shown in the related key diagram below.
Figure 8.
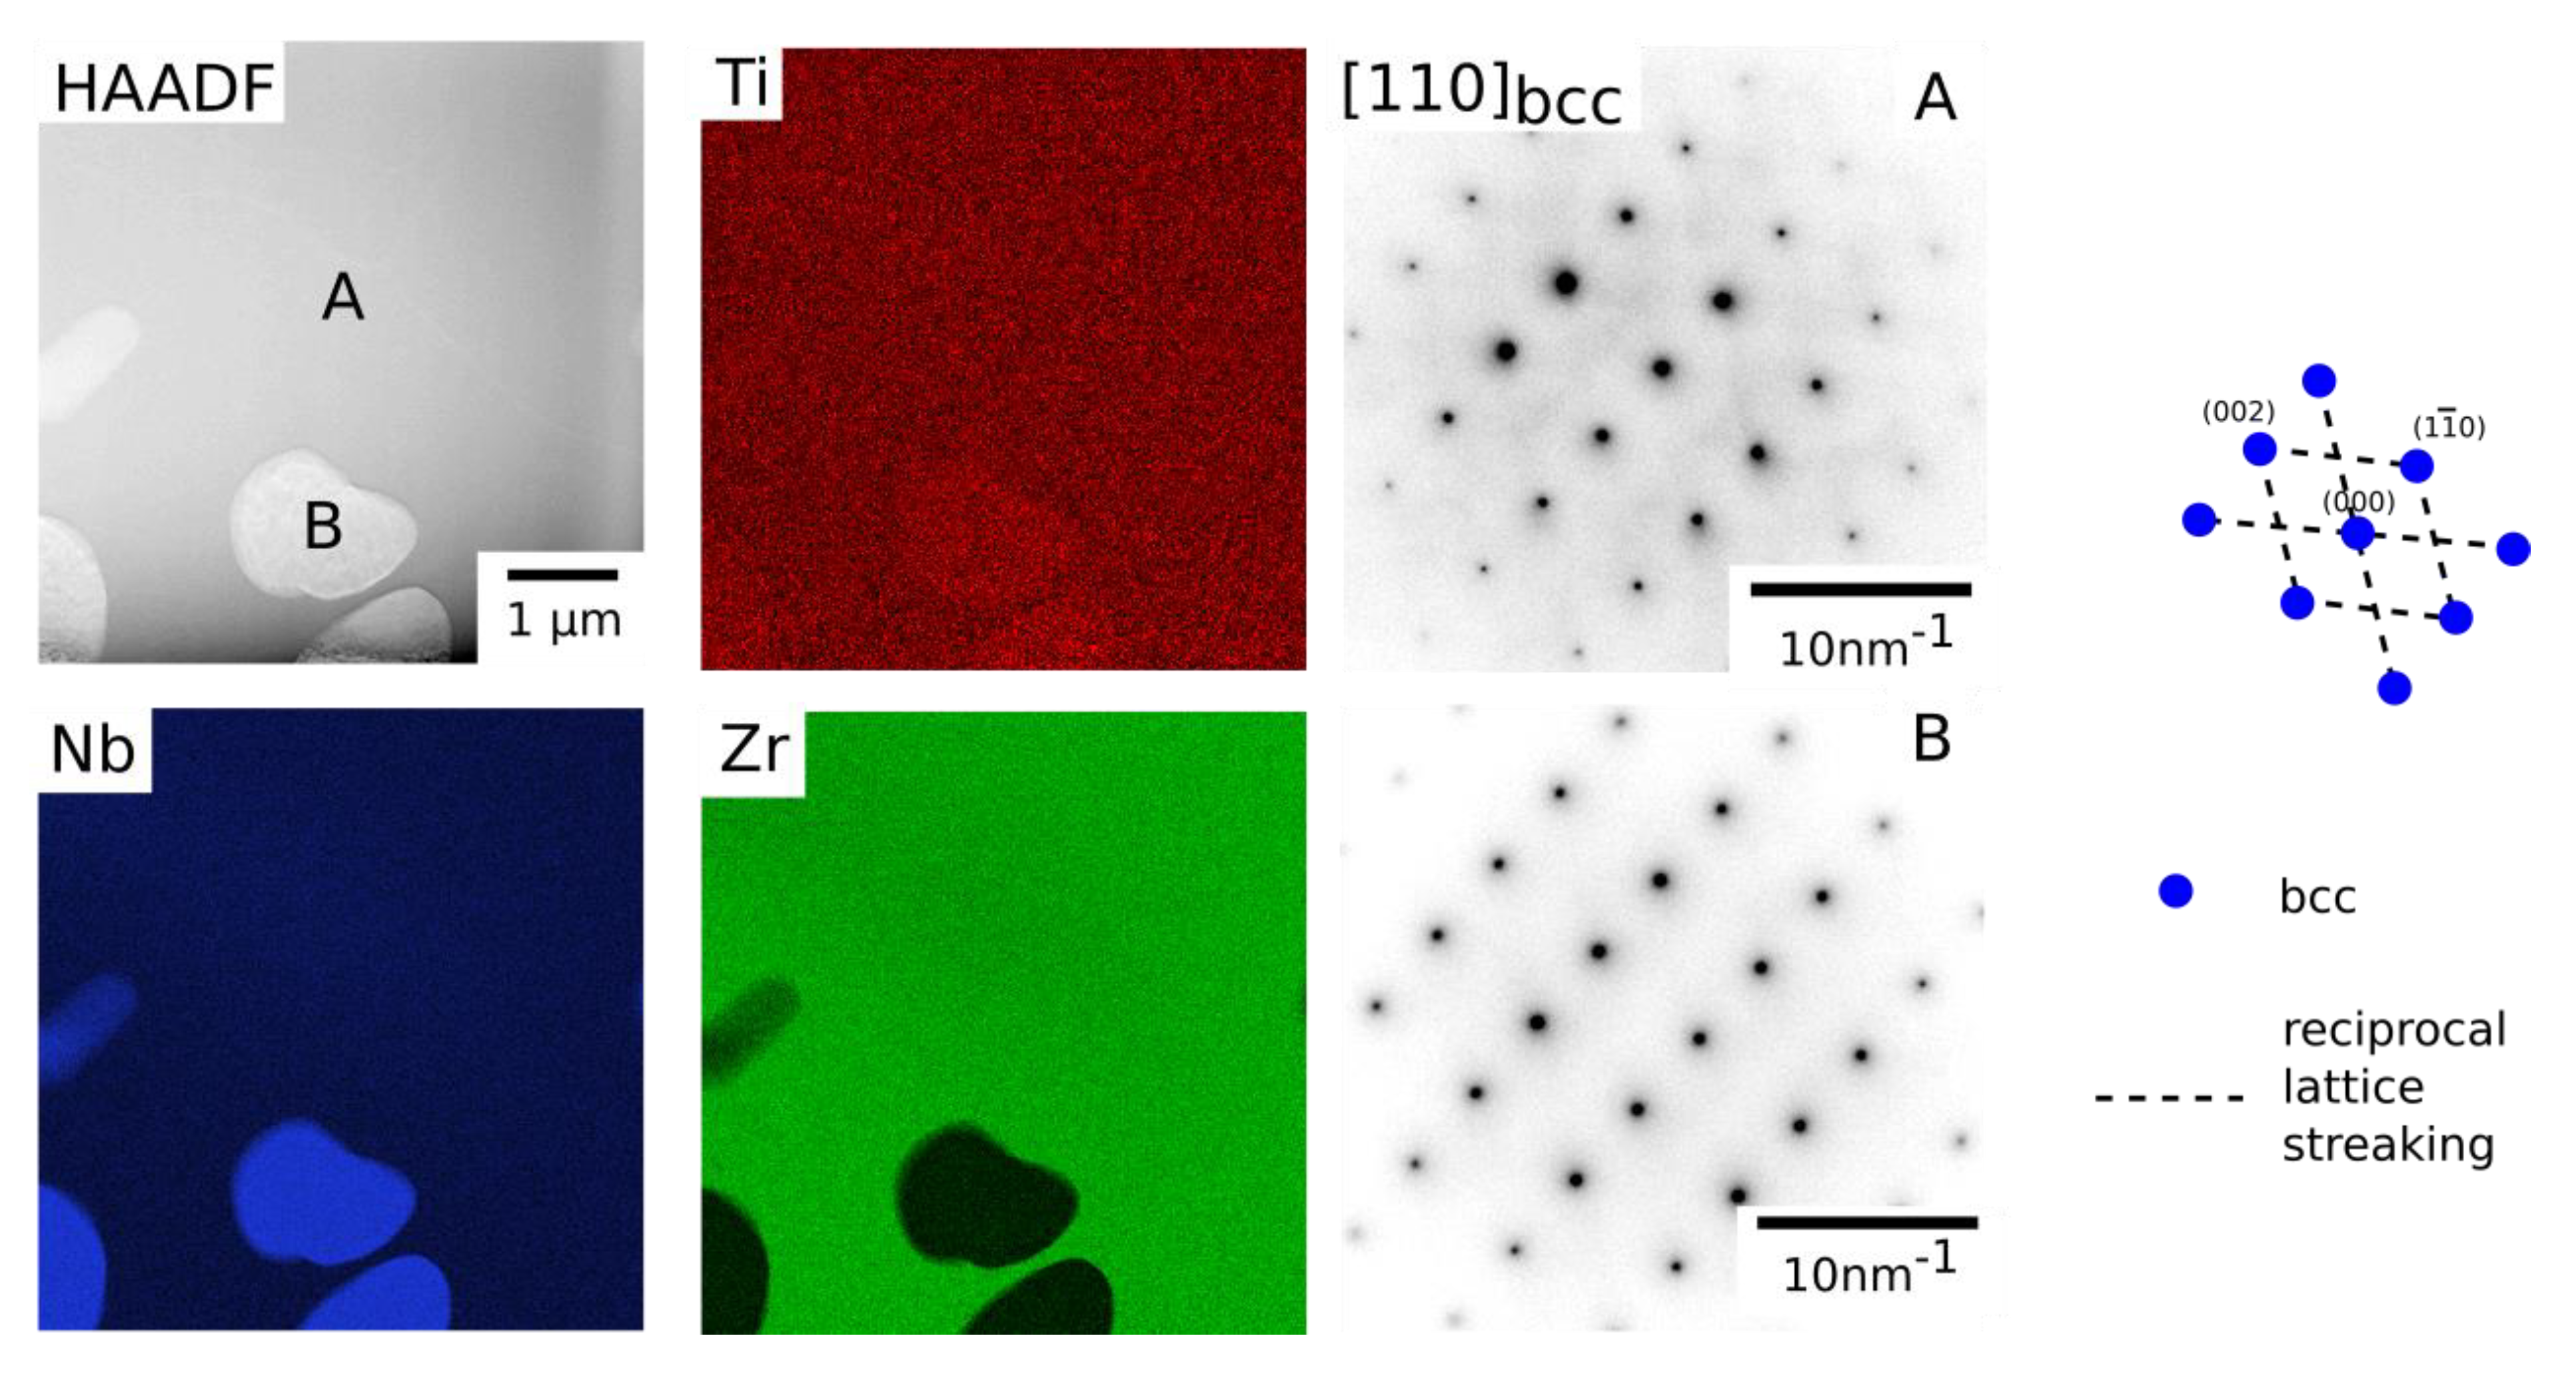
TEM HAADF image and STEM EDX elemental distribution maps for Ti, Nb and Zr acquired for Alloy 4055 (Ti-40Nb-55Zr at.%) following exposure at 700 °C for 1000 h. An SADP from a Zr rich region (A) and Nb rich region (B) showed only bcc reflections consistent with the [110] zone axis. The related key diagram is shown to the right.
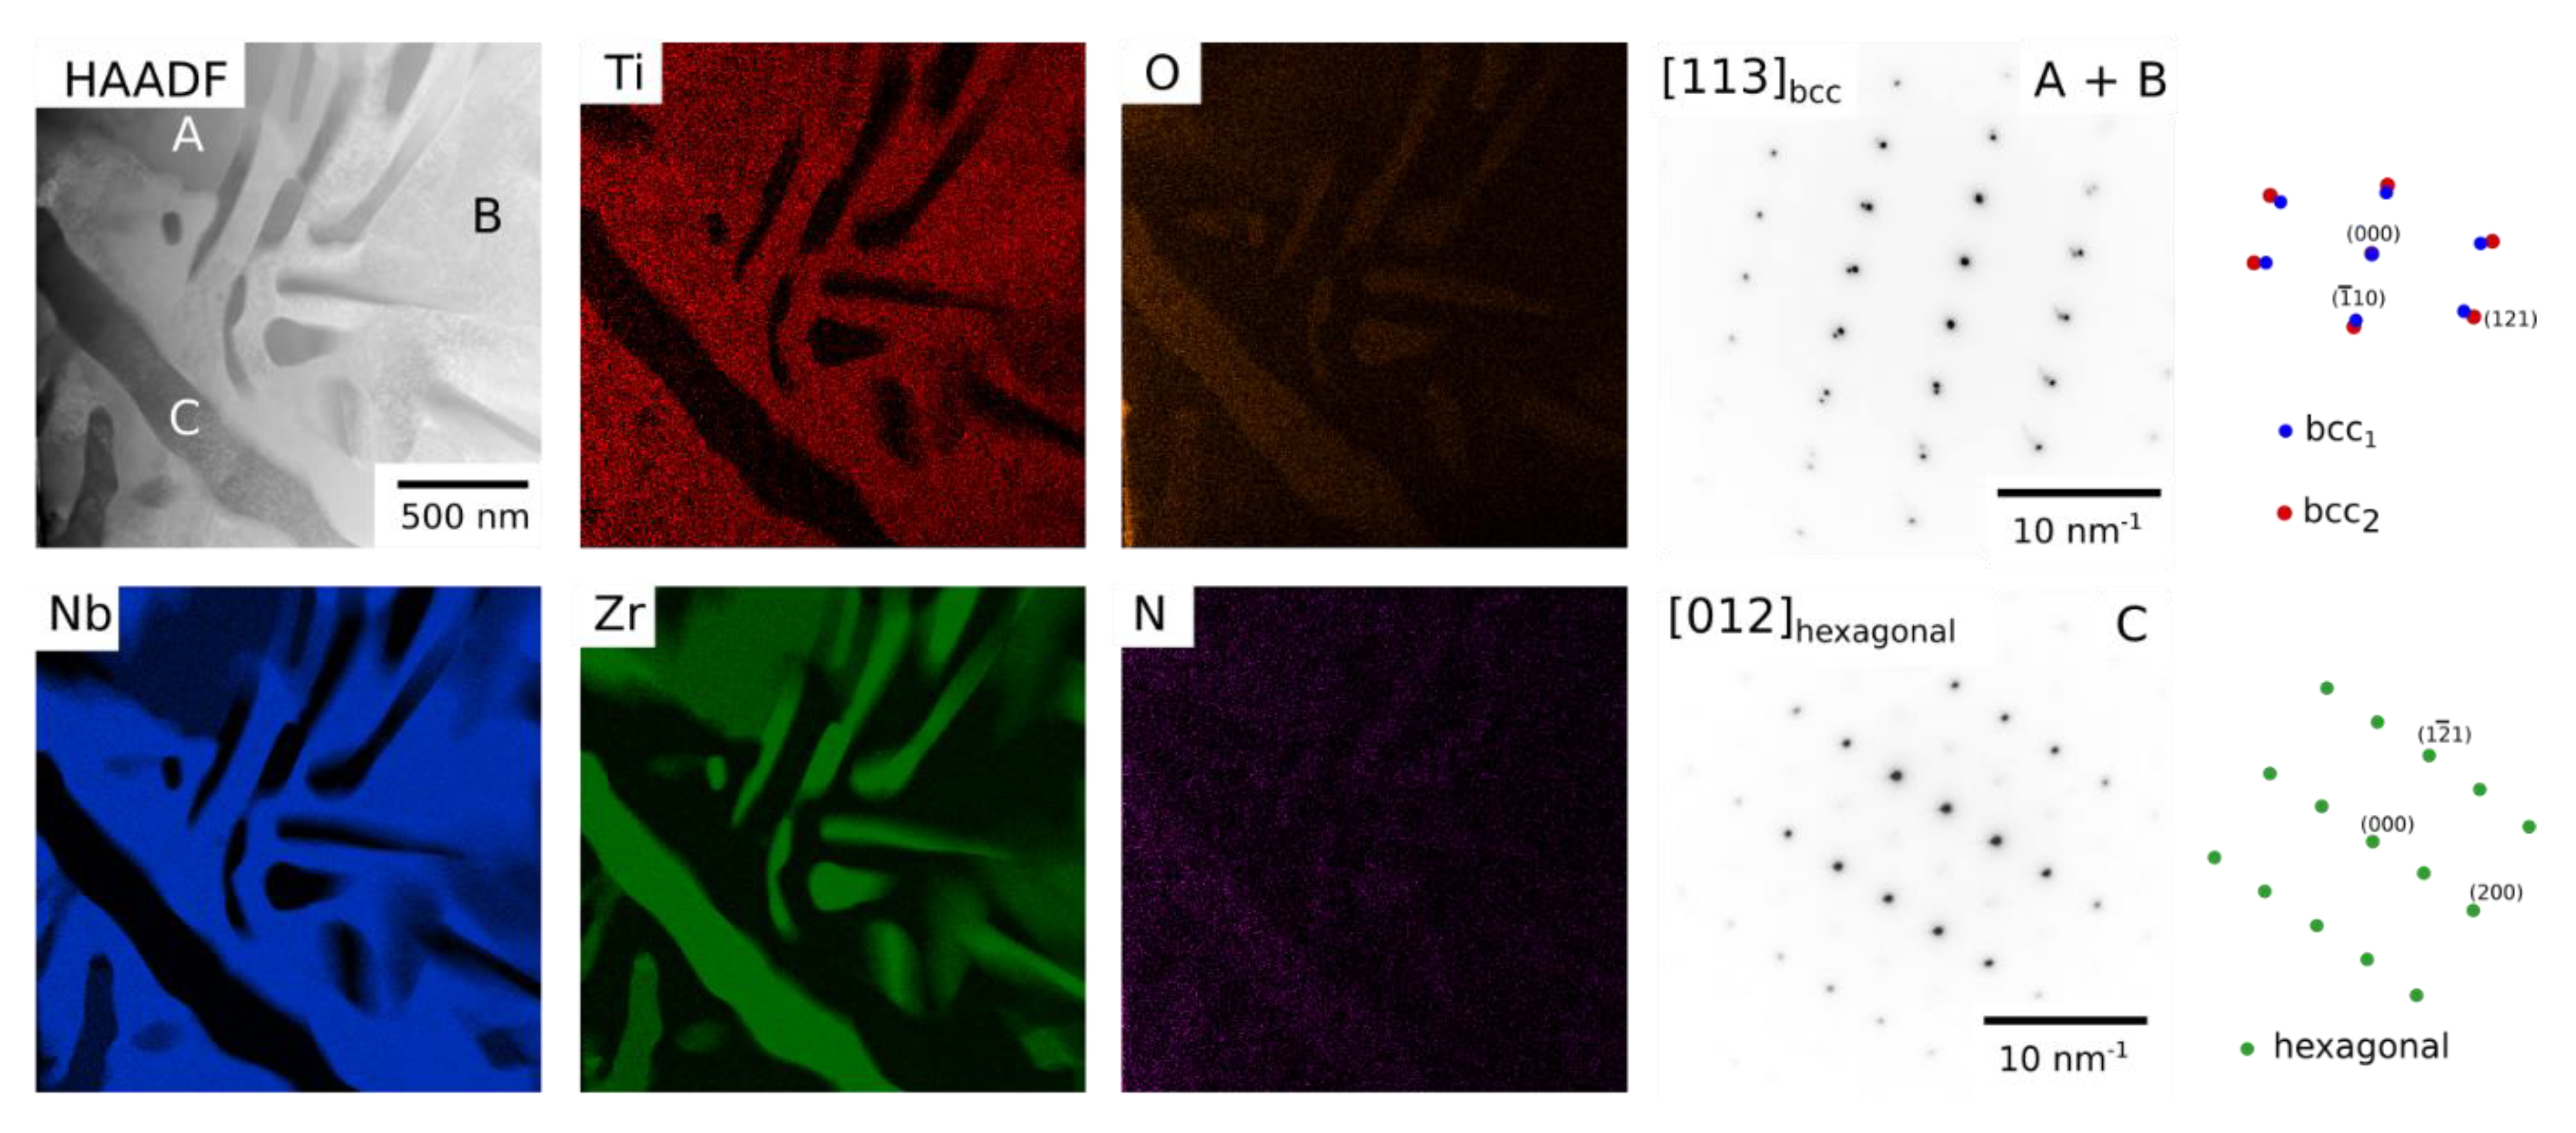
Figure 9.
TEM HAADF image and STEM EDX elemental distribution maps for Ti, Nb, Zr, O and N acquired for Alloy 5540 (Ti-55Nb-40Zr at.%) following exposure at 700 °C for 1000 h. Right—an SADP from a region containing both the Zr rich region (A) and Nb rich region (B) showed only bcc reflections whilst that from region (C) contained hexagonal reflections. Key diagrams are included for both SADPs.
Figure 10.
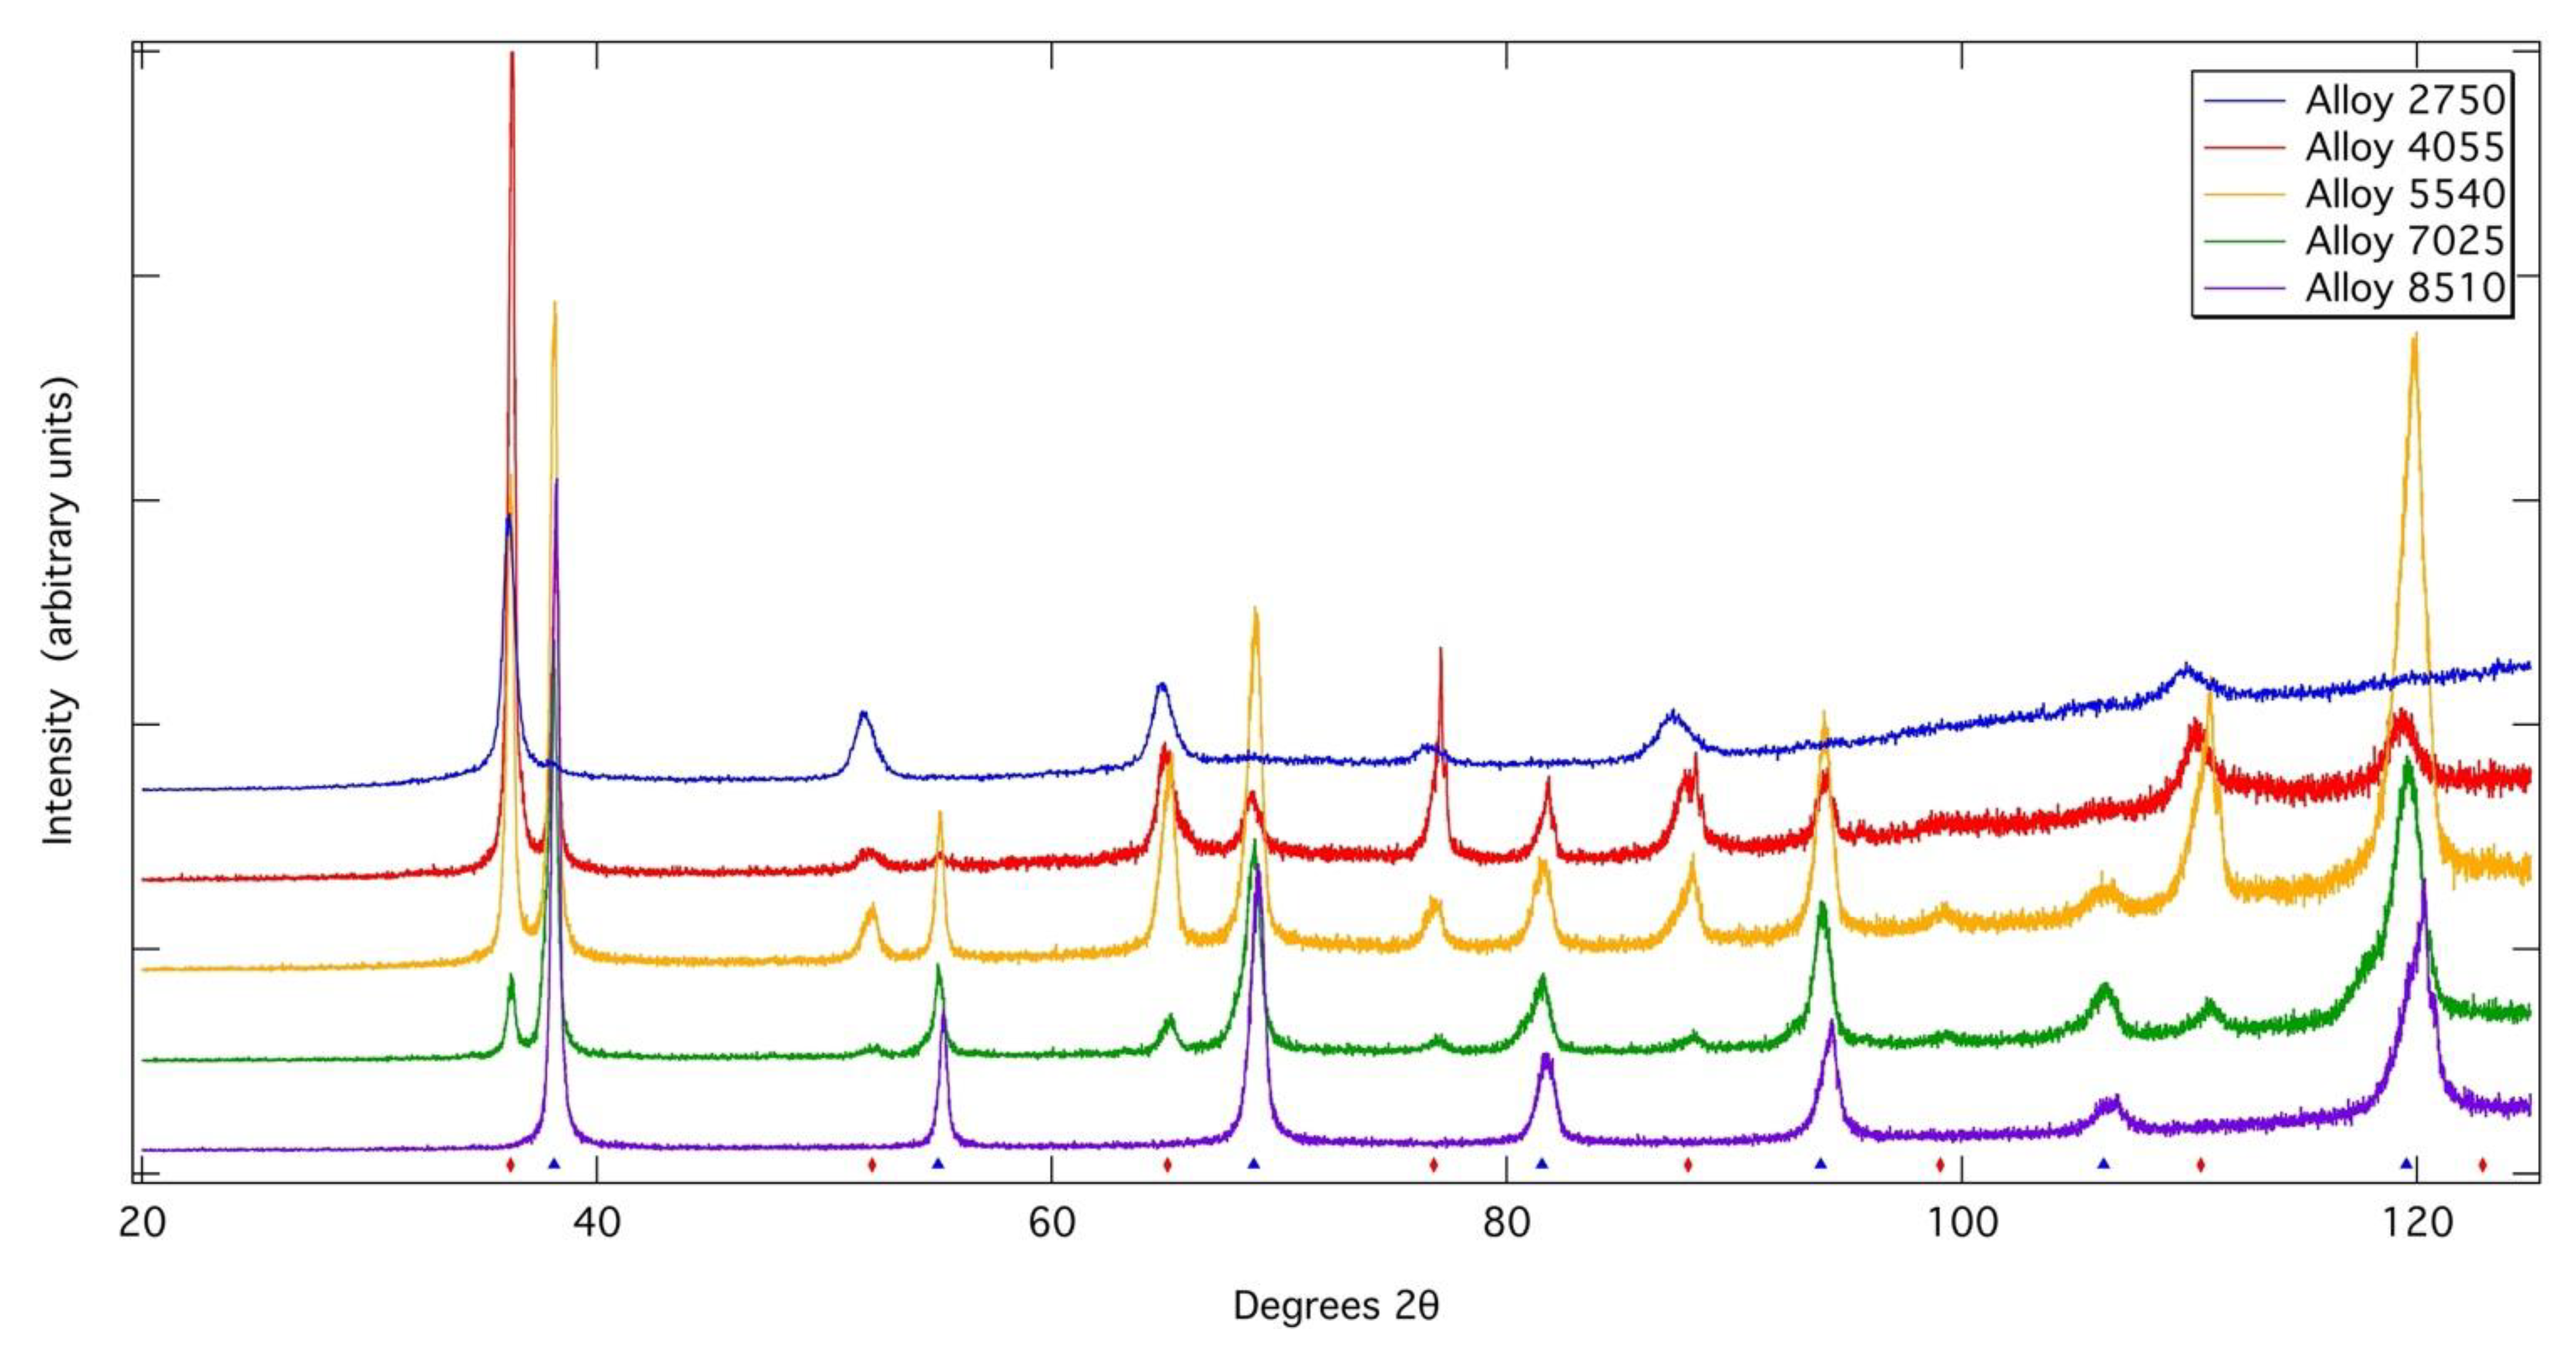
X-ray diffraction patterns acquired from each of the alloys following exposure at 700 °C for 1000 h. Tick marks indicate the positions of bcc phases.
Table 1.
Measured alloy compositions, determined by XRF and fusion-thermal conductivity.
| Alloy | Alloy Designation | Ti (at.%) | Nb (at.%) | Zr (at.%) | O (at.%) |
|---|
| Ti-25Nb-70Zr | Alloy 2570 | 5.0 | 22.9 | 71.7 | 0.4 |
| Ti-40Nb-55Zr | Alloy 4055 | 5.0 | 40.2 | 54.5 | 0.3 |
| Ti-55Nb-40Zr | Alloy 5540 | 5.0 | 55.6 | 39.2 | 0.2 |
| Ti-70Nb-25Zr | Alloy 7025 | 4.9 | 70.1 | 24.7 | 0.3 |
| Ti-85Nb-10Zr | Alloy 8510 | 4.5 | 86.4 | 8.9 | 0.2 |
Table 2.
Lattice parameters of the phases present in all of the alloys studied in the solution heat treated condition.
| Alloy | Lattice Parameter of bcc1 (Å) | Lattice Parameter of bcc2 (Å) |
|---|
| Solutioned | | |
| Alloy 2570 | 3.52 | - |
| Alloy 4055 | 3.47 | - |
| Alloy 5540 | 3.41 | - |
| Alloy 7025 | 3.38 | - |
| Alloy 8510 | 3.33 | - |
| 1000 °C | | |
| Alloy 2570 | 3.53 | - |
| Alloy 4055 | 3.47 | - |
| Alloy 5540 | 3.40 | - |
| Alloy 7025 | 3.38 | - |
| Alloy 8510 | 3.33 | - |
| 900 °C | | |
| Alloy 2570 | 3.52 | - |
| Alloy 4055 | 3.46 | - |
| Alloy 5540 | 3.42 | - |
| Alloy 7025 | 3.37 | - |
| Alloy 8510 | 3.33 | - |
| 700 °C | | |
| Alloy 2570 | 3.52 | - |
| Alloy 4055 | 3.34 | 3.51 |
| Alloy 5540 | 3.34 | 3.51 |
| Alloy 7025 | 3.34 | 3.50 |
| Alloy 8510 | 3.33 | - |
Table 3.
Quantitative STEM EDX measurements of the phases present in Alloys 2570, 4055 and 5540 following exposure at 700 °C for 1000 h.
| Alloy | Ti (at.%) | Nb (at.%) | Zr (at.%) |
|---|
| Alloy 2570 | | | |
| Phase A | 4.7 ± 0.1 | 23.4 ± 0.1 | 71.8 ± 0.1 |
| Alloy 4055 | | | |
| Phase A | 4.3 ± 0.1 | 28.6 ± 1.8 | 67.1 ± 1.8 |
| Phase B | 4.8 ± 0.2 | 82.7 ± 0.2 | 12.5 ± 0.3 |
| Alloy 5540 | | | |
| Phase A | 4.1 ± 0.1 | 26.9 ± 0.2 | 69.0 ± 0.3 |
| Phase B | 4.5 ± 0.5 | 83.0 ± 0.5 | 12.5 ± 1.0 |
| Phase C | 1.3 ± 0.1 | 1.1 ± 0.2 | 97.6 ± 0.2 |
| Publisher’s Note: MDPI stays neutral with regard to jurisdictional claims in published maps and institutional affiliations. |
© 2021 by the authors. Licensee MDPI, Basel, Switzerland. This article is an open access article distributed under the terms and conditions of the Creative Commons Attribution (CC BY) license (https://creativecommons.org/licenses/by/4.0/).


 ,
, 


