Article

Hot Deformation Behaviors of as Cast 321 Austenitic Stainless Steel

1
State Key Laboratory of Metastable Materials Science and Technology, Yanshan University, Qinhuangdao 066004, China
2
School of Mechanical Engineering, Yanshan University, Qinhuangdao 066004, China
*
Author to whom correspondence should be addressed.
Metals 2021, 11(8), 1245; https://doi.org/10.3390/met11081245
Submission received: 2 July 2021 / Revised: 1 August 2021 / Accepted: 3 August 2021 / Published: 5 August 2021

Abstract

:
AISI 321 stainless steel has excellent resistance to intergranular corrosion and is generally used in nuclear power reactor vessels and other components. The as-cast and wrought structures are quite different in hot workability, so physical simulation, electron back-scatter diffraction, and hot processing maps were used to study the mechanical behavior and microstructure evolution of as-cast nuclear grade 321 stainless steel in the temperature range of 900–1200 °C and strain rate range of 0.01–10 s−1. The results showed that the flow curve presented work-hardening characteristics. The activation energy was calculated as 478 kJ/mol. The fraction of dynamic recrystallization (DRX) increased with increasing deformation temperature and decreasing strain rate. DRX grain size decreased with increasing Z value. Combining the hot working map and DRX state map, the suggested hot working window was 1000–1200 °C and 0.01–0.1 s−1. The main form of instability was necklace DRX. The nucleation mechanism of DRX was the migration of subgrains. The δ phase reduced the activation energy and promoted DRX nucleation of the tested steel.

1. Introduction

AISI 321 stainless steel contains 0.44% Ti to stabilize C, which reduces intergranular precipitates such as M23C6. This steel therefore has excellent intergranular corrosion resistance [1,2]. In addition, it has outstanding oxidation resistance and high-temperature mechanical properties [3,4]. As a candidate structural material for the low-pressure system of the fourth-generation sodium-cooled fast neutron reactor, it is mainly used for components such as reactor vessels, primary loop sodium–sodium reaction heat exchangers, and primary and secondary loop main pipelines [3]. There are many reports concerning the hot stability and mechanical properties [4,5], resistance to intergranular corrosion [2], surface processing properties [6], and welding properties of 321 stainless steel [1].
AISI 321 stainless steel contains about 18% Cr and 10% Ni. For this kind of steel, surface cracking usually occurs during hot forging [7]. Coarse and mixed grains cause difficulty in structure control [8,9]. Mehdi et al. [10] studied flow behavior of wrought 321 stainless steel and obtained an activation energy of 433 kJ/mol. Richard et al. [11] compared the flow behaviors of 321 and 304 stainless steels, finding that the steady-state stress of 321 was lower than that of 304 for the same Z value. A constitutive model of the rolling load of 321 austenitic stainless steel was subsequently established [12]. Ghazani et al. found that the dynamic recovery (DRV) kinetics are more sensitive to deformation rate than deformation temperature [13]. In addition, electron back-scatter diffraction (EBSD) results of microstructure evolution showed that the main softening process in the temperature range of 800–950 °C is DRV, and dynamic recrystallization DRX is the main softening mechanism at 1000–1200 °C [14]. Anoop et al. [15] established the hot deformation constitutive equation of wrought 321 stainless steel and a processing map was drawn.
Reports on the hot workability of 321 stainless steel mainly focus on the wrought structure. The cast structure of 321 stainless steel often has a larger size of δ phase [16], as well as TiN, TiC, and other precipitates, which differ from the wrought structure in terms of size, morphology, and distribution. Owing to the large differences between the cast and wrought structures of steels, there are obvious differences in hot workability [16,17].
The present work aimed to examine the mechanical behavior and microstructural changes during hot deformation, to clarify the deformation mechanism and, combined with the hot processing map, to provide a theoretical basis for structure control and the forging process of nuclear grade as-cast 321 stainless steel.

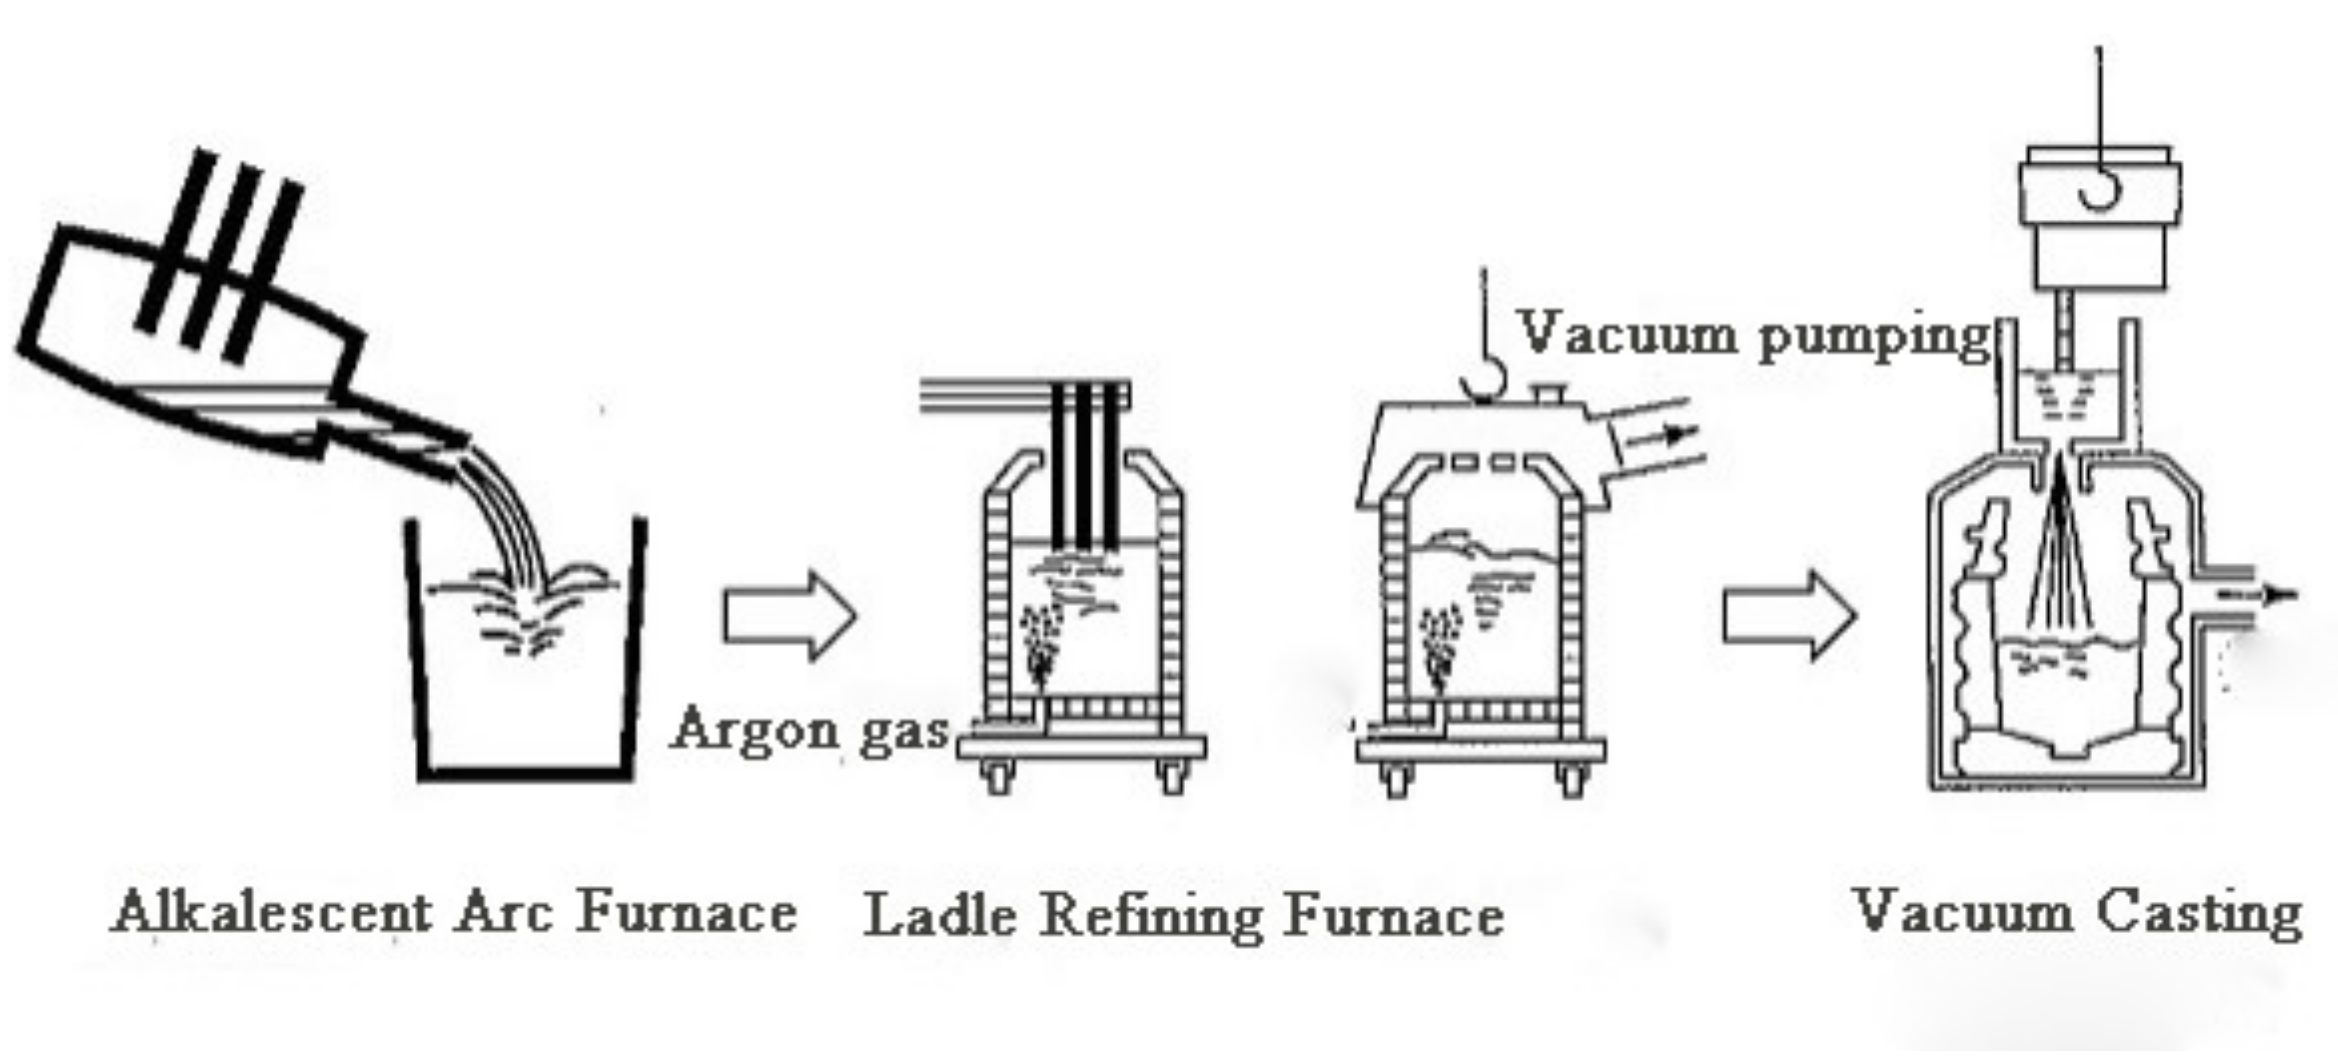
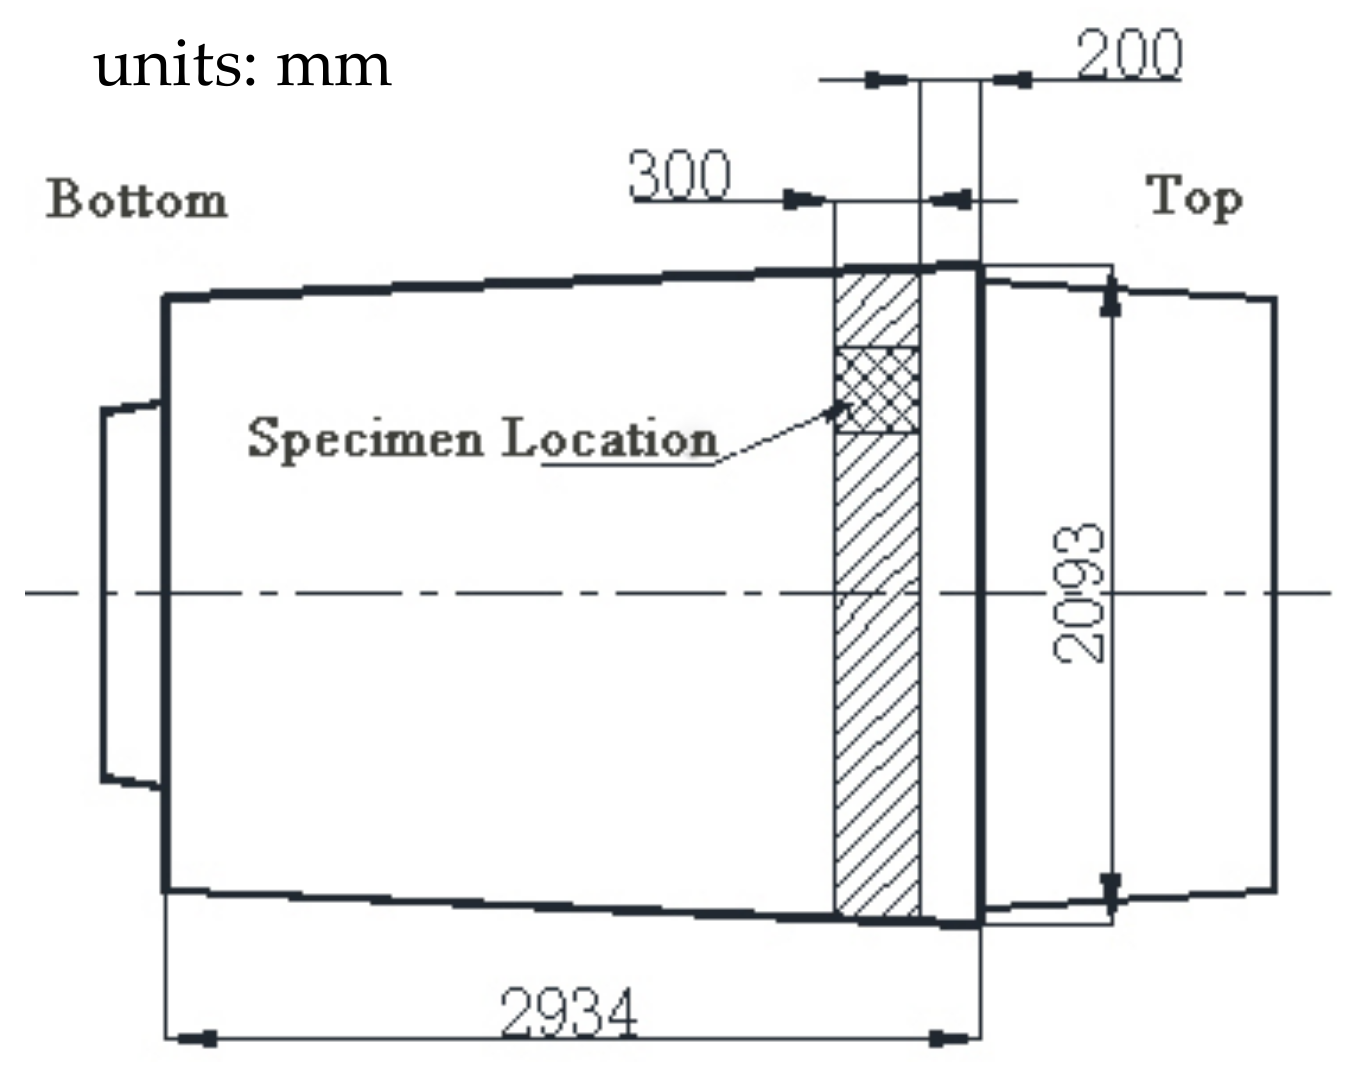
2. Materials and Methods

AISI 321 austenitic stainless steel was melted using a vacuum electroslag smelting and vacuum casting process, the gating system of the tested steel is shown in Figure 1, and the degree of vacuum was less than 67 Pa. The diameter of the specimen was 1.98 m and the mass was 93 t. The chemical composition was as follows (mass%): 0.05 C, 17.98 Cr, 10.15 Ni, 2.0 Mn, 0.73 Si, 0.44 Ti, 0.34 Mo, and 0.05 Cu. Compression test specimens (Φ 10 mm × 15 mm) were machined along the lateral direction of the columnar crystal, and the position of the compressed tested samples is shown in Figure 2.
Hot compression tests were conducted on a Gleeble 3500 (Dynamic Systems Inc., New York, NY, USA) thermal/mechanical simulator. The samples were preheated to 1200 °C for 60 s, cooled at 10 °C/s to the deformation temperature (900 °C, 1000 °C, 1100 °C, and 1200 °C), then compressed to a strain of 0.8 at strain rates of 0.01, 0.1, 1, and 10 s−1 and quenched immediately. The samples were ground and polished with 2000 Cw sandpaper and then diamond paste with a size no larger than 2.5 μm. The polished surface was etched with 50% aqua regia solution for 15 s and the microstructures observed by optical microscope. The ground specimens were electro-polished with a solution of 1:19 HClO4–CH3CH2OH at 0.4 mA for 1 min prior to EBSD (EDAX Inc., Mahwah, USA) analysis using TSL OIM analysis software (Version 8, EDAX Inc., Mahwah, NJ, USA).
A phase map of the original sample is shown in Figure 3, in which austenite is colored in red and δ is colored in green. The fraction of δ was 0.5%.

3. Results

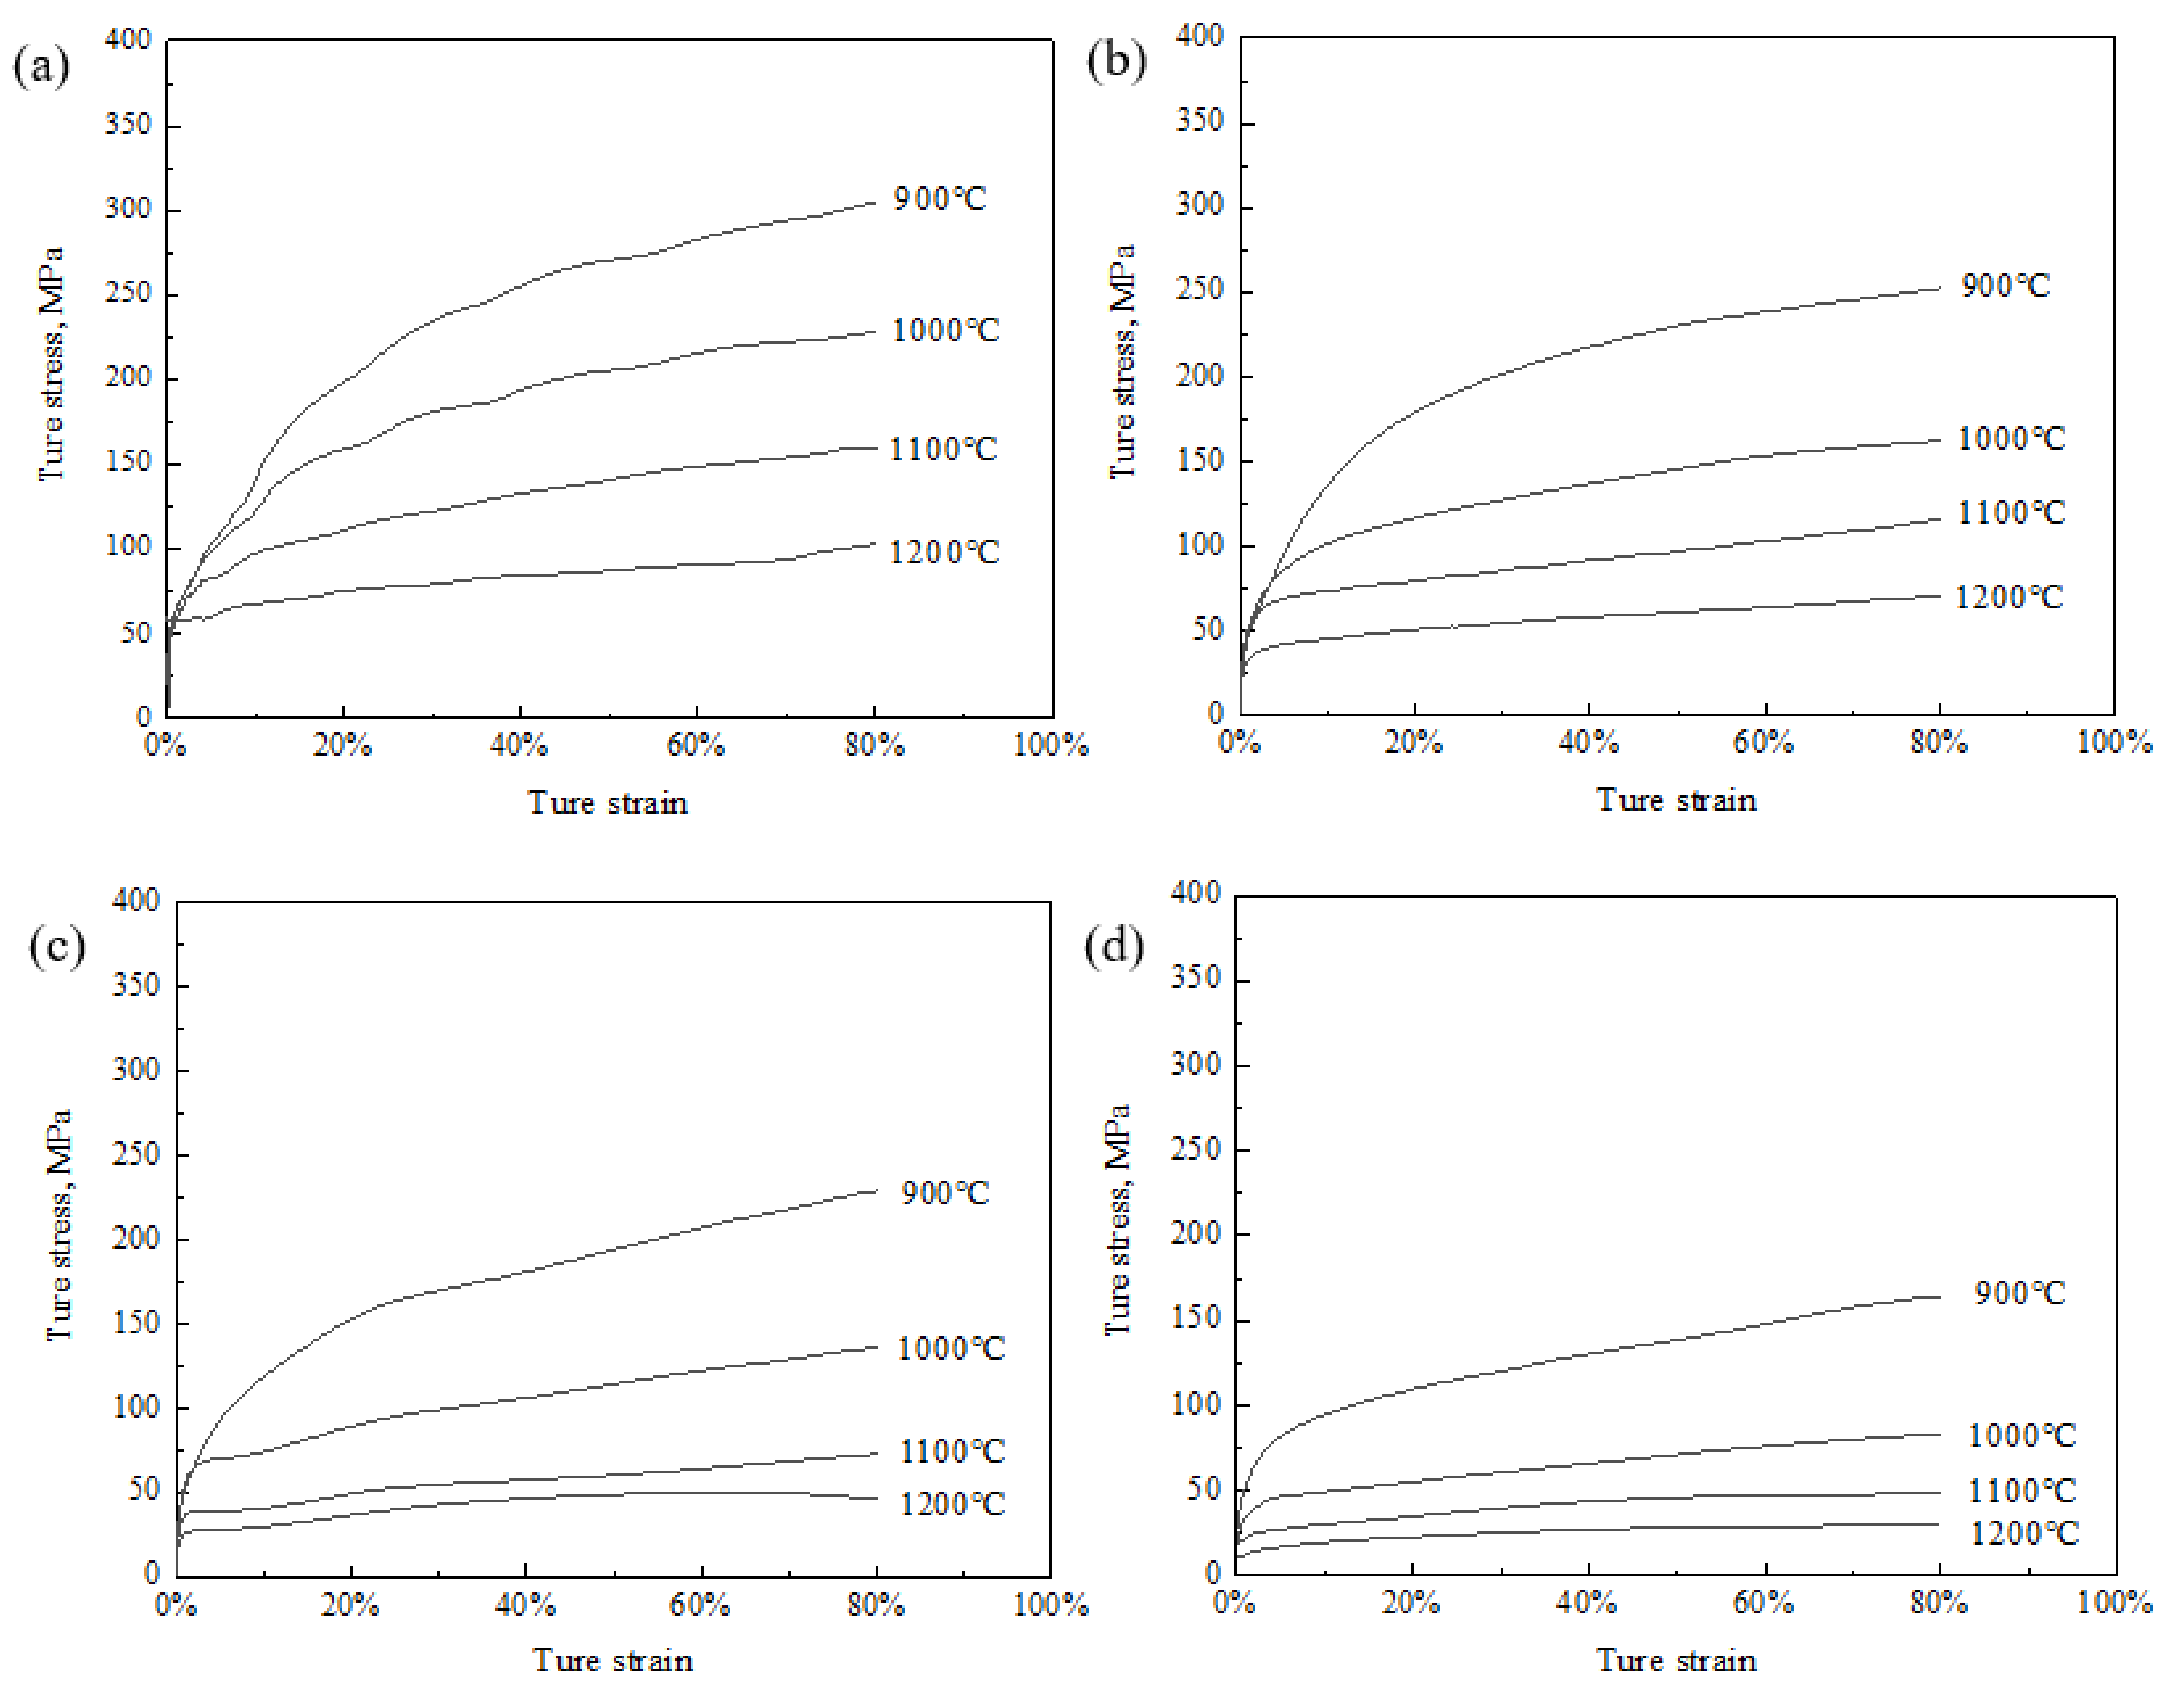
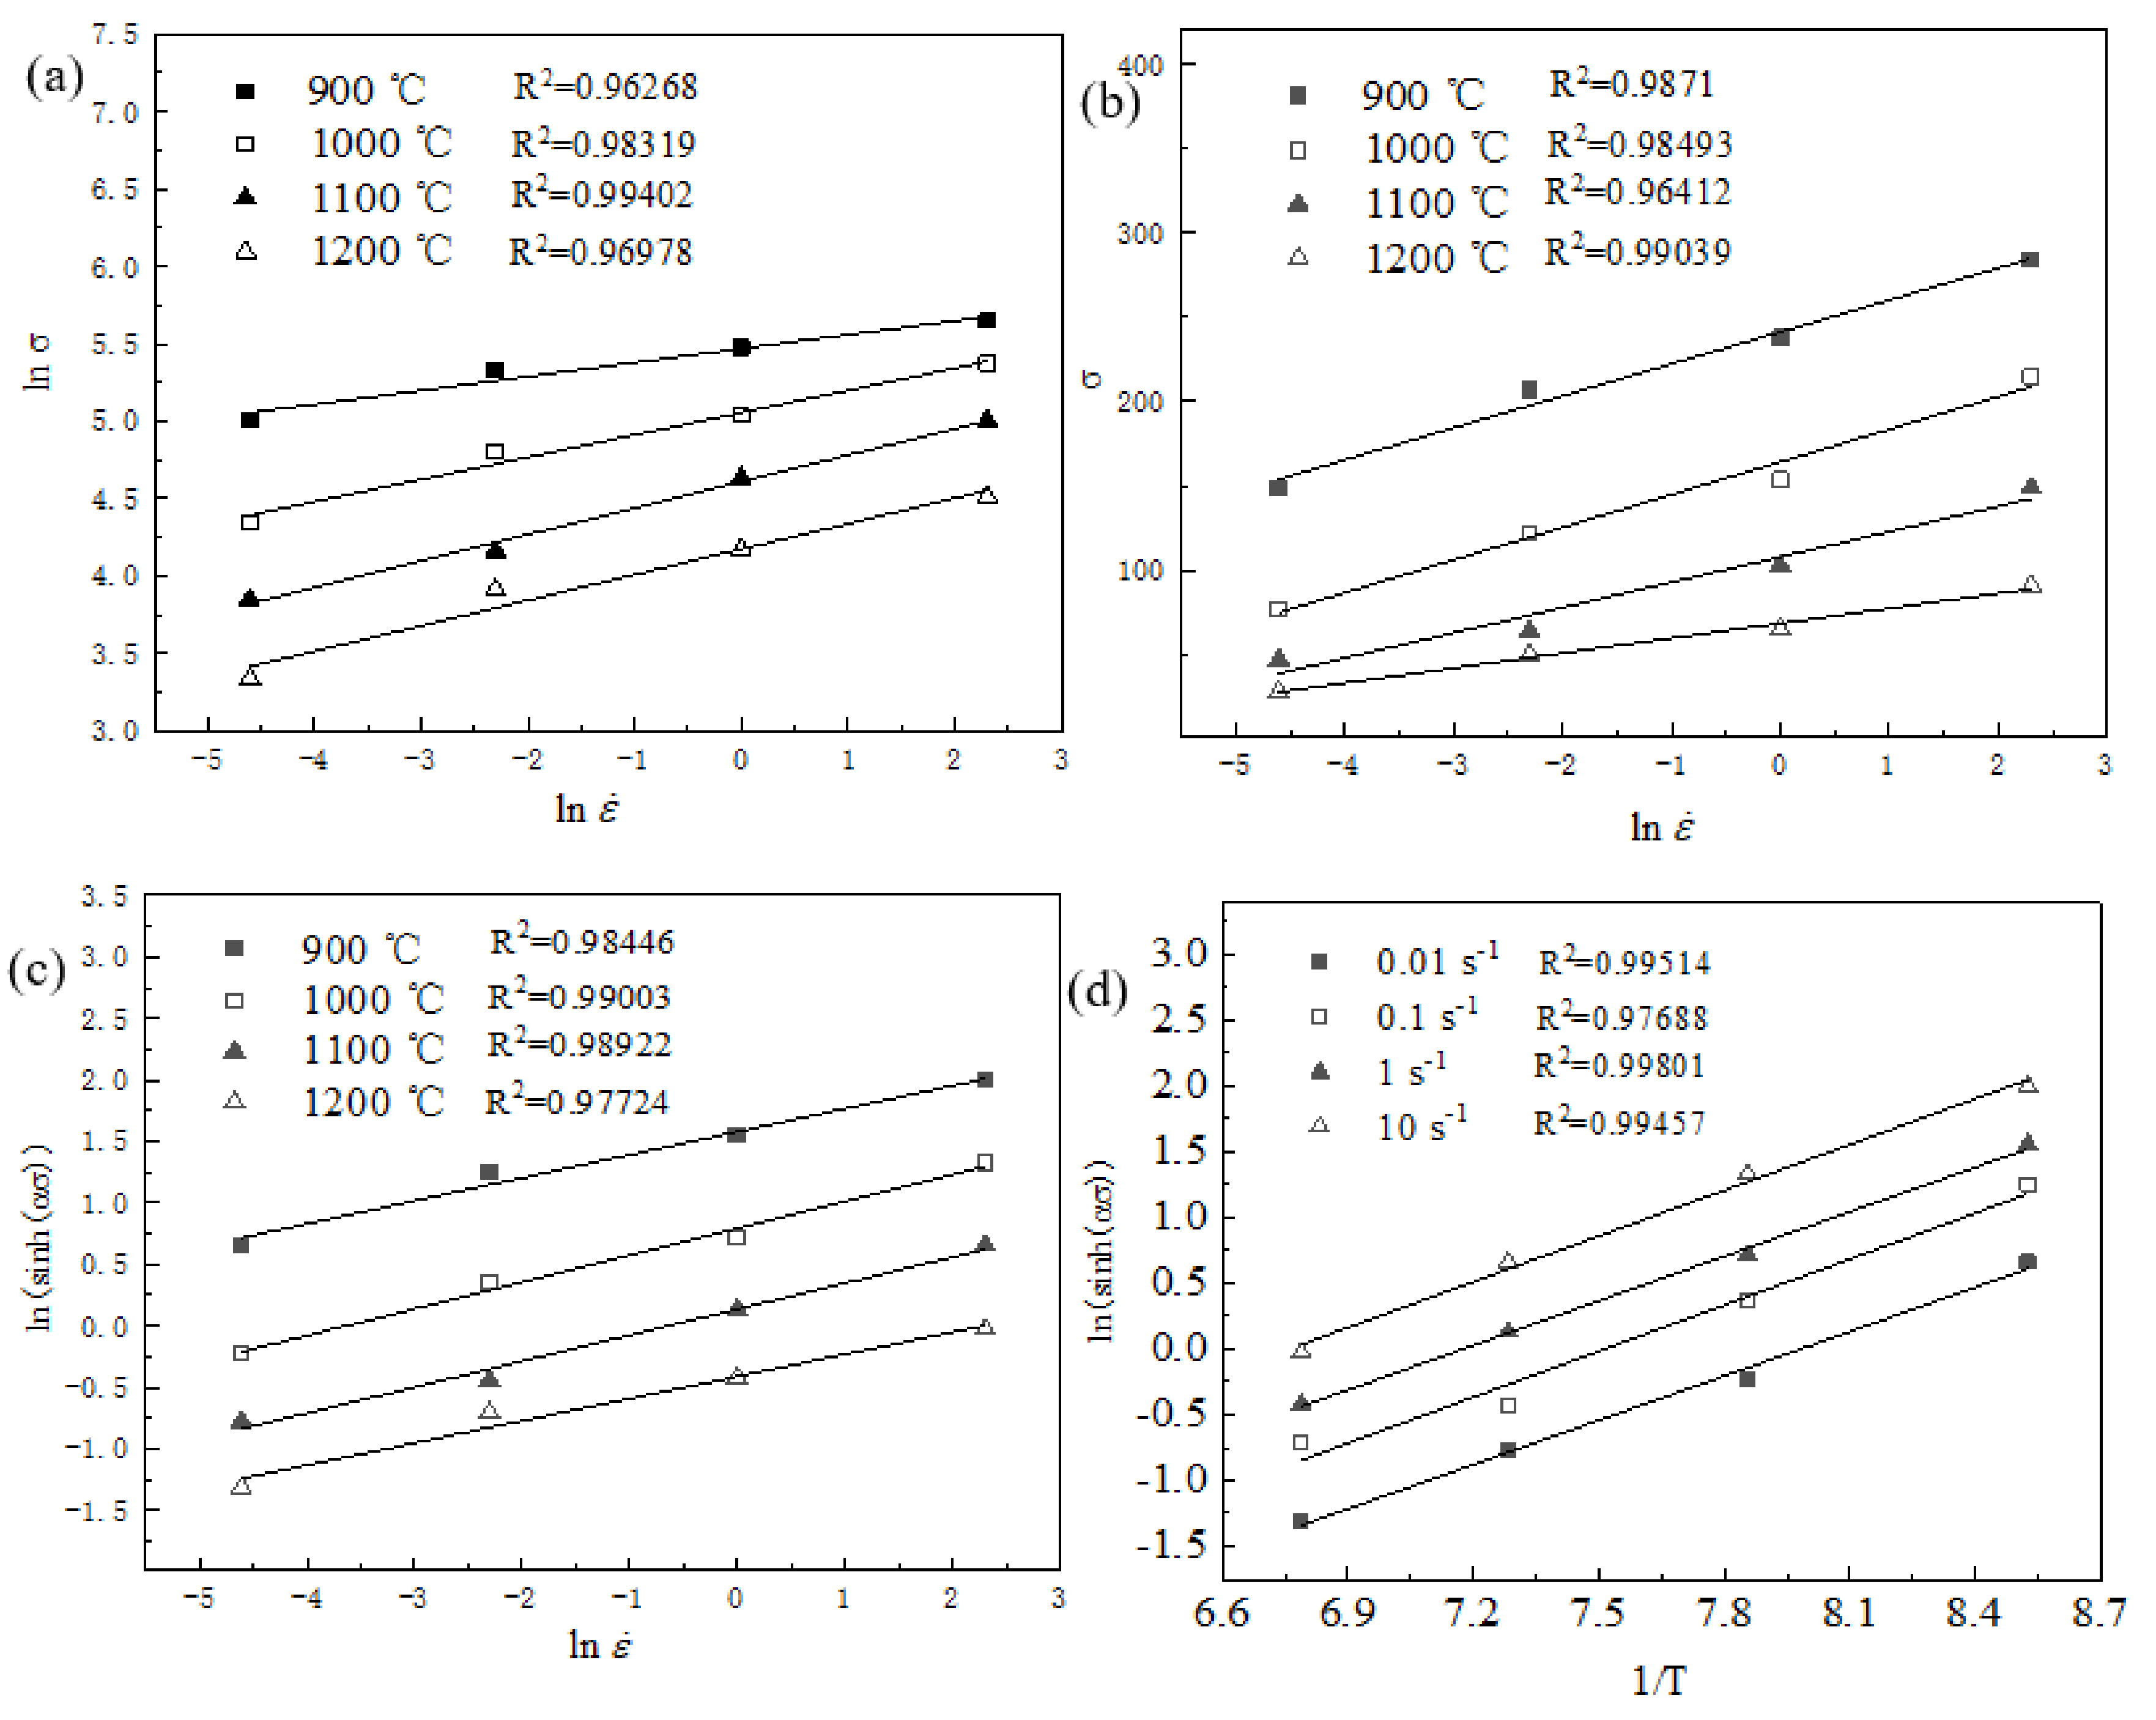
3.1. Flow Behavior and Hot Deformation Equation

The flow curves of the tested steel compressed under different conditions are shown in Figure 4. The flow stress increased with the decrease of temperature and increase of strain rate. In the initial stage of plastic deformation, the stress increased rapidly with the increase of strain and work hardening was dominant. With the increase of strain, the stress slowly increased and the work-hardening rate gradually decreased, but the dynamic softening effect was not sufficient to offset the hardening effect of hot working. Under the same strain rate, it was found that the higher the temperature, the lower was the work hardening rate and the greater the degree of softening.
It is interesting to note that there was no obvious peak stress during the hot compression process. Poliak et al. [18] indicated that although DRX had occurred, there was no obvious peak stress on the flow curves. However, flow curves often show obvious softening for single-phase austenitic stainless steel [10,14,15]. This may be related to the existence of the δ phase because flow curves do not only reflect the work-hardening and dynamic softening behavior of single-phase austenite. In addition, different deformation mechanisms may affect the flow curves, such as cracking and flow instabilities [10]. Therefore, it is not accurate to predict the deformation mechanism by solely relying on the flow curves.
Deformation temperature and strain rate have significant influence on the hot deformation process. The relationship between flow stress, strain rate, and deformation temperature of a metal during hot deformation can be described by the classic hyperbolic sine formula [19]. Since there was no obvious peak stress in the flow curves, the stress values at a strain of 80% were selected in this study. According to literature [20], the relationships between ln σ ln ε ˙ and σ ln ε ˙ can be obtained by simplifying the hyperbolic sine function, as shown in Figure 5a,b, respectively. These results show that ln σ ln ε ˙ and σ ln ε ˙ are approximately linear. Parameter α was determined as 0.00948 by linear regression.
Taking the natural logarithm of both sides of the hyperbolic sine function according to the flow curve data of Figure 4, the relationship curves of ln sinh ( α σ ) vs . ln ε   ˙ and ln sinh ( α σ ) vs .1 / T were obtained as shown in Figure 5c,d, respectively. The value of each parameter was obtained by linear regression: A is 5.81 × 10¹⁹, n is 5.05, and Q is 478 kJ/mol.
Therefore, the hot deformation equation of the tested steel under the deformation conditions of 900–1200 °C and 0.01–10 s−1 is:
ε ˙ = 5.81   ×   10 19 sin h 0.00948 σ 5.05 exp 478,000 / RT

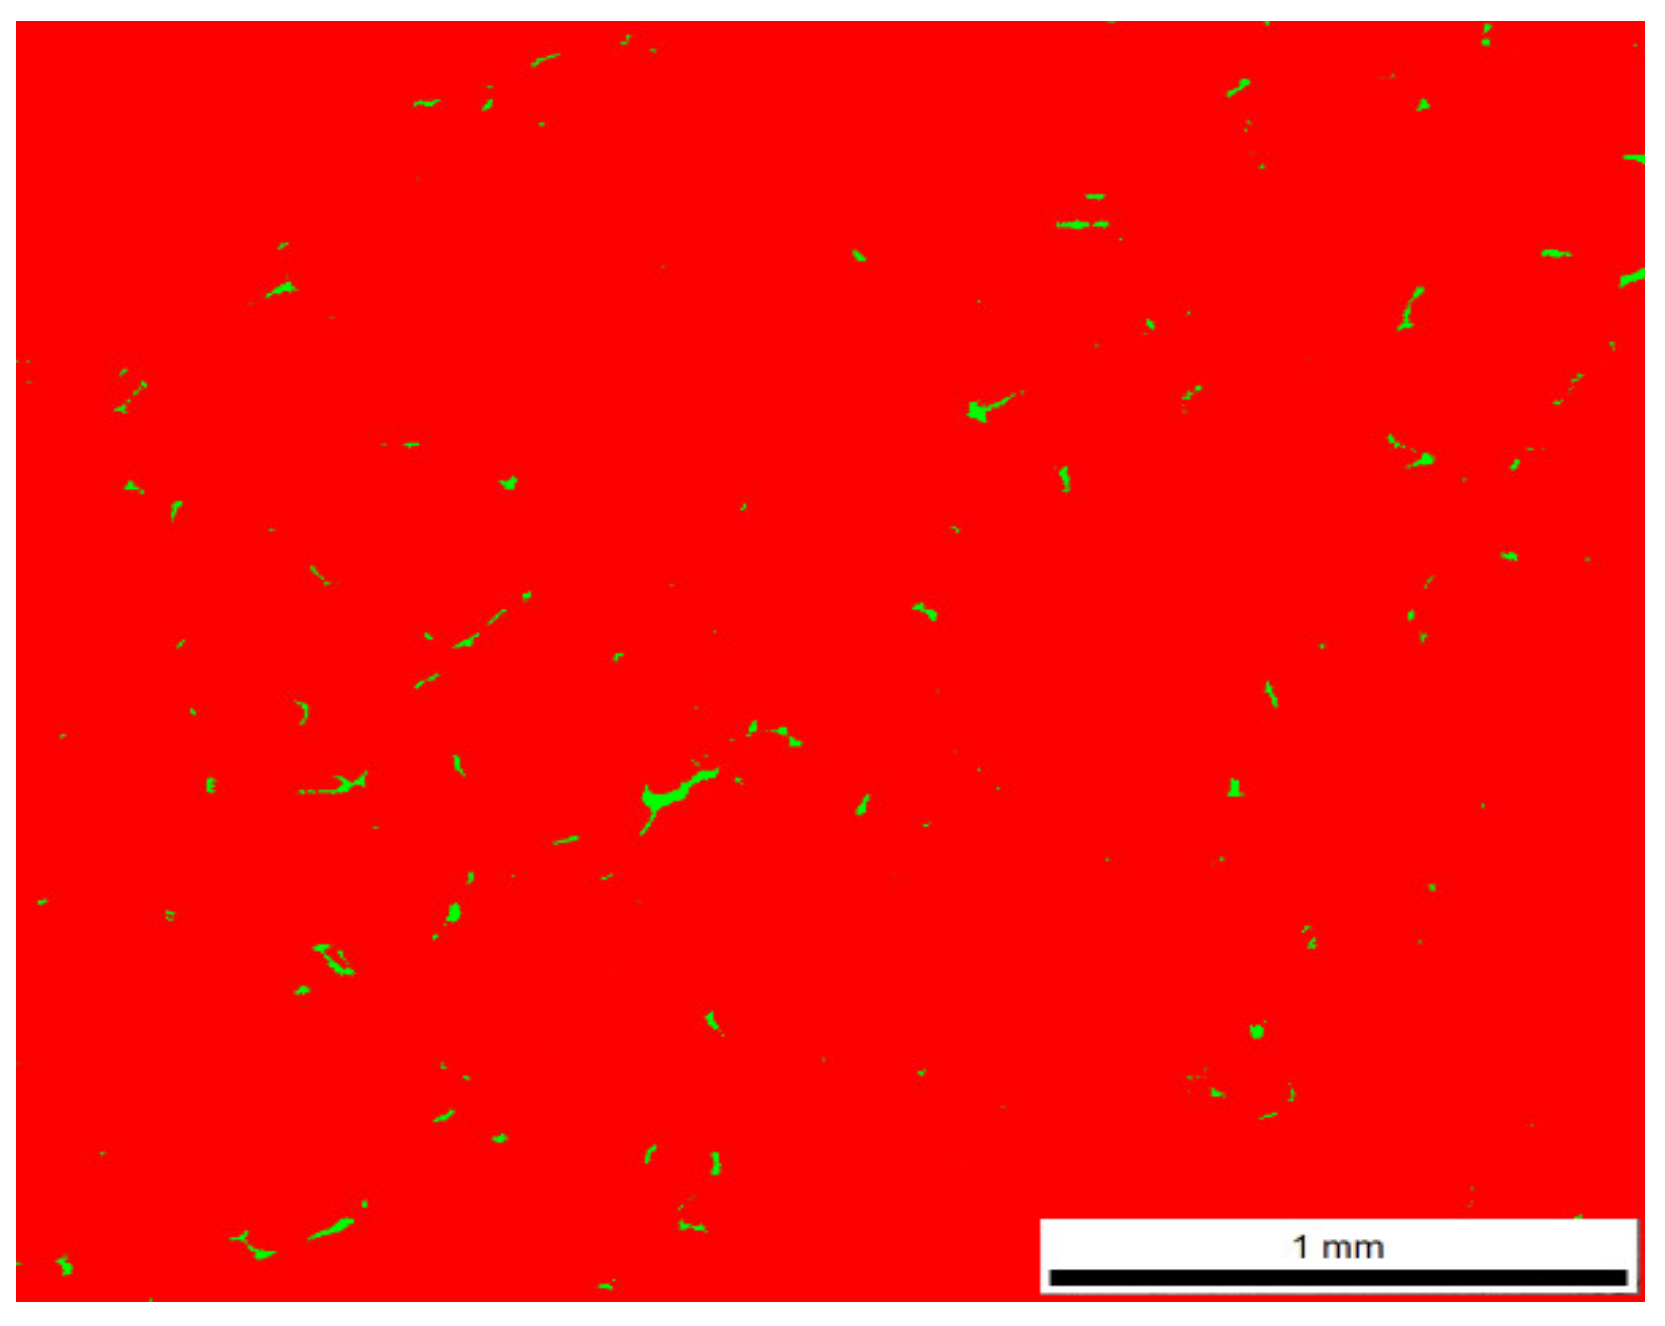
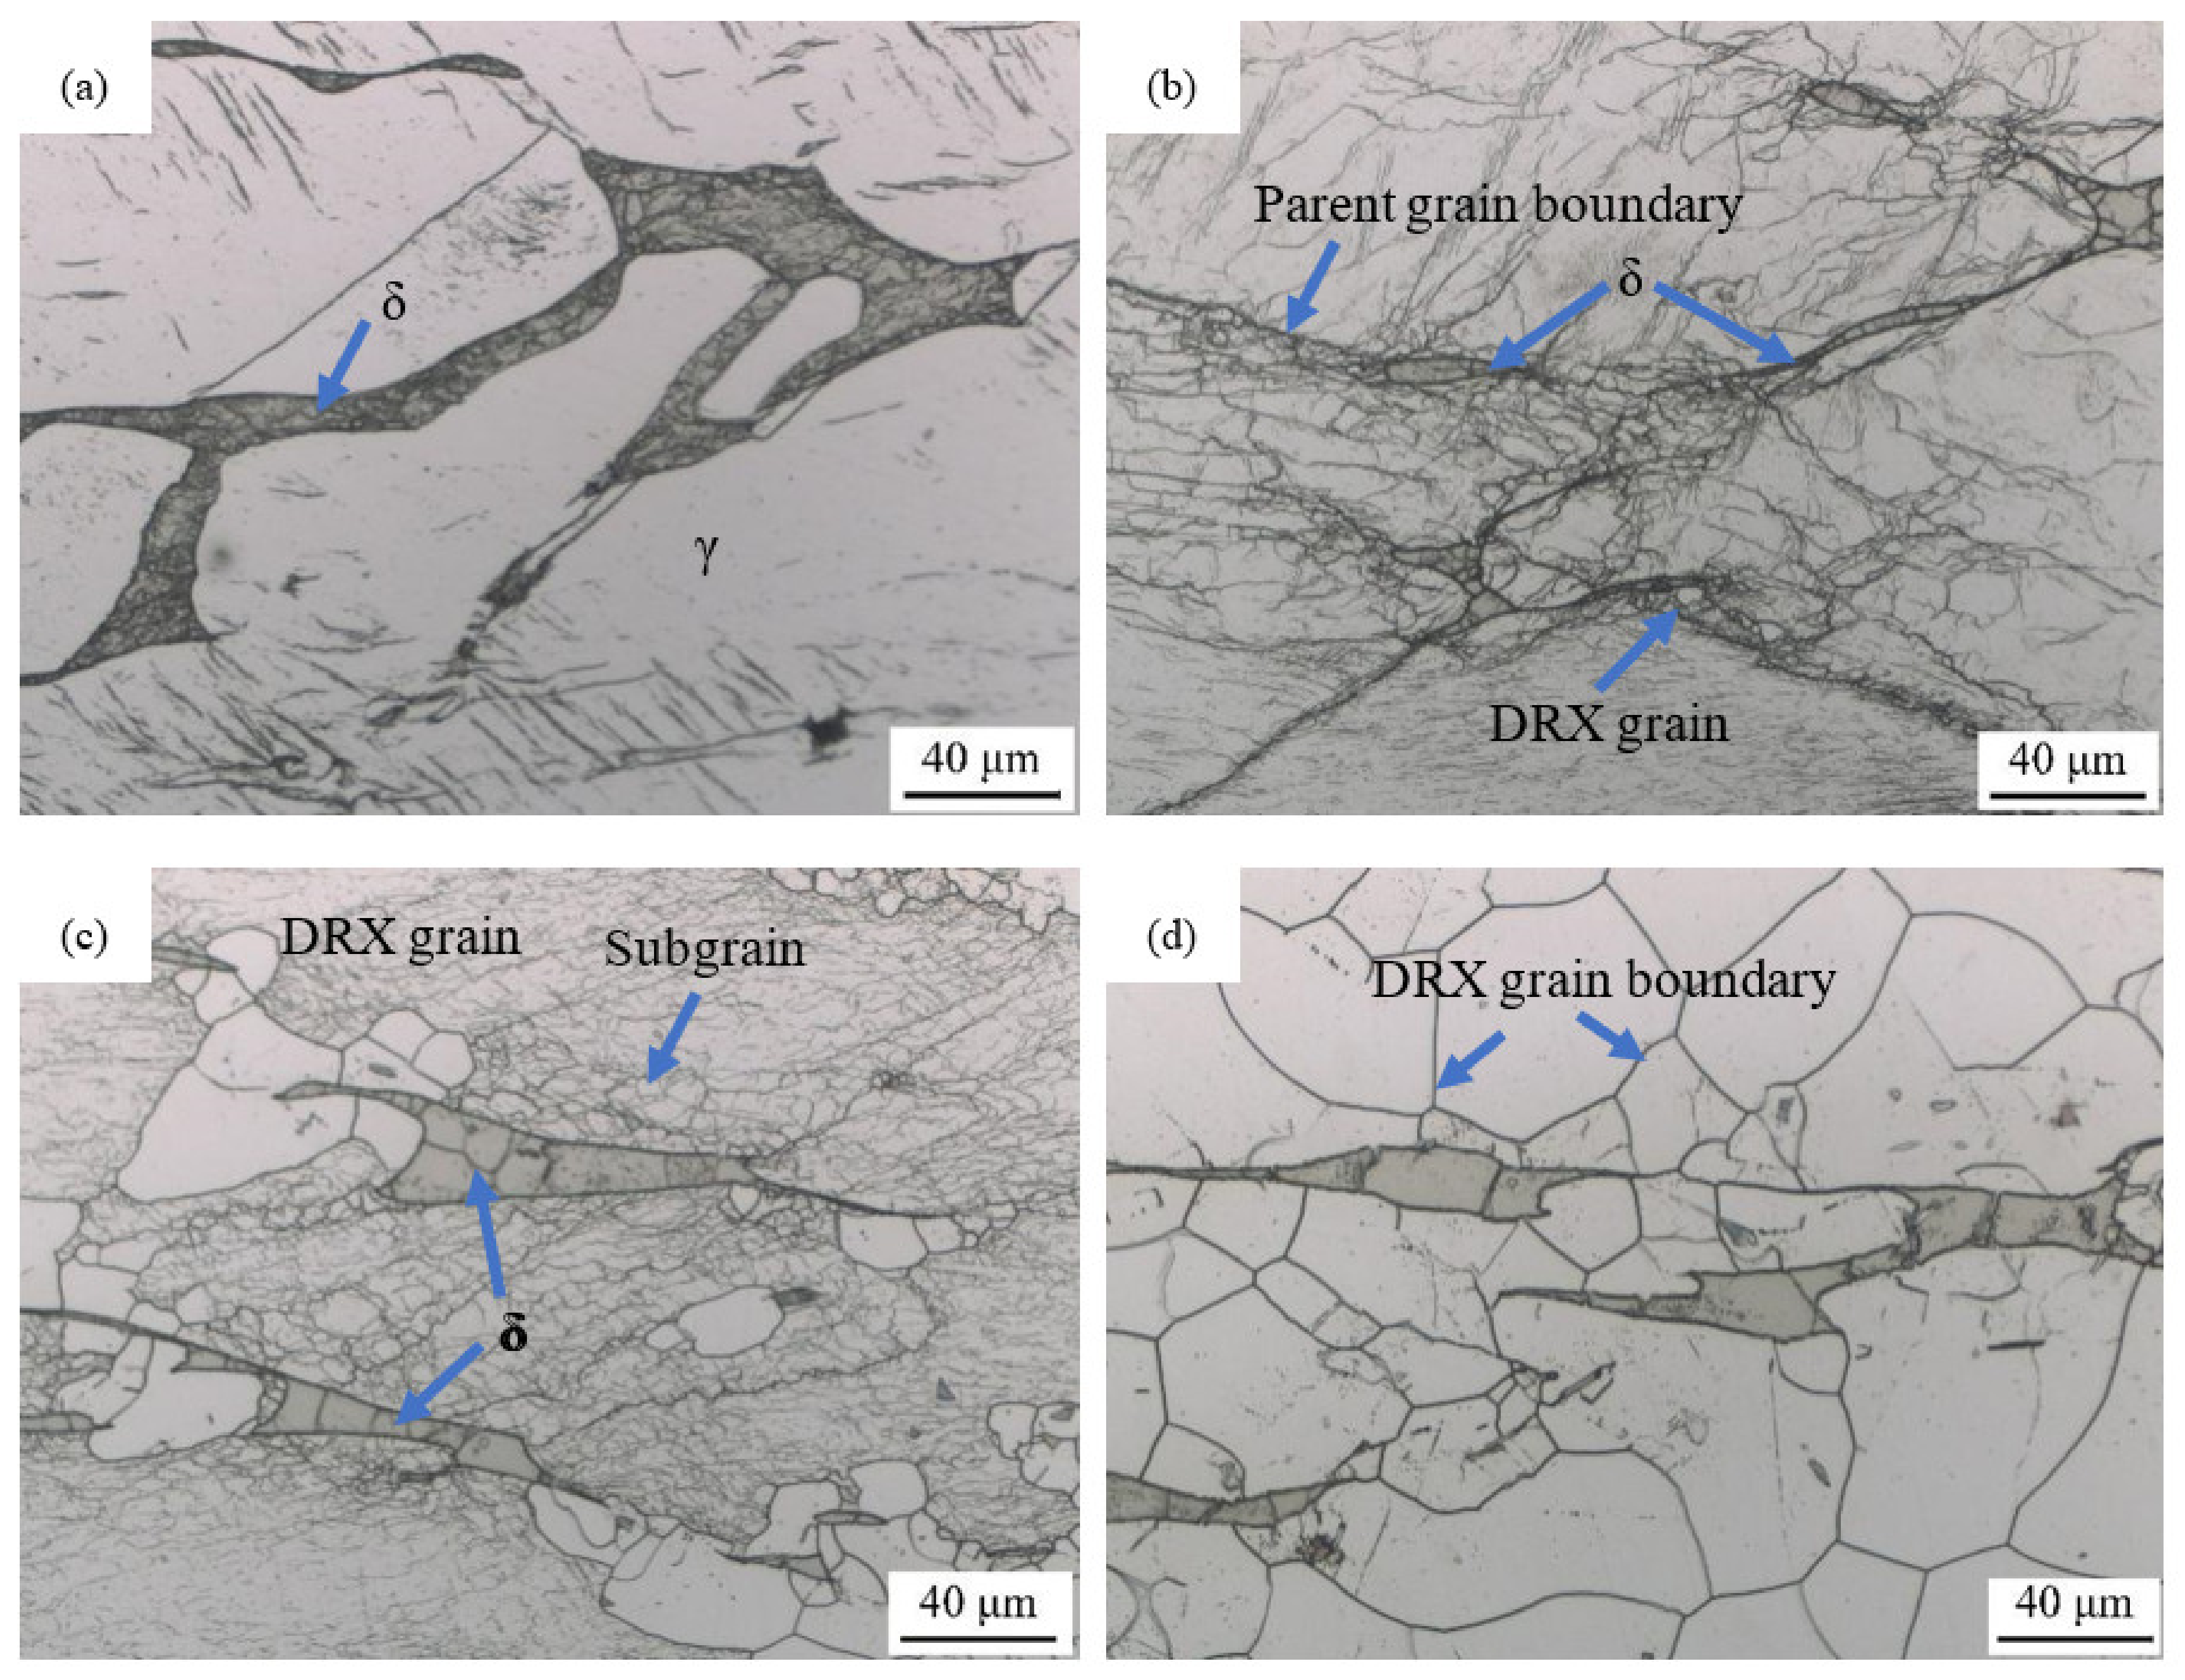
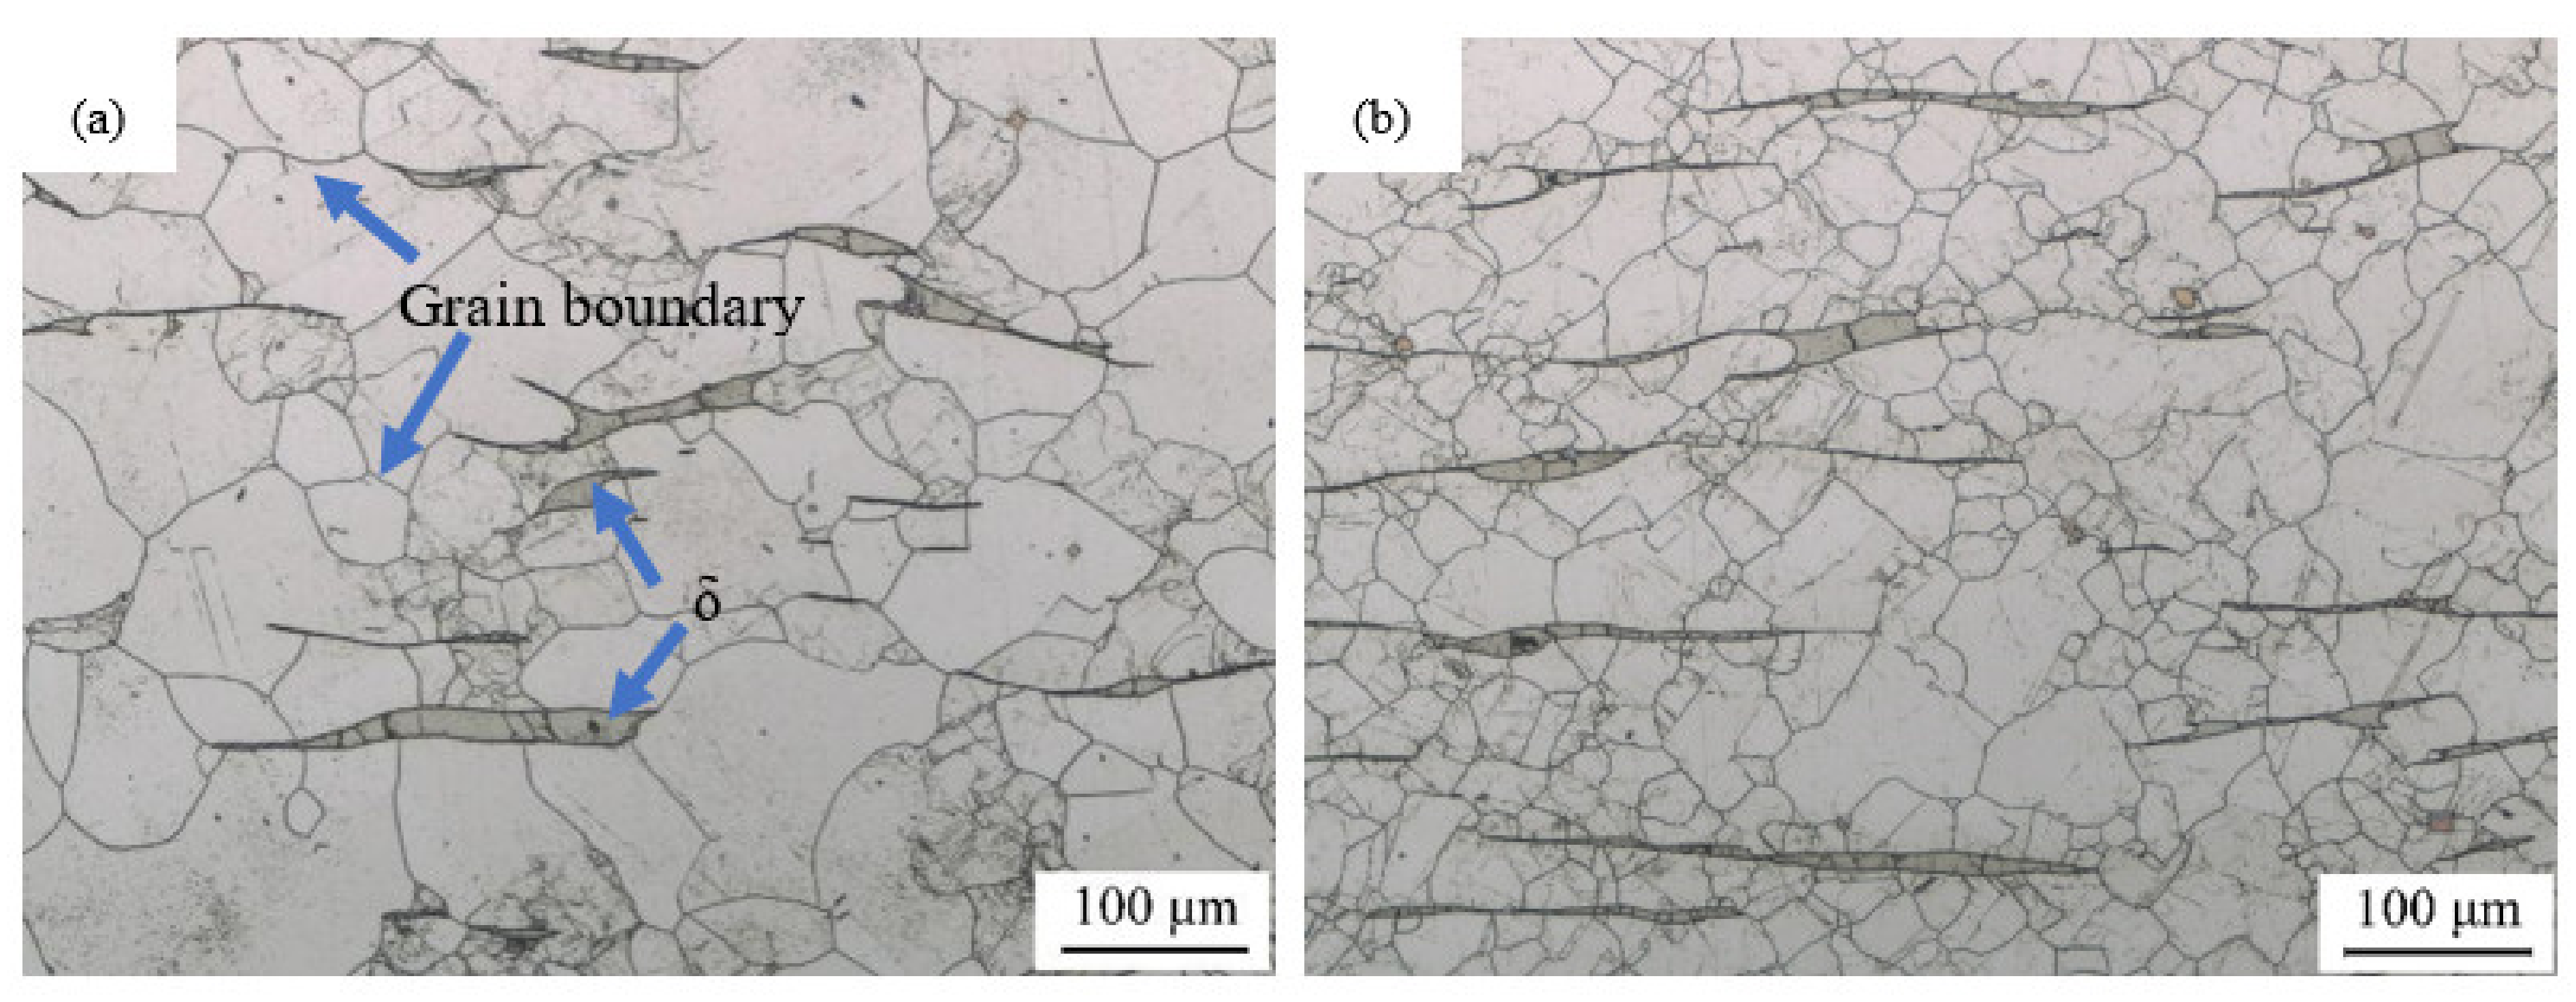
3.2. Microstructure Observation

Figure 6 shows the microstructure after deformation at a strain rate of 1 s−1 at different temperatures. The gray islands are δ ferrite. When DRX occurs, fine and equiaxed grains replace the coarse deformed grains [21]. Based on the size and morphology of grains, the occurrence of DRX can be identified. Figure 6a (900 °C) shows deformed parent grains and large-size deformed δ. Figure 6b (1000 °C) shows some fine DRX grains produced at the grain boundary, presenting as typical necklace DRX [22]. In Figure 6c (1100 °C), many sub-crystal grains are found in the parent grain, the density of which is higher at the phase and grain boundaries. DRX grains nucleated at the phase boundary grew to a size of about 35 μm. In Figure 4d (1200 °C), the deformed parent crystal had completely disappeared: complete DRX had occurred and the grain size was about 52 μm. Therefore, under the same strain rate, the higher the temperature, the higher was the fraction of DRX and the larger was the DRX grain size.
The deformed microstructure of the tested steel at 1200 °C and different strain rates is shown in Figure 7. The grain size in Figure 7a is 73 μm, while that in Figure 7b is 29 μm. The DRX grain size gradually decreased with the increase of the strain rate.
At the same temperature, the higher the strain rate, the faster is the accumulation of dislocations, which provide more nucleation sites for DRX, especially when the hardness of δ and γ differ at high temperature and the deformation is inconsistent [23], which promotes the accumulation of dislocations. DRX grains then have enough time to grow at low strain rate. Therefore, the higher the strain rate, the smaller is the DRX grain size. In addition, Wang et al. [24] found that a too low a strain rate is conducive to dislocation climbing and the formation of dislocation walls and entanglements. In this case, DRX is inhibited.
According to literature [25], the fraction of DRX grains in the tested steel under different conditions was measured by the binary method and the statistical results are shown in Figure 8. The microstructure of specimens deformed at 900–1200 °C and 0.01–10 s−1 (total 16 deformation conditions) were observed. In the microstructure maps, the DRX grains were covered by black and the deformed parent grains were white. The fraction of DRX was measured through quantitative metallography. The statics results are shown in Figure 8. The contour line represents the fraction of DRX, light gray corresponds to the area of complete DRX, and dark gray corresponds to the area without DRX. The DRX fraction increased with the increase of deformation temperature and decrease of strain rate.
The DRX grain size under different conditions was measured by the section method. It is related to the parameters Z and A [26], where A and Equation (1) are the same parameter. The Zener–Hollomon parameter is widely used to characterize the combined effect of temperature and strain rate on deformation. The Z parameters of the tested steel are as follows:
Z = ε ˙   exp ( 478,000 / RT )
Therefore, the relationship between ln(D) and ln(Z/A) can be obtained, as shown in Figure 9.
Corresponding to the points in Figure 9 after linear fitting, the R2 is 0.75859, and the relationship between the recrystallized grain size D and the parameters Z and A is:
D = 1.301   ×   ( Z / A ) 0.355 ( μ m )

3.3. Hot Processing Maps

According to the hot working map theory based on the dynamic material model proposed by Prasad et al. [25], the power dissipation ratio and plastic flow instability criteria are expressed by Equations (4) and (5), respectively:
η = J J max = 2 m m + 1
ξ = ln m m + 1 ln ε ˙ + m < 0
where J is the power consumed due to changes in the microstructure, Jmax is the total power consumed by the entire system, and m is the strain rate sensitivity index.
The hot processing map was obtained from η and ξ, as shown in Figure 10. The shaded region corresponds to the flow instability and the contour numbers represent the percent efficiency of dissipation.
The characteristics of power dissipation at a strain of 0.8 are as follows: Power dissipation increased with the increase of temperature and decrease of strain rate. When the temperature exceeded 1100 °C, the sensitivity of power dissipation to the change of strain rate decreased: The maximum value was about 29%. The flow instability mainly corresponded to low power dissipation. Combined with the DRX state map (Figure 8), it was found that the zones of flow instability and incomplete DRX have a higher degree of overlap.
Ghazani et al. [27] indicated that the critical damage value increases with the increase of deformation temperature and decrease of strain rate, and the lower the critical damage value, the higher is the risk of plastic fracture. The processing windows with the lowest fracture risk for 321 stainless steel are 0.001 s−1, 1025–1075 °C, and 1150–1200 °C. The distribution flow instability zone in literature [15] is similar to that reported in this paper, but the safe processing temperature is lower at 900–1000 °C. The coarse-grained structure may be the reason because this is more dependent on high temperature than the fine-grained structure. Therefore, the safe processing window of the tested steel is 1000–1200 °C and 0.01–0.1 s−1.

3.4. Instability Mechanism

The microstructure of the flow instability zone at a strain of 0.8 is shown in Figure 11. The necklace structure was found under two conditions: fine DRX grains were distributed on the parent grain boundary and phase boundary, which is a typical characteristic of flow instability [22]. Jafari et al. [28] indicated that when materials with coarse-grained structure are deformed at a higher strain rate, shear deformation often occurs at the grain boundaries, which form a smaller range of shear bands. As a result, the deformation is uneven between the grain boundary and within the grain. As dislocations multiply at the grain boundary, the shape of the grain boundary fluctuates more and more, and the sawtooth and bow shapes become increasingly obvious as the strain reaches the peak critical strain, as shown by the red line in Figure 11c. Necklace DRX grains are finally formed along parent grain boundaries.

4. Discussion

Figure 12 and Figure 13 show the inverse pole figure (IPF) and kernel average misorientation (KAM) maps of the specimen deformed at 1000 °C, 0.01 s−1, and 1100 °C, 1 s−1, respectively. Figure 12c and Figure 13c show the IPF maps with grain boundaries. The high-angle grain boundaries (HAGB; misorientations ≥ 15°) are shown as black lines, twin boundaries are shown as red lines, and low-angle grain boundaries (LAGB; 2° ≤ misorientations < 15°) are shown as gray lines.
There are LAGBs at the boundary between regions with no DRX and δ, as shown in the black ellipses in Figure 12c and Figure 13c. This indicates that DRX arose from the migration of subgrains, due to the slip and climb of dislocations forming substructures at the phase boundary. The density of subgrain boundary dislocations is relatively high during the process, so they gradually migrate into HAGBs at higher temperatures. The DRX mechanism of as-cast nuclear grade 321 stainless steel is the migration of subgrains.
Comparing Figure 12c,d, the KAM value of the DRX regions was smaller than that of regions without DRX. The smaller the KAM value, the lower is the dislocation density. The occurrence of DRX contributes to the elimination of defects such as dislocations.
In Figure 12a and Figure 13a, fine and strain-free grains were found around the δ ferrite. In addition, it can be seen from Figure 12c and Figure 13c that there are some HAGBs between these fine grains. Therefore, it can be inferred that these are DRX grains. The orientation in each DRX grain is very uniform. In addition, the KAM values of DRX grains are relative lower than surrounding deformed matrix. Dislocations did not easily accumulate and plug at grain boundaries because of the scarcity of grain boundaries in the as-cast structure. However, there were a lot of phase boundaries in the tested steel, so when dislocations slipped to the phase boundary, they were plugged and caused the rise of KAM value, as shown in the red dotted region in Figure 12d. A cellular substructure was formed by multiplication of dislocations and subgrains, which finally transformed into DRX grains. δ promotes DRX of as-cast nuclear grade 321 austenitic stainless steel.
Previous studies have shown that the activation energy of as-cast structure steels is much higher than that of the wrought structure [29,30]. The activation energy of the tested steel was 478 kJ/mol, which is close to values reported for wrought steels of 465 kJ/mol [11] and 445 kJ /mol [27]. Therefore, promotion of δ in dynamic softening of coarse structures reduces the activation energy. In addition, alloying elements (besides carbon) can increase the activation energy [31]. Element segregation caused by δ may contribute to the activation energy of the coarse austenite structure. The δ phase reduces the activation energy and promotes the occurrence of DRX of nuclear grade 321 austenitic stainless steel.

5. Conclusions

(1)
The hot deformation equation of as-cast nuclear grade 321 austenitic stainless steel at 900–1200 °C and 0.01–10 s−1 is:
ε ˙ = 5.81   ×   10 19 sinh 0.00948 σ 5.05 exp 478,000 / RT
(2)
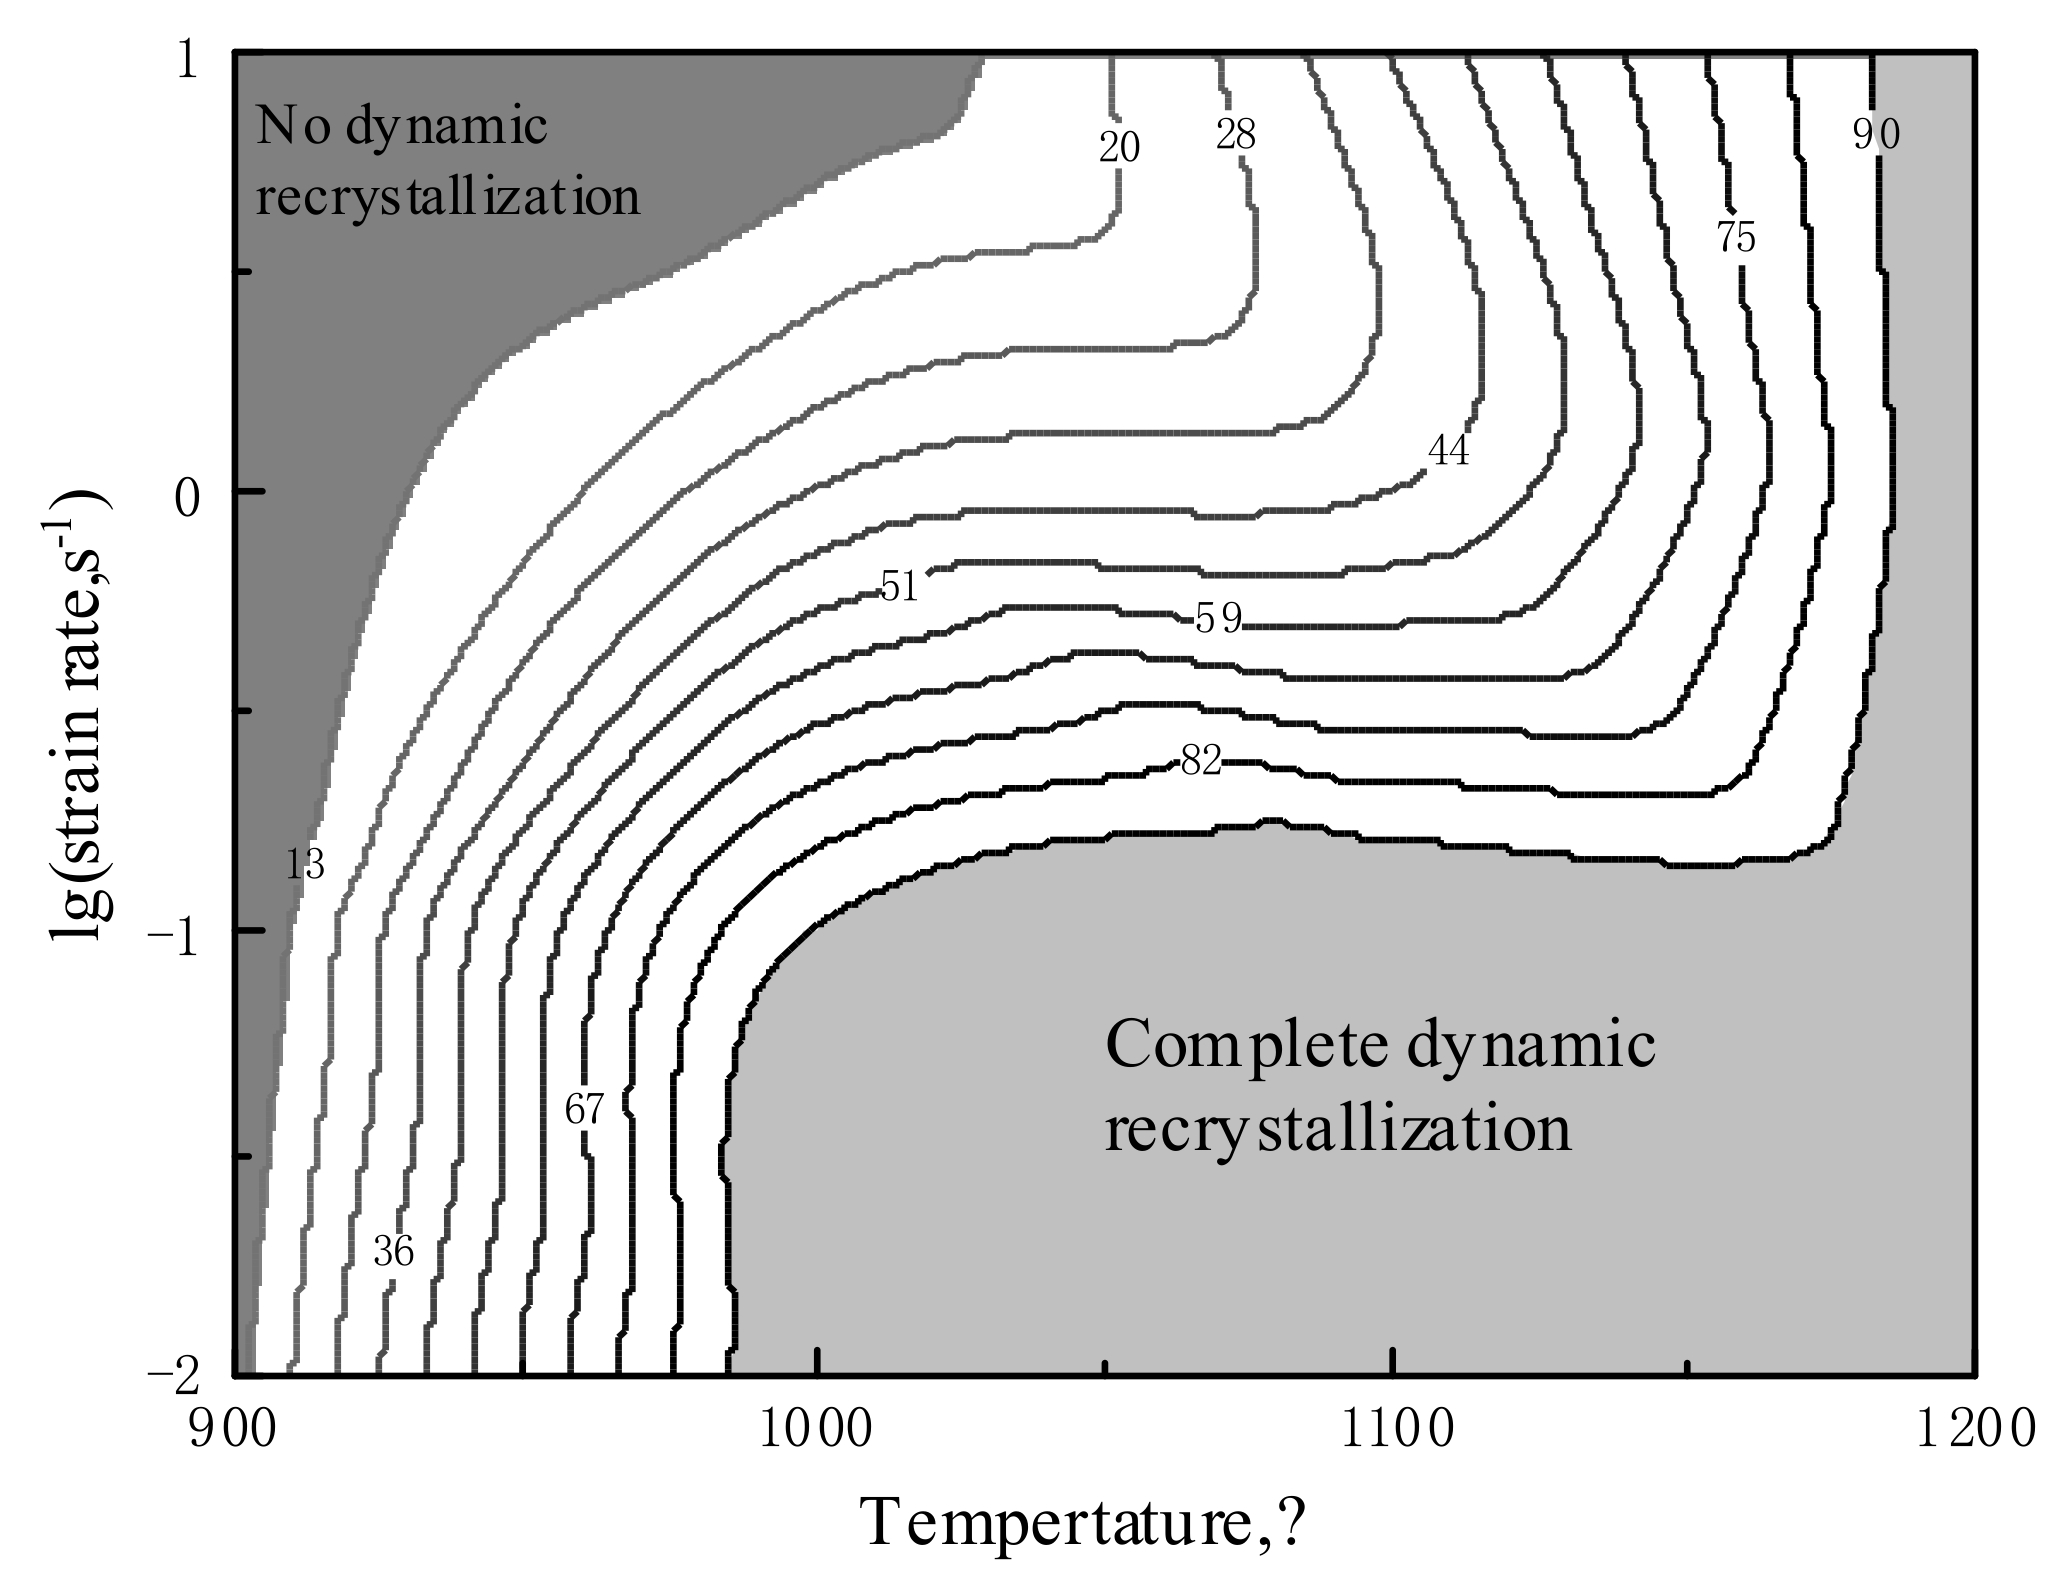
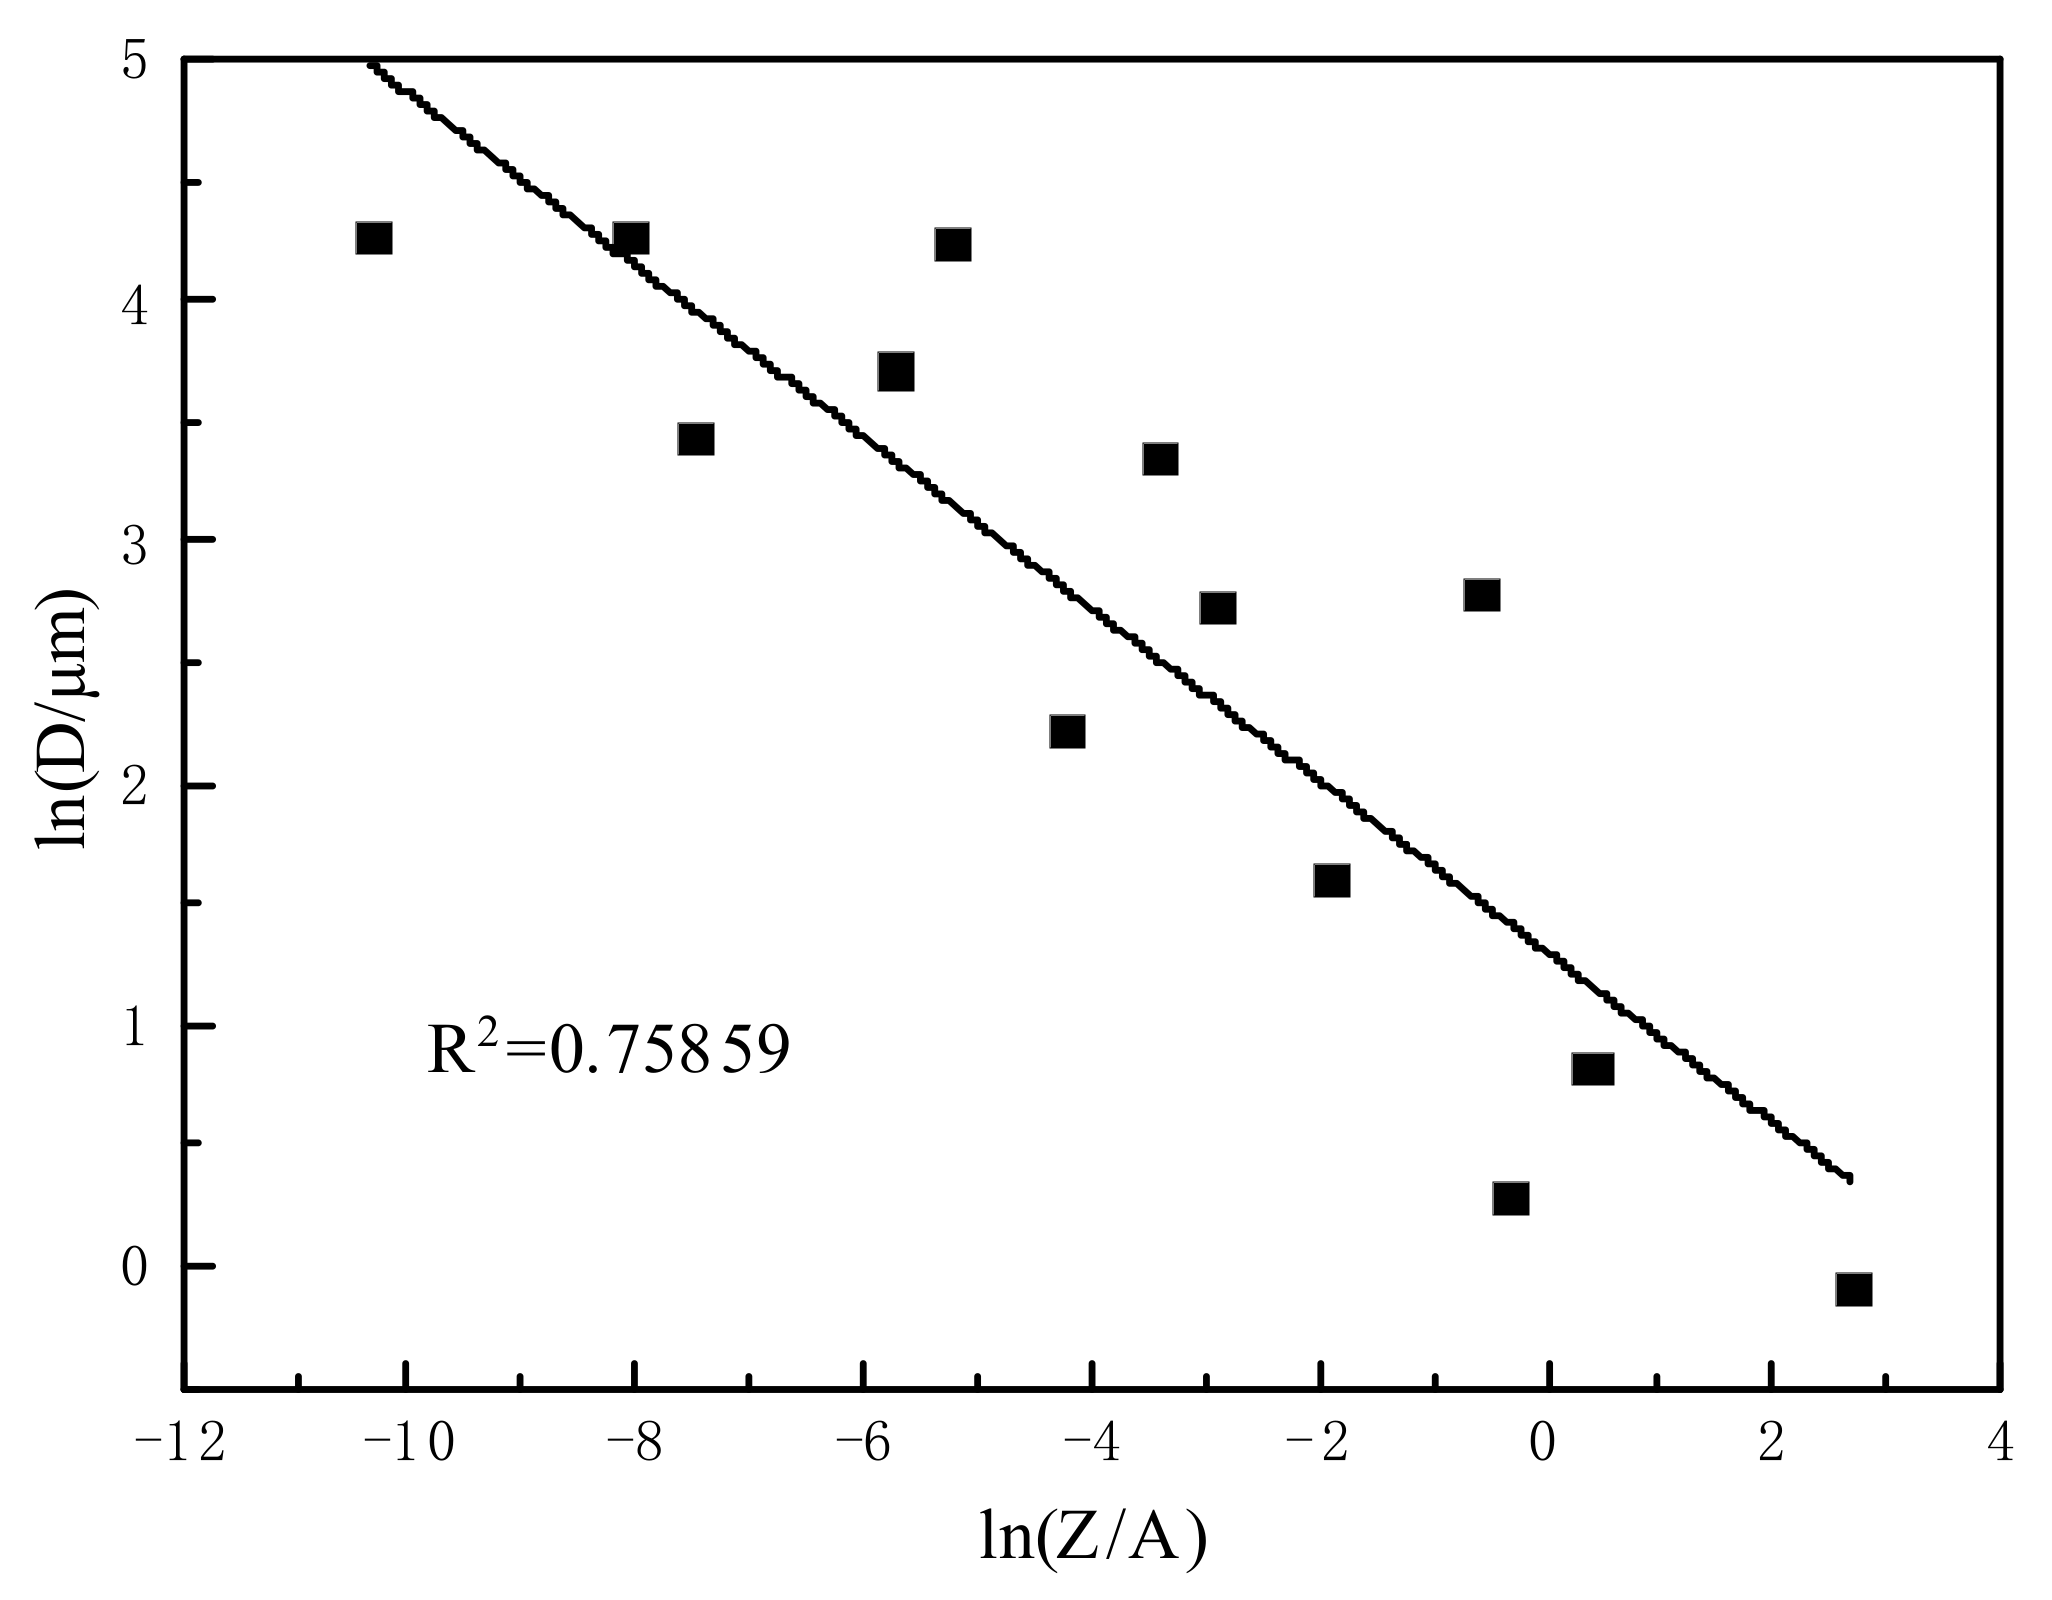
The fraction of DRX increased with the increase of deformation temperature and decrease of strain rate. The relationship between DRX grain size and Z and A is (μm).
D = 1.301   ×   ( Z / A ) 0.355 ( μ m )
(3)
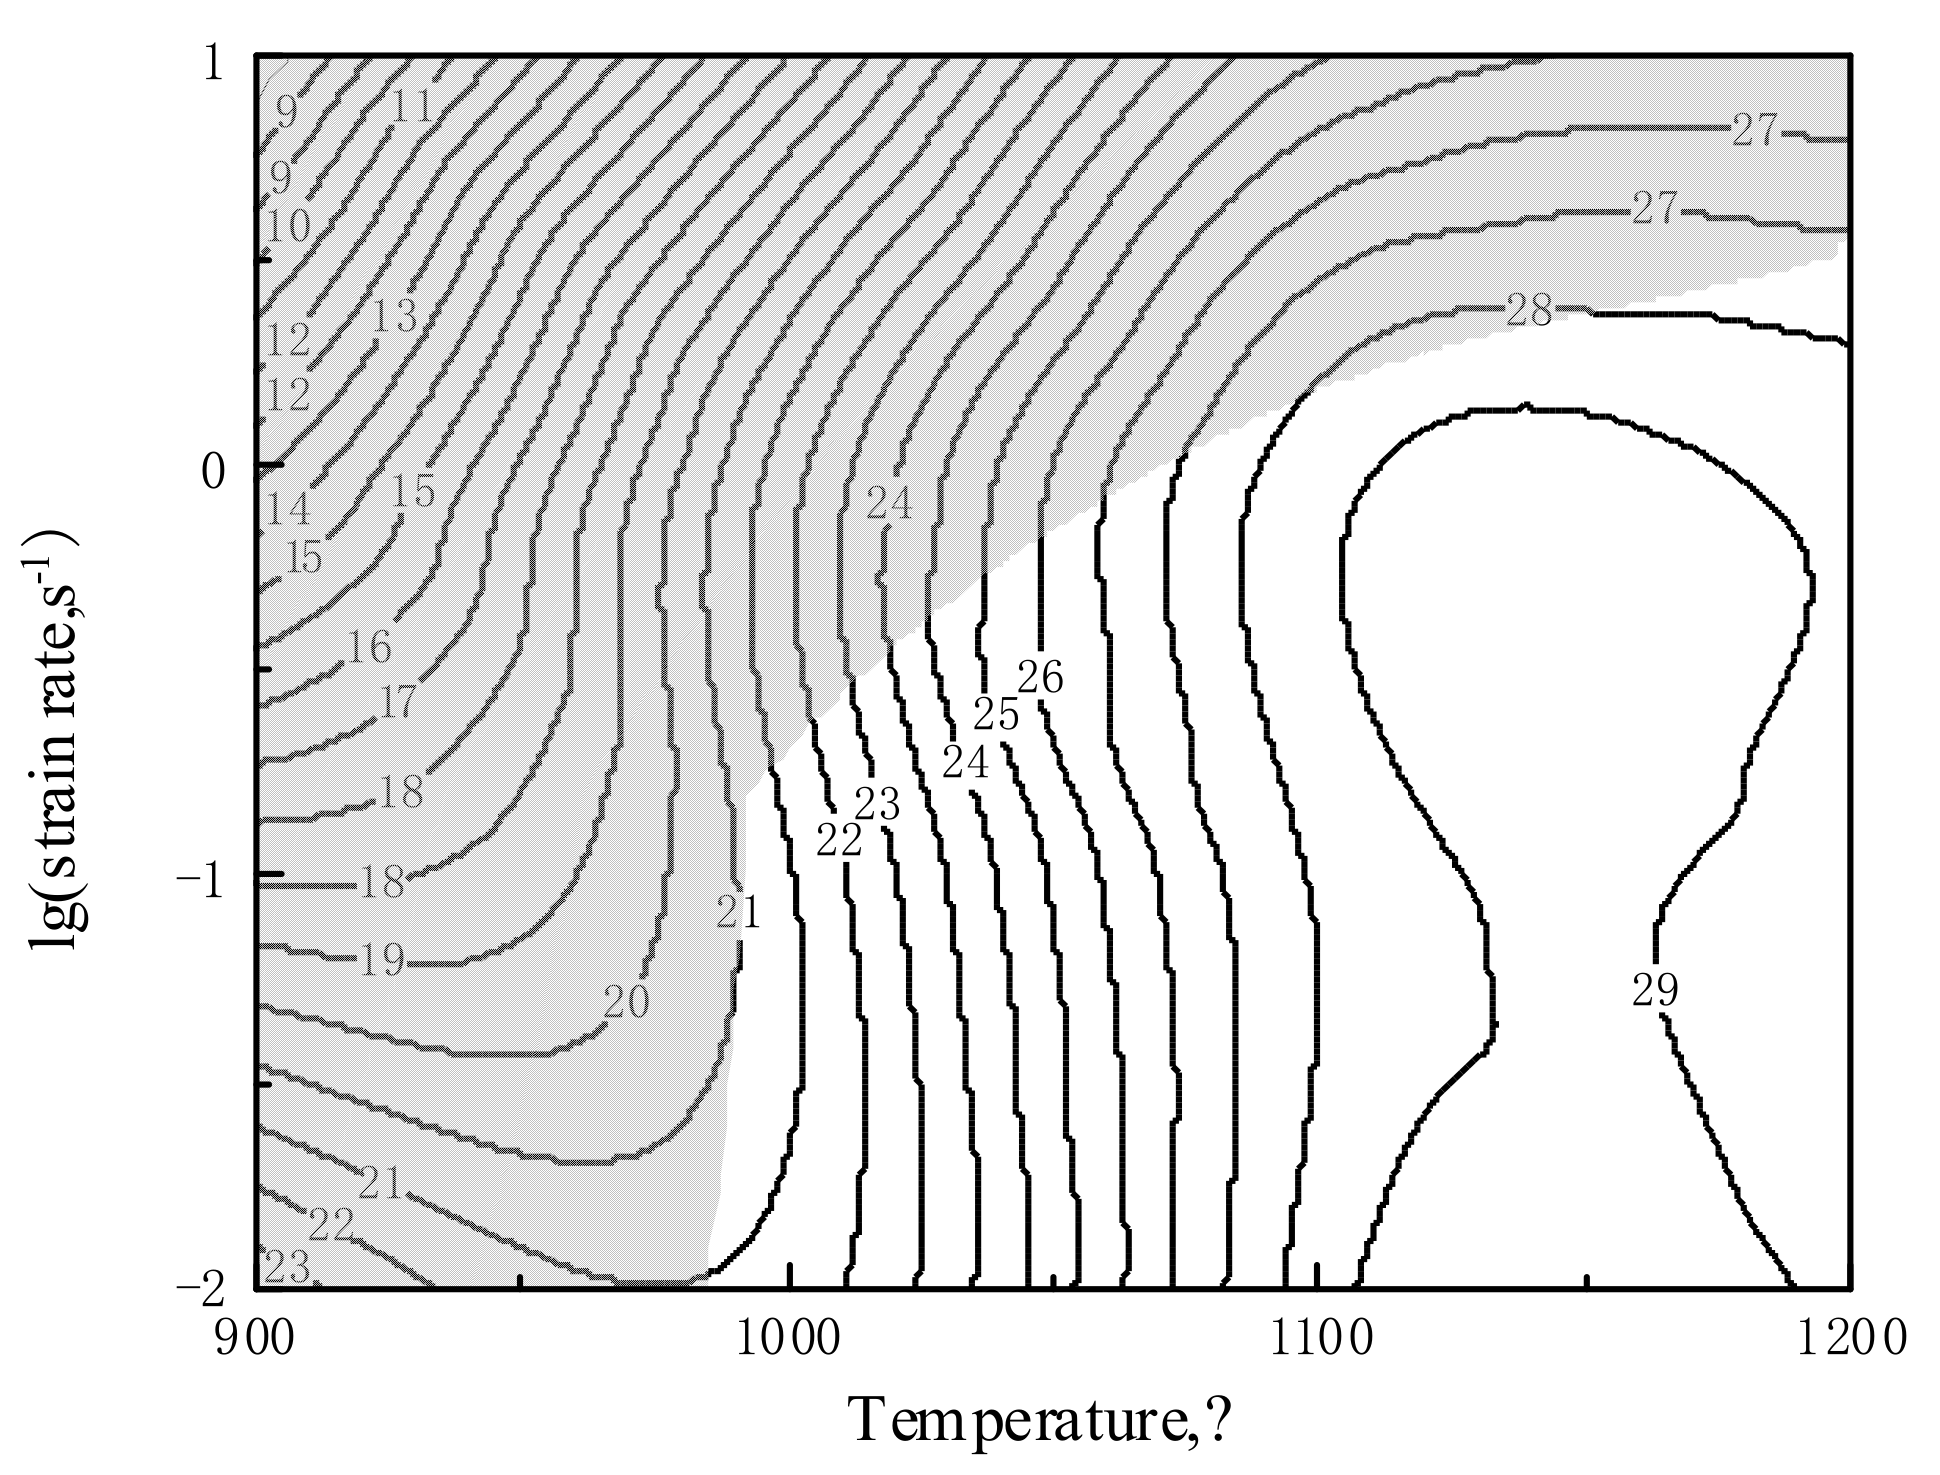
Combining the hot working map and DRX state map, the suggested processing window is 1000–1200 °C and 0.01–0.1 s−1.
(4)
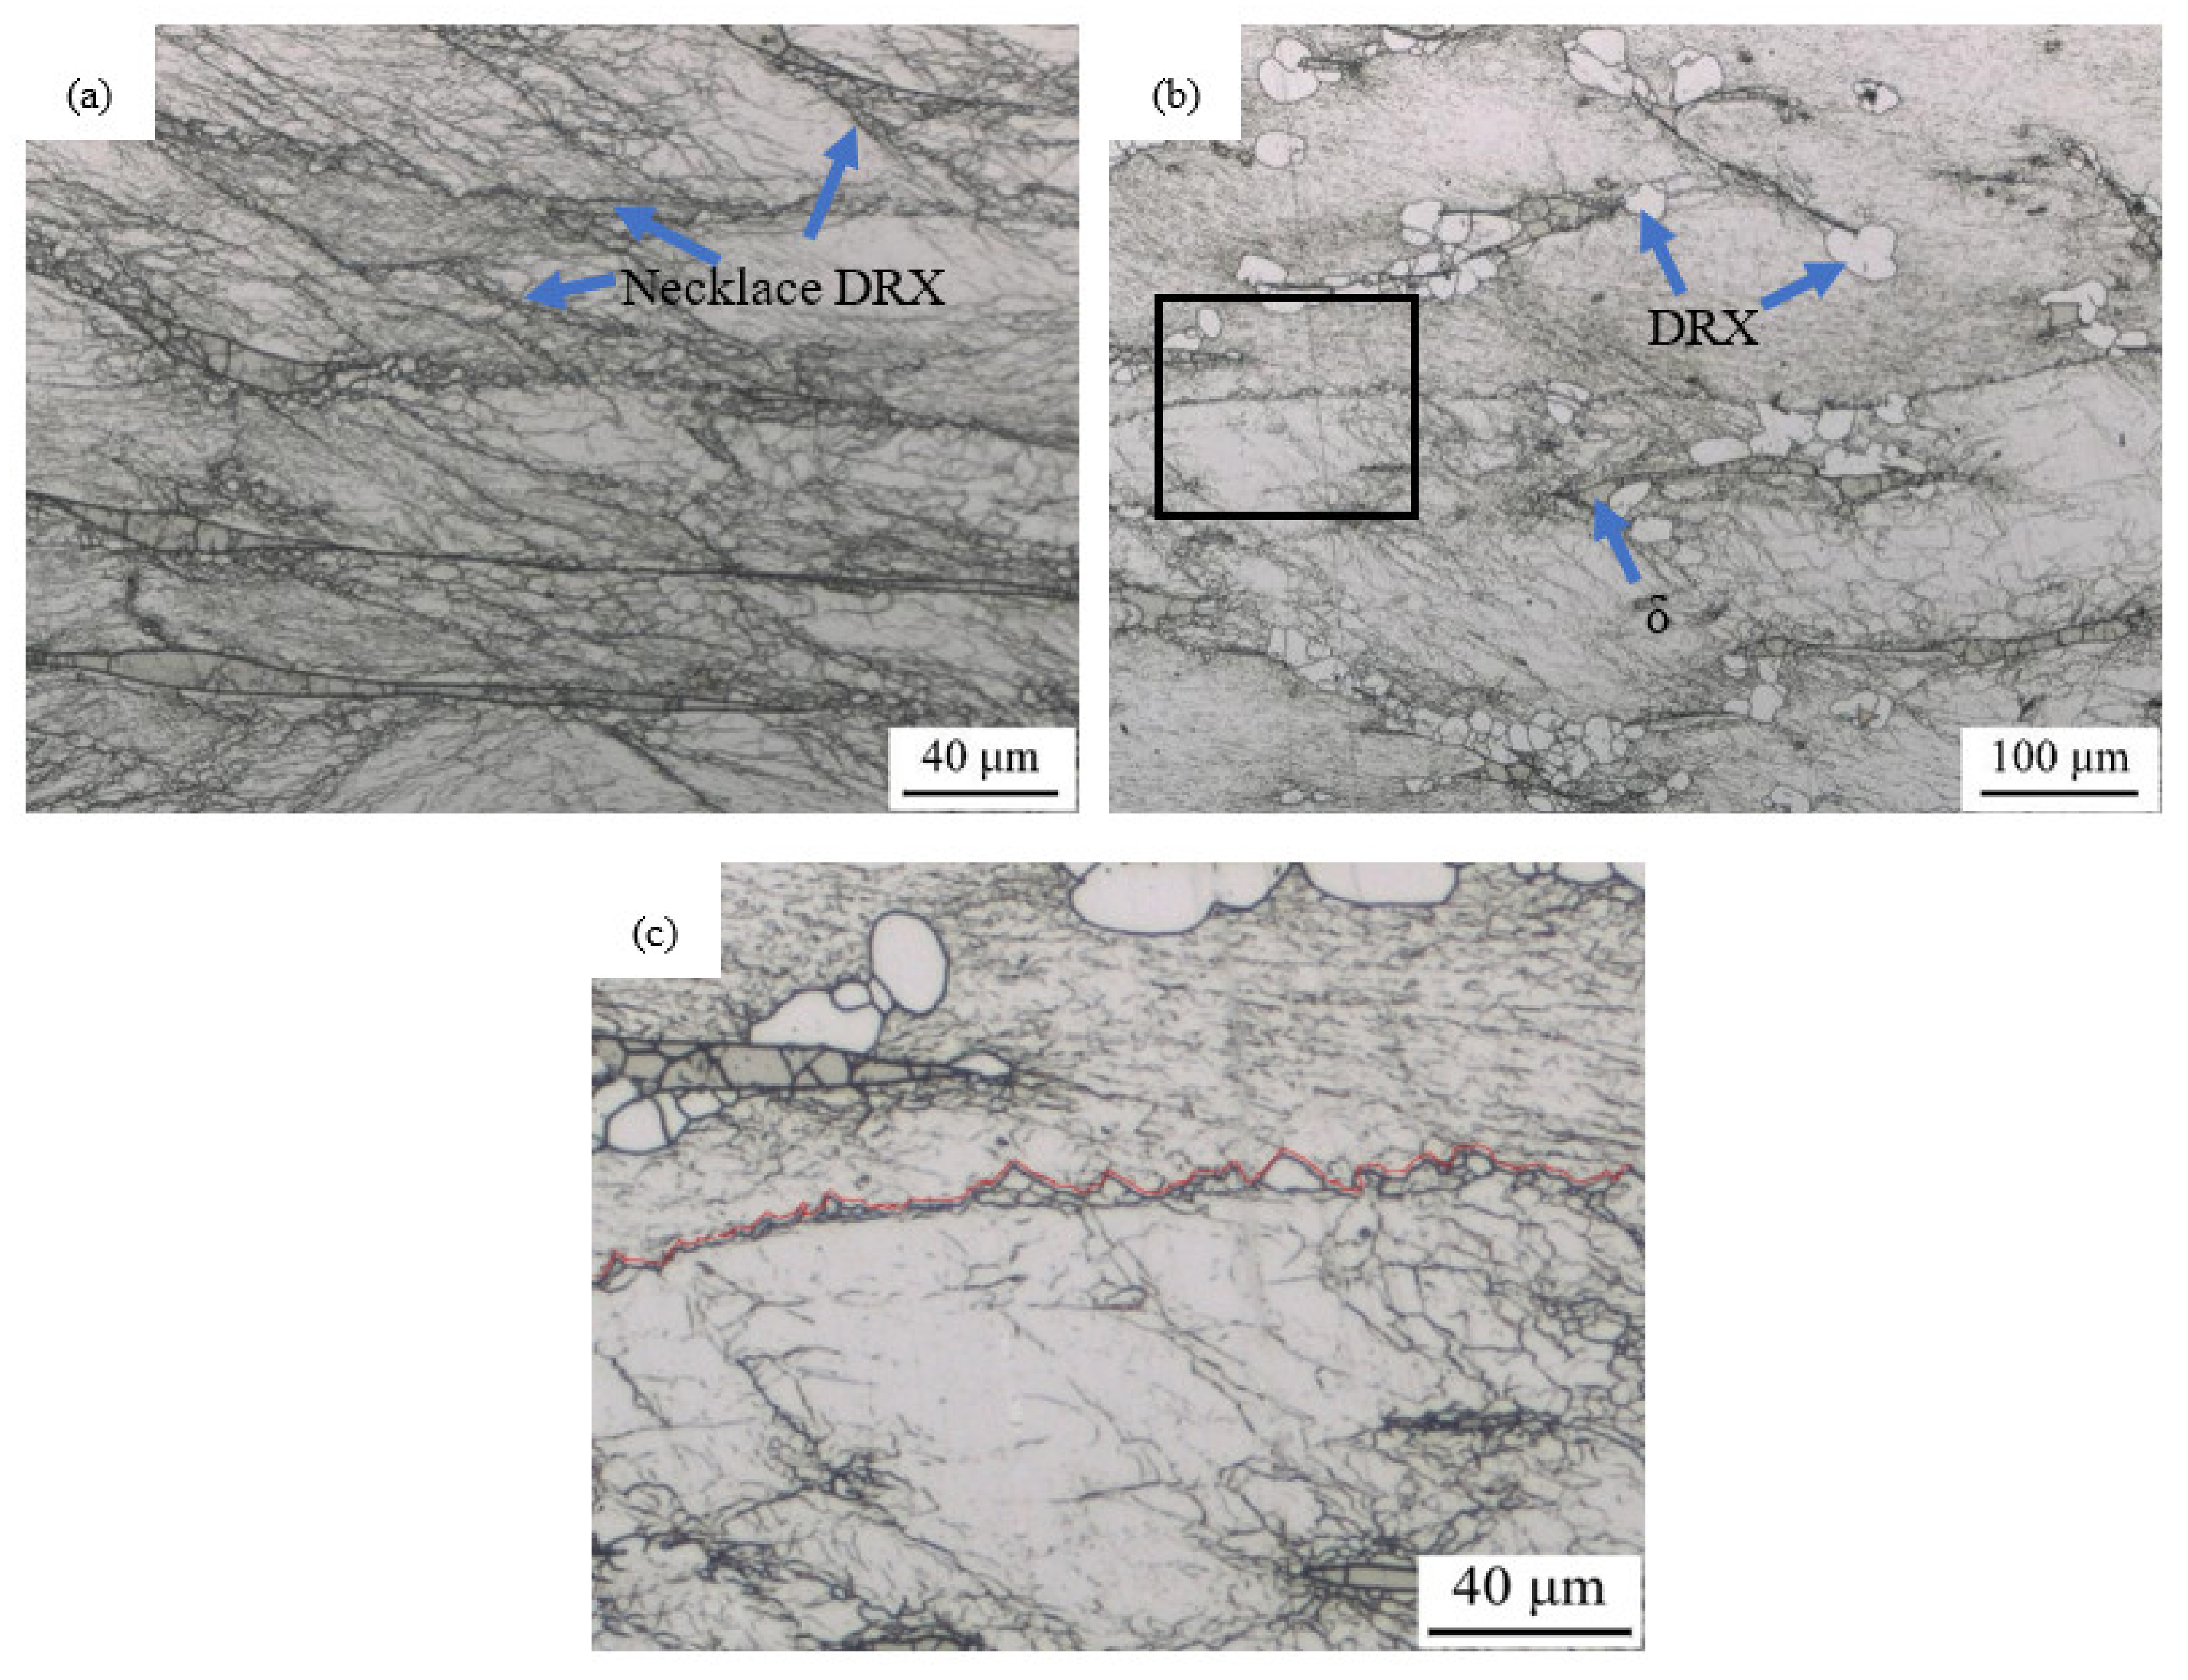
Flow instability occurs under conditions of low temperature and high strain rate. The main form of instability is necklace DRX.
(5)
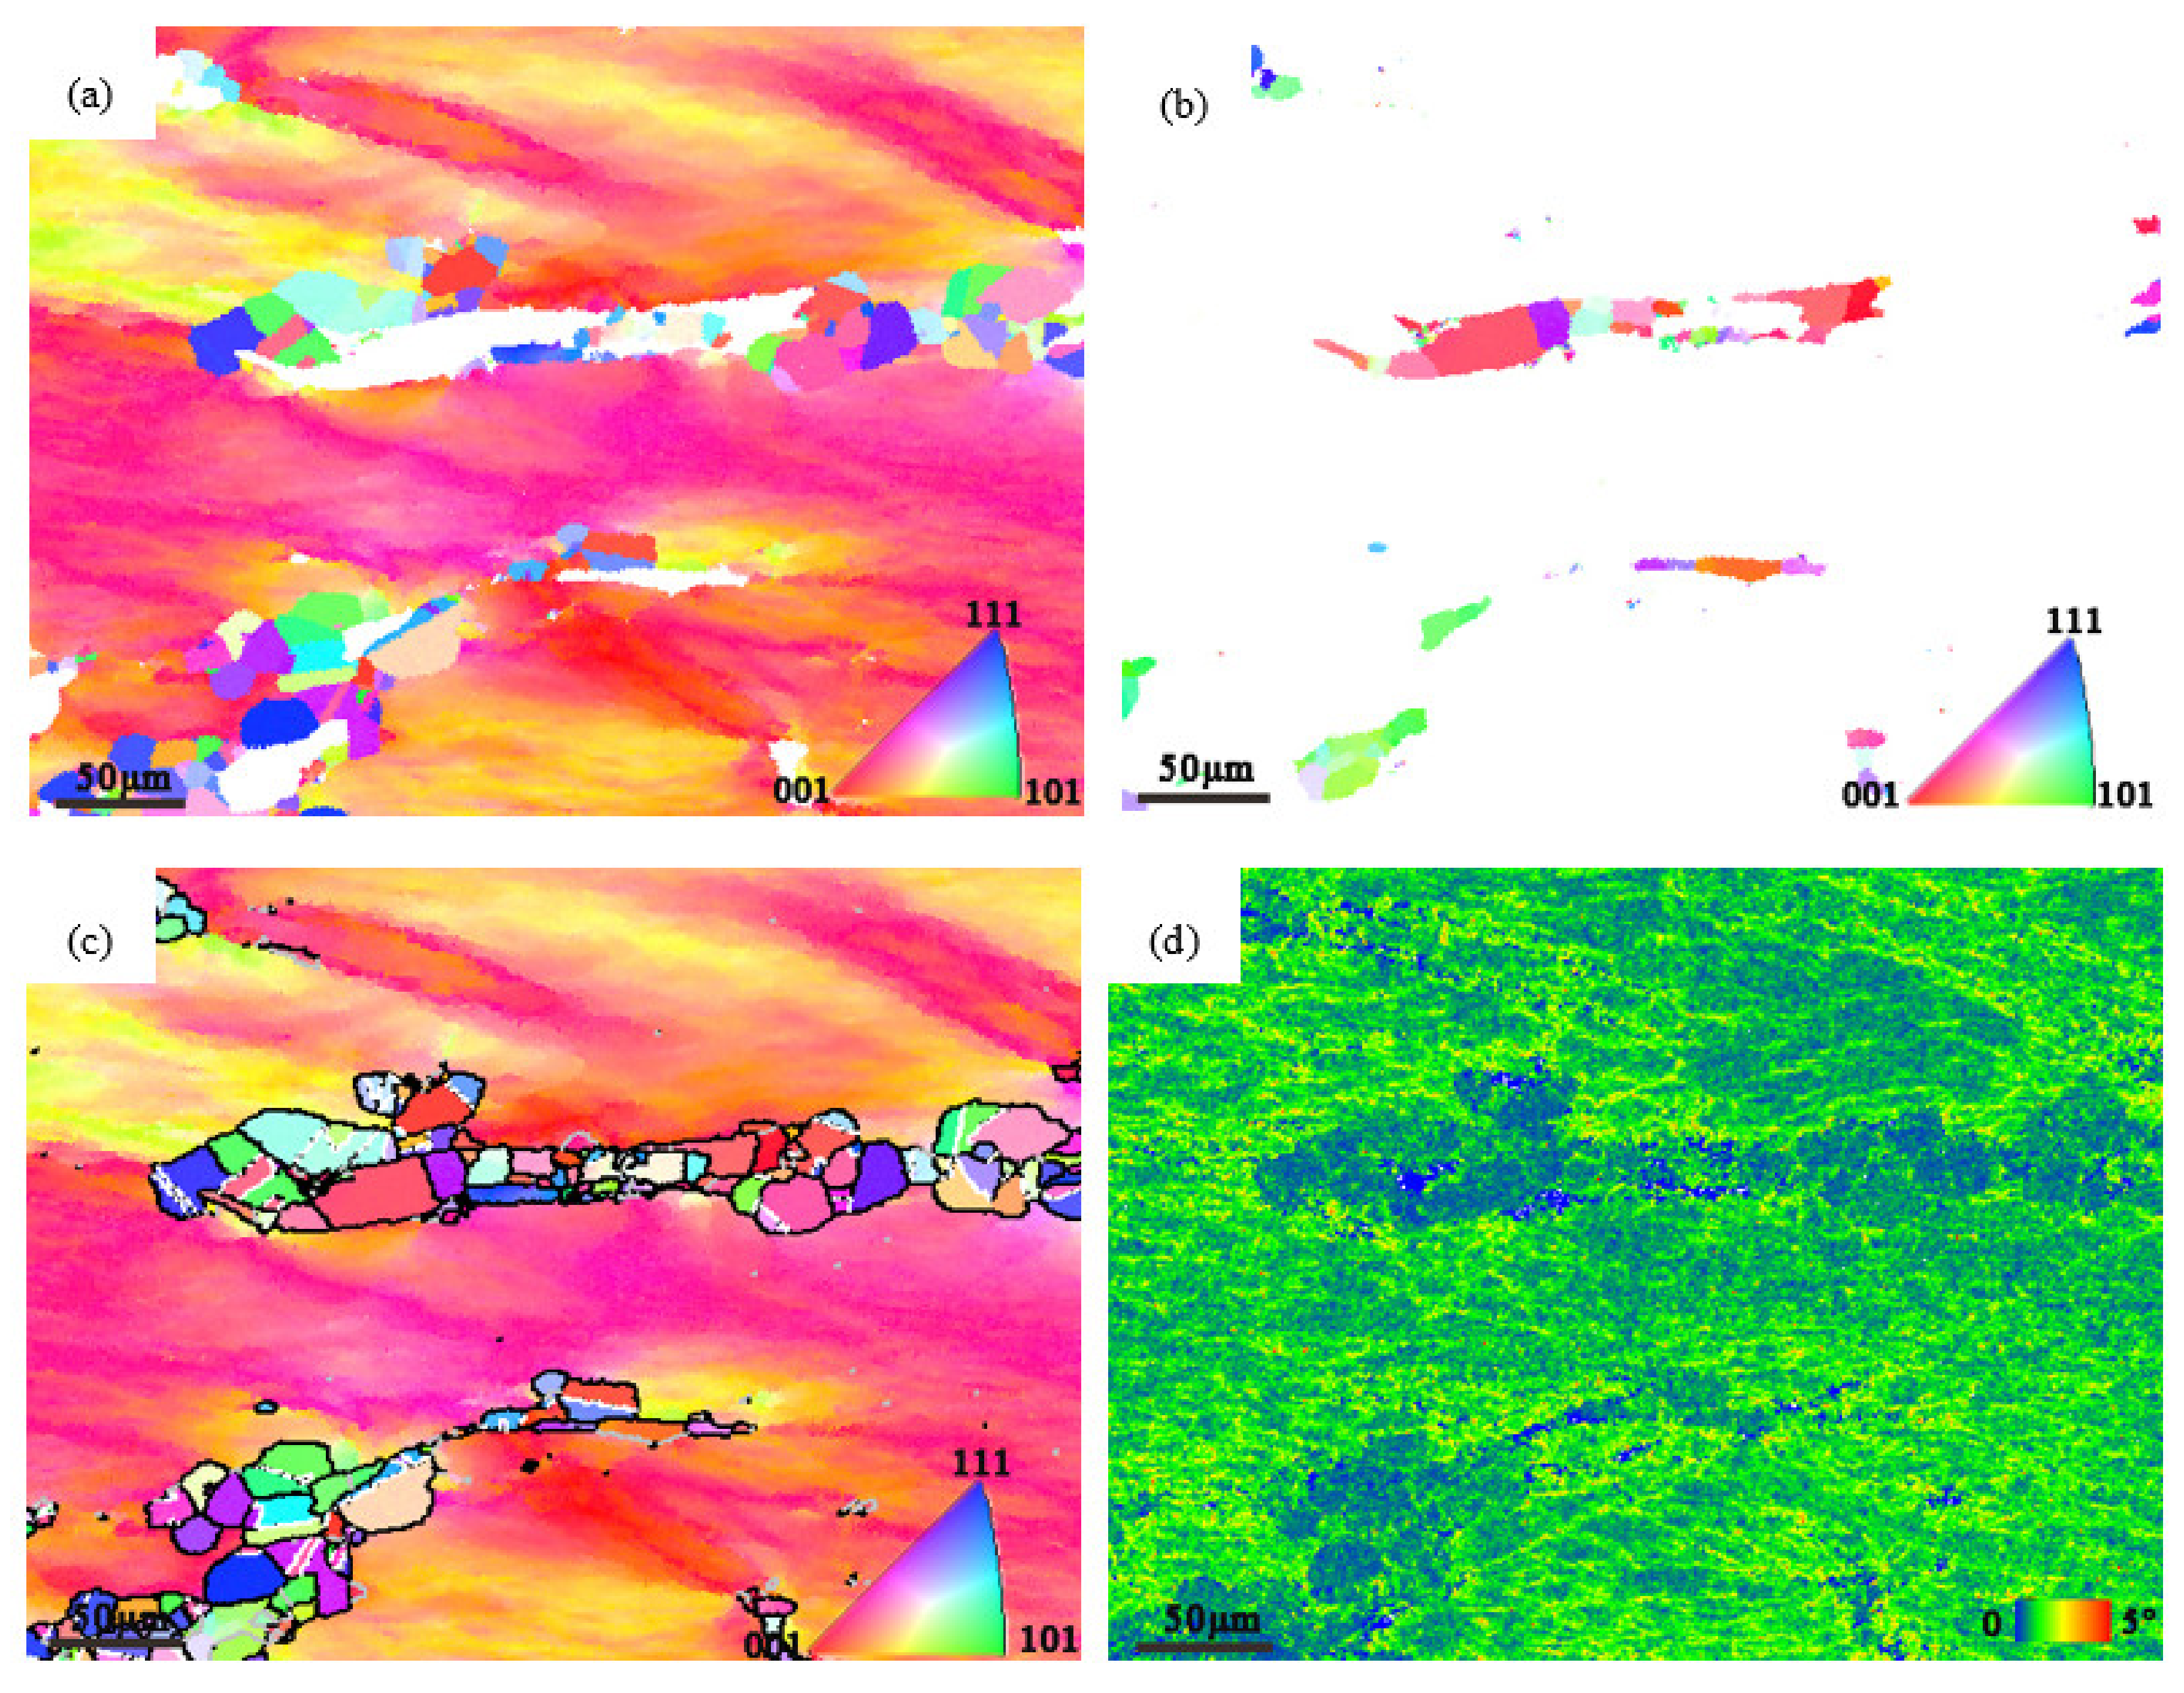
The DRX mechanism of the tested steel is the migration of subgrains. The δ phase reduces the activation energy and promotes the occurrence of DRX.

Author Contributions

Conceptualization, methodology, formal analysis. D.Z.; investigation, D.Z., L.R. and Y.W.; resources, L.R., Y.W. and W.W.; data curation, Y.W., W.W. and Z.Z.; writing—original draft preparation, D.Z.; writing—review and editing, D.Z., L.R. and W.F.; visualization, Z.Z. and W.F.; supervision, D.Z., L.R., Y.W., W.W., Z.Z. and W.F.; project administration, W.F.; funding acquisition, W.F. All authors have read and agreed to the published version of the manuscript.

Funding

This research was funded by the S&T Program of Hebei Province (No. 20311003D).

Institutional Review Board Statement

Not applicable.

Informed Consent Statement

Not applicable.

Data Availability Statement

Data sharing is not applicable.

Acknowledgments

We would like to express our gratitude to Shuhua Sun (School of Science, Yanshan University, China) for her support and help.

Conflicts of Interest

The authors declare no conflict of interest.

References

  1. Johnson, P.; Murugan, N. Friction Stir Welding Of 321Stainless Steel Plates by Tungsten Lanthanum Tool and Its Joint Analyses. Mater. Today Proc. 2018, 5, 4235–4241. [Google Scholar] [CrossRef]
  2. Wang, J.; Su, H.; Chen, K.; Du, D.; Zhang, L.; Shen, Z. Effect of δ-ferrite on the stress corrosion cracking behavior of 321 stainless steel. Corros. Sci. 2019, 158, 108079. [Google Scholar] [CrossRef]
  3. Tiamiyu, A.A.; Eskandari, M.; Sanayei, M.; Odeshi, A.G.; Szpunar, J.A. Mechanical behavior and high-resolution EBSD investigation of the microstructural evolution in AISI 321 stainless steel under dynamic loading condition. Mater. Sci. Eng. A 2016, 673, 400–416. [Google Scholar] [CrossRef]
  4. Tiamiyu, A.; Odeshi, A.; Szpunar, J. Multiple strengthening sources and adiabatic shear banding during high strain-rate deformation of AISI 321 austenitic stainless steel: Effects of grain size and strain rate. Mater. Sci. Eng. A 2018, 711, 233–249. [Google Scholar] [CrossRef]
  5. Tiamiyu, A.; Zhao, S.; Li, Z.; Odeshi, A.; Szpunar, J. Thermal and Mechanical Stability of Austenite in Metastable Austenitic Stainless Steel. Metall. Mater. Trans. A 2019, 50, 4513–4530. [Google Scholar] [CrossRef]
  6. Li, W.; Chen, H.; Li, C.; Huang, W.; Chen, J.; Zuo, L.; Ren, Y.; He, J.; Zhang, S. Microstructure and tensile properties of AISI 321 stainless steel with aluminizing and annealing treatment. Mater. Des. 2021, 205, 109729. [Google Scholar] [CrossRef]
  7. Kim, Y.; Nam, H.; Lee, J.; Park, C.; Moon, B.; Nam, D.-G.; Lee, S.H.; Kang, N. Hot-cracking resistivity of dissimilar clads using Inconel 52 and 308L stainless steel on carbon steel. J. Nucl. Mater. 2020, 533, 152103. [Google Scholar] [CrossRef]
  8. Ye, L.; Zhai, Y.; Zhou, L.; Wang, H.; Jiang, P. The hot deformation behavior and 3D processing maps of 25Cr2Ni4MoV steel for a super-large nuclear-power rotor. J. Manuf. Process. 2020, 59, 535–544. [Google Scholar] [CrossRef]
  9. Wang, L.; Li, Z.; Hu, X.; Lv, B.; Chen, C.; Zhang, F. Hot deformation behavior and 3D processing map of super austenitic stainless steel containing 7Mo–0.46 N–0.02 Ce: Effect of the solidification direction orientation of columnar crystal to loading direction. J. Mater. Res. Technol. 2021, 13, 618–634. [Google Scholar] [CrossRef]
  10. Haj, M.; Mansouri, H.; Vafaei, R.; Ebrahimi, G.R.; Kanani, A. Hot compression deformation behavior of AISI 321 austenitic stainless steel. Int. J. Miner. Metall. Mater. 2013, 20, 529–534. [Google Scholar] [CrossRef]
  11. Nkhoma, R.K.; Siyasiya, C.W.; Stumpf, W.E. Hot workability of AISI 321 and AISI 304 austenitic stainless steels. J. Alloy. Compd. 2014, 595, 103–112. [Google Scholar] [CrossRef] [Green Version]
  12. Nkhoma, R.K.; Siyasiya, C.W.; Stumpf, W.E. Constitutive modelling of mill loads during hot rolling of AISI 321 austenitic stainless steel. Int. J. Mater. Res. 2014, 105, 907–921. [Google Scholar] [CrossRef]
  13. Ghazani, M.S.; Eghbali, B.; Ebrahimi, G.R. Evaluation of the kinetics of dynamic recovery in AISI 321 austenitic stainless steel using hot flow curves. Trans. Indian Inst. Met. 2017, 70, 1755–1761. [Google Scholar] [CrossRef]
  14. Ghazani, M.S.; Eghbali, B.; Ebrahimi, G. Kinetics and critical conditions for initiation of dynamic recrystallization during hot compression deformation of AISI 321 austenitic stainless steel. Met. Mater. Int. 2017, 23, 964–973. [Google Scholar] [CrossRef]
  15. Anoop, C.; Singh, R.; Kumar, R.R.; Miyala, J.; Murty, S.N.; Tharian, K.T. Development and Validation of Processing Maps for Hot Deformation of Modified AISI 321 Austenitic Stainless Steel. Mater. Perform. Charact. 2020, 9, 150–169. [Google Scholar] [CrossRef]
  16. Green, G.; Higginson, R.; Hogg, S.; Spindler, S.; Hamm, C.; Najorka, J. Analysis of ferrite formed in 321 grade austenitic stainless steel. Mater. Sci. Technol. 2015, 31, 418–425. [Google Scholar] [CrossRef] [Green Version]
  17. Chen, H.; Wang, Z.; Qin, F.; Jia, P.; Zhao, X. Hot deformation behavior and processing maps of as-cast Mn18Cr18N steel. J. Wuhan Univ. Technol. Mater. Sci. Ed. 2017, 32, 935–943. [Google Scholar] [CrossRef]
  18. Poliak, E.I.; Jonas, J.J. Initiation of dynamic recrystallization in constant strain rate hot deformation. ISIJ Int. 2003, 43, 684–691. [Google Scholar] [CrossRef] [Green Version]
  19. Rollett, A. Recrystallization and Related Annealing Phenomena; Elsevier: Amsterdam, The Netherlands, 1995; pp. 248–259. [Google Scholar]
  20. Sellars, C. Modelling microstructural development during hot rolling. Mater. Sci. Technol. 1990, 6, 1072–1081. [Google Scholar] [CrossRef]
  21. Mecking, H.; Kocks, U. A mechanism for static and dynamic recovery. In Strength of Metals and Alloys; Elsevier: Amsterdam, The Netherlands, 1979; pp. 345–350. [Google Scholar]
  22. Ponge, D.; Gottstein, G. Necklace formation during dynamic recrystallization: Mechanisms and impact on flow behavior. Acta Mater. 1998, 46, 69–80. [Google Scholar] [CrossRef]
  23. Wang, Z.; Ma, W.; Wang, C. Effect of Strain Rate on Hot Ductility of a Duplex Stainless Steel. Adv. Mater. Sci. Eng. 2019, 2019, 1–6. [Google Scholar] [CrossRef] [Green Version]
  24. Wang, Z.; Xue, H.; Zhao, D. Microstructure Evolution and Surface Cracking Behavior of Superheavy Forgings during Hot Forging. Adv. Mater. Sci. Eng. 2018, 2018, 1–9. [Google Scholar] [CrossRef] [Green Version]
  25. Prasad, Y.; Rao, K.; Sasidhar, S. Hot Working Guide: A Compendium of Processing Maps; ASM International: Almere, The Netherlands, 2015; pp. 3–9. [Google Scholar]
  26. Aryshenskii, E.; HIRSCH, J.; Bazhin, V.; Kawalla, R.; Ulrich, P. Impact of Zener-Hollomon parameter on substructure and texture evolution during thermomechanical treatment of iron-containing wrought aluminium alloys. Trans. Nonferrous Met. Soc. China 2019, 29, 893–906. [Google Scholar] [CrossRef]
  27. Ghazani, M.S.; Eghbali, B. A ductile damage criterion for aisi 321 austenitic stainless steel at different temperatures and strain rates. Arab. J. Sci. Eng. 2018, 43, 4855–4861. [Google Scholar] [CrossRef]
  28. Jafari, M.; Najafizadeh, A. Correlation between Zener–Hollomon parameter and necklace DRX during hot deformation of 316 stainless steel. Mater. Sci. Eng. A 2009, 501, 16–25. [Google Scholar] [CrossRef]
  29. Huiqin, C.; Wenwu, H.; Xiaodong, Z.; Fengming, Q.; Zhenxing, W. Hot deformation behavior and dynamic recrystallization of Mn18Cr18N steel with as-cast versus wrought starting structures. Procedia Eng. 2017, 207, 1779–1784. [Google Scholar] [CrossRef]
  30. Qin, F.; Zhu, H.; Wang, Z.; Zhao, X.; He, W.; Chen, H. Dislocation and twinning mechanisms for dynamic recrystallization of as-cast Mn18Cr18N steel. Mater. Sci. Eng. A 2017, 684, 634–644. [Google Scholar] [CrossRef]
  31. Zhao, H.; Qi, J.; Liu, G.; Su, R.; Sun, Z. A comparative study on hot deformation behaviours of low-carbon and medium-carbon vanadium microalloyed steels. J. Mater. Res. Technol. 2020, 9, 11319–11331. [Google Scholar] [CrossRef]
Figure 1. The gating system of the tested steel.
Metals 11 01245 g001
Figure 2. The position of the compressed tested samples.
Metals 11 01245 g002
Figure 3. Phase map of original sample.
Metals 11 01245 g003
Figure 4. Flow curves of tested steel under different stain rate conditions: (a) 10 s−1; (b) 1 s−1; (c) 0.1 s−1; (d) 0.01 s−1.
Metals 11 01245 g004
Figure 5. The relationship of various parameters: (a)   ln σ ln ε ˙ ; (b) σ ln ε ˙ ; (c) ln[sinh( α σ )] ln ε ˙ ; (d) ln[sinh( α σ )] 1/T.
Metals 11 01245 g005
Figure 6. The microstructure of the tested steel at a strain rate of 1 s−1 at different temperatures: (a) 900 °C; (b) 1000 °C; (c) 1100 °C; (d) 1200 °C.
Metals 11 01245 g006
Figure 7. The microstructure at 1200 °C with different strain rates: (a) 0.1 s−1; (b) 10 s−1.
Metals 11 01245 g007
Figure 8. DRX state map of tested steel.
Metals 11 01245 g008
Figure 9. The relationship between the DRX grain size D and the parameters Z and A.
Metals 11 01245 g009
Figure 10. Processing map of tested steel at a strain of 0.8.
Metals 11 01245 g010
Figure 11. The microstructure of flow instability: (a) 1000 °C, 1 s−1; (b) 1100 °C, 1 s−1; (c) Enlargement of the black box area in (b).
Metals 11 01245 g011
Figure 12. IPF map and KAM map under 1000 °C, 0.01 s−1 conditions: (a) IPF map of austenitic steel; (b) IPF map of δ; (c) IPF map and grain boundary; (d) Corresponding KAM map.
Metals 11 01245 g012
Figure 13. IPF map and KAM map under 1100 °C, 1 s−1 conditions: (a) IPF map of austenitic; (b) IPF map of δ; (c) IPF map and grain boundary; (d) Corresponding KAM map.
Metals 11 01245 g013
Publisher’s Note: MDPI stays neutral with regard to jurisdictional claims in published maps and institutional affiliations.

