1. Introduction
The use of low-alloy steels in hot forging operations is indispensable for the automotive industry, as the low cost of materials used for transmission gears and other structural parts depends on reliable steels that are also capable of surface modification (nitriding, rectifying and burnishing) [
1]. In the case of 8620 Ni–Cr–Mo low-alloy steel, high-temperature deformation in the 1000~1100 °C range is performed using an industrial die press in short periods of time after the steel bar is removed from the furnace (less than 30 s) [
2].
Though Calphad simulations indicated that, due to the low amount of Cr, Mo, C, Mn and S, this steel would not produce precipitation at this temperature range, the initial and final small grain size indicated that the static and dynamic recrystallization mechanisms were slowed down by nanometric precipitates [
3], which can only exist if chemical segregation at grain boundaries drastically changes the local amount of the alloying elements.
If only the Fe–Cr–C ternary system is considered, there is a coarsening of M
23C
6 precipitates at 780 °C. Different models for the precipitation of this phase have been proposed, observing particles 200~250 nm in size [
4]. Segregation of elements has been documented using three-dimensional atom probe (3DAP) techniques in Fe–Ni–Cr–Mo steels, specifically evaluating the role of V. Small amounts produce MC, M
2C and M
6C, though the lack of V results in M
23C
6. These segregation maps have indicated considerable differences in nominal composition for elements such as Cr and Mo, with M
23C
6 being a Fe–Cr-rich carbide when other particles are also formed [
5].
Comparisons between thermodynamic calculation and experimental data have been performed in Ni, Mo and Cr steels with approximately 0.2% C, 0.3% Mn, 3.5% Ni, 1.8% Cr and 0.5% Mo. Ni will produce thinner martensite laminates, forming Cr
23C
6, Cr
7C
3 and Mo
2C precipitates. These particles, from a thermodynamic point of view, disappear at ~800 °C, yet MnS is present at 1200 °C [
6]. If the alloying elements are increased (316L stainless steel), M
7C
3 precipitation in the shape of needles located at grain boundaries can be observed [
7]. Similar morphologies have been observed using tempering at 700 °C in 4% Cr steels [
8]
In the case of M
23C
6, Calphad methods have indicated that large amounts of Cr, Ni, Mo and C stabilize this phase at temperatures as high as 1200 °C [
3]. Furthermore, strain also plays a significant role, as high-Cr steels (12%) form M
23C
6 precipitates during creep at 650 MPa and 10,000 h [
9], and segregated zones have been observed in stainless 304L steel around M
23C
6 precipitates during annealing above 650 C; coalescence of particles has also been observed [
10].
Grain growth models (steels with Ti and Nb), which consider the previous austenite grain size (PAGS), indicate that between 950 and 1200 °C, small precipitates (~300 nm) may form [
11]. Moreover, austenitizing treatments promote the M
23C
6 to M
7C
3 transformation in Cr–Mo–V steels, and the packet size of martensite is linearly related to PAGS with trip-like M
23C
6 precipitate at the martensite lathe boundaries [
12].
Though the 8620 steel has much lower amounts of alloying elements than the steels described above and also lacks Ti and Nb as high-temperature precipitation formers, intensive quenching of carburized steels indicated that 8620 presents a three times smaller grain size than 1020 steel. In the as-received form, 1020 has a 23 µm grain size, while 8620 has 10 µm [
13]. As impact toughness is significantly deteriorated by increasing the PAGS size [
12] and these steels are used in automotive hot forging applications because of their high toughness, it is evident that PAGS controlling mechanisms must be active at 1000 or 1100 °C during deformation, with only Cr, Mo or Mn being responsible for the nanometric, short-term precipitation slowing down static and dynamic recrystallization and austenite grain growth.
Table 1 summarizes the simulations or analyses of precipitates at high temperatures by the studies just mentioned.
For steels that require high toughness in the martensite state, PAGS must be low enough to ensure that cracks will not propagate. Reduction of the lamellar spacing in martensite is an additional way to maintain or increase this property [
12]. This work analyzed the resulting microstructure of quenched steel after deformation at 1100 °C, in order to verify that the austenite grain size was small and also that the resulting lamellar spacing as a function of strain, being the deformed bar, was large enough to differentiate the microstructure and hardness characteristics at clearly separated points.
Though a high temperature precipitation Thermocalc calculation analysis for this specific low-alloy steel is hard to find in the literature, modified SA508 nuclear grade steels with Cr contents of 2.5% [
6] indicated that this last element is the main reason for M
23C
6 precipitates appearing at temperatures as high as 800 °C.
On the other hand, micro-segregation and the possible increase in alloy concentration at the grain boundaries at 1100 °C (diffusion is extremely fast at this temperature) are yet to be analyzed through Thermocalc (or other simulation or experimental methods) as an explanation for grain growth inhibition in these types of steel.
The present work focused on explaining, from a modeling and thermodynamic point of view, the role of carbide-forming elements in low-alloy steels at high temperature by using Thermocalc simulations, while also confirming the results with experimental tests and SEM and TEM characterization, making the short-lived nanometric-sized carbides’ presence at 1000 °C the best hypothesis for grain growth inhibition.
2. Materials and Methods
The chemical composition of the 8620 steel used in this work is indicated in
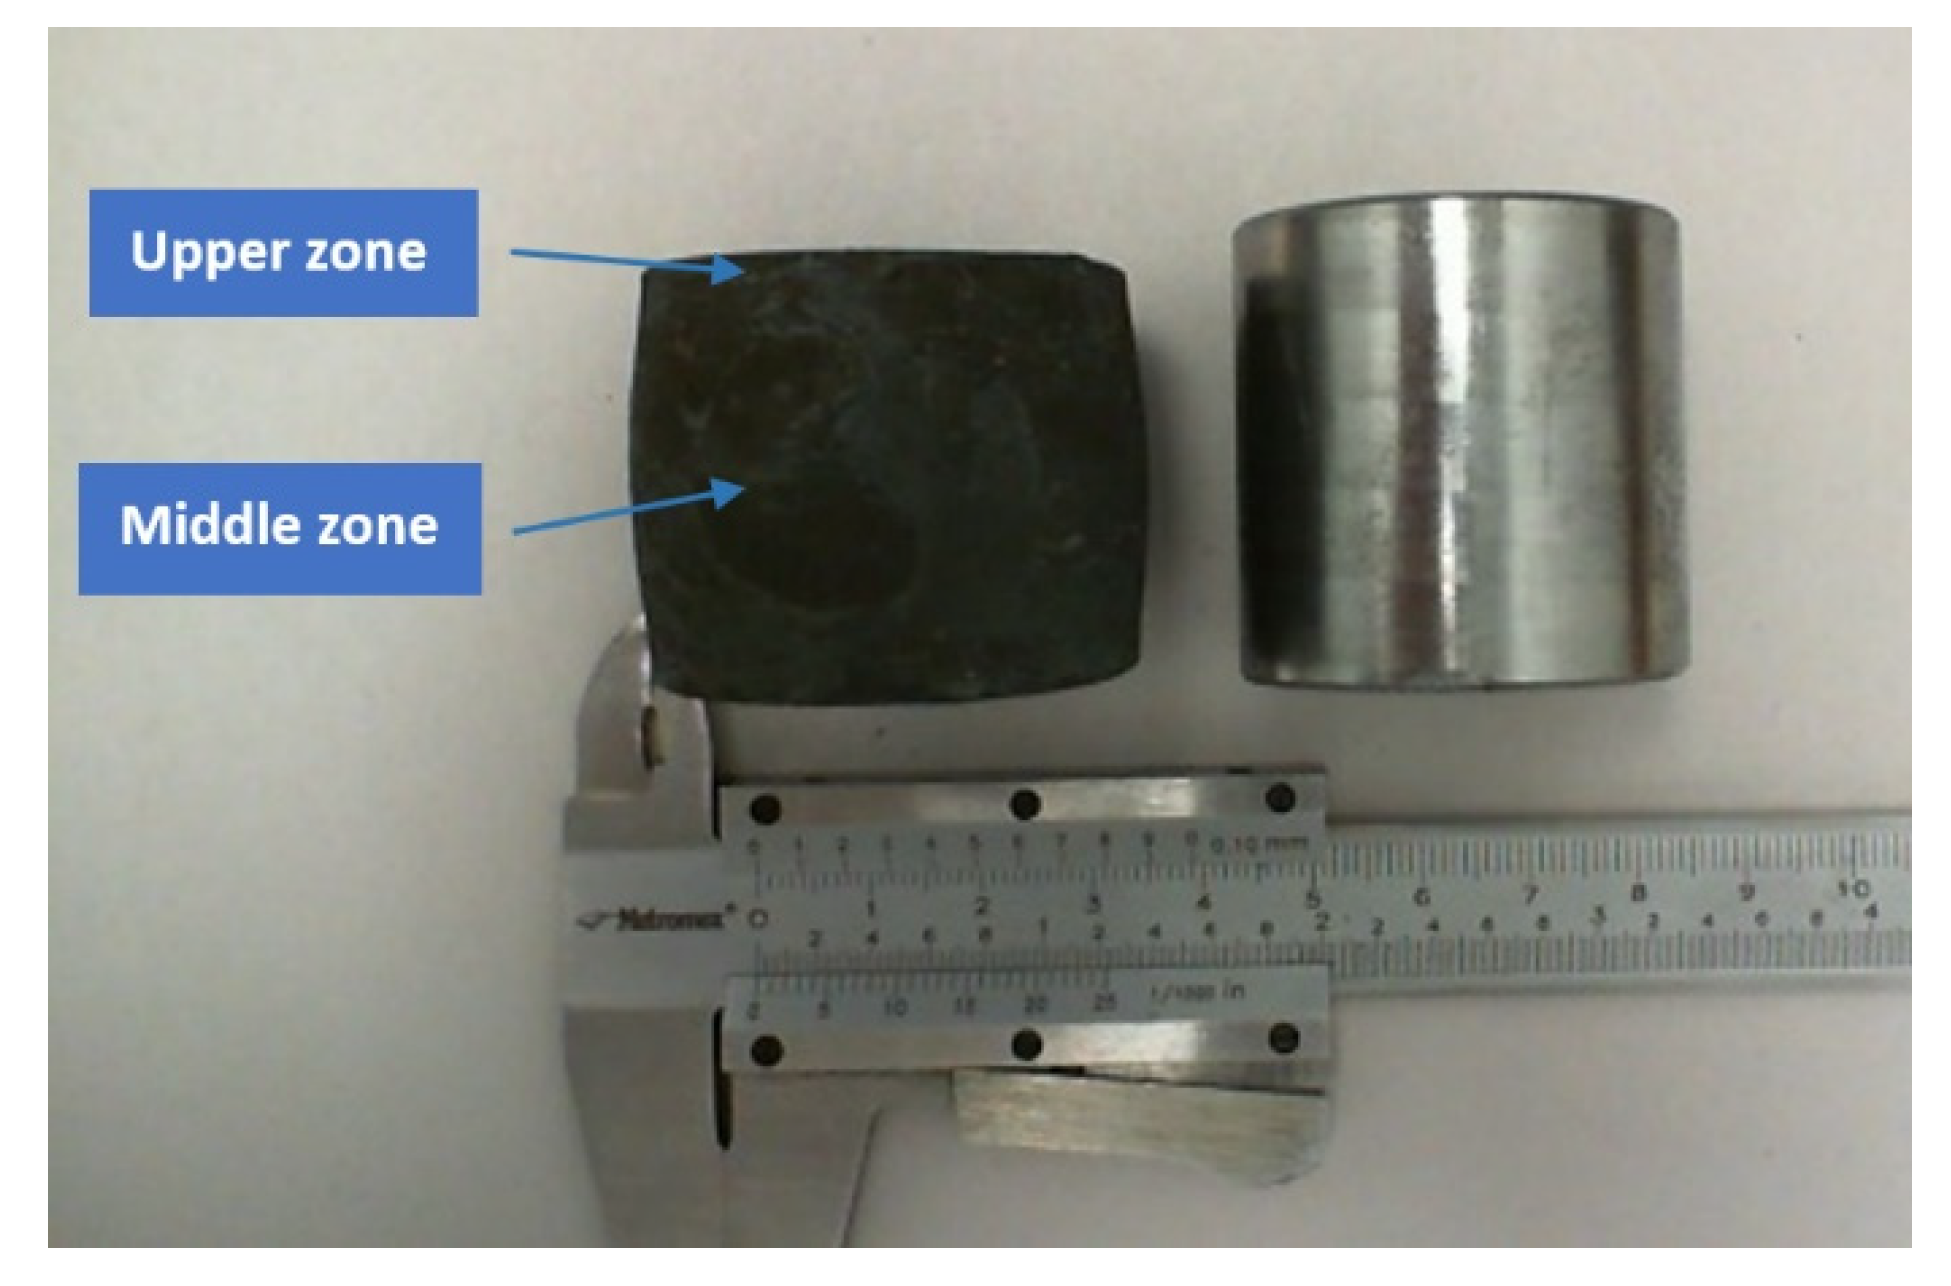
Table 2. In order to reproduce hot forging conditions, an 8620 steel bar, 38.1 mm in diameter (1.5 in) and 44 mm in length (
Figure 1), was heated inside a furnace up to 1100 °C at a 50 °C/min rate, maintained for a 10 min period, and then deformed with a hydraulic press by compression to a length of 40 mm. Immediately after deformation, the hot bar was submerged in room-temperature water (15 °C) in order to produce martensite, austenite and also bainite at the zones where the cooling rate was not fast enough to cross the Ms limit (the radius of the bar was large enough to observe differences in cooling rates and the resulting microstructure).
The thermal behavior of 8628 steel was investigated by means of a TA Instruments SDT Q600 differential scanning calorimeter (New Castle; UK) at a heating rate of 20 °C/min. A constant flow of high-purity Ar and alumina sample holders were used. The sample masses were approximately 50 mg. The SDT Q600 was calibrated using an indium standard specimen (Tm = 429.7 K) and a zinc standard specimen (Tm = 692.6 K), giving an accuracy of ±0.2 K and ±0.2 mW.
In order to locate the plastic strain zones and values, a FEM simulation of the deformation suffered by the steel bar was performed using Hypermesh software and the Radioss solver, along with a Johnson–Cook plastic model [
15]. The three-dimensional geometry of one-fourth of the cylindrical geometry (90 degrees of the circle’s area) was meshed in Hypermesh with 1980 tetra volume elements, establishing symmetry conditions to recreate the full cylinder’s behavior, and constrained displacement in the axial direction (z) for elements at the base of the cylinder and a 1 mm/s imposed velocity on the top elements. Parameters for the Johnson–Cook model included E = 20 GPa, υ = 0.3, S
y = 100 MPa, S
u = 150 MPa, ε
u = 50%, which are only approximate values, as the behavior of the steel at such a high temperature was only simulated to evaluate the distribution of the strain ε and the strain rate
(and not stress) along the section of the deformed cylinder. The Radioss solver was used to calculate these parameters for each element after 4 s and a 4 mm length reduction (reproducing the actual steel cylinder’s hot deformation).
The longitudinal section of the forged steel bar was analyzed by cutting, grinding and polishing to perform Rockwell C hardness tests at the two zones indicated in
Figure 1. Moreover, polished samples were etched with a 2% nital solution to observe the martensite and bainite in a Hitachi TM3030 SEM microscope (15 kV), and thin samples were prepared to analyze the precipitates’ presence in a JEOL JEM-1200EX Electron Microscope at 120 kV along with diffraction patterns.
In order to simulate high-temperature precipitation occurring at the grain boundaries of the austenite phase at a temperature interval of 1000~1100 °C, a 2-level design of experiments (DOE) was fed into Minitab statistical software using values much higher than the nominal ones (approximately twice as much for all elements except C and Cr, for which the factor was ~10 times), which are presented in
Table 2. Temperature was also considered a factor in the DOE simulation, as forging was carried out at 1100 °C, though cooling during this operation may have decreased the temperature to ~1000 °C. Simulations were carried out using the Thermocalc TC-PRISMA precipitation module by feeding the program with the corresponding amount (weight %) of the alloying element, temperature (either 1000 or 1100 °C) or an austenite iron FCC matrix, and tracing the precipitation of the M
7C
3, M
23C
6 or MnS phases in a 1000 s period, as hot forging manufacturing operations are performed at high speed many times in a few seconds for various deformation steps [
1].
In all cases, the size of the calculated precipitates as a function of time, as well as the nucleation rate, were plotted and used in the Minitab results columns to generate DOE sensitivity plots. The TC-PRISMA module included in Thermocalc simulates the nucleation and growth of precipitates with a specific composition (TCFE8 database) in a metal matrix (in this case, γ-fcc Fe) using the Larger–Schwartz method and different values for the Gibbs energy (
) for the formation of a critical nucleus [
16].
A 2-level design of experiments was selected, as the number of independent factors included in the analysis was considerable (8 alloying element compositions and temperature) and a full experiment would require 512 trials. A 2-level fractional factorial design (α = 0.05) was used, limiting the number of randomized experiments to 32 (a 1/16 fraction of the full factorial experiment 2
9−4) and thus limiting the resolution of results to the interactions of 2 factors or a Level IV resolution (the main effect cannot be estimated separately from 3-factor interactions) [
17]. The statistical results were considered adequate for this analysis and focused on the effect of each factor on the precipitation of specific particles.
3. Results and Discussion
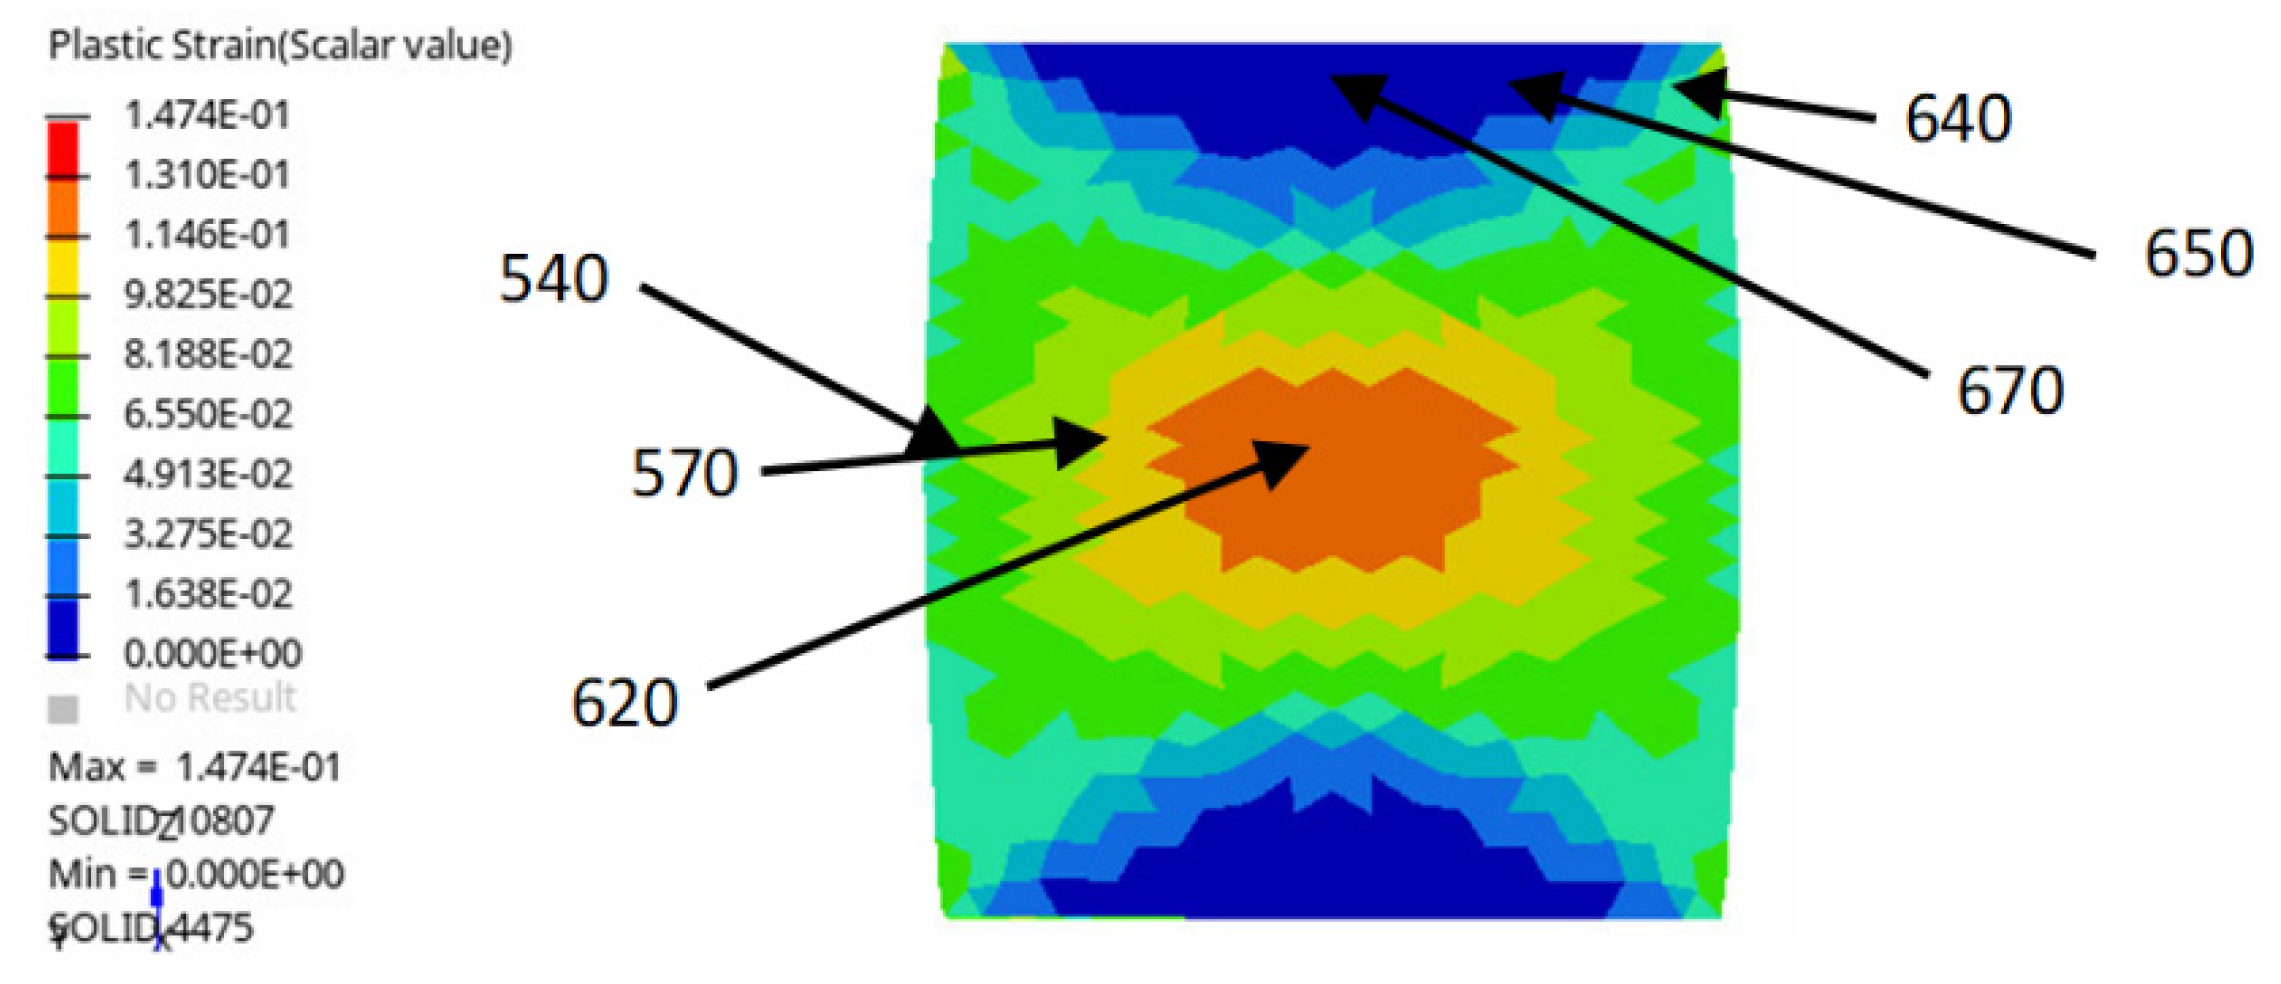
The finite element simulation (
Figure 2) indicated that maximum plastic strain was present at the middle (from bottom to top) of the steel bar and had a variation of ε = 12% at the center (axis) of the part to 7% at the exterior (surface of the bar). On the other hand, at the upper zone, deformation changed from zero at the center to 5% at the exterior zone.
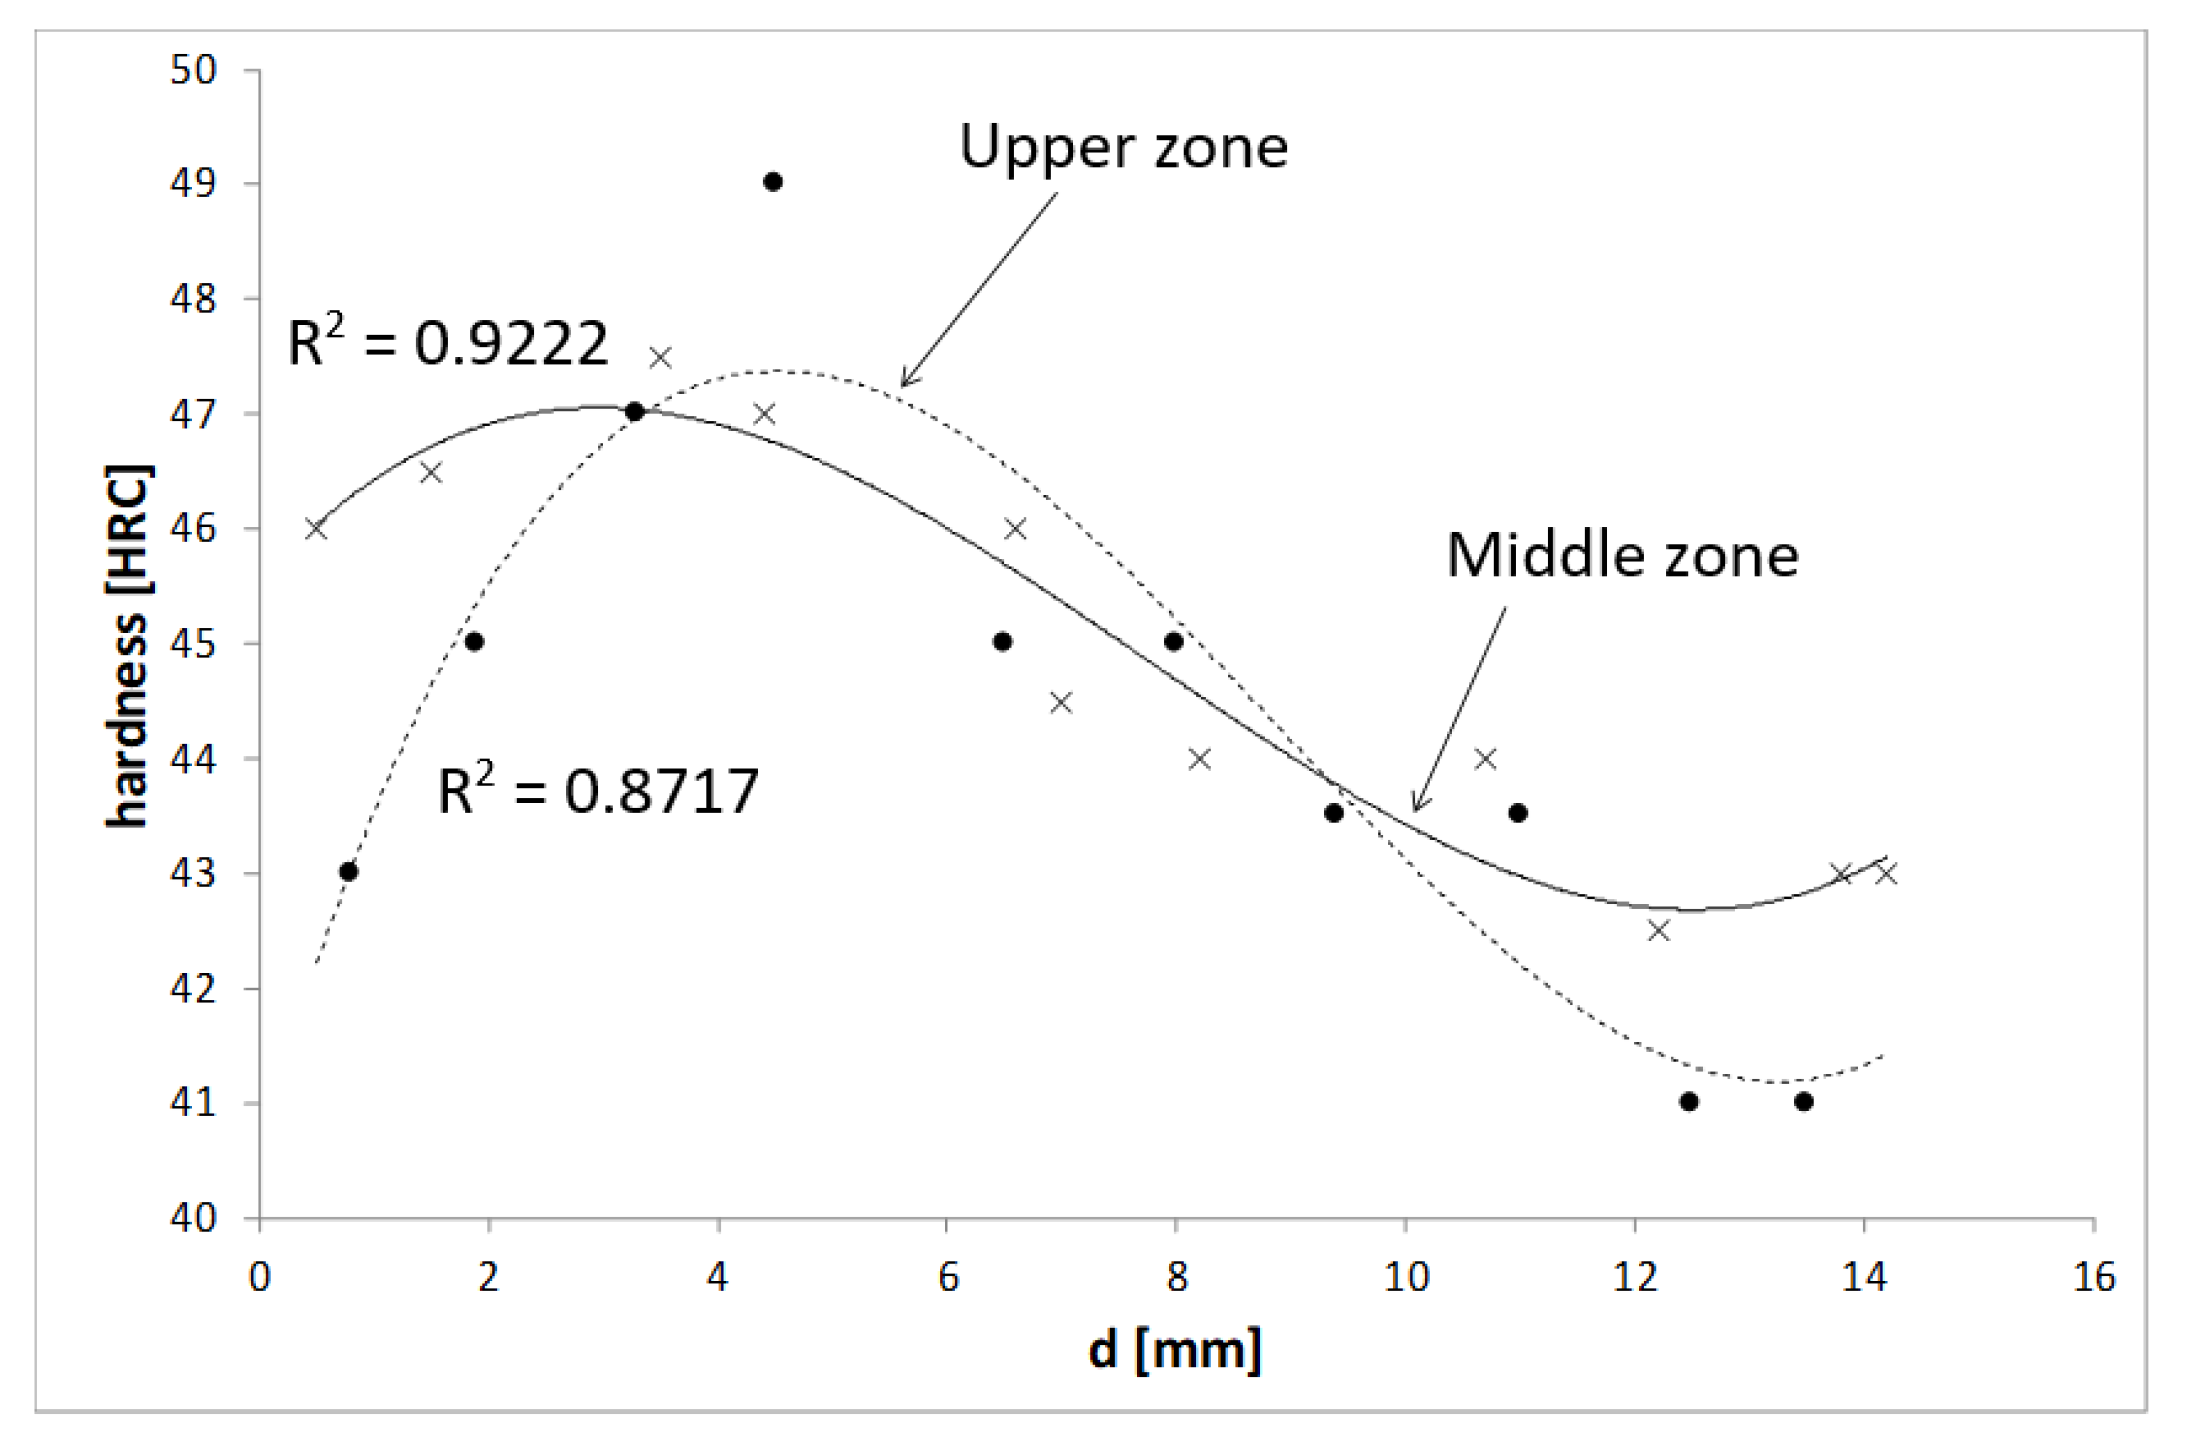
Figure 3 shows the third-grade polynomial curves fitted to Rockwell hardness measurements as a function of distance from the exterior surface of the bar at both the middle and upper zones of the hot deformed part. It was evident that the upper zone presented larger differences in hardness, though the cooling rates and martensite formation must also be taken into account, as the center of the bar suffers cooling at a slower rate than zones near to the surface.
If the lamellar spacing indicated in nm in
Figure 4 is analyzed, it is difficult to connect strain or strain rate with the spacing of martensite or bainite as a function of the position in the deformed bar. On the other hand, this spacing, clearly related to hardness (
Figure 2), with higher hardness when spacing is smaller [
18], is a function of the cooling rate: zones near the surface will cool at a higher rate than those at the interior of the part. Moreover, differences in hardness were more evident at the upper zone (
Figure 3), which suggests that PAGS is very important when defining the mechanical properties and that lamellar spacing is only part of the phenomenon.
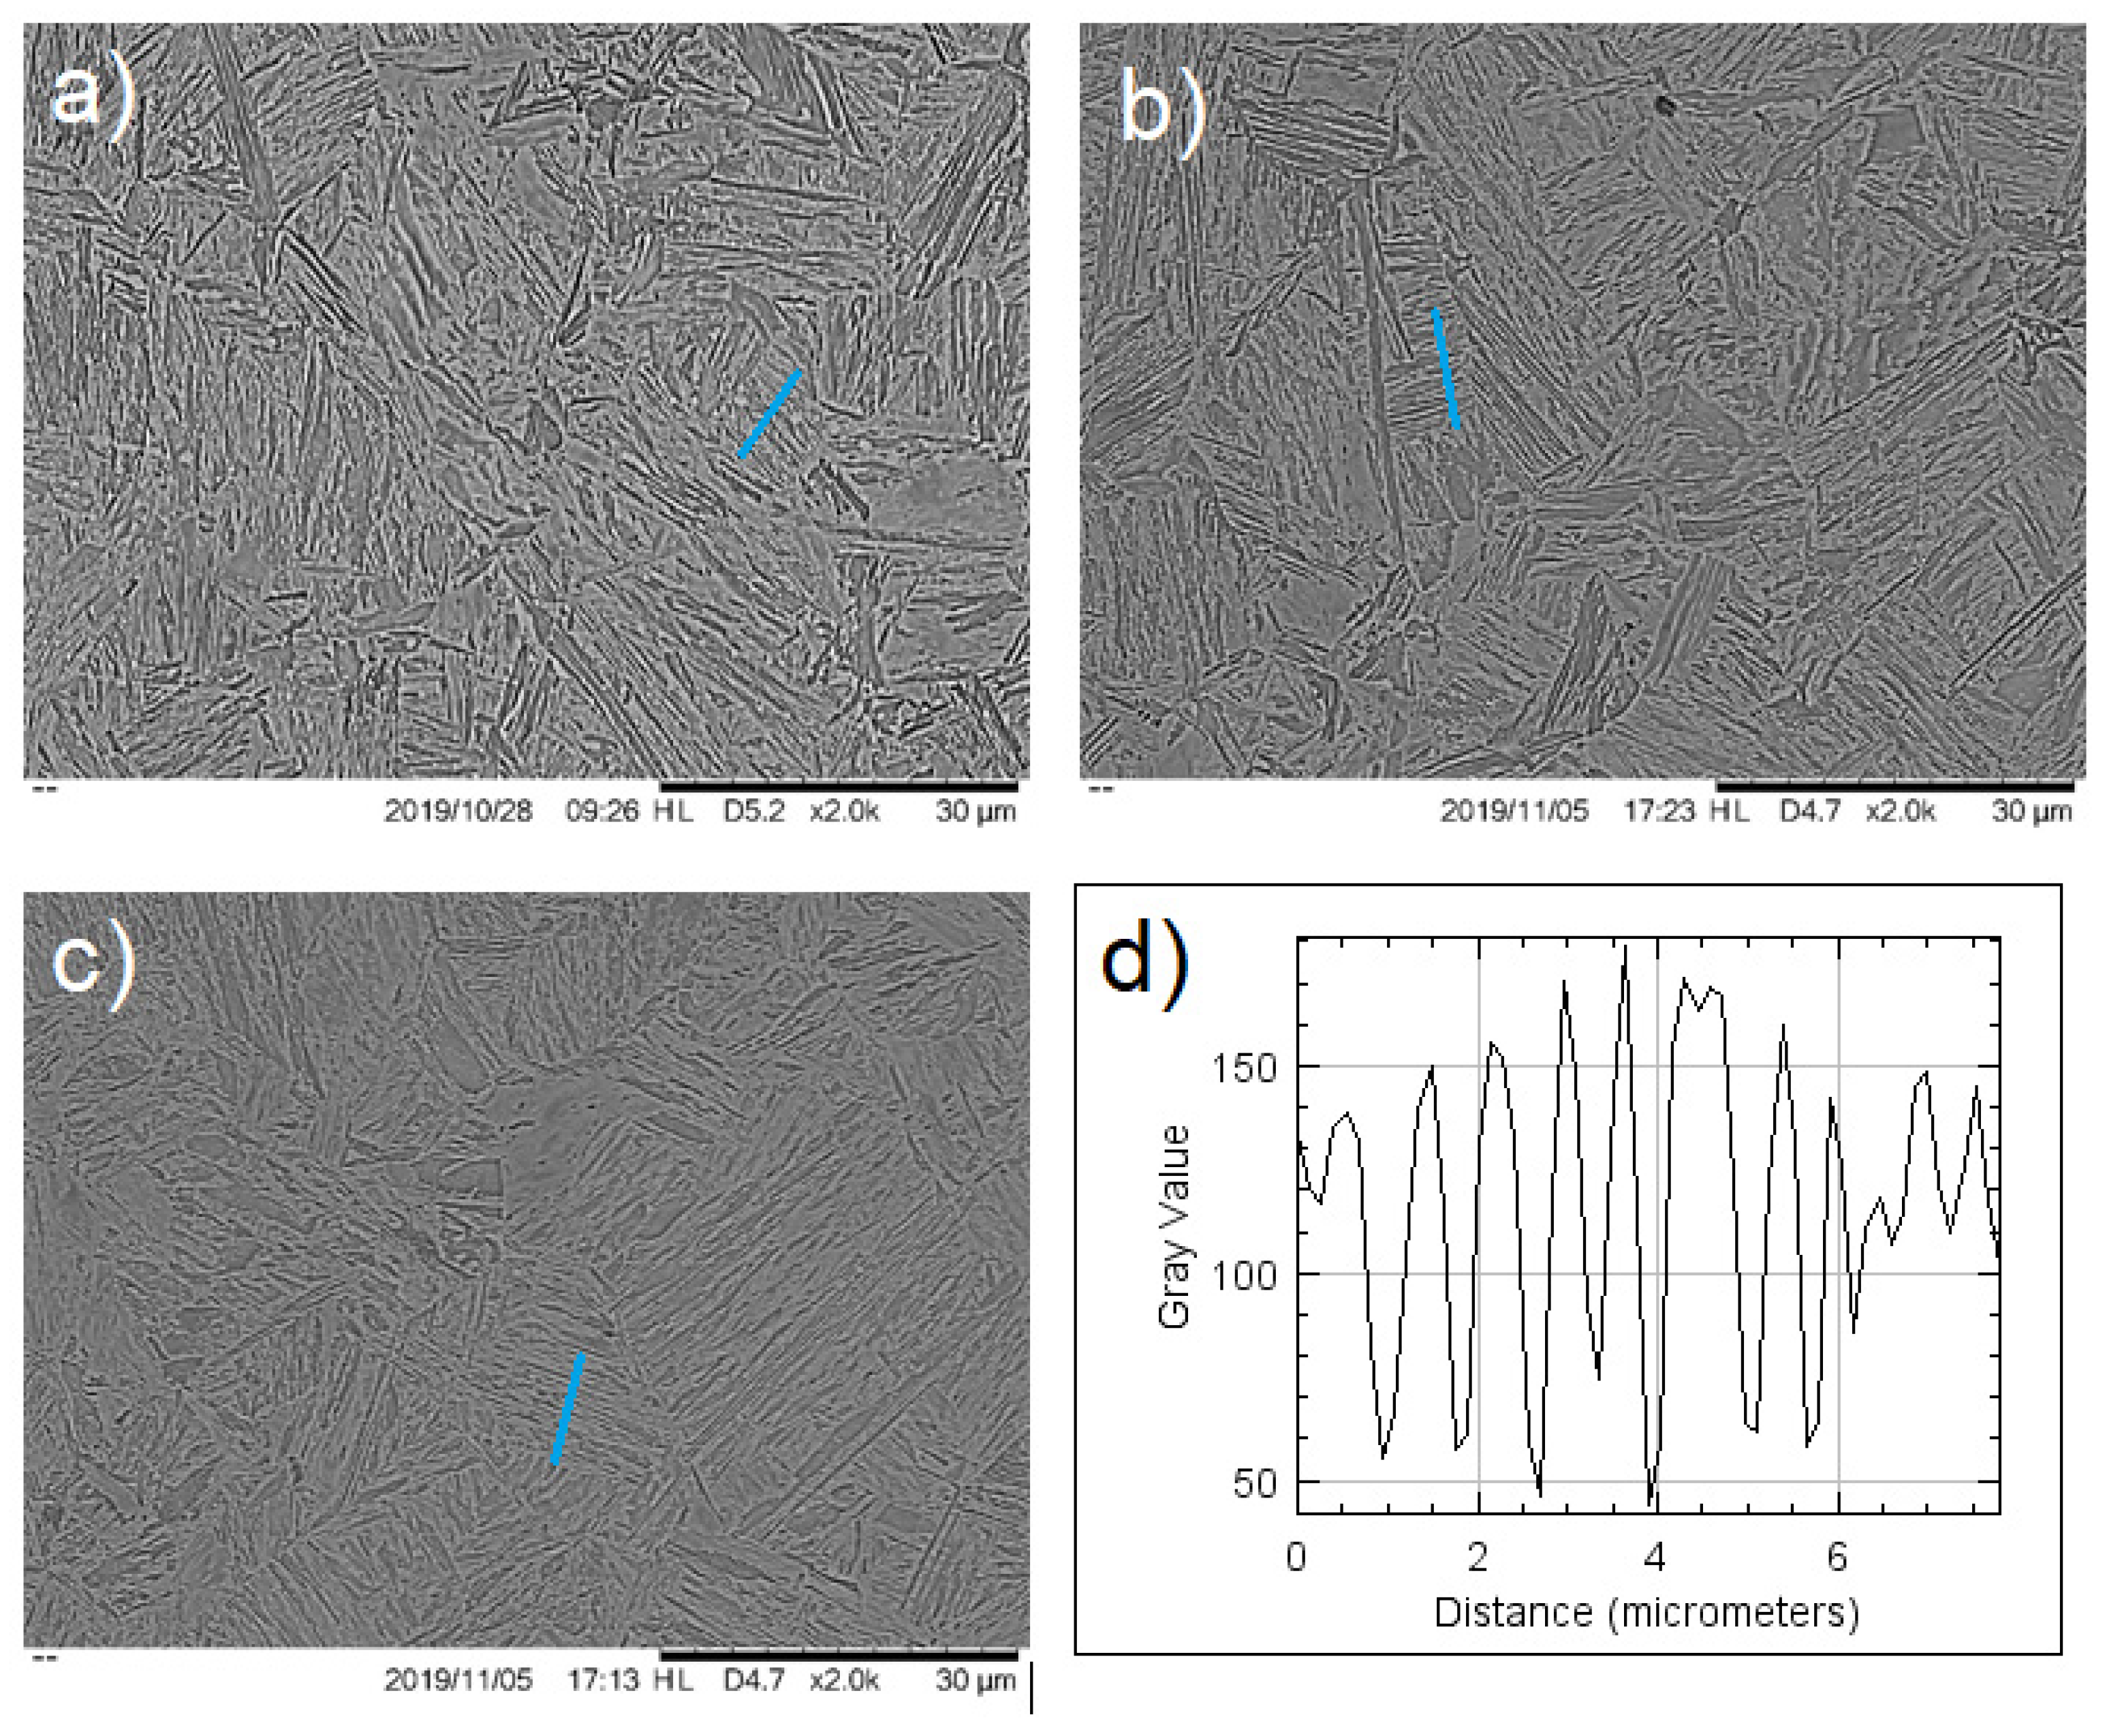
Comparison of the martensite–bainite microstructure at the upper zone of the deformed bar (
Figure 4) showed a clear difference in the previous austenite grain size and lamellar spacing: the zone in between the center and close to the surface (
Figure 4b) showed smaller PAGS and smaller lamellar distancing, explaining the higher values in hardness.
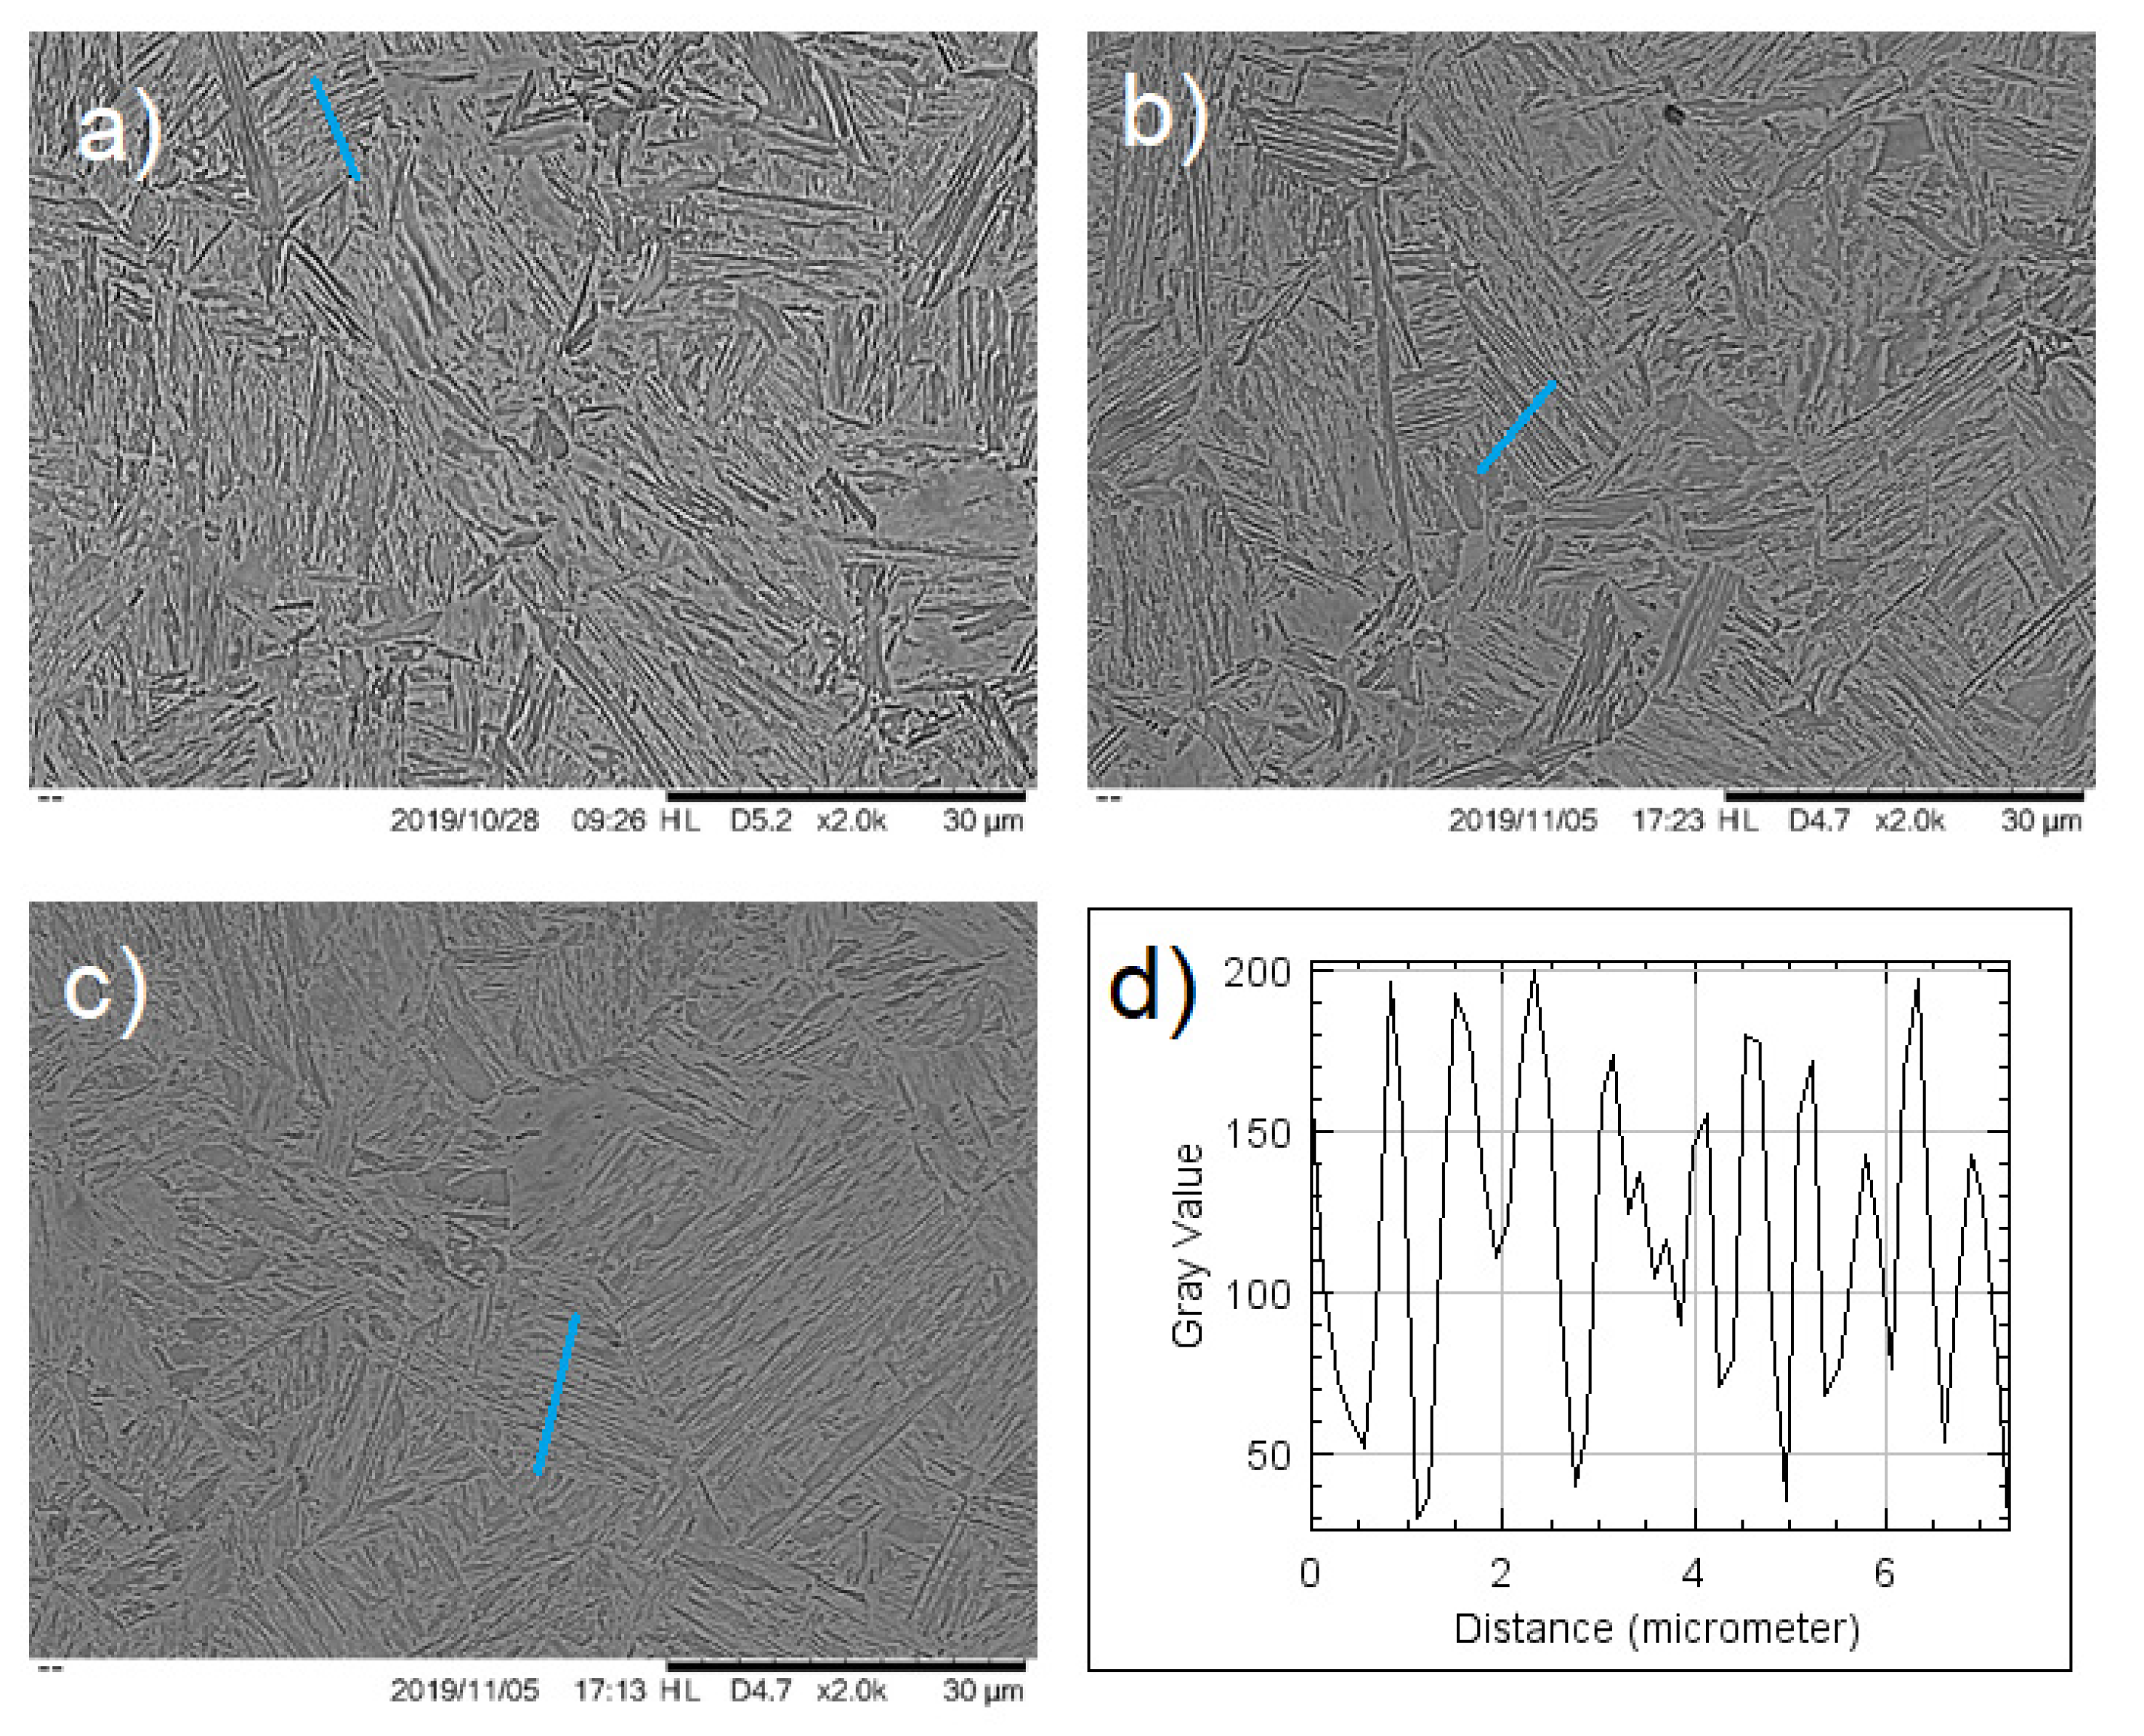
On the other hand, at the middle zone from top to bottom of the bar, the microstructures at the center (
Figure 5a) and between the center and the surface (
Figure 5b) were very similar and clearly different from the zone near the surface (
Figure 5c), just as expected from the finite element simulation.
The lamellar spacing indicated in
Figure 6, as a function of the distance from the surface of the hot deformed bar, showed a higher difference for the middle zone where, due to the larger difference in the strain and cooling rate, the spacing was expected to increase. However,
Figure 3 shows that the variation in hardness was larger in the upper zone, which means that lamellar spacing is not the only factor to determine the mechanical properties and that PAGS is also important [
12]. It is also important that the 95% confidence interval at the center of the bar was large for both zones, as this is a zone where the cooling rate is lower and the effect of strain in lamellar spacing is stronger.
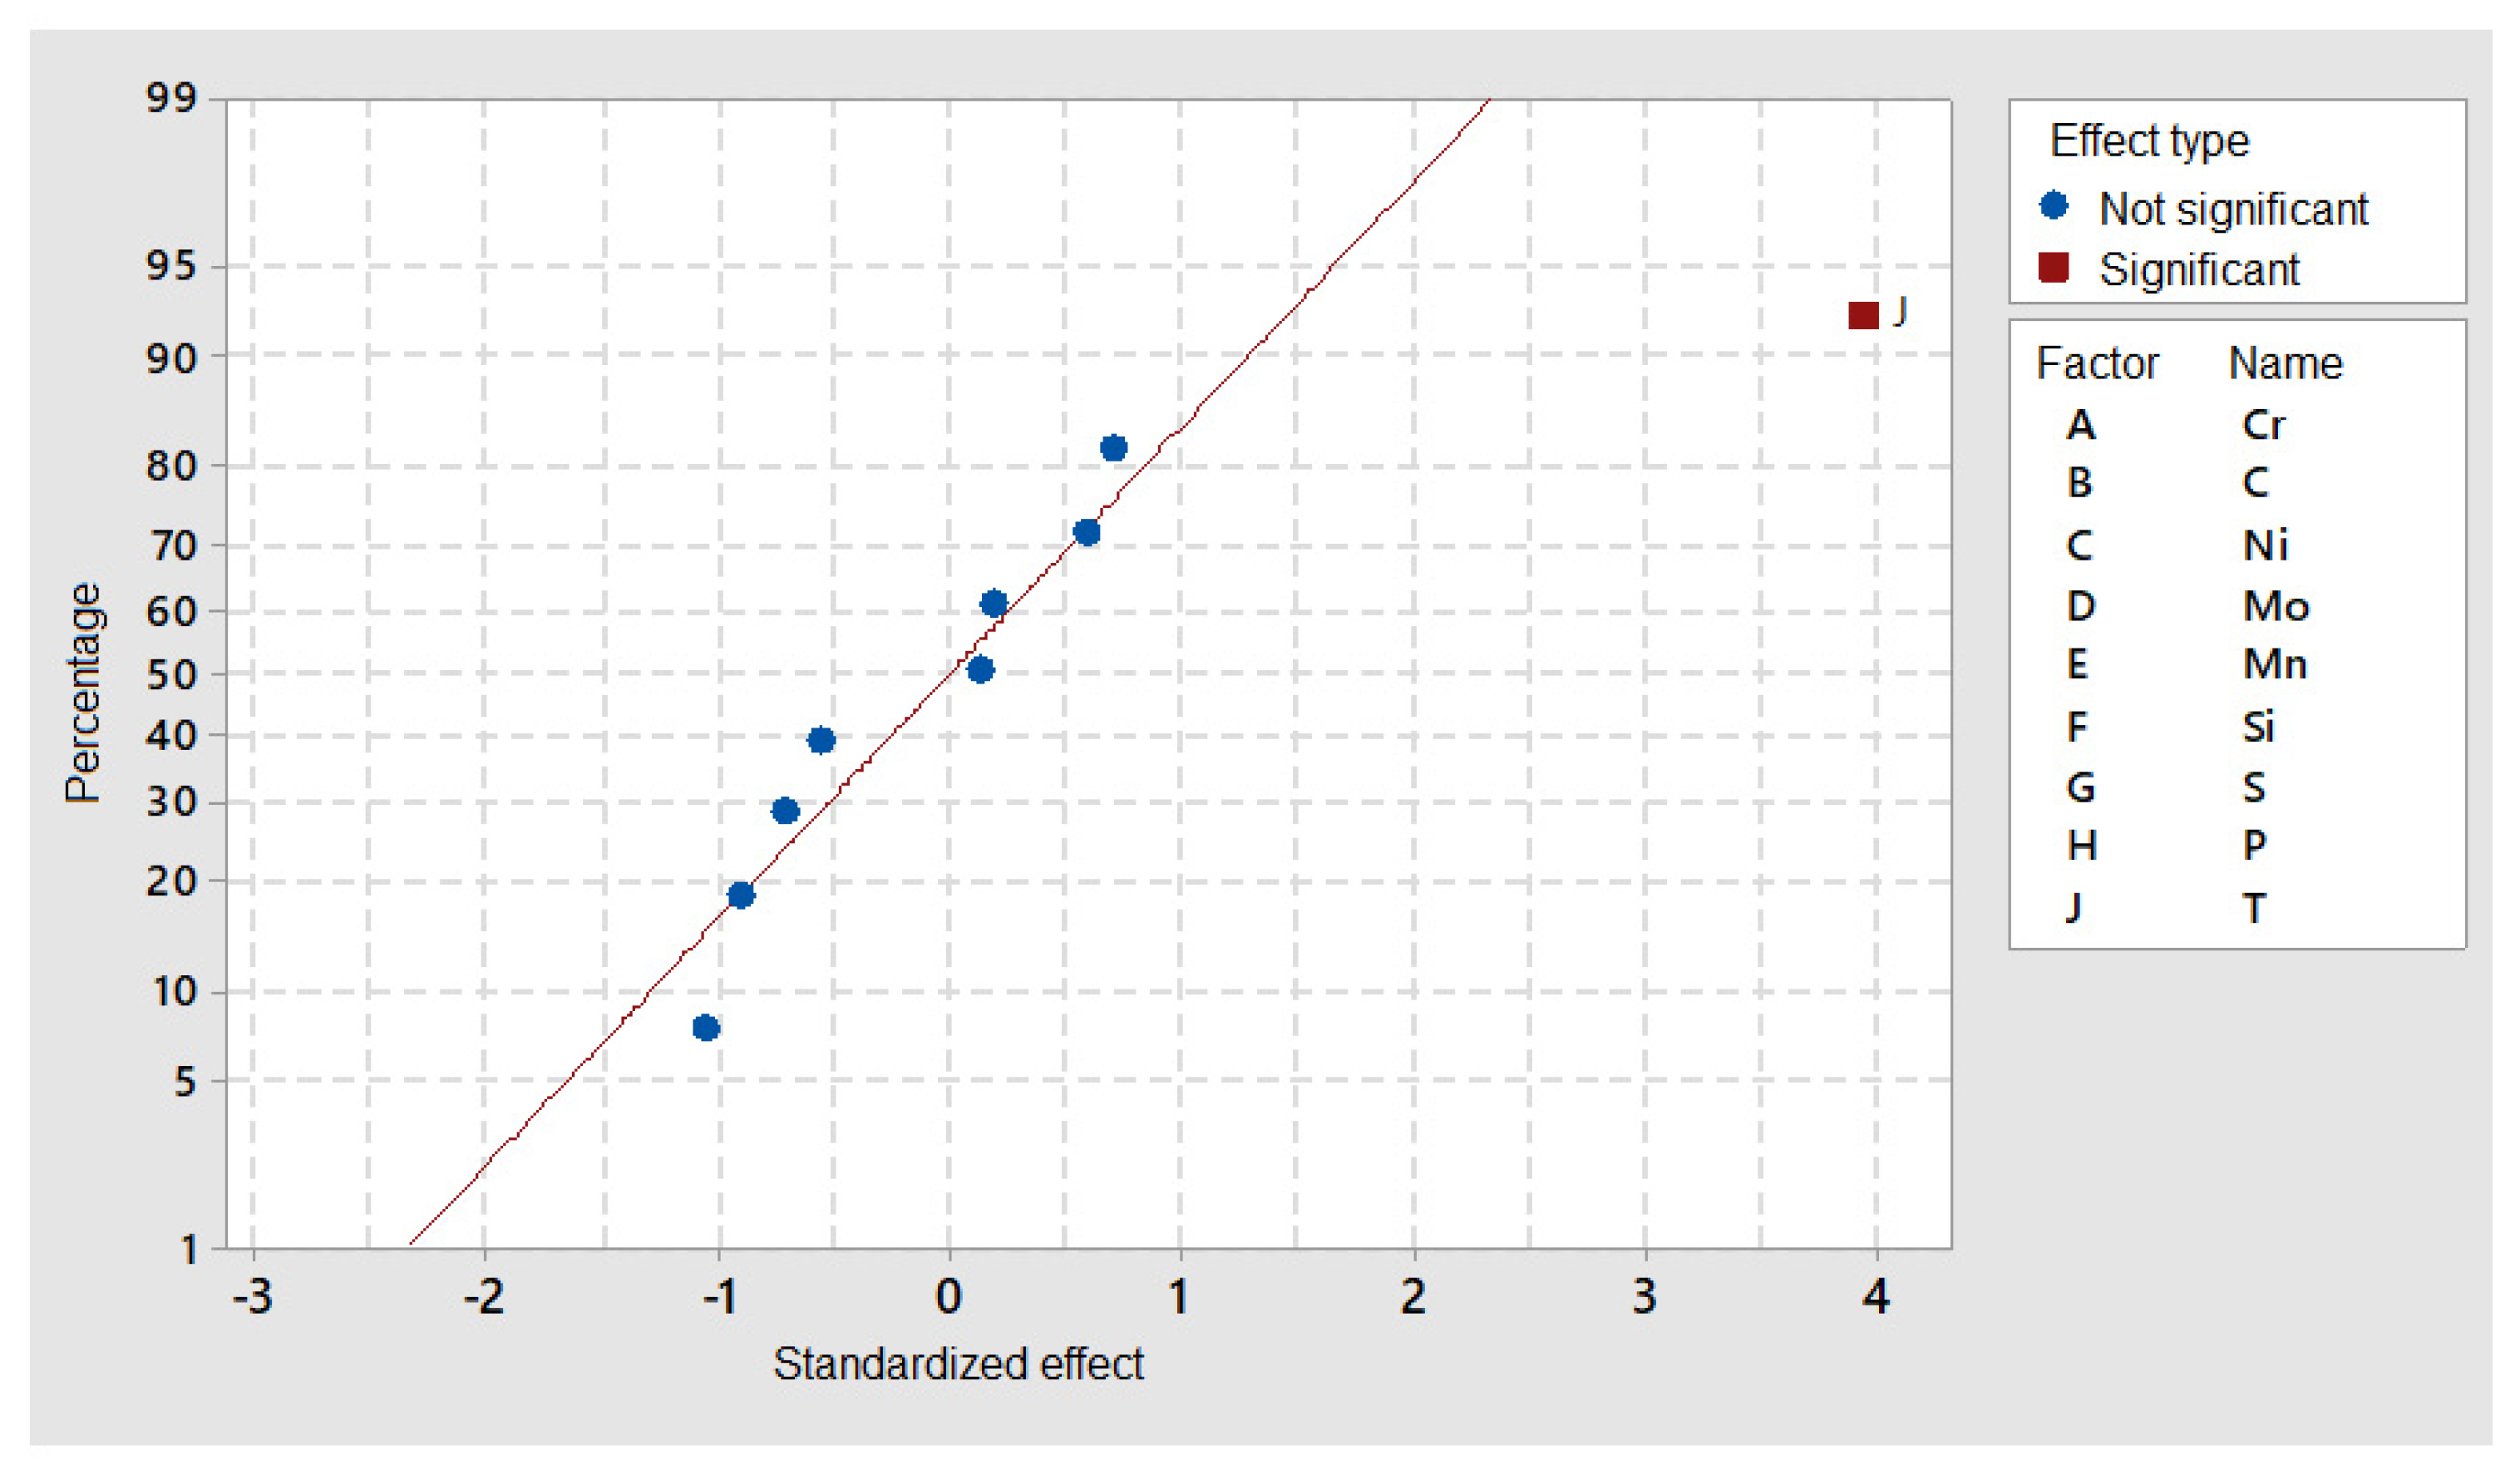
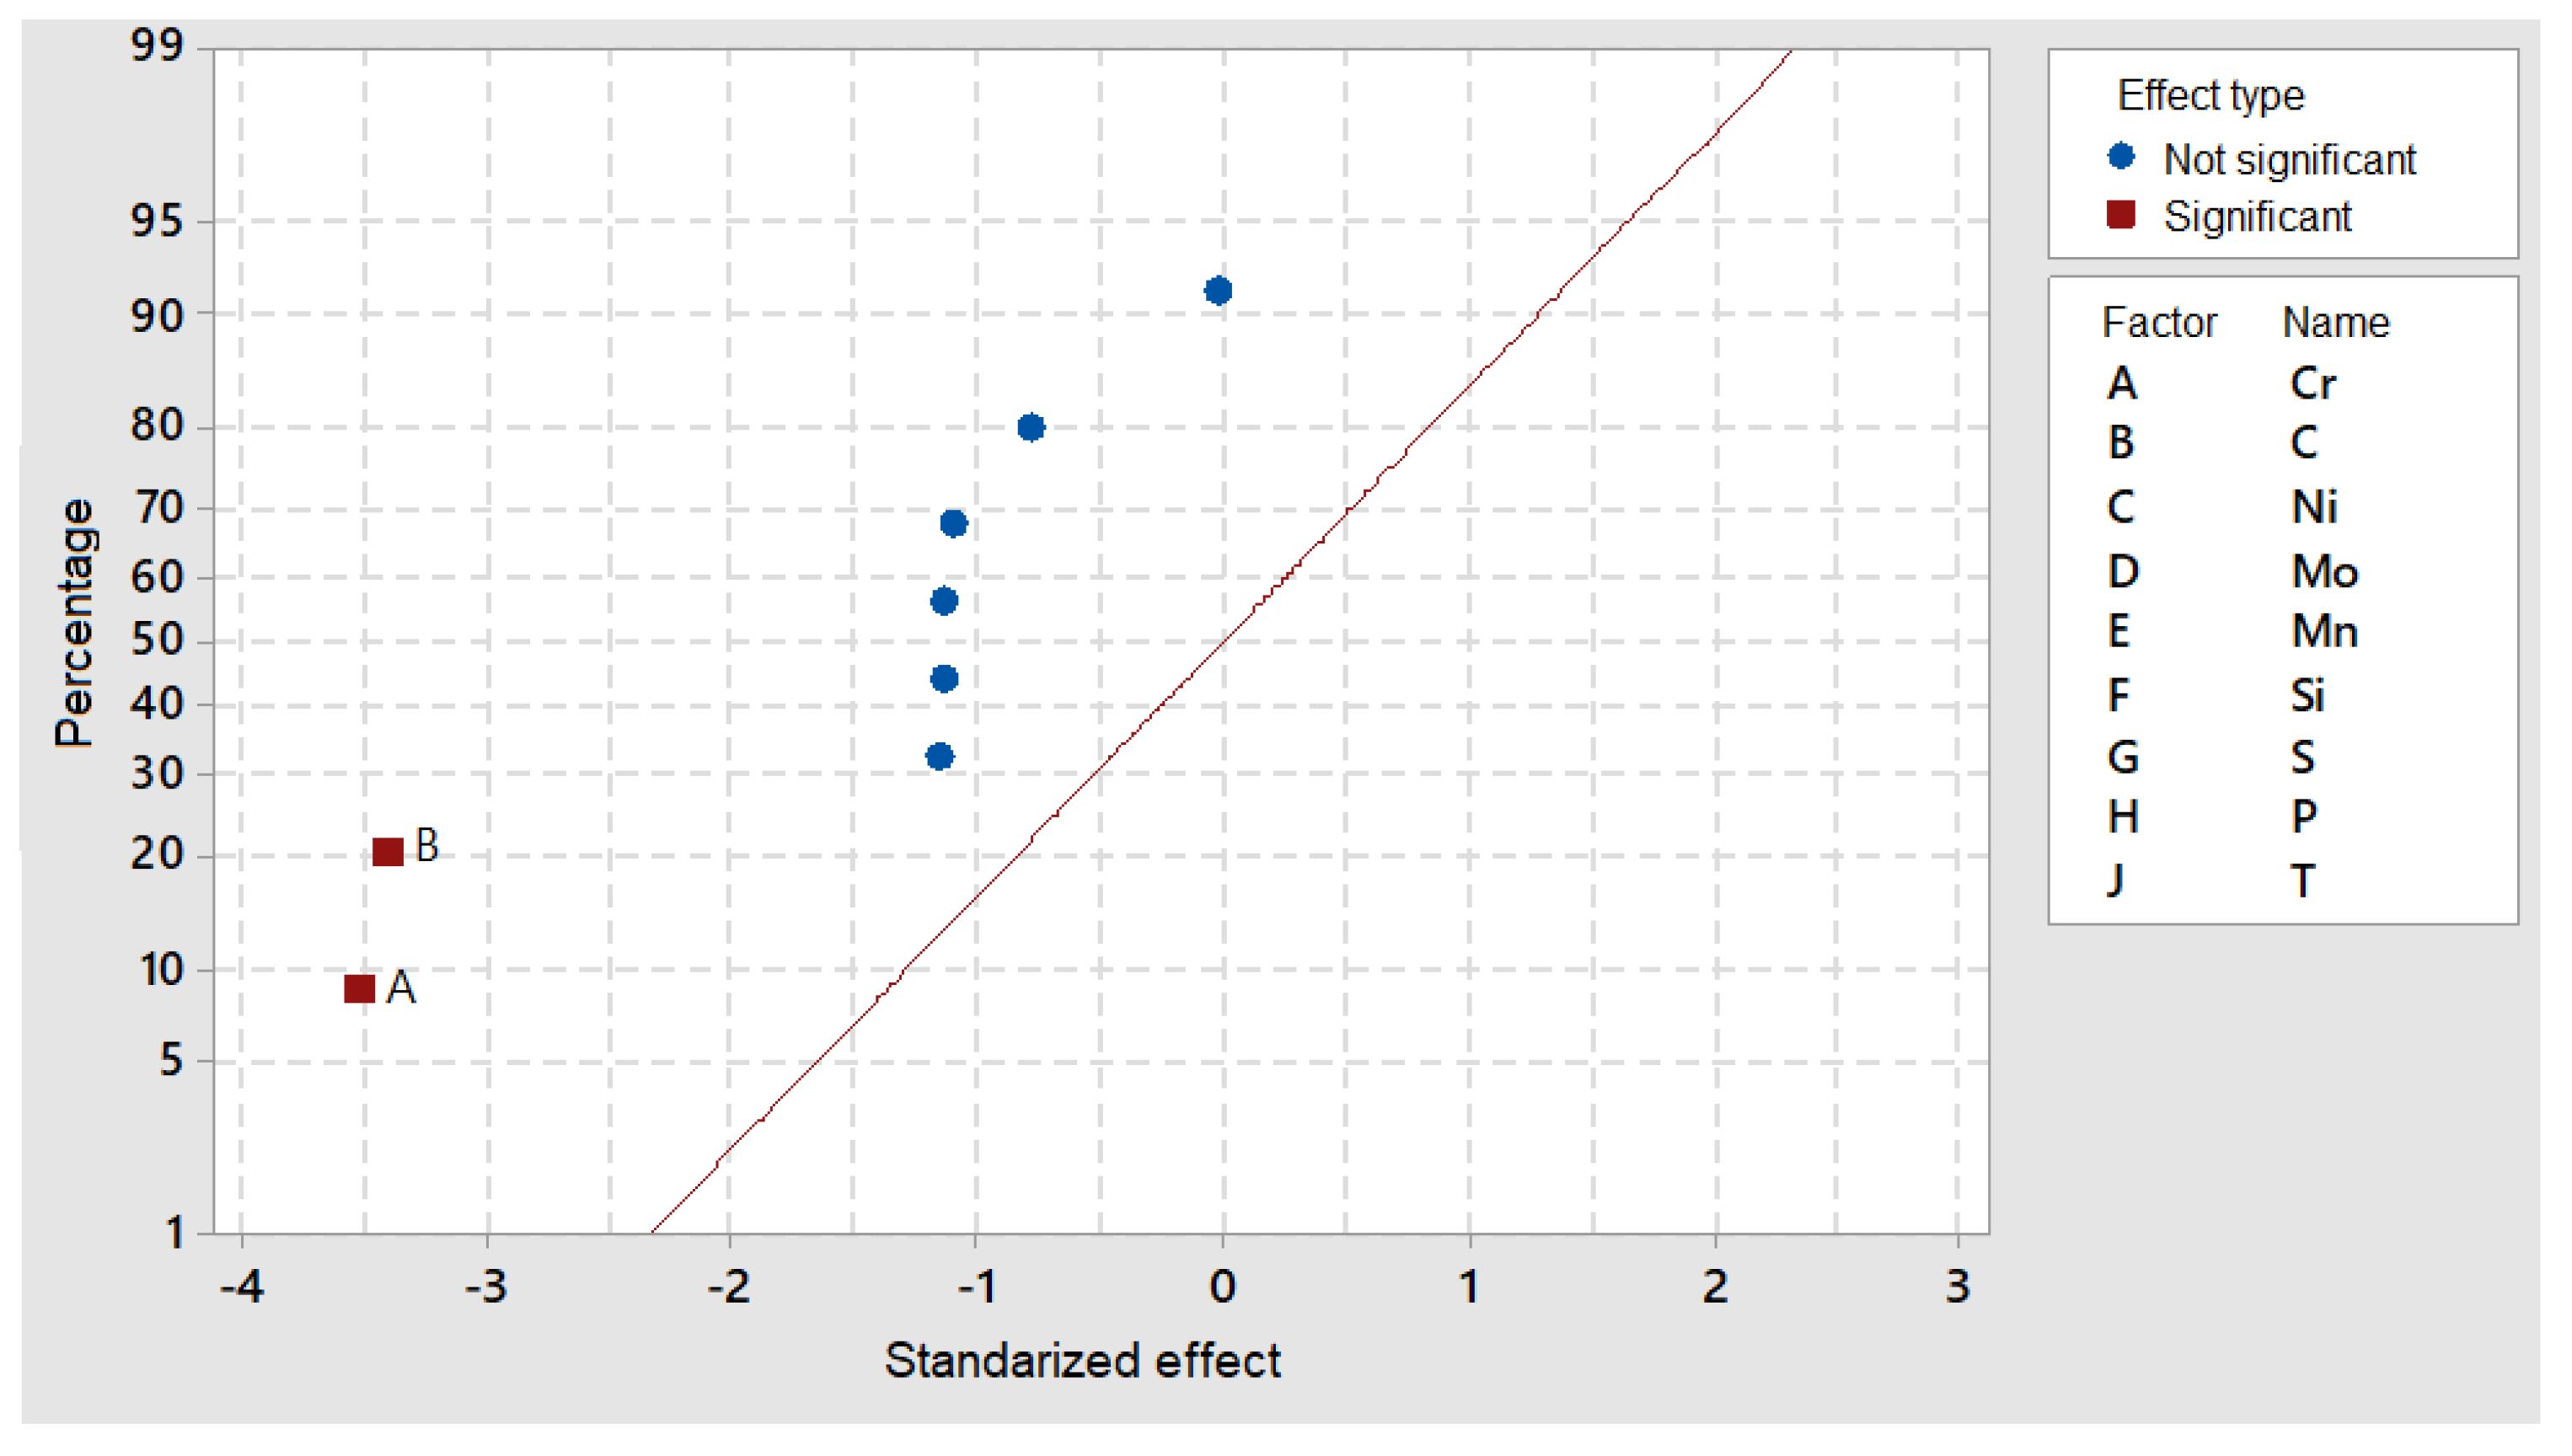
DOE simulations in Thermocalc showed that M
7C
3 precipitates are clearly dependent on temperature (J factor in
Figure 7) and that the alloying elements’ content was close to the standardized distribution behavior.
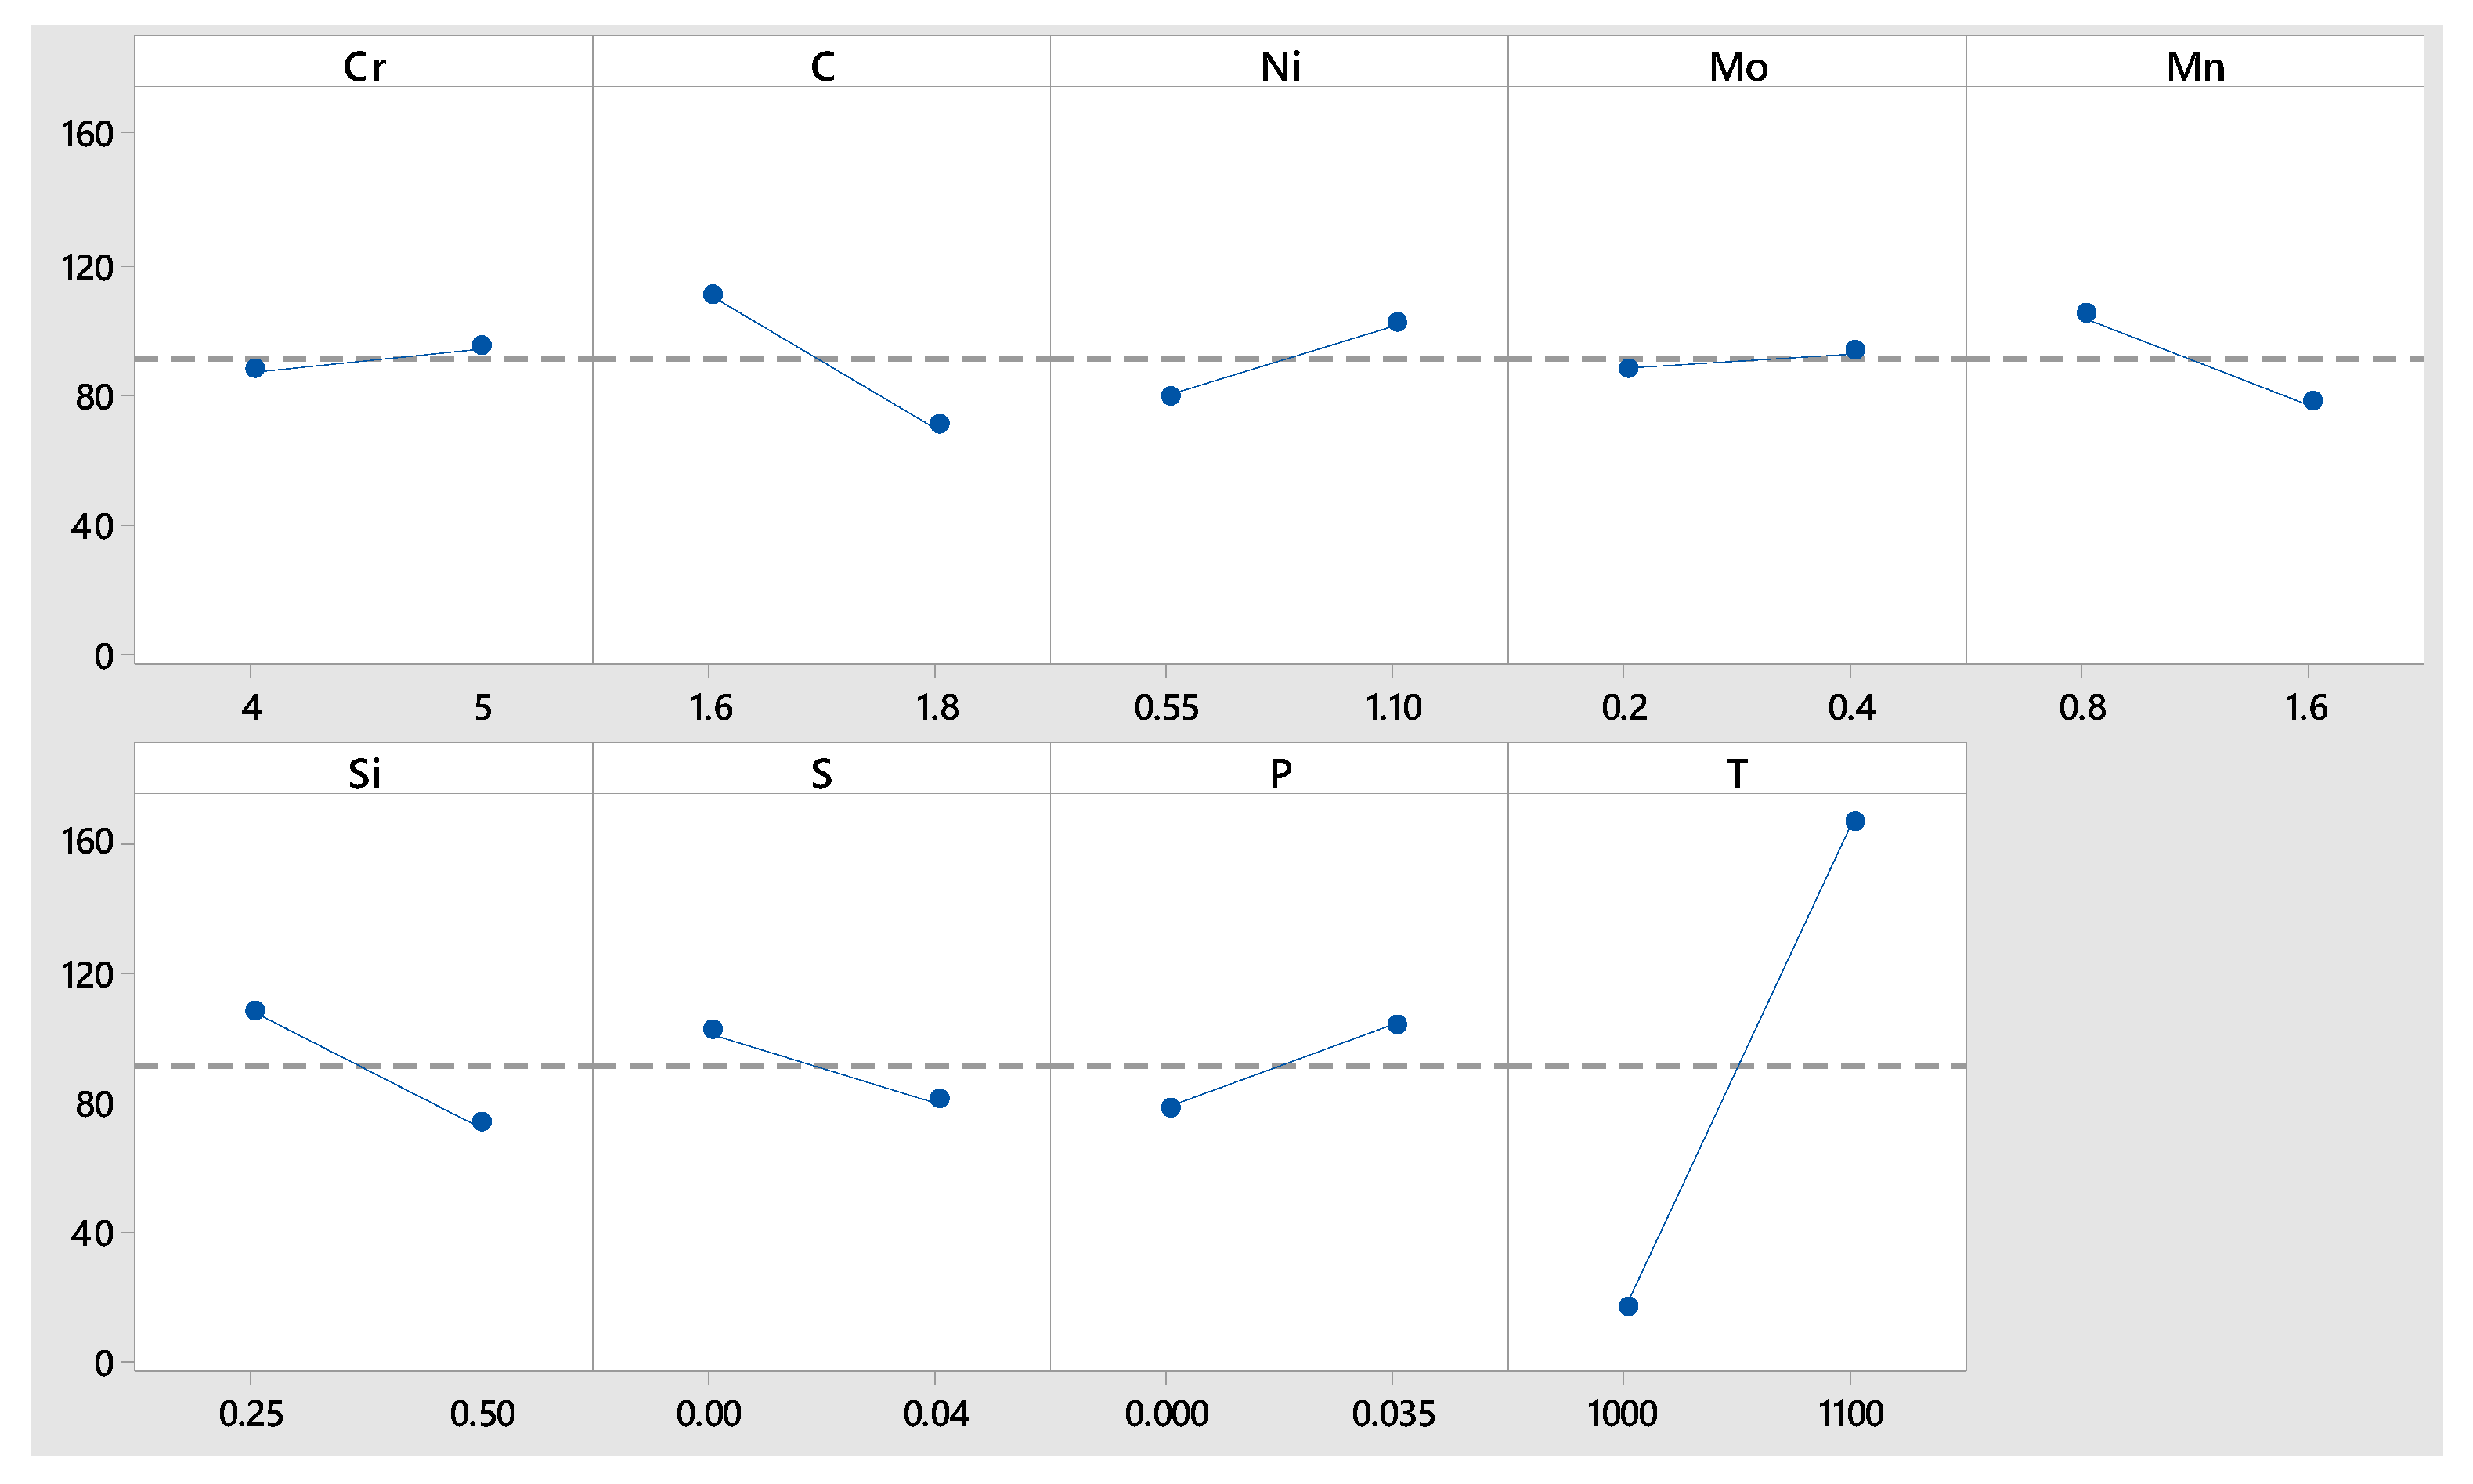
Nevertheless, if precipitate size is considered (
Figure 8), C and Si seemed to have a considerable effect, while Cr and Mo (elements forming the precipitate) did not show a significant effect.
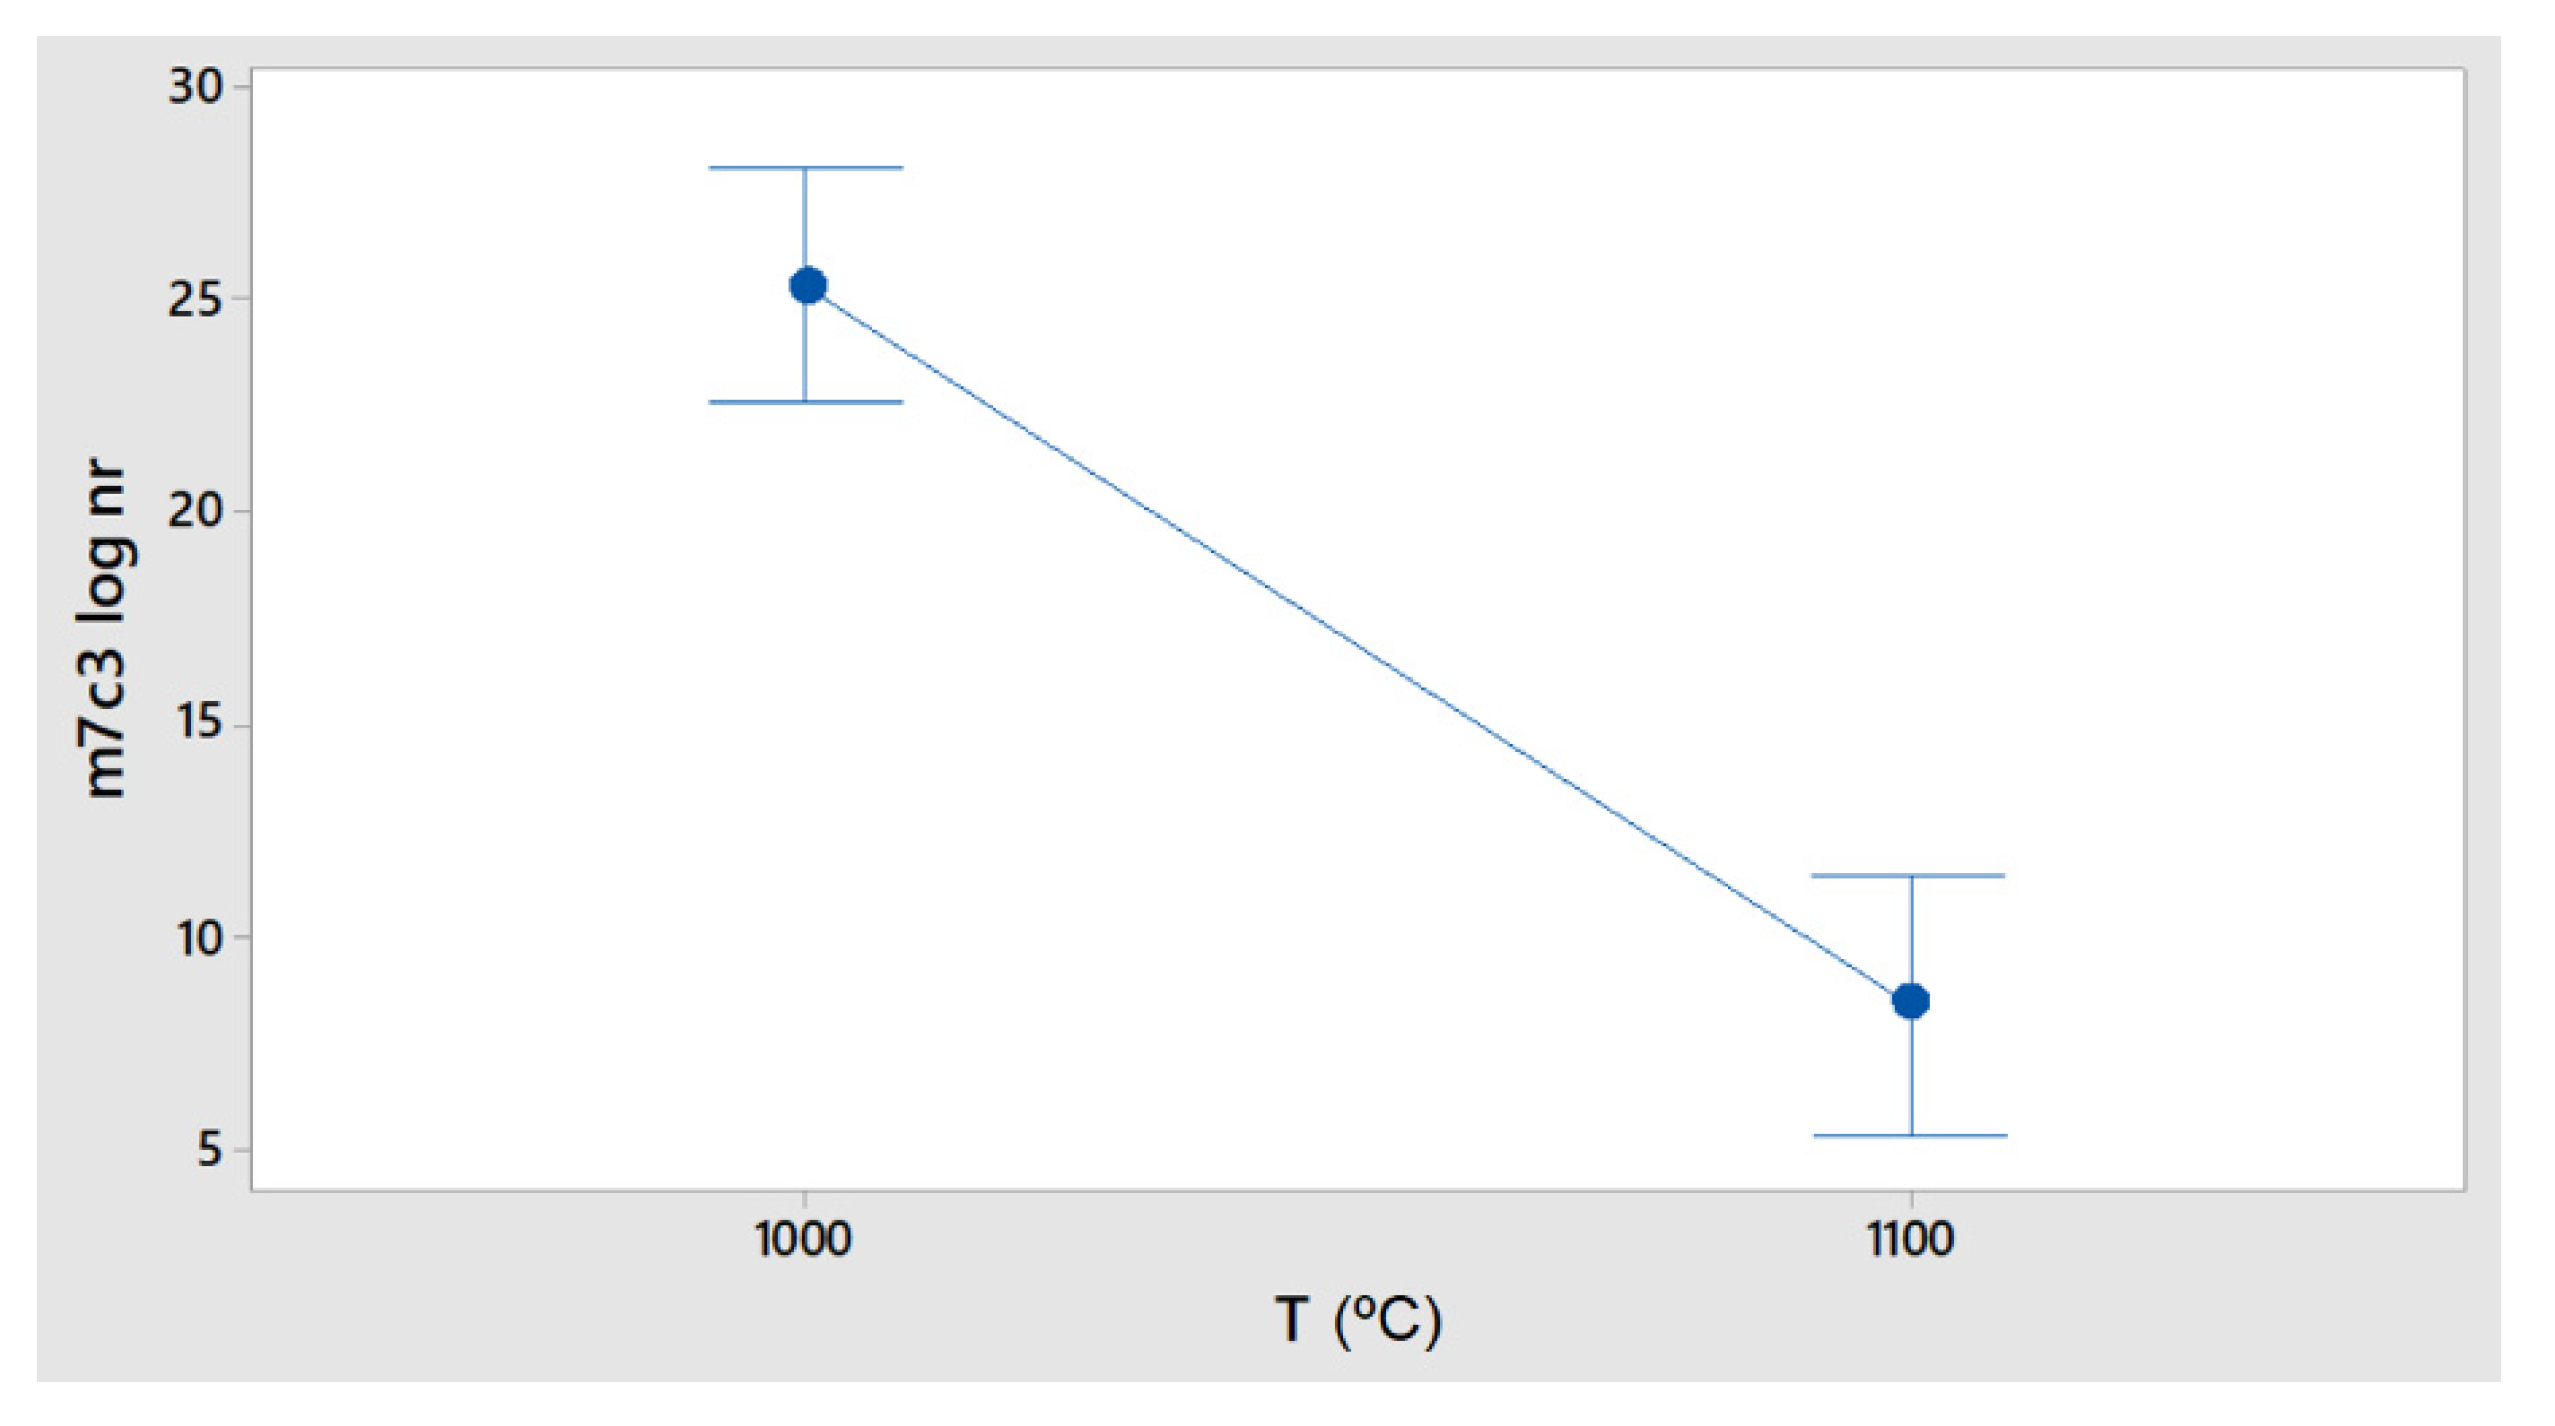
As expected, the nucleation rate for this precipitate was extremely low at 1100 °C and higher as the temperature decreased (
Figure 9). This temperature interval, in which static and dynamic recrystallization phenomena may occur during hot forging, is greatly modified by nanometer-sized precipitation, which prevents grain growth.
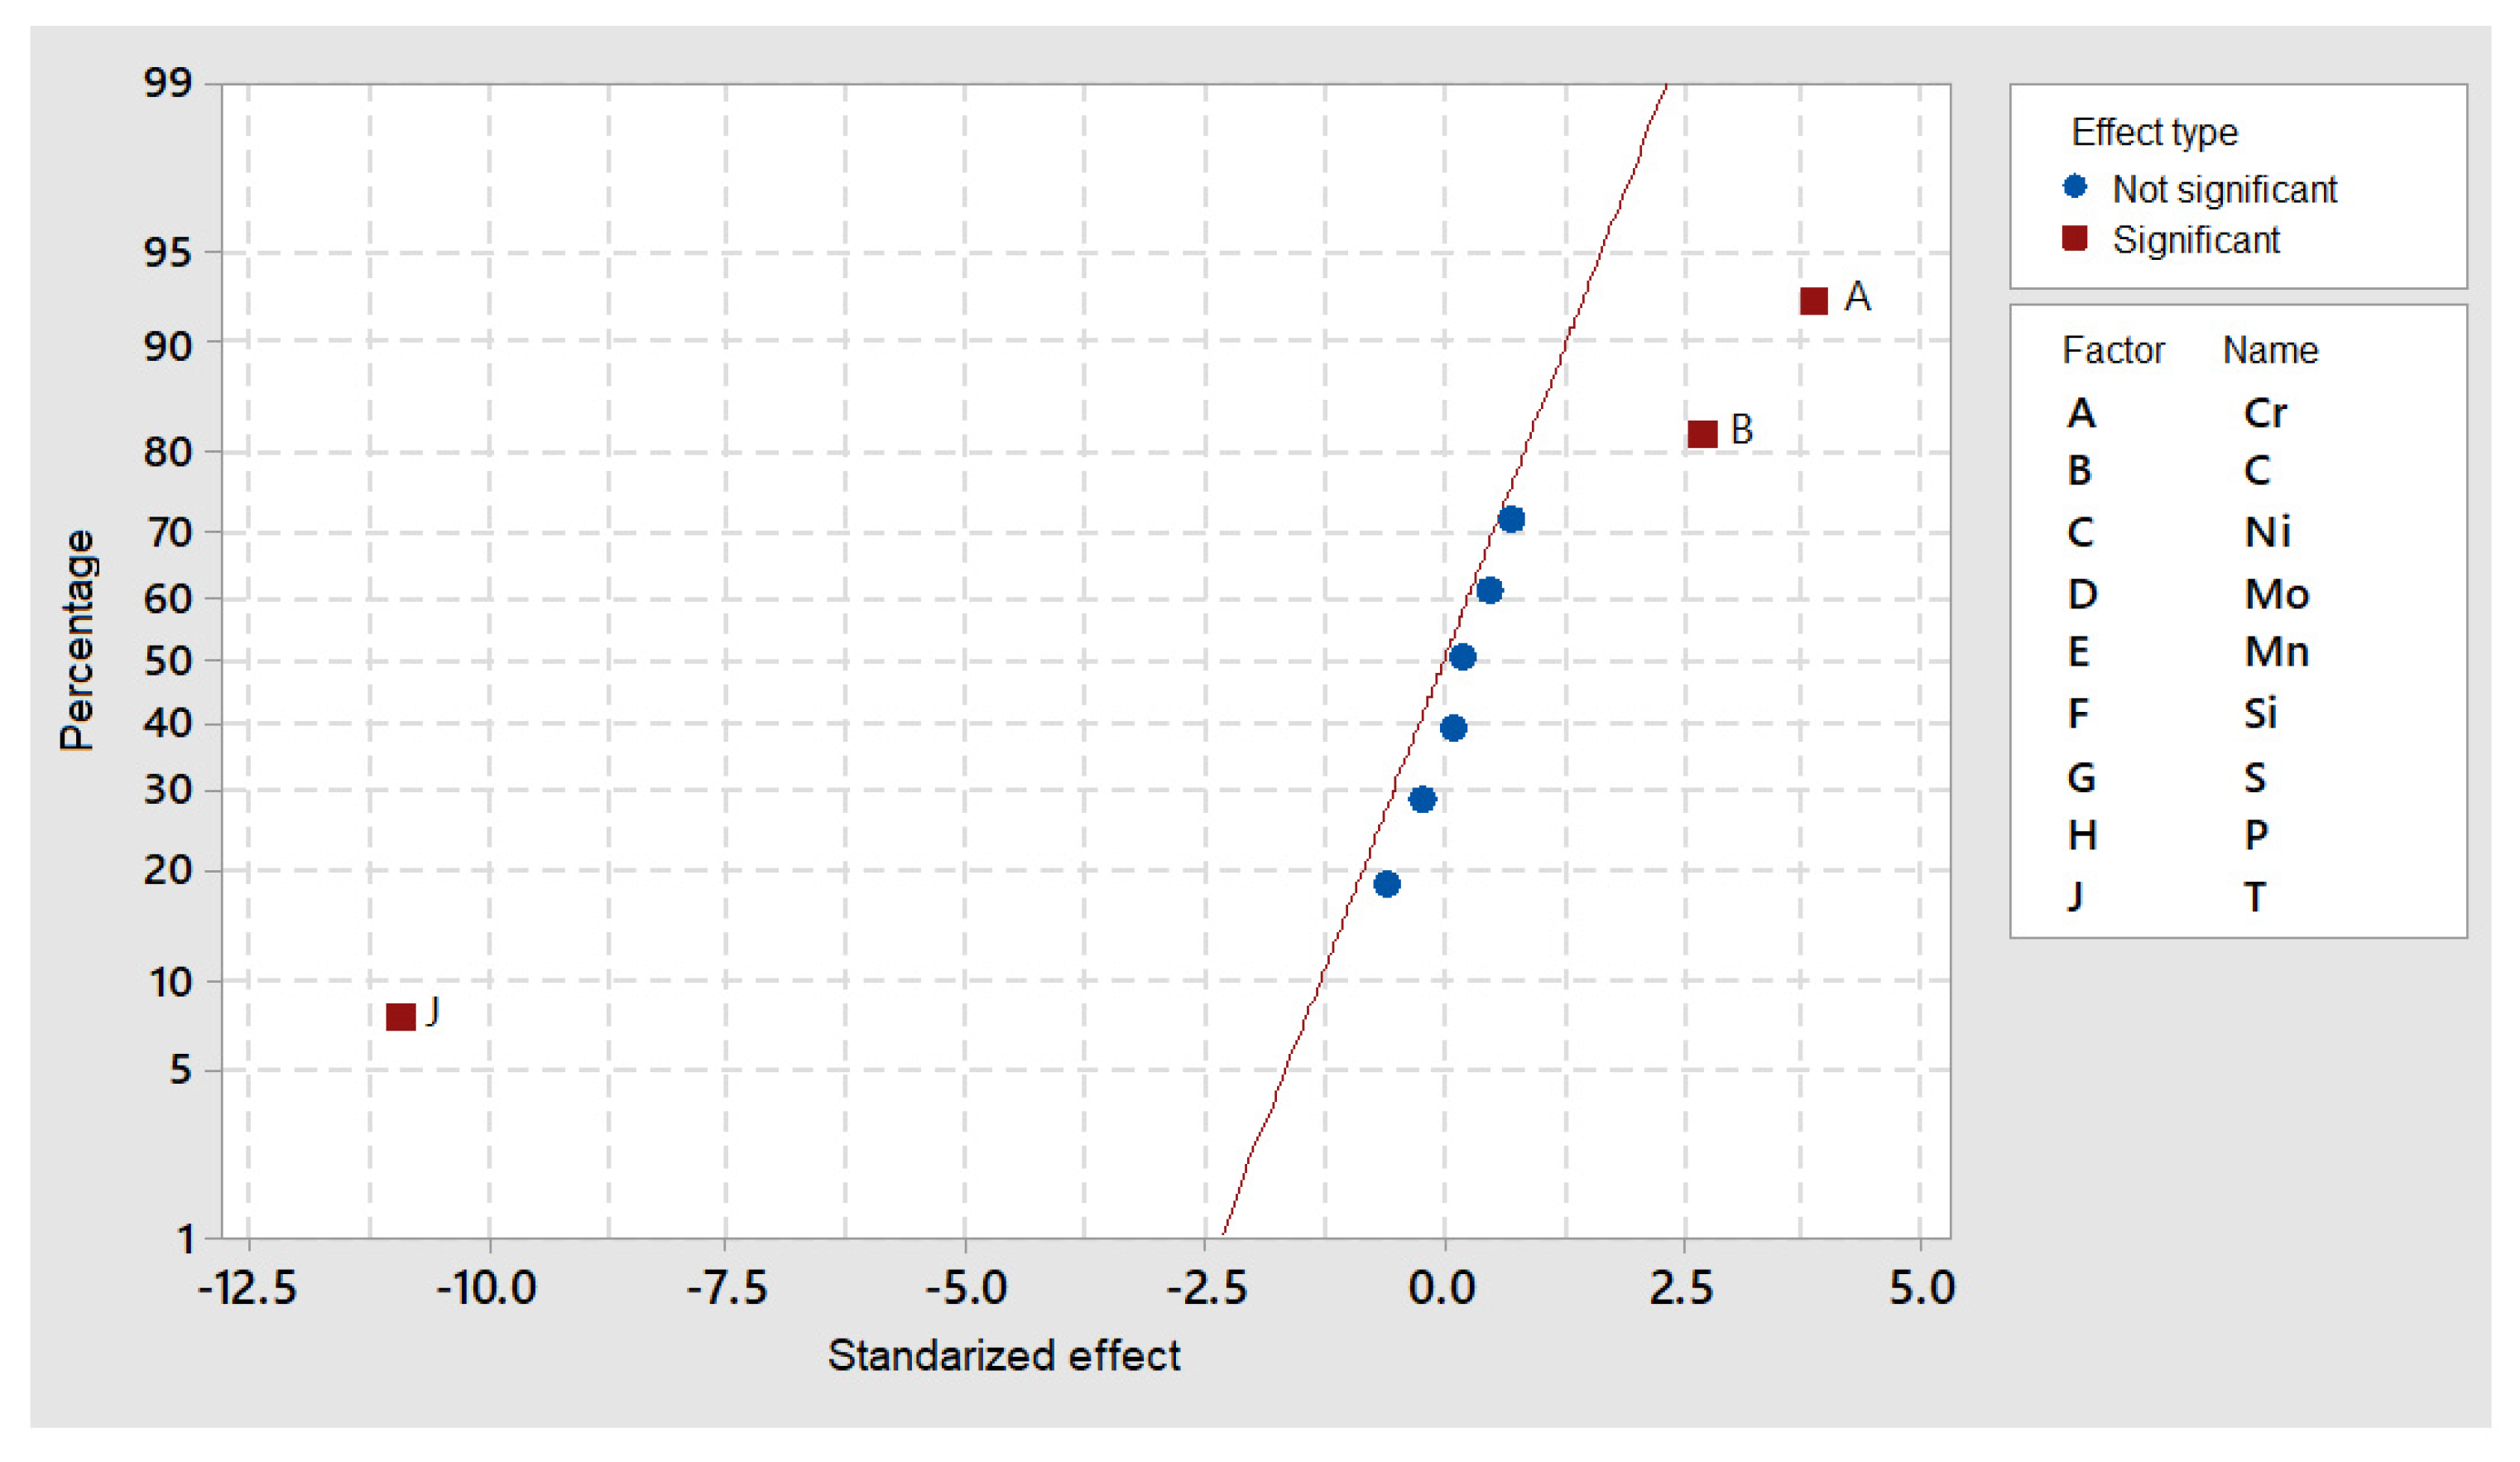
Moreover,
Figure 10 indicates that the nucleation rate is modified not only by temperature, but also by Cr and C content, i.e., the distribution of these two elements played a major role in the nucleation rate as the temperature decreased.
In the case of M
23C
6 precipitates, one of the most interesting results was that the maximum nucleation rate, which was null at 1100 °C, occurred in a shorter time than 1000 s, indicating this transient phase formed during cooling for very short periods of time.
Figure 11 shows that the nucleation rate was significantly modified by the Cr and C content and that other alloying elements were also separated from the standardized distribution line.
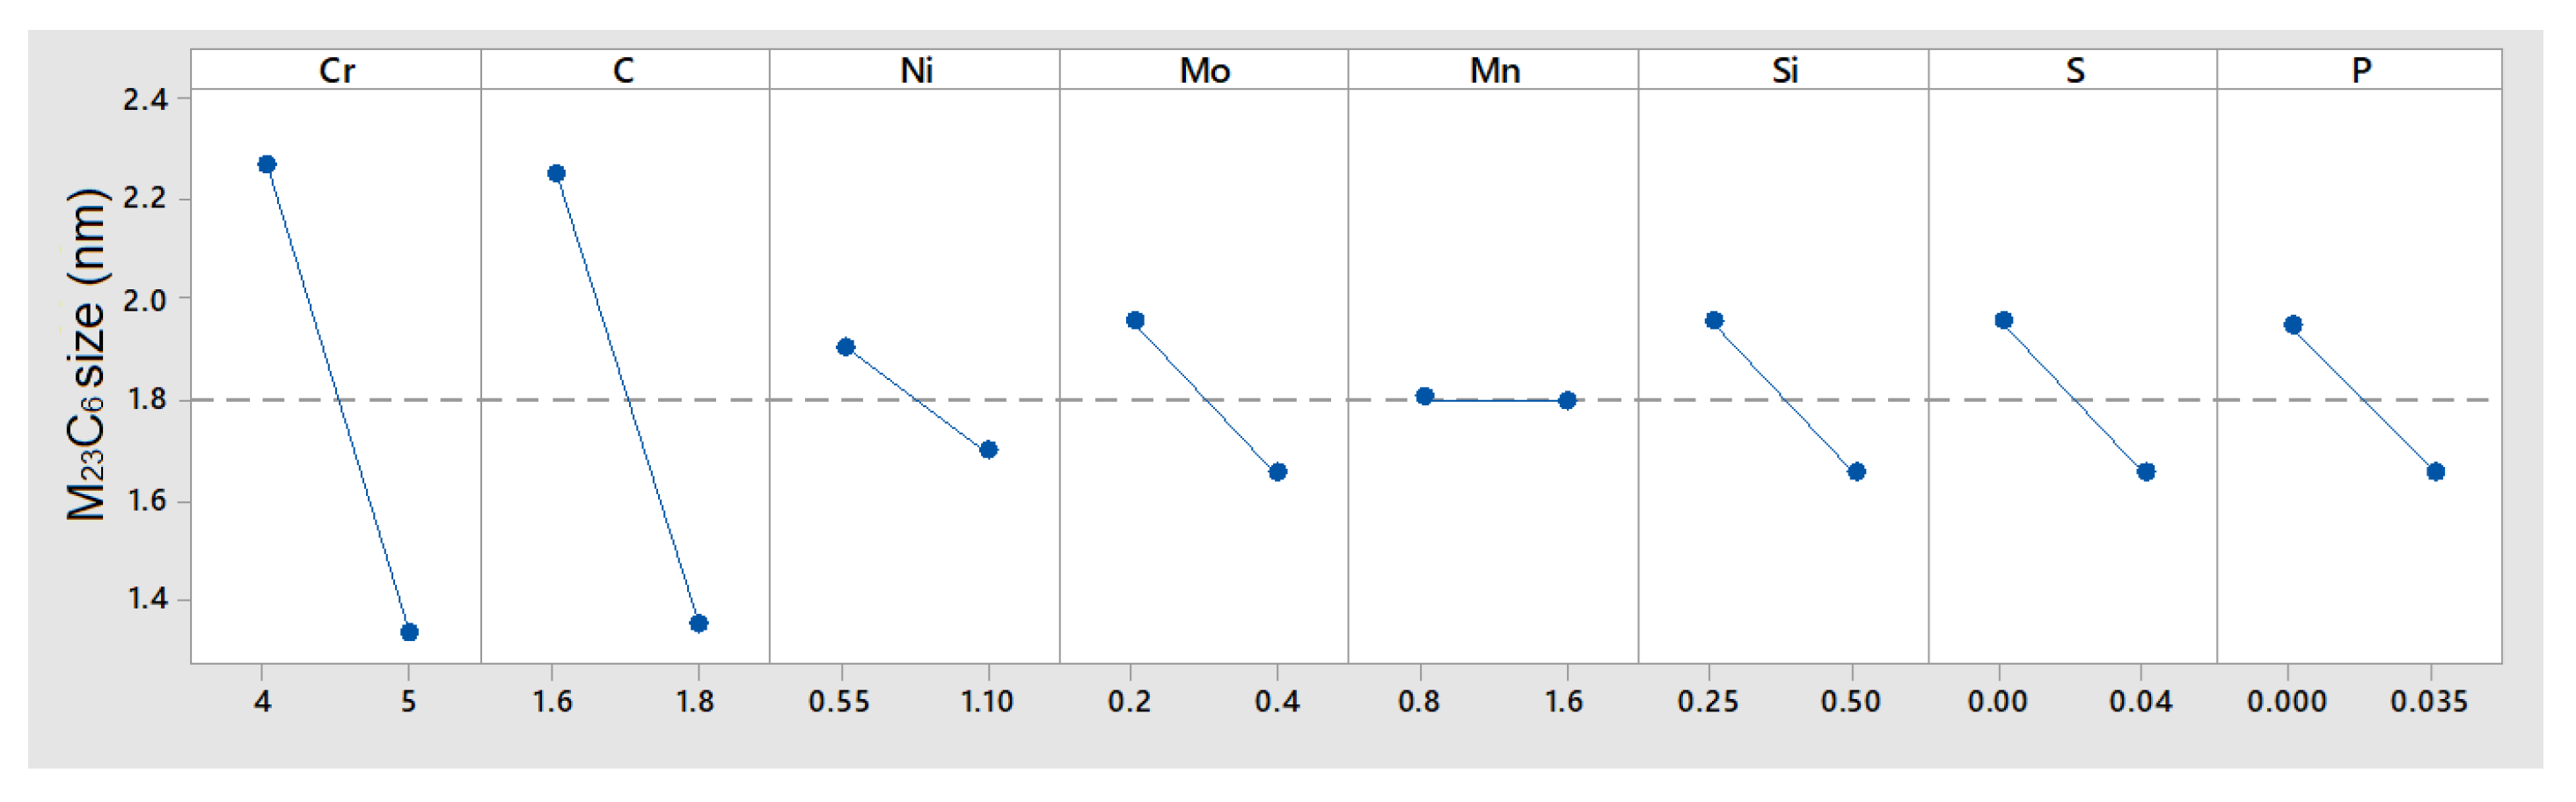
The maximum percentages of precipitates, corresponding to the maximum nucleation time, as indicated in
Figure 12, showed no interaction with Mn content and but the strong effects of Cr, C and the other five elements.
In the case of MnS precipitates (
Figure 13), the simulation showed that these only appeared at 1100 °C, while at 1000 °C, their size was negligible, which, during cooling, may directly affect the formation of M
23C
6 particles, as they are affected by S content.
The precipitation models [
19,
20] indicated that, at 1100 °C, the hot forging deformation produced dynamic recrystallization. As
Figure 2 indicates, the upper zone of the steel bar suffered a larger strain difference from zero to ~8% which, combined with a more pronounced quenching effect (the surface in direct contact with the quenching fluid), resulted in more pronounced differences in the hardness curve (
Figure 3). On the other hand, the curve for the middle section had smaller differences, as quenching was less effective and the strain gradient was only ε = 4%, though this last curve in
Figure 3 shows the highest values: deformations as high as 12% promoted dynamic recrystallization (XRD) and a smaller grain size, as shown by the PAGS in
Figure 5c. Experimental tests of hot-formed and cold-rolled samples of this steel [
21] indicated that the amount of deformation influenced the diffusivity of carbon during surface cementation: a slower diffusivity of alloying elements is to be expected when strain is increased.
Another phenomenon to be considered is the chemical segregation of the alloying elements during the solidification of the steel. If the distribution coefficient (
k = Cs/Cl) is larger than 1 (
k > 1), individual grains will have large amounts of the element at the core of the grain and small amounts at the grain boundary. If, on the other hand,
k < 1, a small concentration of the element will be found at the center and an elevated amount at the boundary [
22]. Cr and Mo, the precipitate-forming elements, have a
k of −1, while C has a
k of 1. This means that, at high temperature (1100 °C), the alloying elements at the grain boundary zones (Cr and Mo), combined with the larger capacity of C to move throughout the structure due to its size, may result in local concentrations which misrepresent the initial alloying content, i.e., local and very large amounts of Cr and Mo promote precipitation. Another possibility is that the Cr/C ratio at these zones is so high that precipitation is promoted at a localized level. A comparison between the Thermocalc and observed precipitates in 4% Cr steels [
8] indicated that the software underestimated the size of the precipitates and overestimated their volume due to segregation at the grain boundaries.
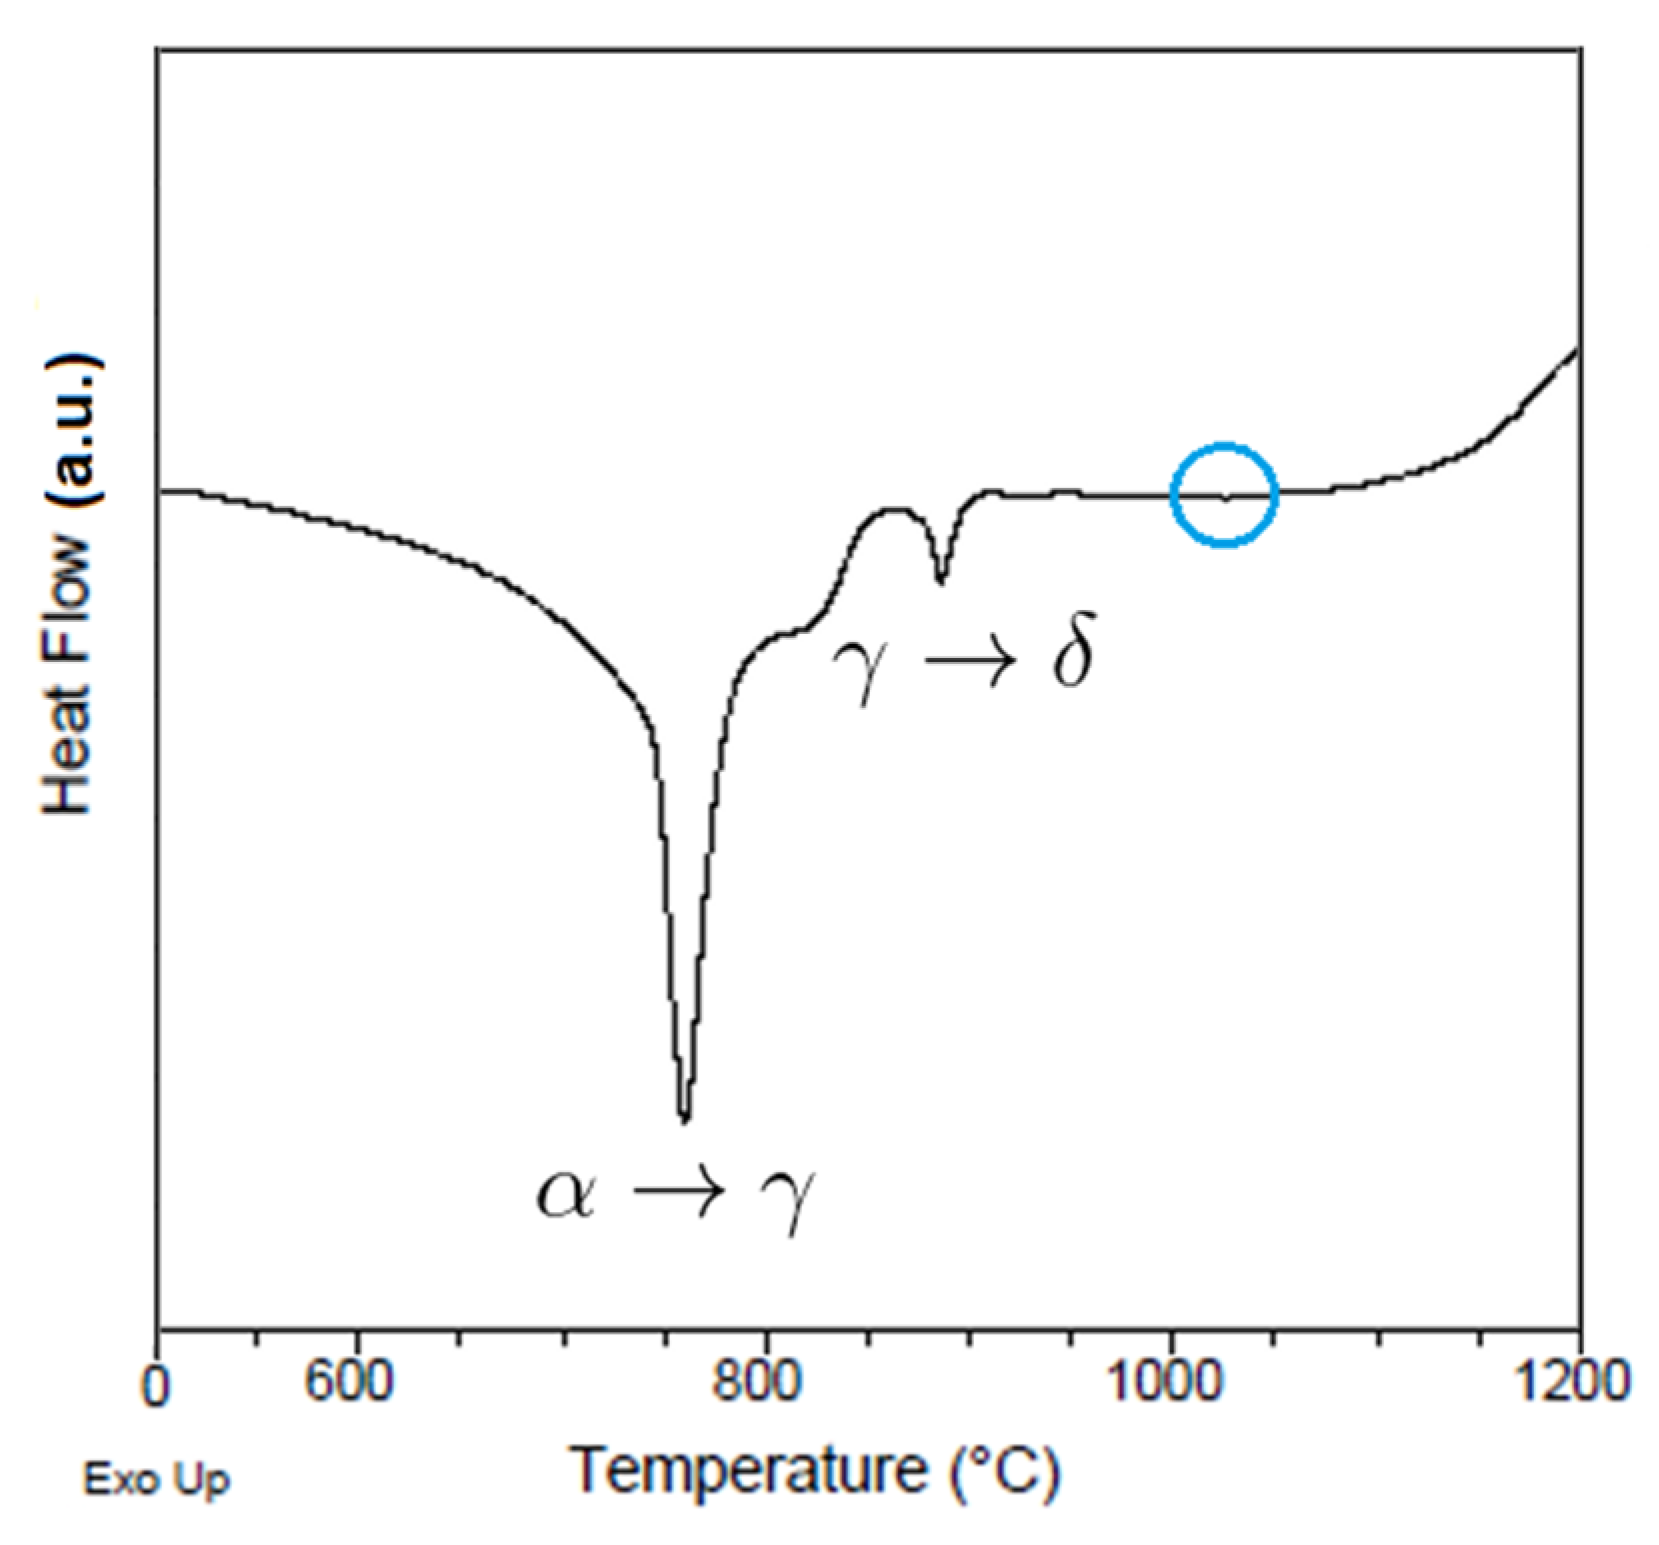
Figure 14 shows the DSC curve for the 8620 steel sample at a heating rate of 20 K/min, indicating evident phase changes at ~740 °C and ~880 °C, which correspond to the alpha–gamma and gamma–delta transformations. However, in the 1000~1100 °C temperature range the curve seems to be flat: a closer inspection reveals a slight depression in the curve, which may be connected to the fast appearance and dissolution of the precipitate phases. The Thermocalc simulation indicated that precipitates such as M
7C
3 were only present and reached their maximum size in short periods of time (100–1000 s). This is consistent with the hot forging manufacturing procedure, with deformation at 1100 °C and cooling in air at a 50~100 °C/min rate.
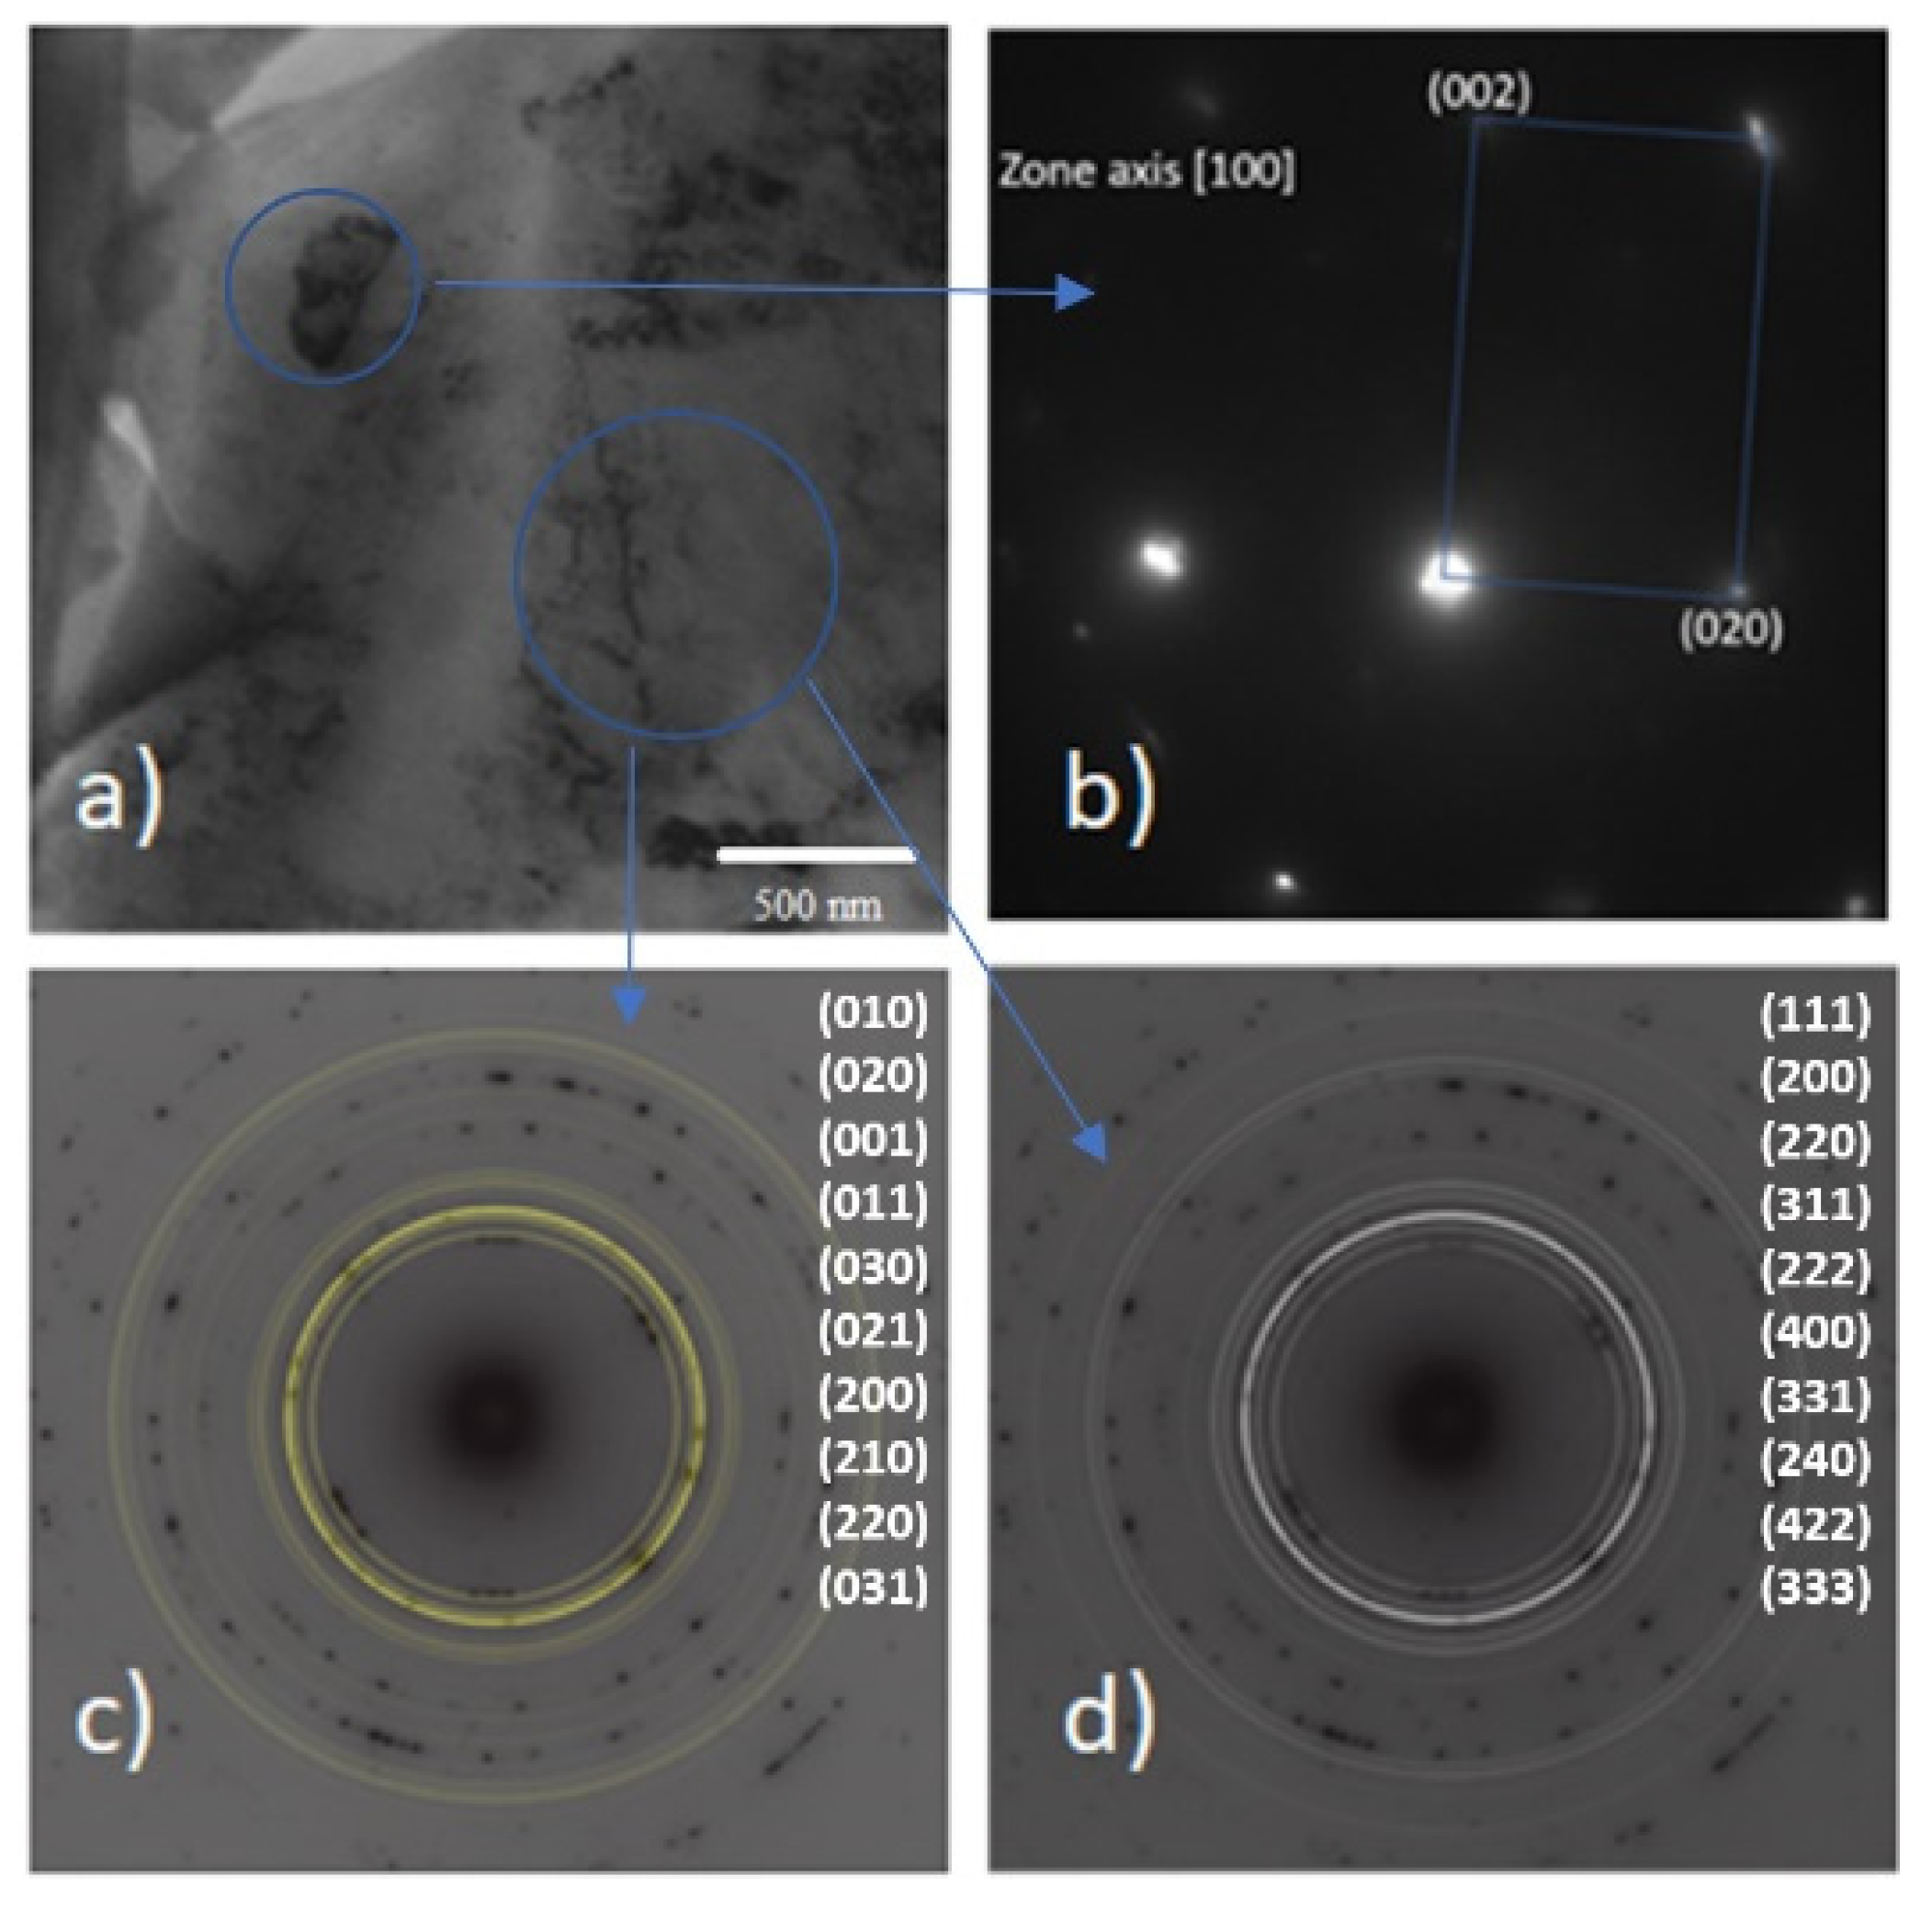
Figure 15a shows a TEM micrograph of the microstructure of the 8620 steel: several particles of different sizes can be observed within the ferrite matrix, with the biggest particles (nearly 500 nm) corresponding to Fe
3C (
Figure 15b), whereas the smaller ones might be M
7C
3 or M
23C
6 carbides. The diffraction pattern overlaps perfectly with the calculated Debye rings for both carbides (M
7C
3, M
23C
6), as indicated by
Figure 15c,d. The selected area chosen for diffraction has been marked by a circle. Furthermore, the corresponding indexation for each carbide is shown (from the inner to outer rings). The result mentioned above is compatible with the Calphad prediction of carbide formation at high temperatures due to chemical segregation at the grain boundaries.
Steels used in hot forging operations are expected to maintain a small grain size, as subsequent operations such as surface treatments are effective only if the grain size is small enough to produce hardened localized zones [
23]. The 1000~1100 °C temperature interval, most commonly used in hot forging operations for 8620 steel, is expected to have limited grain growth by static recrystallization and to maintain grain size by means of XRD. However, yet the role of Cr, Mo and Mn as precipitate-forming elements is not clear, as the amounts of the alloying elements were too low to explain the appearance of nanometric particles at this temperature, which is the only plausible explanation for grain growth inhibition by pinning mechanisms.


 ,
, 


