Article

Surface Micromorphology and Structure of Stainless and Maraging Steel Obtained via Selective Laser Melting: A Mössbauer Spectroscopy Study

1
Faculty of Science, Palacký University, 17. listopadu 1192/12, 77900 Olomouc, Czech Republic
2
Science and Technology Park, Palacký University, Šlechtitelů 813/21, 78371 Olomouc, Czech Republic
*
Author to whom correspondence should be addressed.
Metals 2021, 11(7), 1028; https://doi.org/10.3390/met11071028
Submission received: 21 May 2021 / Revised: 11 June 2021 / Accepted: 17 June 2021 / Published: 26 June 2021
(This article belongs to the Special Issue Mössbauer Analysis Applied to Metals, Alloys and Compounds)

Abstract

:
Selective laser melting (SLM) as an additive manufacturing method makes it possible to quickly produce complexly shaped three-dimensional (3D) metal specimens from a powder. This work describes how SLM affects the surface phase composition of a 3D printed specimen, as analyzed with conversion electron Mössbauer spectroscopy (CEMS), conversion X-ray Mössbauer spectroscopy (CXMS) and X-ray diffraction (XRD). Both stainless 1.4404 (CL20ES) steel and maraging 1.2709 (CL50WS) steel have been investigated. A transformation of the phase composition from the ferritic phase into an austenitic one was proven by comparing the initial CL50WS powder and the final specimen using CXMS. This transformation takes place during the SLM process. No transformation was identified in stainless steel. The differences identified via CEMS between the surface phase composition of the final non-annealed specimens and the surface of the final annealed specimens demonstrated the oxidation of the surface layer. The oxidation occurs during the annealing of the sample in surface layers less than 1 μm thick. The quality of the surface was examined using scanning electron microscopy (SEM), which presented imperfections on the face of the final specimen. Granules of the initial powder bonded to the surface of the specimen and both irregular and spherical pores were observed.

1. Introduction

Selective laser melting (SLM) is an additive manufacturing (AM) technique currently undergoing rapid development. In SLM, a powdered material on the surface of a powder bed is melted with a laser that scans cross-sections based on a 3D model of the component being produced. Once a cross-section is fully scanned, the bed will be lowered so a new powder layer can be placed on top of the previous cross-section. This layer is again scanned and the whole process is repeated until the whole 3D model is scanned and the component completed [1,2,3]. Due to the production process of SLM, it is a challenge to match the mechanical features of components made using traditional techniques. Factors contributing to these features are, for example, the process parameters, the composition of the powder and the size of its granules. SLM is a suitable choice to manufacture Mg, Ni and Ti alloys, stainless and hard tool steels, and a variety of metal composites. Many papers [4,5,6] have investigated how to improve the SLM process and properties, such as hardness, roughness, tensile strength, and the microstructure of components produced using SLM.
When one is investigating iron-based components, Mössbauer spectroscopy (MS) is a suitable method. There have been, however, only a small number of papers using MS to examine the surface of iron-based components made with SLM [7,8,9,10]. Backscattering 57Fe MS with registration conversion electrons (CEMS) and secondary X-rays (CXMS) allows one to study the 0.1 nm and 10 μm surface layers, respectively [11,12,13]. Thus, one can investigate, by CEMS and CXMS, the changes of phase composition in different depth surface layers of steel specimens under mechanical treatment [14,15], thermal treatment [16,17,18] and radiation influence [19,20].
The practical uses of manufactured products made with SLM require knowledge of the formation mechanisms of the surface micromorphology and structure, as well as the influence of subsequent processing on the quality of surfaces. Due to there being no optimal technological modes and substantial temperature gradients, certain defects occur in materials: stresses, deformations, size inaccuracies, cracks, separation into layers, and porosity [21,22]. Post-process annealing to remove mechanical stresses and sandblasting to adjust the surface morphology affect the surface quality of SLM parts [23,24].
Metal powders of stainless steel 1.4404 (CL20ES) and maraging 1.2709 (CL50WS) are used in SLM technology. A number of authors used the Mössbauer spectroscopy to study temperature phase transitions [25,26,27] and corrosion [18,28,29,30,31,32,33] of these steels.
Some papers [34,35,36] presented studies of the phase composition of samples using X-ray diffraction (XRD). These studies were carried out both on metal powders and samples made using SLM.
This article describes an experimental investigation with CEMS and CXMS of the surface of specimens made with SLM. XRD, scanning electron microscopy (SEM), and digital optical microscopy have been used to investigate the phase composition and morphology of the surface of specimens.

2. Materials and Methods

2.1. SLM Technology

Prism-shaped test samples were made using a Concept Laser M2-cusing system (GE Additive, Cincinnati, OH, USA). This SLM system makes use of a Yb:YAG diode-pumped fiber optical laser which has a 1070 nm wavelength and 400 W maximal power. The parameters of sample production were based on the authors’ experience. As small samples were made, a lower laser power was chosen. Typically, when using a higher laser power, mechanical deformations of the manufactured parts often occur due to insufficient heat dissipation. During the production process, the power of the laser was set to 200 W and the maximal scanning rate was set to 1800 mm/s.

2.2. Mössbauer Spectroscopy

Both the transmission and backscattering 57Fe Mössbauer spectrometers used are equipped with a 57Co(Rh) source and MS96 Mössbauer spectrometer software [37]. The measurements were performed at room temperature and in constant acceleration mode. A YAP:Ce scintillation detector was used for the registration of transmission Mössbauer spectra (TMS). A proportional gas detector registering 6.4 keV X-rays was used for the accumulation of conversion X-ray Mössbauer spectra (CXMS). Conversion electron Mössbauer spectra (CEMS) were acquired with an air scintillation detector [38]. The software MossWinn 4.0 [39] was used to evaluate all measured Mössbauer spectra. An α–Fe calibration foil of 30 µm thickness was used to calibrate the Mössbauer spectrometers at room temperature, zeroing the isomer shift values.

2.3. Scanning Electron Microscopy and Digital Optical Microscopy

A VEGA3 LMU scanning electron microscope (TUSCAN, Brno, Czech Republic) was used to image both CL20ES and CL50WS powders and the surfaces of the produced test samples. Inspection of the surface morphology was carried out using a VHX-5000 digital microscope (KEYENCE, Osaka, Japan).

2.4. X-ray Diffraction

The measurements were carried out using a Bruker D8 ADVANCE X-ray diffractometer (Bruker, Billerica, MA, USA) in Bragg–Brentano diffraction geometry. The material of the X-ray tube anode is Co with a wavelength of 1.79026 Å. The measurement was performed using slits with a width of 0.6 mm and a Fe beta filter with a 0.02 mm width. For the primary beam path, Soller slits with 2.5 degree beam divergence were used. The X-ray generator operates at 35 kV voltage and 40 mA current. The average measurement time was 4 h. Maud software was used for the quantitative analysis.

2.5. CL20ES and CL50WS Steel Powders

CL20ES and CL50WS steel powders were used to manufacture prism-shaped specimens, and their chemical composition is presented in Table 1.

2.6. Test Samples

Six prism-shaped samples (20 × 20 × 3 mm3) were made using the SLM method; three samples were made from CL20ES metal powder, and three samples from CL50WS powder. One sample from each group was left in its original state. The other four samples were annealed in air following the time scheme: linear heating from room temperature to 550 °C over 3 h, staying at this temperature for 6 h and linear cooling back to room temperature over 5 h. Two of these four samples were subsequently sandblasted with corundum powder. Thus, there are three samples for each material, one without further processing, one annealed, and one annealed and sandblasted. The samples were labeled in accordance with Figure 1.

3. Results and Discussion

3.1. Scanning Electron Microscopy

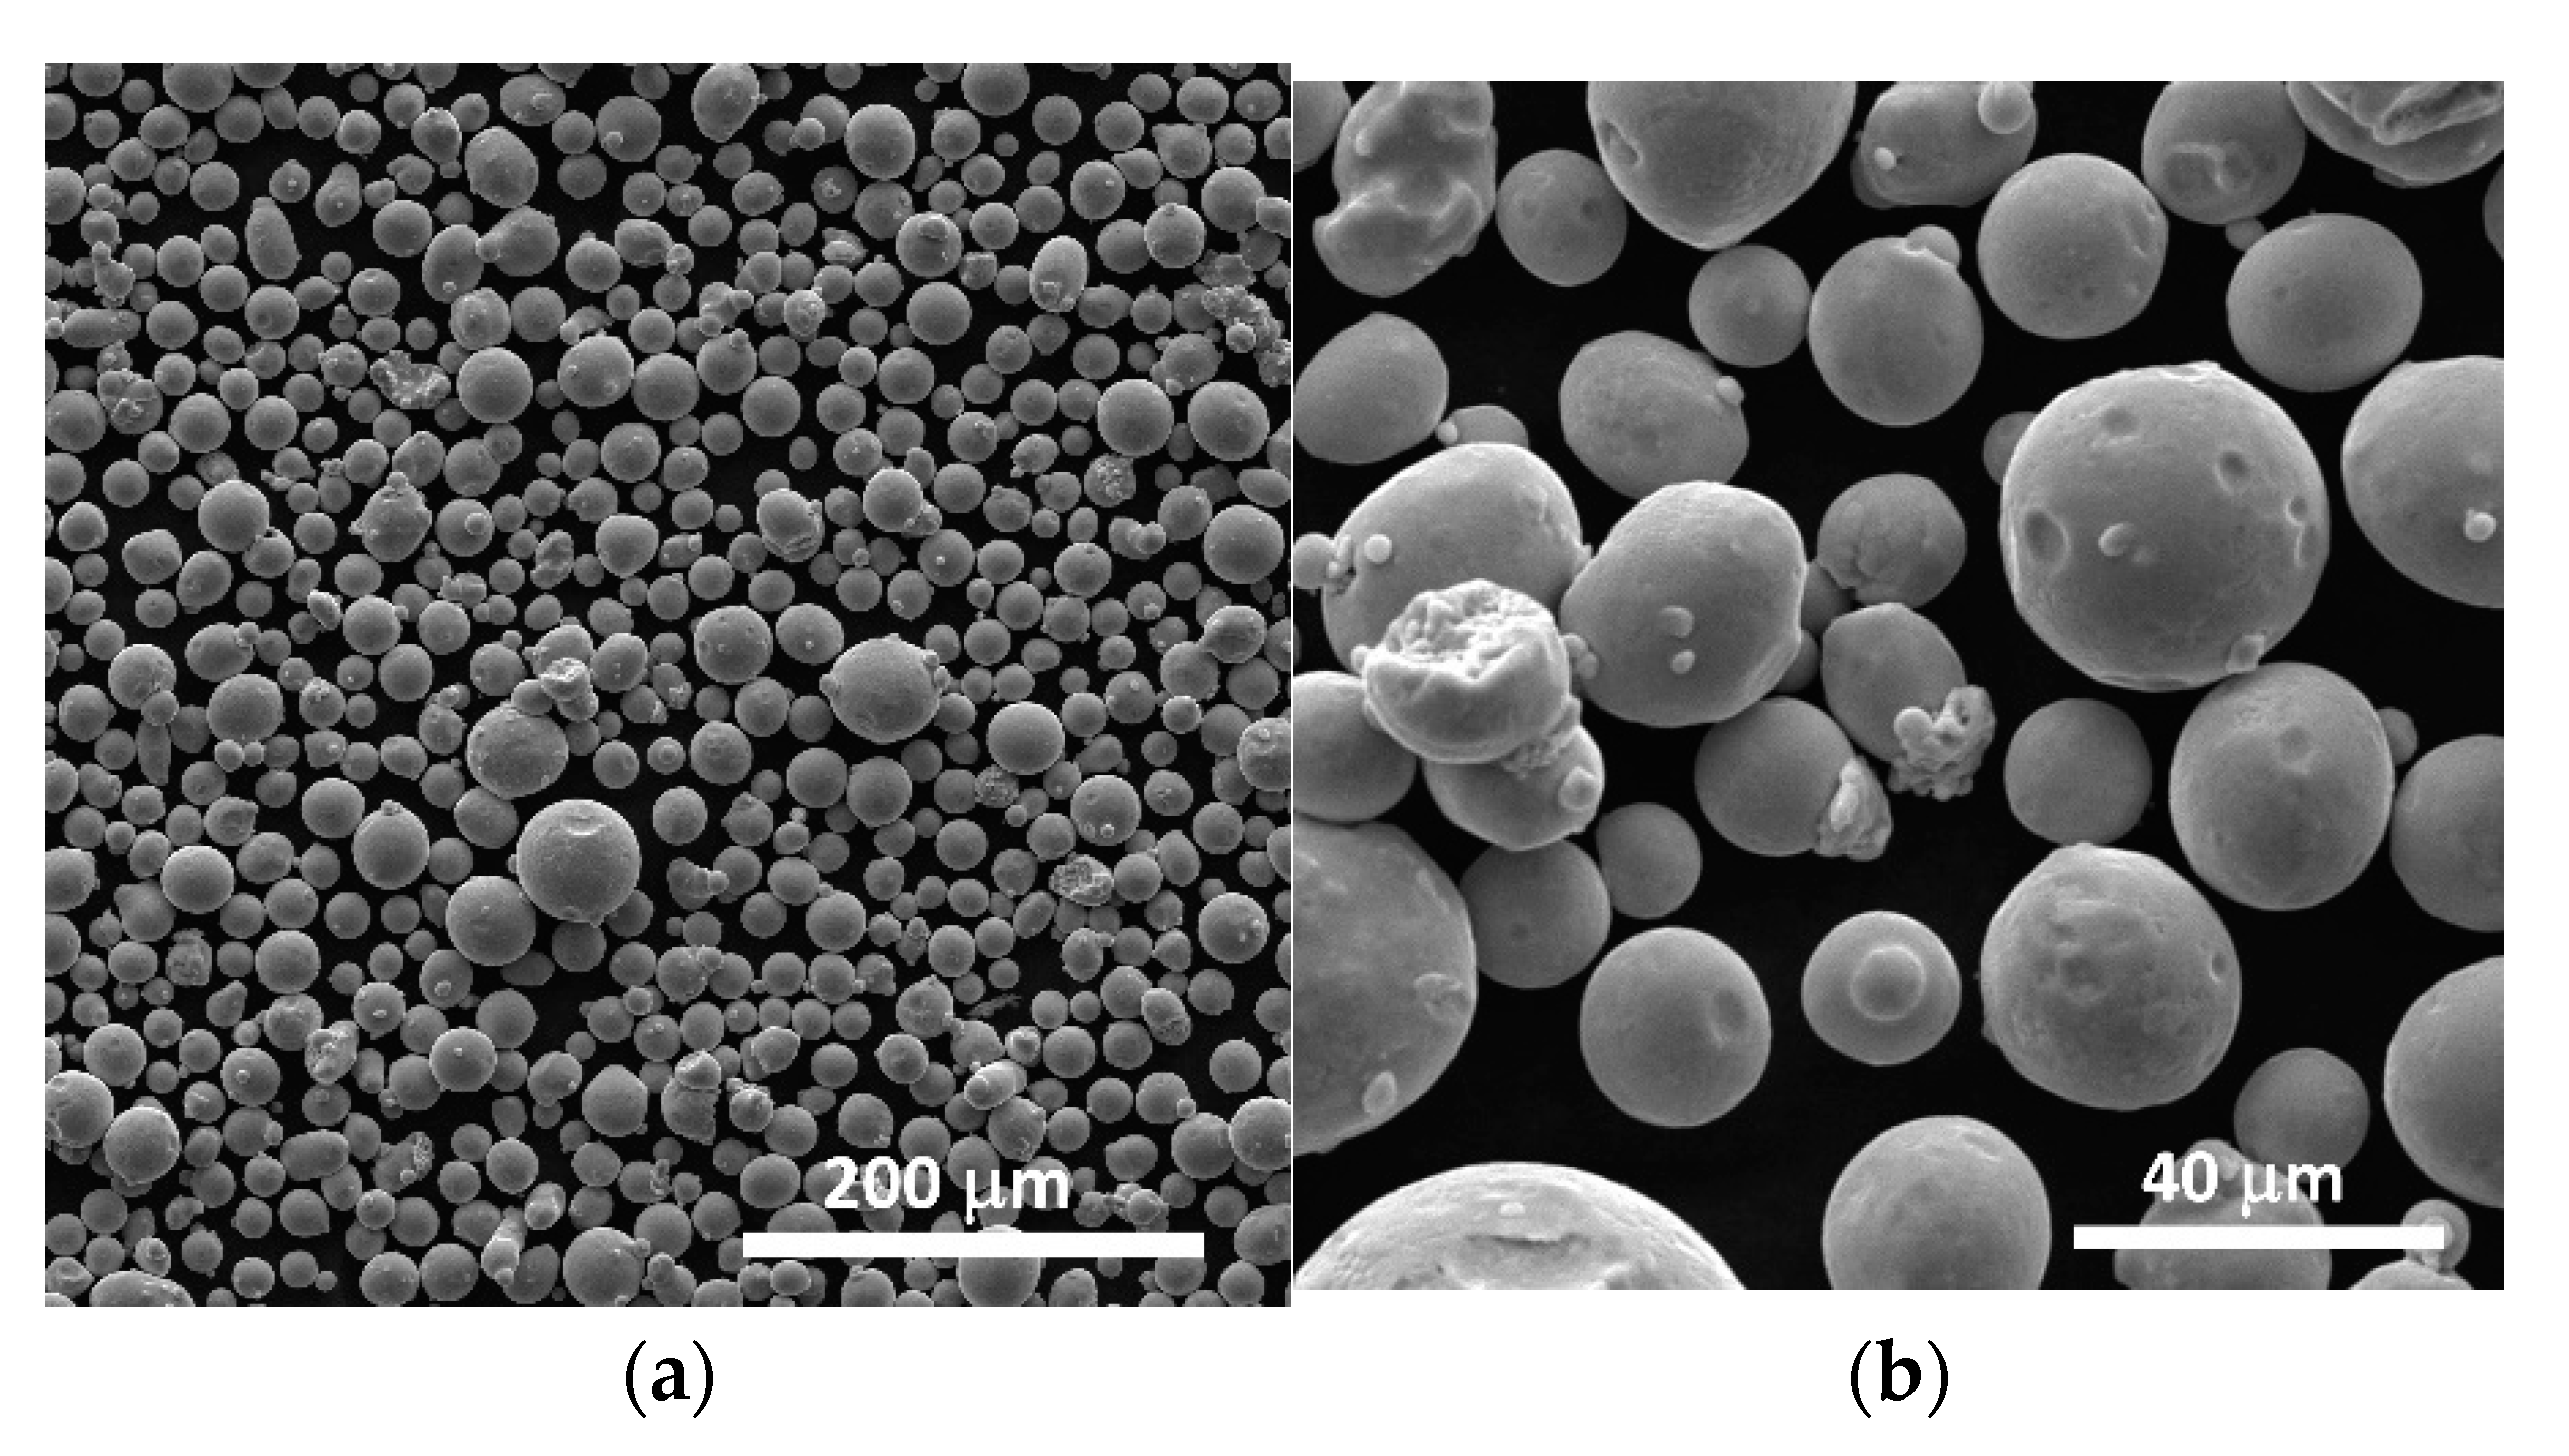
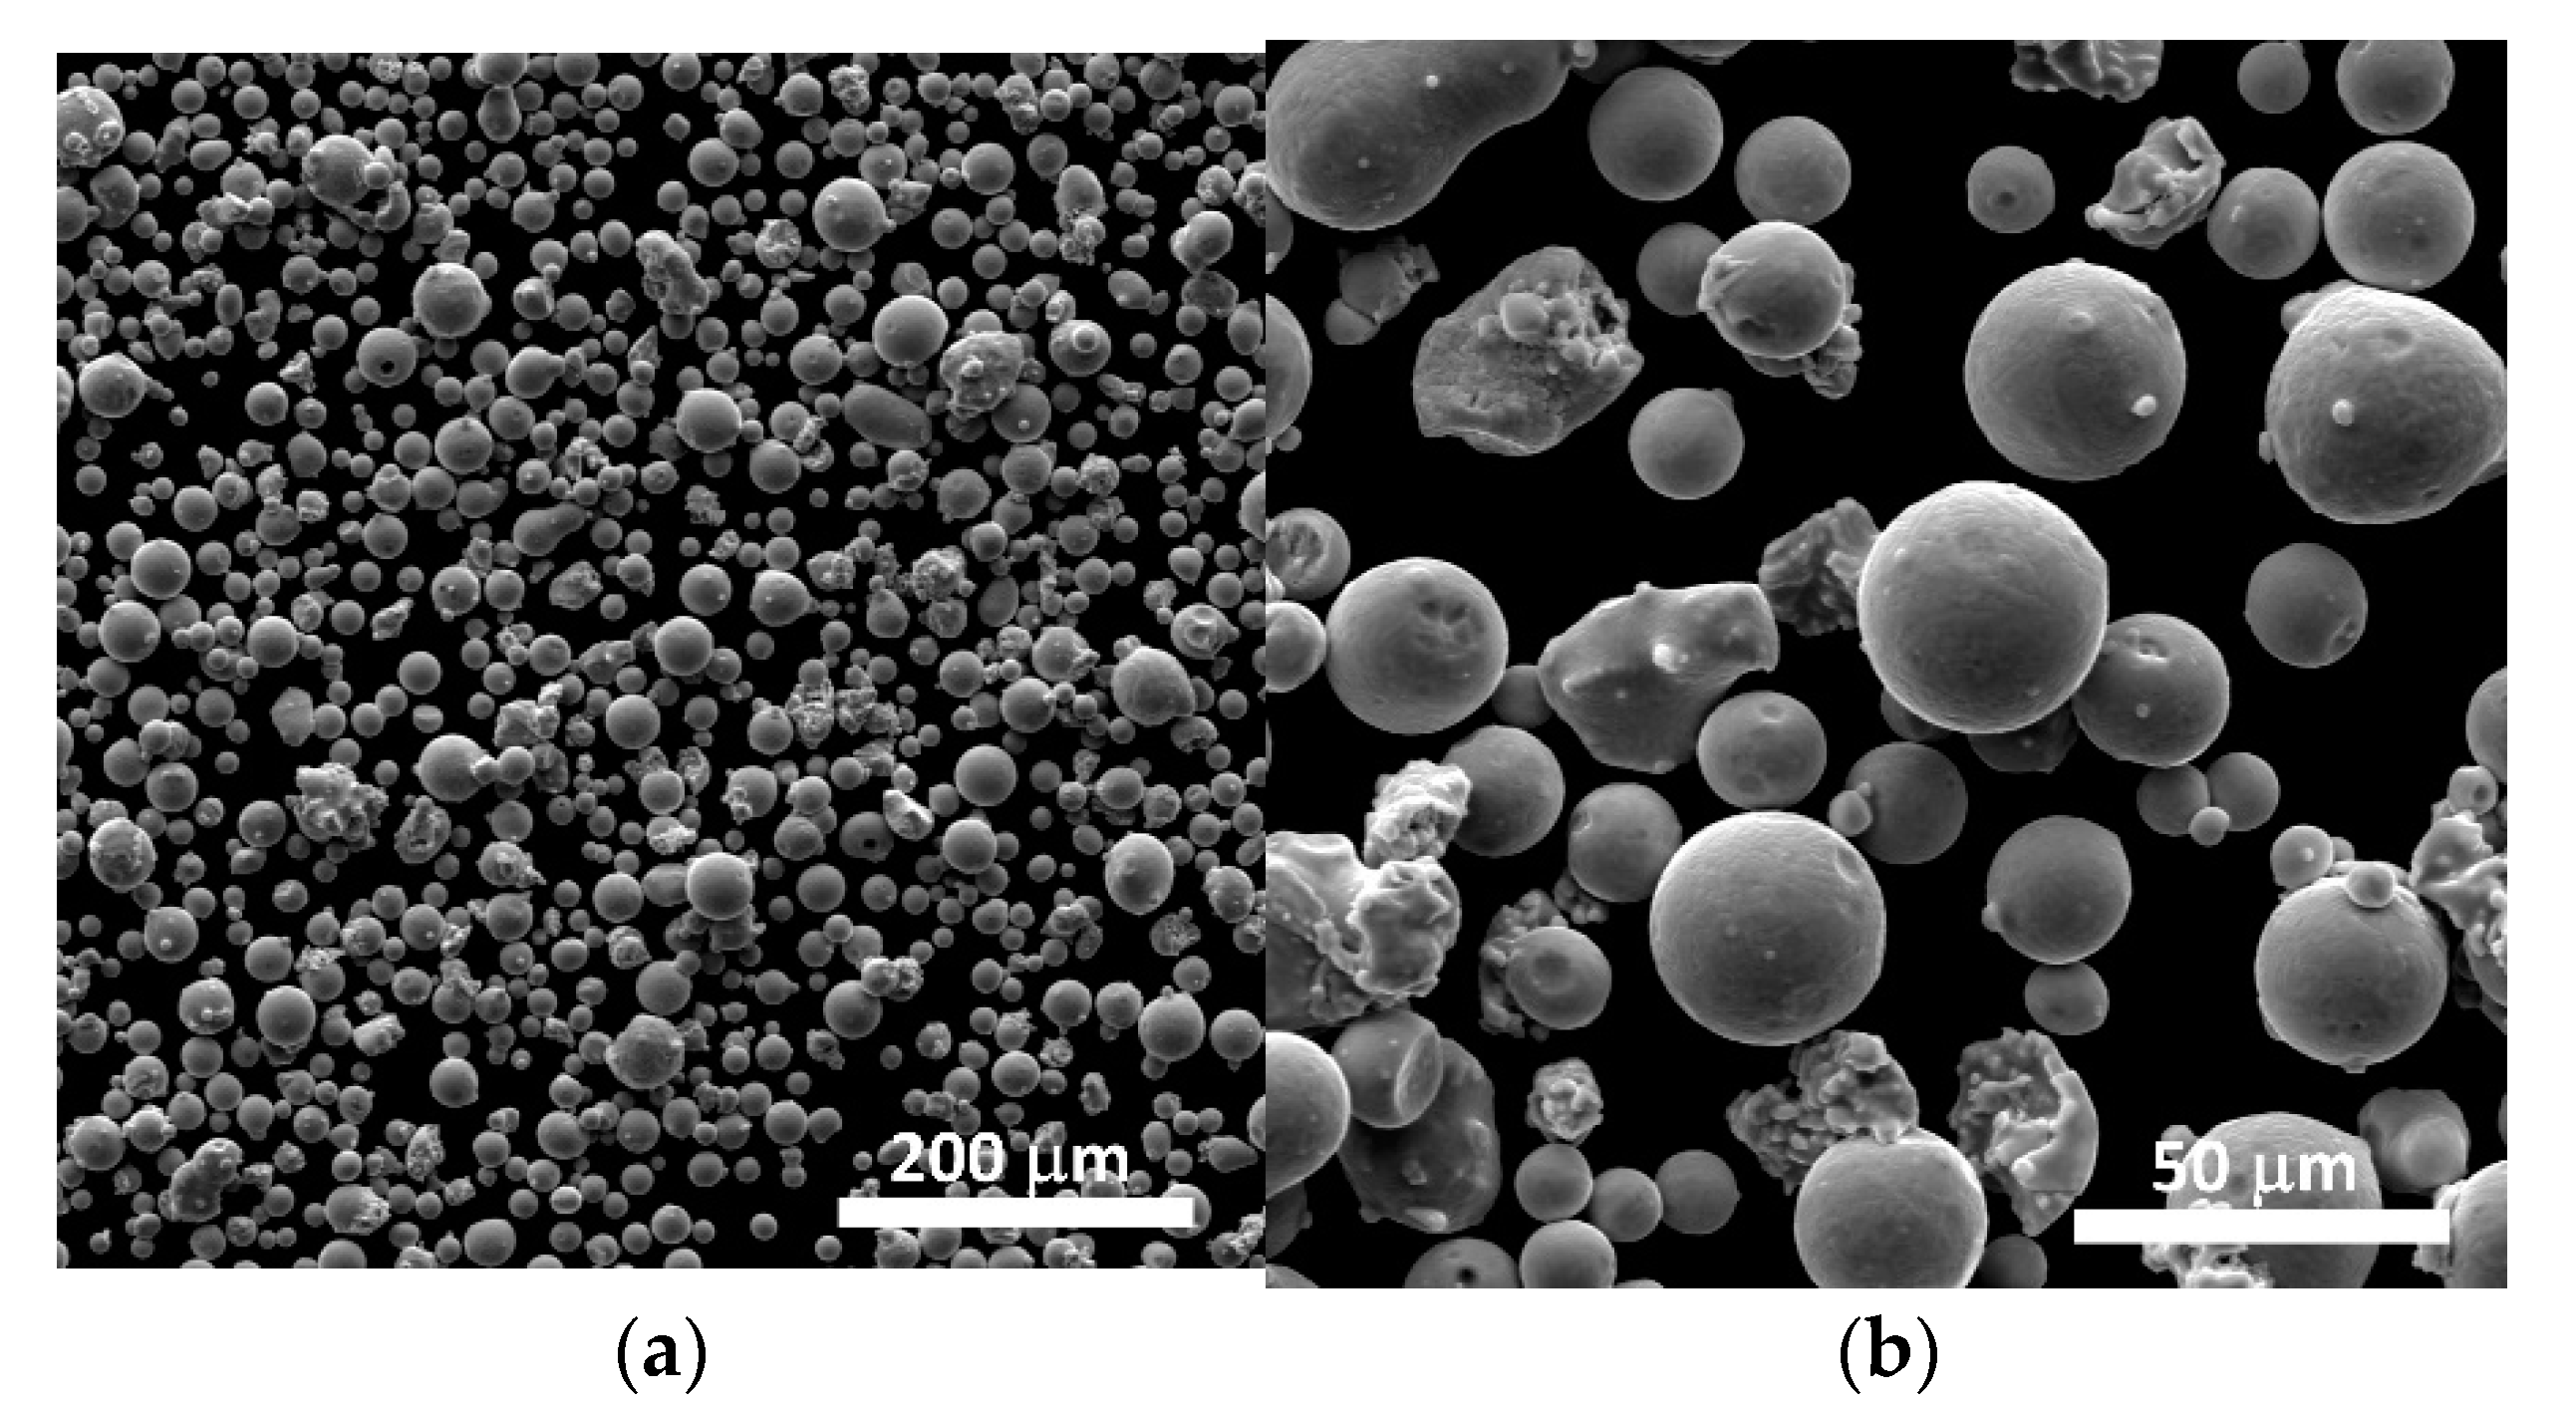
To analyze the micromorphology and determine the size of the granules of both initial CL20ES and CL50WS powders, a SEM was used. In Figure 2 and Figure 3, images of the initial CL20ES and CL50WS powders are shown, respectively. The majority of the individual granules, for both powder types, fall in the size range between 10 and 20 μm. A relatively small part of the spherical particles is broken.
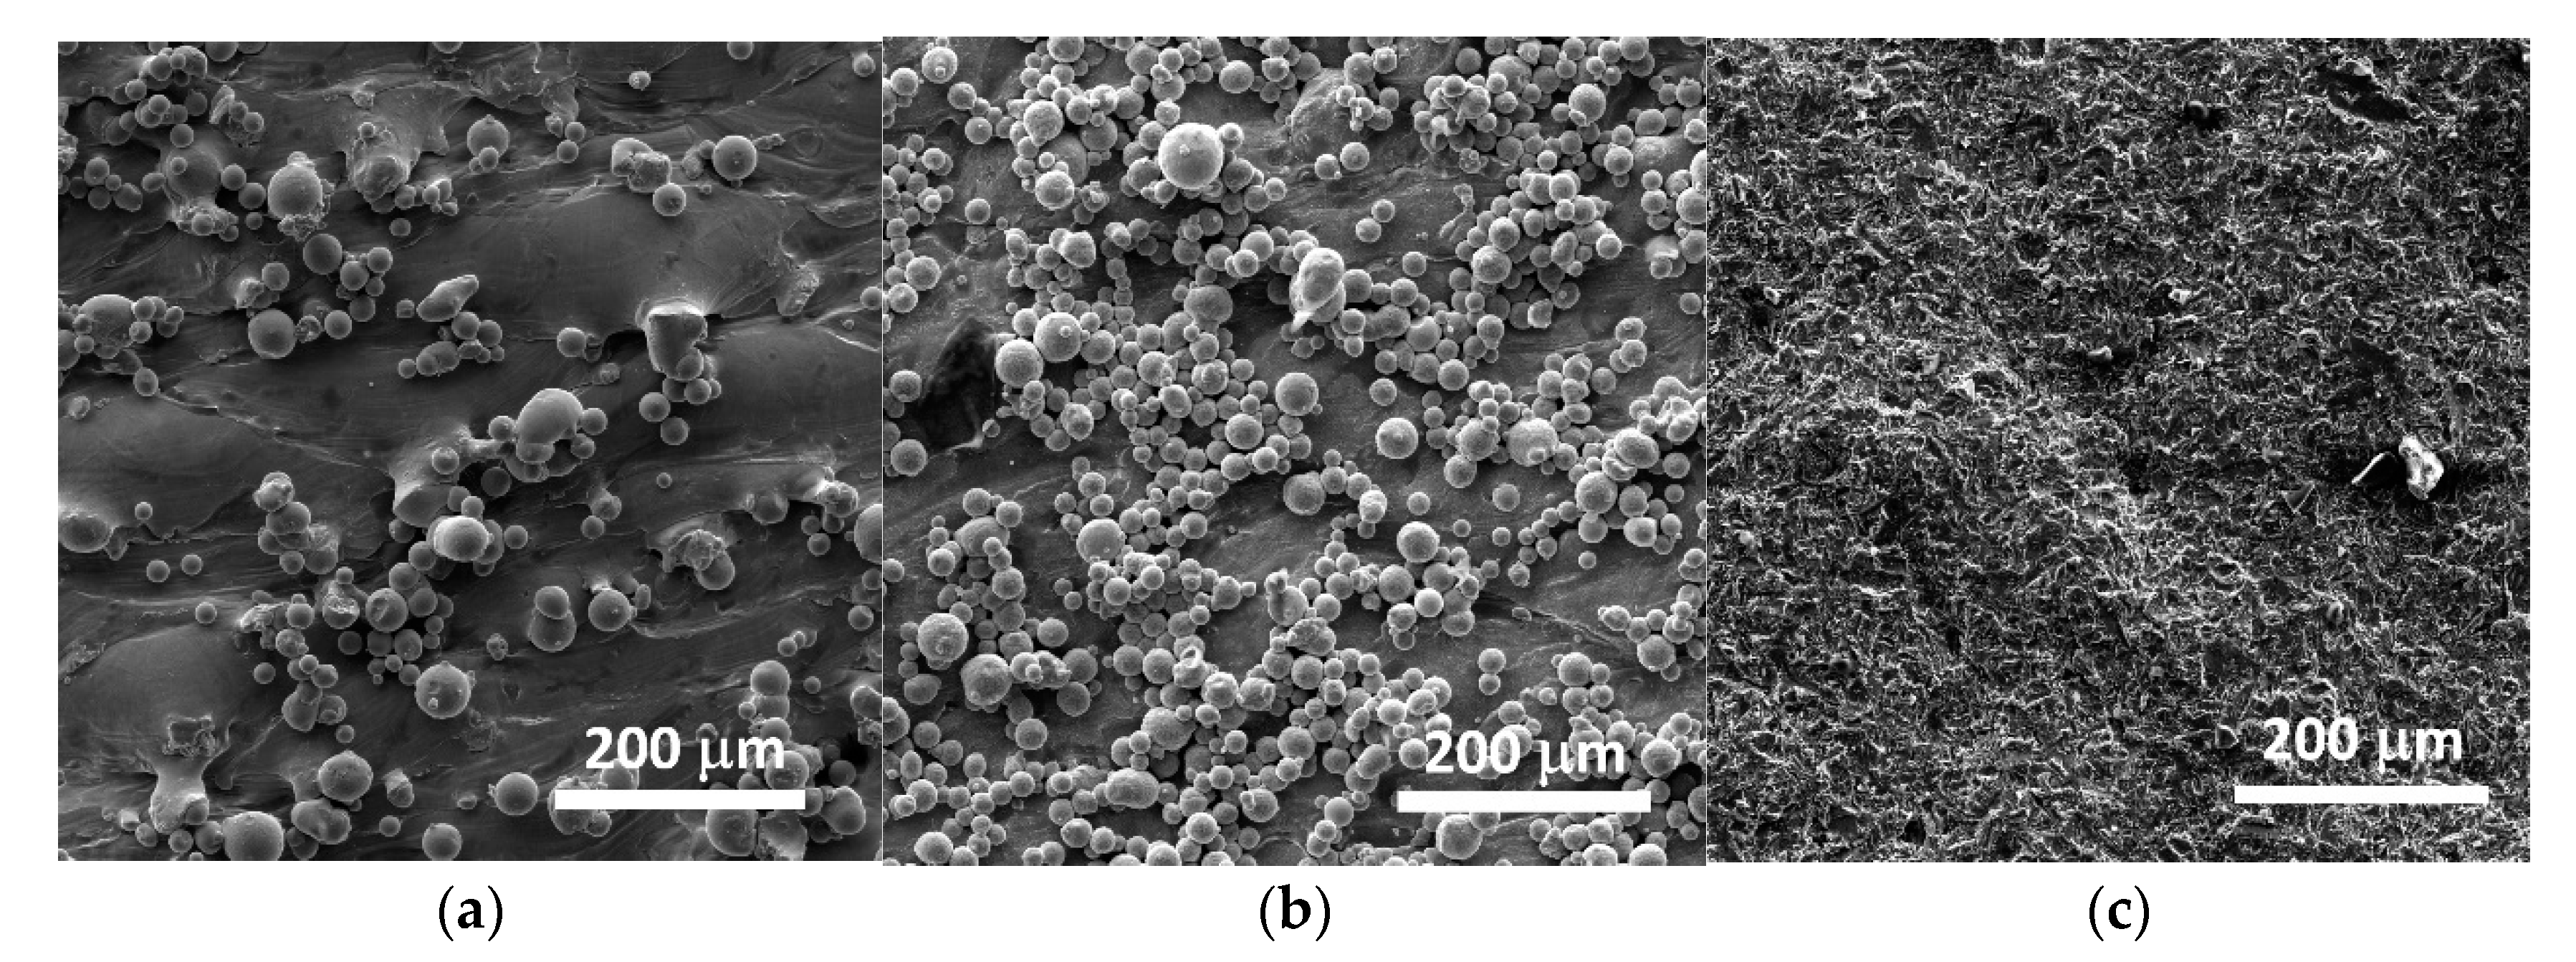
A SEM inspection of all test specimens was performed at approximately the center of each sample. The inspection of the surface morphology of all test specimens by the SEM showed that the surface of the specimens manufactured by the SLM are partially covered with spherical particles of the starting powder material (left side of Figure 4 and Figure 5). The particles are lightly welded to the surface. The annealing of the samples does not remove these particles (center of Figure 4 and Figure 5); the particles are removed only by the final sandblasting (right side of Figure 4 and Figure 5). In the case of Sample6 (test sample from CL50WS after annealing), there is an enormously high amount of spherical particles on the surface of the sample. These are welded particles of the initial powder. Coincidentally, the SEM image was taken at a site with a higher incidence of these particles.

3.2. Digital Optical Microscopy

Digital optical microscopy allows the evaluation of the vertical dimensions of the observed object and was therefore used to show the surface profiles of the studied samples. Figure 6 and Figure 7 demonstrate, as well as the SEM images (Figure 4 and Figure 5), the fact that the remaining spherical particles of the starting powder on the surface were removed from the surface by sandblasting. It is obvious that sandblasting reduces the roughness of surfaces, which is the expected effect.

3.3. Mössbauer Spectroscopy

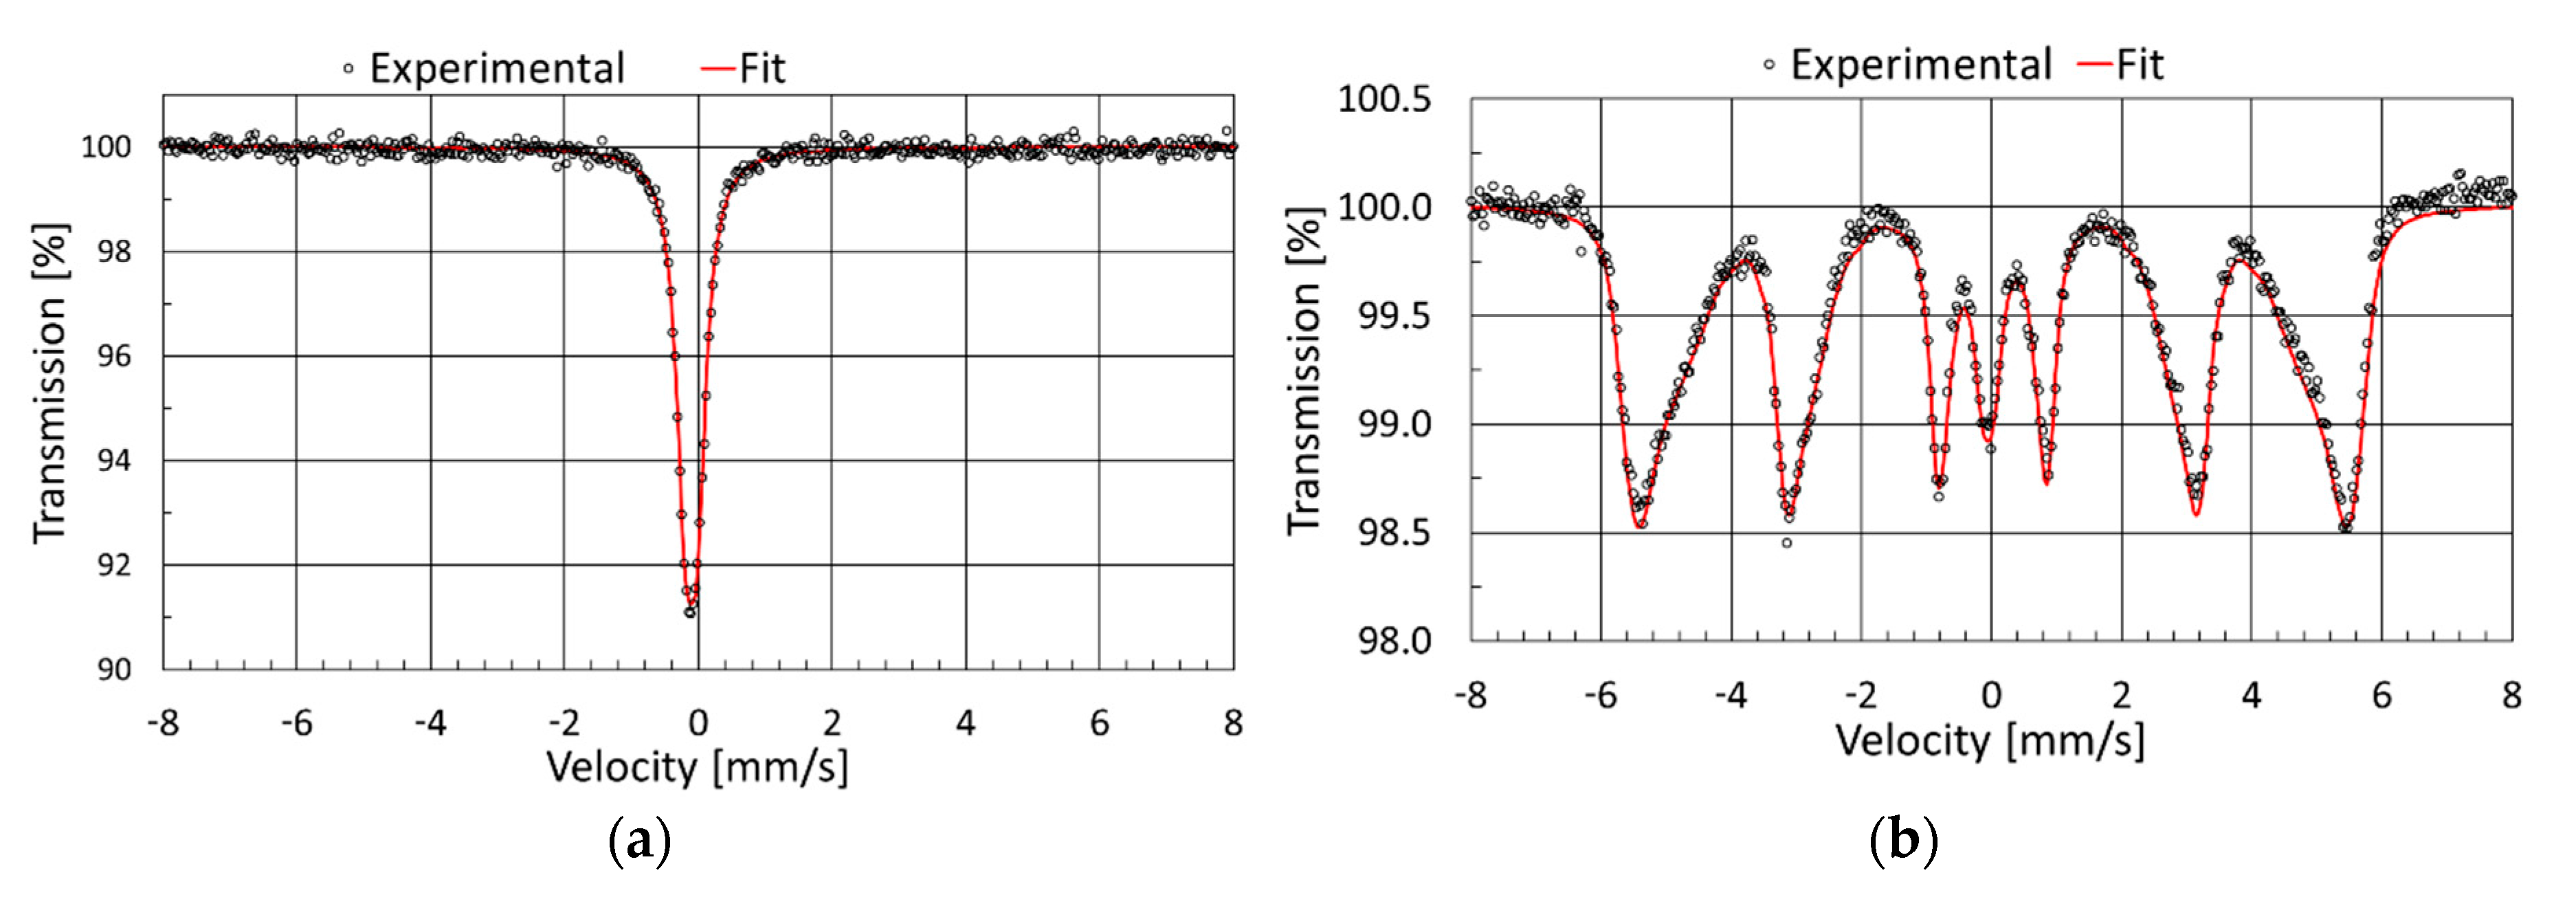
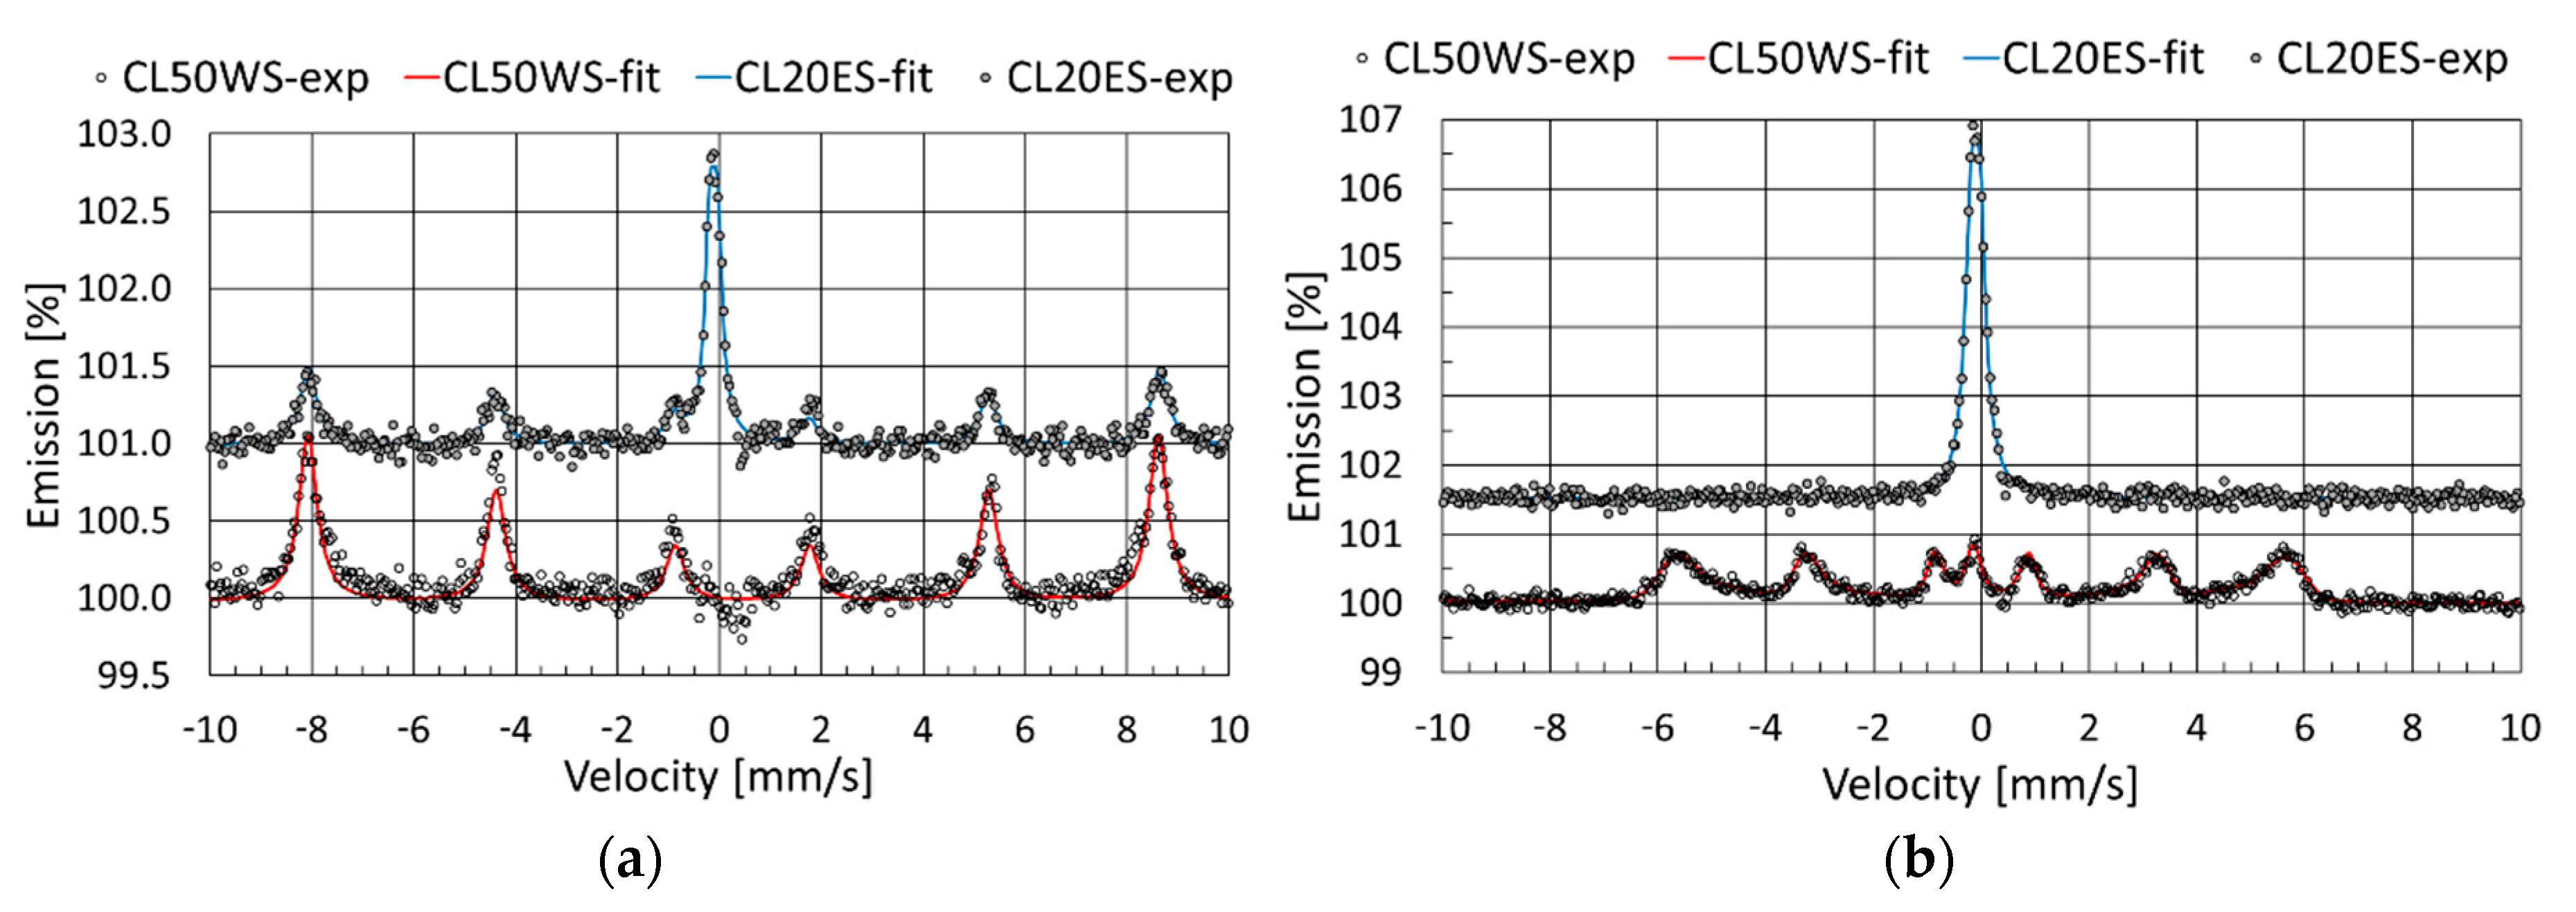
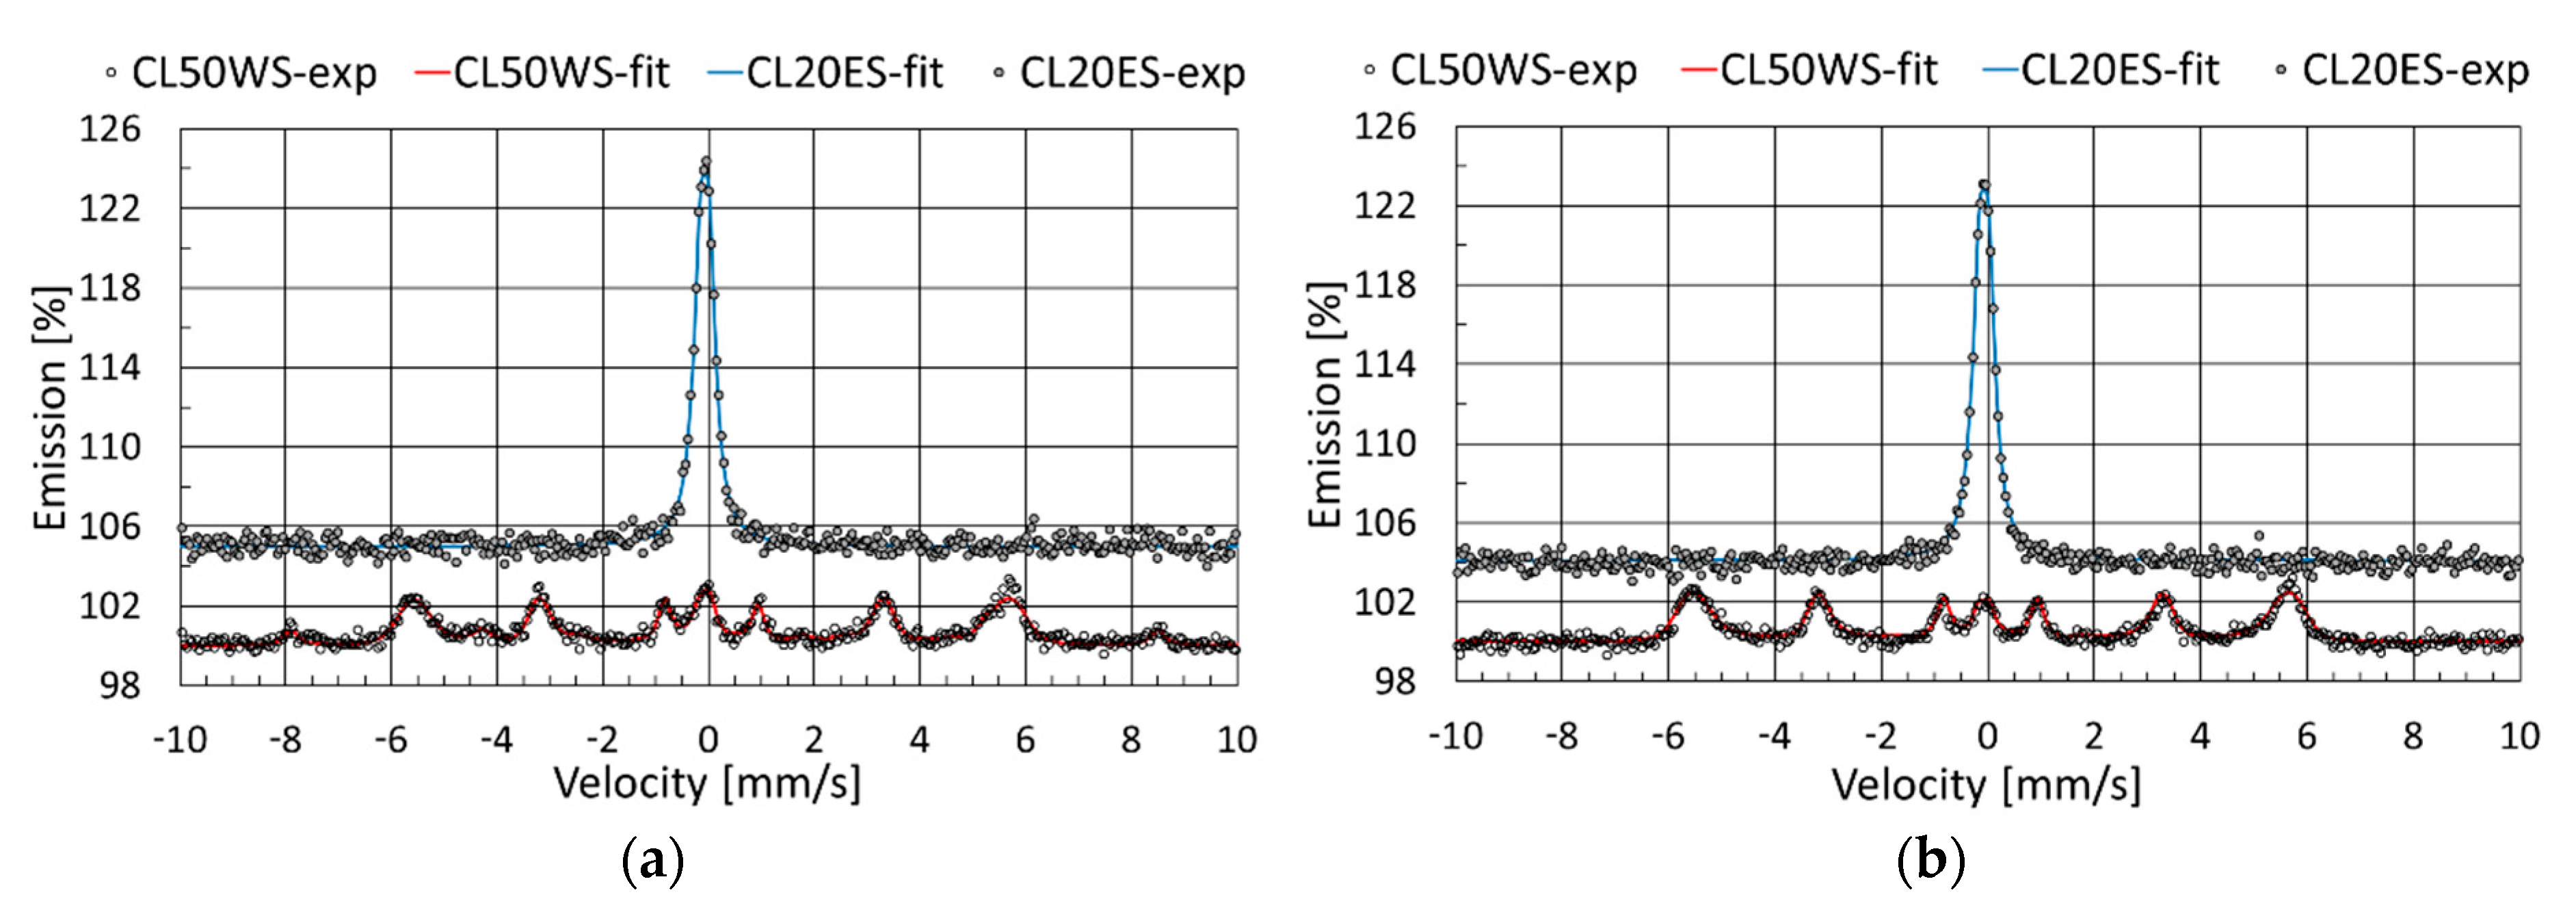
Transmission Mössbauer spectra (Figure 8) of the initial powders were fitted in accordance with the fact that the metals crystallize dominantly into BCC (body-centered cubic) and FCC (face-centered cubic) crystal structures. The shape of the Mössbauer spectrum of austenitic stainless steel (1.4404) is determined by substitutional and interstitial atoms in the paramagnetic γ-Fe crystal. The single peak is characteristic for the γ-Fe (FCC structure) Mössbauer spectrum, but substitutional and interstitial atoms (dominantly Cr and Ni) in austenitic stainless steel cause a broadening of the spectrum; therefore, the Mössbauer spectrum is fitted with a doublet with small quadrupole splitting [40]. The sextet (magnetic hyperfine split) with a 33 T hyperfine magnetic field is characteristic for the Mössbauer spectrum of α-Fe (BCC structure), but substitution atoms in ferritic steel are the cause of the distribution of hyperfine magnetic fields [41]. Thus, the experimental Mössbauer spectrum of the CL20ES powder was fitted with a doublet (austenitic phase) and the spectrum of the CL50WS powder was fitted with a doublet (austenitic phase) and a sextet (ferritic phase) with a distribution of the magnetic field (Figure 8, Table 2). The backscattering Mössbauer spectra (CEMS and CXMS) of all samples manufactured by SLM were fitted with the same components as in the case of transmission Mössbauer spectra of the initial powders, i.e., a doublet of γ-Fe and a sextet of α-Fe. In cases where XRD identified the presence of iron oxide, a sextet subspectrum corresponding to α-Fe2O3 was added (Figure 9 and Figure 10, Table 3 and Table 4). The spectra of Sample1 and Sample4 are not shown in Figure 9 and Figure 10 as they are the same as the spectra of Sample3 and Sample6. Analysis of the Mössbauer spectra shows that the annealing of the CL20ES steel sample causes the partial oxidation of a thin surface layer less than 1 μm thick. The proof is that α-Fe2O3 is identified only by CEMS (Figure 9, left) and not by CXMS (Figure 10, left). In the case of CL50WS steel, the oxidation of the surface layer is stronger because CEMS identified only α-Fe2O3 (Figure 9, left), and to a greater depth because traces of α-Fe2O3 are also visible in CXMS (Figure 10, left). A comparison of the Mössbauer spectra of annealed samples (Figure 9 and Figure 10, left) with annealed and subsequently sandblasted samples (Figure 9 and Figure 10, right) shows that the oxide layers are completely removed by sandblasting for both steel types. The Mössbauer spectra of the initial CL50WS powder and the corresponding samples manufactured from this powder show a two percent increase in the austenitic phase (the accuracy of Mössbauer phase analysis is 1 percent). This fact is in line with the observation of the transformation from a ferritic to austenitic phase in [9], where this transformation was several times more intense. The ratio of austenitic and ferritic phase was 1:1; this is clearly related to the size of the manufactured parts and, consequently, to the thermal conditions during the SLM process. The dimensions of the part in [9] were 100 mm × 100 mm × 100 mm.

3.4. X-ray Diffraction

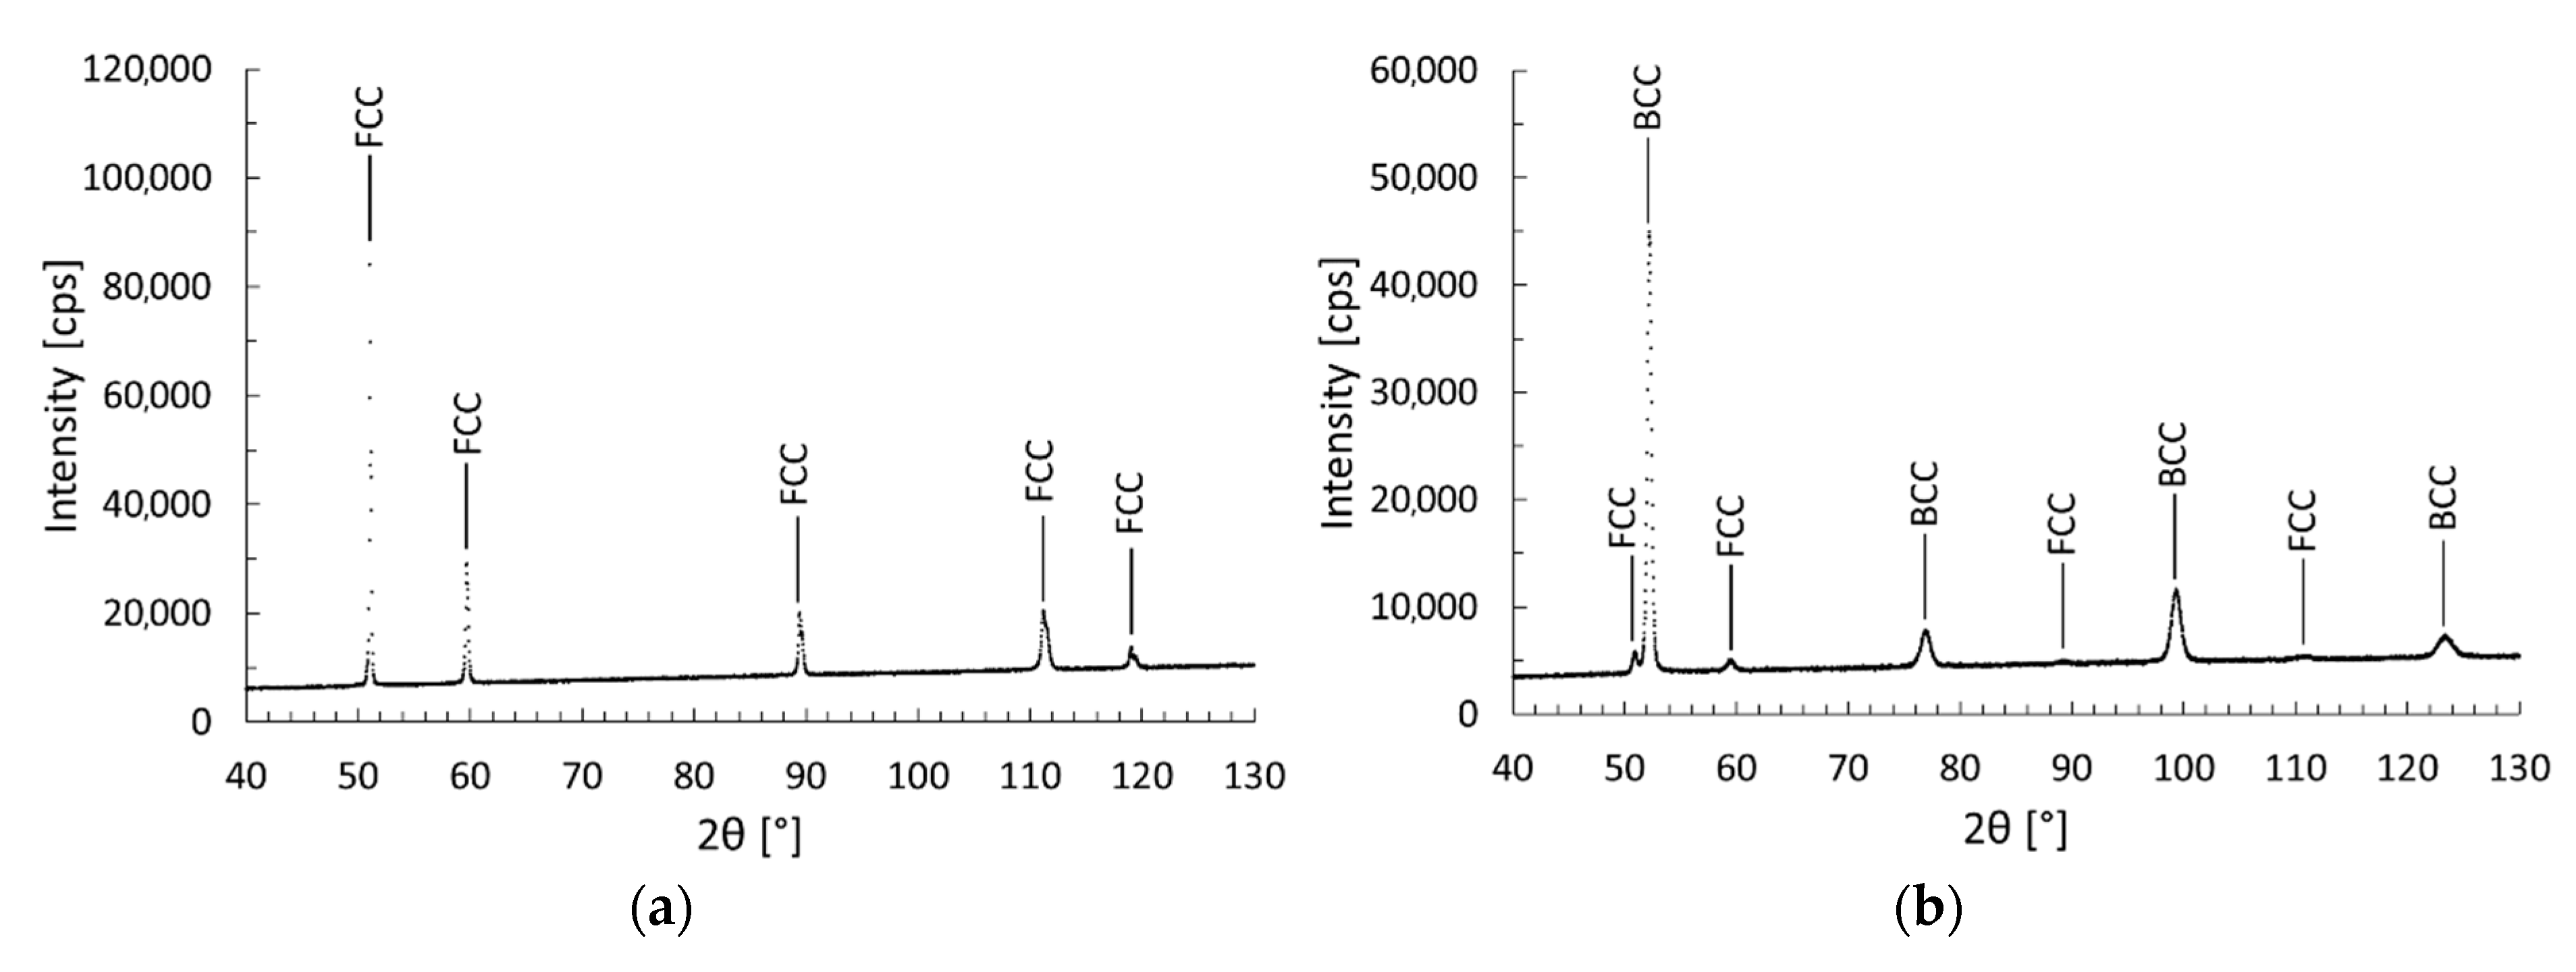
X-ray diffraction patterns of both initial powders are presented in Figure 11. It is obvious that the powder of austenitic stainless steel (CL20ES) occurs only in an FCC structure corresponding to γ-Fe. The diffraction pattern of the maraging steel powder (CL50WS) shows the dominance of the BCC structure corresponding to α-Fe. The FCC structure forms a minority. Quantitative analysis of the XRD pattern showed that the content of the FCC phase is 7 wt% and the BCC phase 93 wt%. The accuracy of the determination is 1 percent. The identified phase composition of both powders corresponds to the phase composition determined by Mössbauer spectroscopy (Table 2).
X-ray diffraction patterns of Sample1 and Sample4 (Figure 12) are similar to the X-ray diffraction patterns of the initial powders and show that the phase composition of the specimens is not influenced by laser melting. For Sample1, only the FCC phase was identified; 7 wt% FCC phase and 93 wt% BCC phase were identified for Sample4. In terms of measurement accuracy, the phase composition corresponds to the results of the Mössbauer measurements (Table 4). The X-ray diffraction patterns in Figure 13 (Sample2 and Sample5) demonstrate the influence of thermal annealing on the phase composition of the surface of both samples. One can see that in the case of maraging steel (CL50WS), the surface of the sample oxidized, i.e., lines corresponding to hematite appeared on the X-ray diffraction pattern. In accordance with the quantitative analysis, the FCC:BCC:Fe2O3 phase weight ratio was 20:72:8 wt%. Here, one can see the quantitative discrepancy between the FCC and BCC phase ratio between XRD and Mössbauer data. This ratio from XRD is approximately 4 and from the Mössbauer data 8 (Table 4). This fact can be explained by changing the Debye–Waller factors for both FCC and BCC phases during sample annealing. In general, the Debye–Waller factors are different for various structural iron phases and affect the intensity of the components of the Mössbauer spectrum [42]. Since the Debye–Waller factors are not known, it is only possible to compare the results of the XRD and Mössbauer measurements quantitatively. No traces of iron oxides or other element oxides were found on the annealed stainless steel (CL20ES) sample.
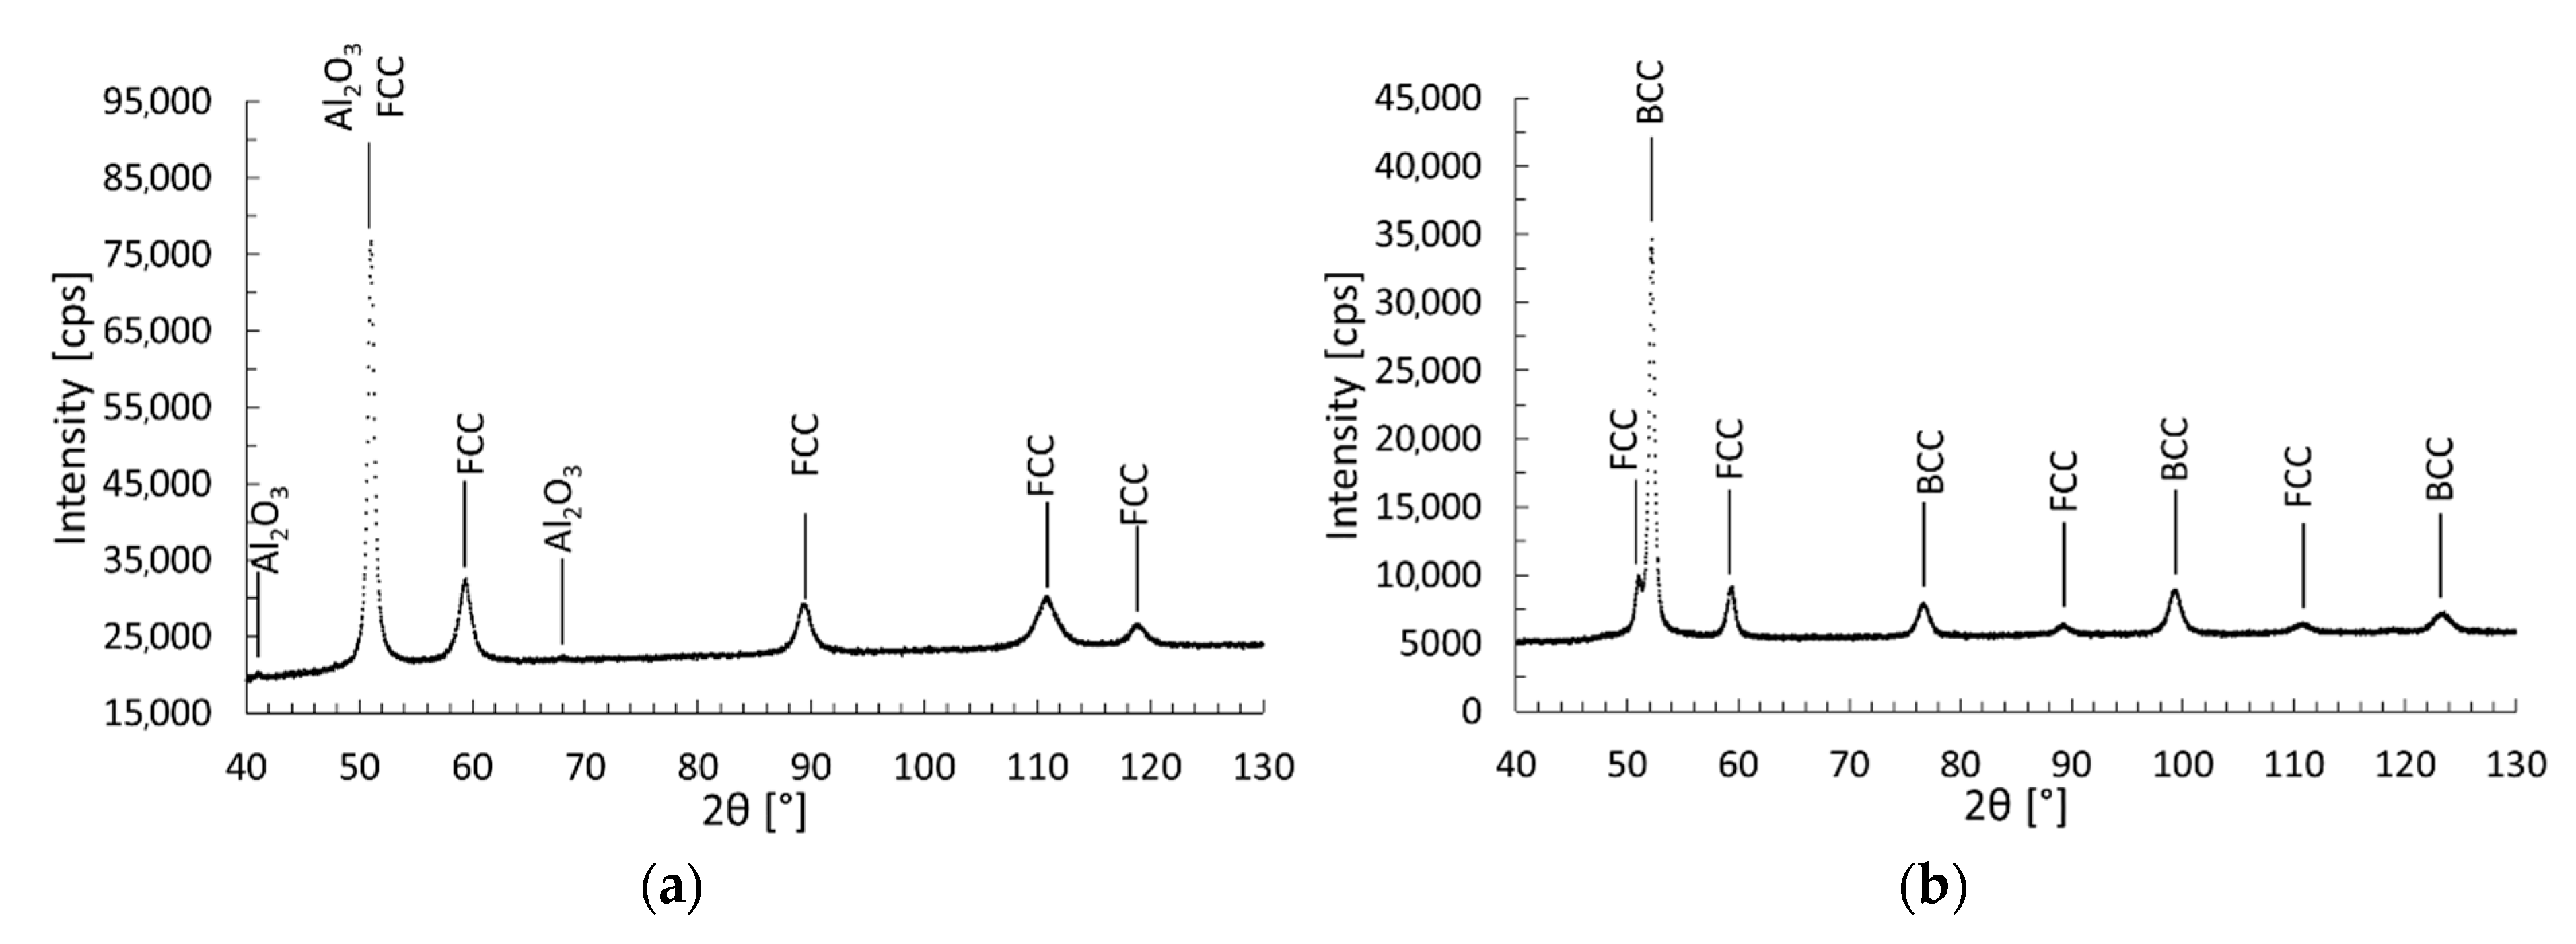
Finally, the samples were sandblasted with corundum powder (Al2O3). The X-ray diffraction patterns (Figure 14) showed the phase composition of stainless and maraging steel. No iron oxide was identified. In the case of Sample3, very small traces of corundum contamination were identified. Quantitative analysis of the XRD pattern showed that for Sample6, the content of FCC and BCC phases are 17 wt% and 83 wt%, consequently. As with Sample5, there is a similar discrepancy between the XRD and Mössbauer data. The extension of the lines in both X-ray diffraction patterns is evident on sandblasted samples. This is probably related to the mechanical damage of the crystals on the surface of the samples by sandblasting.

4. Conclusions

The usefulness of Mössbauer spectroscopy to characterize the phase composition of components made by SLM technology was made evident. Qualitatively, the phase composition determined by CEMS and CXMS agrees with the XRD results. Transformations of the ferritic phase to austenitic were identified by Mössbauer spectroscopy in the fabrication of SLM parts from CL50WS metal powder, which is consistent with previously observed properties [9]. CEMS, CXMS, and XRD showed the oxidation of the surface of specimens made of CL20ES and CL50WS metal powders during subsequent annealing. Oxidation is more intense for maraging steel (CL50WS). Comparing the results of CEMS (the mean free path of conversion electrons in steel is about 0.5 μm) and CXMS (the mean free path of conversion X-ray photons in steel is about 20 μm), this leads to the conclusion that the oxidation occurs predominantly in the surface layer thinner than 1 μm. The SEM identified residues of the initial powders welded to the specimen, these residues can be removed by mechanical treatment, for example, by sandblasting, which was used in this work.

Author Contributions

Conceptualization, M.M. and H.D.; methodology, F.L., M.M., and H.D.; software, F.L.; validation, F.L., M.M., T.I. (Tomáš Ingr), and T.I. (Tatiana Ivanova); formal analysis, F.L. and M.M.; investigation, F.L., M.M., T.I. (Tomáš Ingr), and T.I. (Tatiana Ivanova); resources, H.D.; data curation, F.L., M.M., T.I. (Tomáš Ingr), and T.I. (Tatiana Ivanova); writing—original draft preparation, F.L. and M.M.; writing—review and editing, F.L. and M.M.; visualization, F.L. and M.M.; supervision, M.M.; project administration, F.L.; funding acquisition, F.L. All authors have read and agreed to the published version of the manuscript.

Funding

This research was funded by the Czech Ministry of Education, Youth and Sports, grant number CZ.02.1.01/0.0/0.0/17_049/0008408.

Institutional Review Board Statement

Not applicable.

Informed Consent Statement

Not applicable.

Data Availability Statement

Publicly available datasets were analyzed in this study. This data can be found here: https://uloz.to/file/9gKJ4eysztqo/primarni-data-zip#!ZGp5LGR2ZmpjBGLmZGSwLGNjAwNlZT9kqUcZZ3ODFRkVnmx4Zt==.

Conflicts of Interest

The authors declare no conflict of interest. The funders had no role in the design of the study; in the collection, analyses, or interpretation of data; in the writing of the manuscript, or in the decision to publish the results.

References

  1. Afkhami, S.; Dabiri, M.; Alavi, S.H.; Björk, T.; Salminen, A. Fatigue characteristics of steels manufactured by selective laser melting. Int. J. Fatigue 2019, 122, 72–83. [Google Scholar] [CrossRef]
  2. Kruth, J.; Froyen, L.; Van Vaerenbergh, J.; Mercelis, P.; Rombouts, M.; Lauwers, B. Selective laser melting of iron-based powder. J. Mater. Process. Technol. 2004, 149, 616–622. [Google Scholar] [CrossRef]
  3. Frazier, W.E. Metal Additive Manufacturing: A Review. J. Mater. Eng. Perform. 2014, 23, 1917–1928. [Google Scholar] [CrossRef]
  4. Patel, C.M.; Patel, S.B.; Shah, M.K. Experimental Investigation of Mechanical Properties and Surface Roughness of CL50WS Material Parts Made by Selective Laser Sintering Process. Int. J. Sci. Res. Dev. 2015, 3, 306–310. [Google Scholar]
  5. Jägle, E.A.; Sheng, Z.; Kürnsteiner, P.; Ocylok, S.; Weisheit, A.; Raabe, D. Comparison of Maraging Steel Micro- and Nanostructure Produced Conventionally and by Laser Additive Manufacturing. Materials 2016, 10, 8. [Google Scholar] [CrossRef] [Green Version]
  6. Al-Ketan, O.; Rowshan, R.; Abu Al-Rub, R.K. Topology-mechanical property relationship of 3D printed strut, skeletal, and sheet based periodic metallic cellular materials. Addit. Manuf. 2018, 19, 167–183. [Google Scholar] [CrossRef]
  7. Gainov, R.; Faidel, D.; Behr, W.; Natour, G.; Pauly, F.; Willms, H.; Vagizov, F. Investigation of LPBF A800H steel parts using Computed Tomography and Mössbauer spectroscopy. Addit. Manuf. 2020, 32, 101035. [Google Scholar] [CrossRef]
  8. Zirhli, O.; Akdogan, N.G.; Odeh, Y.N.; Misirlioglu, I.B.; Devlin, E.; Akdogan, O. Fabrication and Characterization of Fe 16 N 2 Micro-Flake Powders and Their Extrusion-Based 3D Printing into Permanent Magnet Form. Adv. Eng. Mater. 2020, 22, 2000311. [Google Scholar] [CrossRef]
  9. Mashlan, M.; Linderhof, F.; Davidova, M.; Kubickova, H.; Zemtsova, E. Changes of phase composition of maraging steel 1.2709 during selective laser melting. Hyperfine Interact. 2019, 241, 11. [Google Scholar] [CrossRef]
  10. Tyczyński, P.; Siemiątkowski, Z.; Bąk, P.; Warzocha, K.; Rucki, M.; Szumiata, T. Performance of Maraging Steel Sleeves Produced by SLM with Subsequent Age Hardening. Materials 2020, 13, 3408. [Google Scholar] [CrossRef] [PubMed]
  11. Nomura, K.; Ujihira, Y.; Vertes, A. Applications of conversion electron Mössbauer spectrometry (CEMS). J. Radioanal. Nucl. Chem. 1996, 202, 103–199. [Google Scholar] [CrossRef]
  12. Principi, G. The Mössbauer Effect: A Romantic Scientific Page. Metals 2020, 10, 992. [Google Scholar] [CrossRef]
  13. Bandyopadhyay, D. Study of materials using Mössbauer spectroscopy. Int. Mater. Rev. 2006, 51, 171–208. [Google Scholar] [CrossRef]
  14. Shabashov, V.A.; Sagaradze, V.V.; Kozlov, K.A.; Ustyugov, Y.M. Atomic Order and Submicrostructure in Iron Alloys at Megaplastic Deformation. Metals 2018, 8, 995. [Google Scholar] [CrossRef] [Green Version]
  15. Kholmetskii, A.L.; Uglov, V.V.; Khodasevich, V.V.; Anischik, V.M.; Ponaryadov, V.V.; Mashlan, M. Application of the Mössbauer Effect in Some Tribological Problems. Mössbauer Spectrosc. Mater. Sci. 1999, 66, 215–226. [Google Scholar] [CrossRef]
  16. Krauss, G. Tempering of Lath Martensite in Low and Medium Carbon Steels: Assessment and Challenges. Steel Res. Int. 2017, 88, 1700038. [Google Scholar] [CrossRef]
  17. Kalman, E.; Lakatos, M.; Kármán, F.; Nagy, F.; Klencsár, Z.; Vértes, A. Mössbauer Spectroscopy for Characterization of Corrosion Products and Electrochemically Formed Layers. Corros. Rev. 2005, 23, 1–106. [Google Scholar] [CrossRef]
  18. Graham, M.J.; Hussey, R.J. Analytical techniques in high temperature corrosion. Oxid. Met. 1995, 44, 339–374. [Google Scholar] [CrossRef]
  19. Schaaf, P. Laser nitriding of metals. Prog. Mater. Sci. 2002, 47, 1–161. [Google Scholar] [CrossRef]
  20. Carbucicchio, M.; Palonibarini, G. Surface structures produced in 1C-1.5Cr and 0.38C-Ni-Cr-Mo steels by high-power CO2 laser processing. J. Mater. Sci. 1986, 21, 75–82. [Google Scholar] [CrossRef]
  21. Tan, J.H.; Wong, W.L.E.; Dalgarno, K.W. An overview of powder granulometry on feedstock and part performance in the selective laser melting process. Addit. Manuf. 2017, 18, 228–255. [Google Scholar] [CrossRef] [Green Version]
  22. Fayazfar, H.; Salarian, M.; Rogalsky, A.; Sarker, D.; Russo, P.; Paserin, V.; Toyserkani, E. A critical review of powder-based additive manufacturing of ferrous alloys: Process parameters, microstructure and mechanical properties. Mater. Des. 2018, 144, 98–128. [Google Scholar] [CrossRef]
  23. Sander, G.; Tan, J.; Balan, P.; Gharbi, O.; Feenstra, D.; Singer, L.; Thomas, S.; Kelly, R.; Scully, J.; Birbilis, N. Corrosion of Additively Manufactured Alloys: A Review. Corrosion 2018, 74, 1318–1350. [Google Scholar] [CrossRef] [Green Version]
  24. Zai, L.; Zhang, C.; Wang, Y.; Guo, W.; Wellmann, D.; Tong, X.; Tian, Y. Laser Powder Bed Fusion of Precipitation-Hardened Martensitic Stainless Steels: A Review. Metals 2020, 10, 255. [Google Scholar] [CrossRef] [Green Version]
  25. Farias, M.; Souza, R.; Sinatora, A.; Tanaka, D. The influence of applied load, sliding velocity and martensitic transformation on the unlubricated sliding wear of austenitic stainless steels. Wear 2007, 263, 773–781. [Google Scholar] [CrossRef]
  26. Waanders, F.; Vorster, S.; Engelbrecht, A. Mössbauer and SEM characterisation of the scale on type 304 stainless steel. Scr. Mater. 2000, 42, 997–1000. [Google Scholar] [CrossRef]
  27. Dubiel, S.M.; Cieślak, J.; Żukrowski, J. Distribution of Cr atoms in the surface zone of Fe-rich Fe–Cr alloys quenched into various media: Mössbauer spectroscopic study. Appl. Surf. Sci. 2015, 359, 526–532. [Google Scholar] [CrossRef]
  28. Idczak, R.; Idczak, K.; Konieczny, R. Oxidation and surface segregation of chromium in Fe–Cr alloys studied by Mössbauer and X-ray photoelectron spectroscopy. J. Nucl. Mater. 2014, 452, 141–146. [Google Scholar] [CrossRef]
  29. Amulevičius, A.; Mažeika, K.; Sipavičius, Č. Oxidation of Stainless Steel by Laser Cutting. Acta Phys. Pol. A 2009, 115, 880–885. [Google Scholar] [CrossRef]
  30. Sartowska, B.; Piekoszewski, J.; Walis, L.; Starosta, W.; Barlak, M.; Nowicki, L.; Ratajczak, R. Application of nuclear tech-niques for characterization of materials surfaces: Own investigations examples. Nukleonika 2012, 57, 521–528. [Google Scholar]
  31. Agudelo, A.; Gancedo, J.; Marco, J.; Creus, M.; Gallego-Lluesma, E.; Desimoni, J.; Mercader, R. Characterization and corrosion studies of laser-melted carbon steel surfaces. Appl. Surf. Sci. 1999, 148, 171–182. [Google Scholar] [CrossRef]
  32. Nomura, K. Basics and Application of Scattering Mössbauer Spectrometry to Analysis of Solid Surface. Radioisotopes 2014, 63, 405–427. [Google Scholar] [CrossRef] [Green Version]
  33. Kalogirou, O.; Stergioudis, G.; Haidar, O.; Tsipas, D. Identification of corrosion products resulting from accelerated oxidation process. Corros. Eng. Sci. Technol. 2009, 44, 469–473. [Google Scholar] [CrossRef]
  34. Ghayoor, M.; Lee, K.; He, Y.; Chang, C.-H.; Paul, B.K.; Pasebani, S. Selective laser melting of 304L stainless steel: Role of volumetric energy density on the microstructure, texture and mechanical properties. Addit. Manuf. 2020, 32, 101011. [Google Scholar] [CrossRef]
  35. Tascioglu, E.; Karabulut, Y.; Kaynak, Y. Influence of heat treatment temperature on the microstructural, mechanical, and wear behavior of 316L stainless steel fabricated by laser powder bed additive manufacturing. Int. J. Adv. Manuf. Technol. 2020, 107, 1947–1956. [Google Scholar] [CrossRef]
  36. Yan, J.; Zhou, Y.; Gu, R.; Zhang, X.; Quach, W.-M.; Yan, M. A Comprehensive Study of Steel Powders (316L, H13, P20 and 18Ni300) for Their Selective Laser Melting Additive Manufacturing. Metals 2019, 9, 86. [Google Scholar] [CrossRef] [Green Version]
  37. Pechoušek, J.; Mashlan, M. Mössbauer spectrometer as a virtual instrument in the PXI/Compact PCI modular system. Czechoslov. J. Phys. 2005, 55, 853–863. [Google Scholar] [CrossRef]
  38. Kholmetskii, A.; Misevich, O.; Mashlan, M.; Chudakov, V.; Anashkevich, A.; Gurachevskii, V. Air scintillation detector for conversion electrons Mössbauer spectroscopy (CEMS). Nucl. Instruments Methods Phys. Res. Sect. B Beam Interact. Mater. Atoms 1997, 129, 110–116. [Google Scholar] [CrossRef]
  39. Klencsár, Z.; Kuzmann, E.; Vértes, A. User-friendly software for Mössbauer spectrum analysis. J. Radioanal. Nucl. Chem. 1996, 210, 105–118. [Google Scholar] [CrossRef]
  40. Cook, D.C. Strain induced martensite formation in stainless steel. Met. Mater. Trans. A 1987, 18, 201–210. [Google Scholar] [CrossRef]
  41. Ovchinnikov, V.V. Mössbauer Analysis of the Atomic and Magnetic Structure of Alloys; Cambridge International Science Publishing: Cambridge, UK, 2006; p. 248. [Google Scholar]
  42. Kuzmann, E.; Nagy, S.; Vertes, A. Critical review of analytical applications of Mössbauer spectroscopy illustrated by mineralogical and geological examples (IUPAC Technical Report). Pure Appl. Chem. 2003, 75, 801–858. [Google Scholar] [CrossRef] [Green Version]
Figure 1. All six test samples ordered by the material they are made of and the treatment they underwent.
Metals 11 01028 g001
Figure 2. Morphology of the CL20ES powder used for SLM with (a) 1.49k× SEM magnification and (b) 1.65k× SEM magnification.
Metals 11 01028 g002
Figure 3. Morphology of the CL50WS powder used for SLM [9], (a) 399× SEM magnification and (b) 1.65k× SEM magnification.
Metals 11 01028 g003
Figure 4. SEM images of the CL20ES specimen surface (a) Sample 1; (b) Sample 2 and (c) Sample 3.
Metals 11 01028 g004
Figure 5. SEM images of the CL50WS specimen surface (a) Sample 4; (b) Sample 5 and (c) Sample 6.
Metals 11 01028 g005
Figure 6. Surface profile of (a) Sample 2 and (b) Sample 3.
Metals 11 01028 g006
Figure 7. Surface profile of (a) Sample 5 and (b) Sample 6.
Metals 11 01028 g007
Figure 8. Mössbauer transmission spectra of initial powders (a) CL20ES and (b) CL50WS.
Metals 11 01028 g008
Figure 9. CEMS of (a) Sample2 (CL20ES) and Sample5 (CL50WS); (b) Sample3 (CL20ES) and Sample 6 (CL50WS).
Metals 11 01028 g009
Figure 10. CXMS of (a) Sample 2 (CL20ES) and Sample 5 (CL50WS); (b) Sample 3 (CL20ES) and Sample 6 (CL50WS).
Metals 11 01028 g010
Figure 11. XRD of initial metal powders: (a) CL20ES and (b) CL50WS.
Metals 11 01028 g011
Figure 12. XRD of (a) Sample1 (CL20ES) and (b) Sample4 (CL50WS).
Metals 11 01028 g012
Figure 13. XRD of (a) Sample2 (CL20ES) and (b) Sample5 (CL50WS).
Metals 11 01028 g013
Figure 14. XRD of (a) Sample 3 (CL20ES) and (b) Sample 6 (CL50WS).
Metals 11 01028 g014
Table 1. Chemical composition of the metal powders (material data Concept Laser GmbH).
Steel PowderElement Concentration, wt %
FeCSiMnPSCrMoNiTiCo
CL20ESBalance≤0.030–1.00–2.0≤0.045≤0.0316.5–18.52.0–2.510.0–13.0--
CL50WSBalance≤0.03≤0.1≤0.15≤0.01≤0.01≤0.254.5–5.217.0–19.00.80–1.208.50–10.0
Table 2. Parameters of transmission Mössbauer spectra of initial powders.
PowderPhaseIS (mm/s)QS (mm/s)FWHM (mm/s)B (T)A (%)
CL20ESaustenitic−0.11 ± 0.110.18 ± 0.010.32 ± 0.01100
CL50WSaustenitic−0.06 ± 0.010.16 ± 0.020.34 ± 0.028 ± 1
ferritic0.02 ± 0.010.27 ± 0.0131.7 192 ± 1
1 Distribution of hyperfine magnetic field.
Table 3. Parameters of CEMS.
SamplePowderPhaseIS (mm/s)QS (mm/s)FWHM (mm/s)B (T)A (%)
Sample1CL20ESaustenitic−0.12 ± 0.010.15 ± 0.010.25 ± 0.02100
Sample4CL50WSaustenitic−0.12 ± 0.040.25 ± 0.080.29 ± 0.028 ± 1
ferritic0.02 ± 0.010.19 ± 0.0231.4 192 ± 1
Sample2CL20ESaustenitic−0.12 ± 0.010.15 ± 0.010.24 ± 0.0242 ± 1
α-Fe2O30.36 ± 0.01−0.15 ± 0.020.41 ± 0.0251.9 ± 0.558 ± 1
Sample5CL50WSα-Fe2O30.36 ± 0.01−0.18 ± 0.020.44 ± 0.0251.9 ± 0.5100
Sample3CL20ESaustenitic−0.11 ± 0.010.16 ± 0.010.27 ± 0.01100
Sample6CL50WSaustenitic−0.15 ± 0.020.11 ± 0.040.29 ± 0.039 ± 1
ferritic0.01 ± 0.010.23 ± 0.0331.4 191 ± 1
1 Distribution of hyperfine magnetic field.
Table 4. Parameters of CXMS.
SamplePowderPhaseIS (mm/s)QS (mm/s)FWHM (mm/s)B (T)A (%)
Sample1CL20ESaustenitic−0.12 ± 0.020.17 ± 0.010.31 ± 0.01100
Sample4CL50WSaustenitic−0.08 ± 0.010.21 ± 0.080.27 ± 0.039 ± 1
ferritic0.05 ± 0.010.21 ± 0.0329.5 191 ± 1
Sample2CL20ESaustenitic−0.08 ± 0.010.17 ± 0.010.30 ± 0.01100
Sample5CL50WSaustenitic−0.13 ± 0.030.17 ± 0.030.26 ± 0.059 ± 1
ferritic0.03 ± 0.01-0.22 ± 0.0331.2 180 ± 1
α-Fe2O30.37 ± 0.02−0.20 ± 0.050.34 ± 0.0750.8 ± 0.311 ± 1
Sample3CL20ESaustenitic−0.08 ± 0.010.18 ± 0.010.30 ± 0.01100
Sample6CL50WSaustenitic−0.08 ± 0.010.18 ± 0.010.279
ferritic0.05 ± 0.010.23 ± 0.0232.0 191 ± 1
1 Distribution of hyperfine magnetic field.
Publisher’s Note: MDPI stays neutral with regard to jurisdictional claims in published maps and institutional affiliations.