Article

Effect of ECAP on the Plastic Strain Homogeneity, Microstructural Evolution, Crystallographic Texture and Mechanical Properties of AA2xxx Aluminum Alloy

1
Production Engineering and Mechanical Engineering Department, Faculty of Engineering, Port Said University, Port Fouad 42534, Egypt
2
Mechanical Engineering Department, College of Engineering at Al Kharj, Prince Sattam Bin Abdulaziz University, Al Kharj 11942, Saudi Arabia
3
Metallurgical and Materials Engineering Department, Faculty of Petroleum and Mining Engineering, Suez University, Suez 43511, Egypt
4
Dean of Engineering and Technological Industries Faculties, King Salman International University, South Sinai 45615, Egypt
5
École de Technologie Supérieure, Department of Mechanical Engineering, 1100 Notre-Dame West, Montreal, QC H4J1J9, Canada
6
Department of Mechanical Engineering, College of Engineering, Qassim University, Unaizah 51911, Saudi Arabia
7
Mechanical Engineering Department, Faculty of Engineering, Suez Canal University, Ismailia 41522, Egypt
*
Author to whom correspondence should be addressed.
Metals 2021, 11(6), 938; https://doi.org/10.3390/met11060938
Submission received: 16 May 2021 / Revised: 1 June 2021 / Accepted: 3 June 2021 / Published: 9 June 2021
(This article belongs to the Special Issue Microstructure and Mechanical Properties of Aluminum Alloys)

Abstract

:
This study presents a comprehensive evaluation of Equal Channel Angular Pressing (ECAP) processing on the structural evolution and mechanical properties of AA2xxx aluminum alloy. Finite element analysis (FE) was used to study the deformation behavior of the AA2xxx billets during processing in addition investigate the strain homogeneity in the longitudinal and transverse direction. Billets of AA2011 aluminum alloy were processed successfully through ECAP up to 4-passes with rotating the sample 90° along its longitudinal axis in the same direction after each pass (route Bc) at 150 °C. The microstructural evolution and crystallographic texture were analyzed using the electron back-scatter diffraction (EBSD) and optical microscopy (OM). An evaluation of the hardness and tensile properties was presented and correlated with the EBSD findings and FE simulations. The FE analysis results were in good agreement with the experimental finding and microstructural evolution. Processing through 4-passes produced an ultrafine-grained structure (UFG) and a recrystallized fine grain dominated the structure coupled with a geometric grain subdivision which indicated by grain refining and very high density of substructures. This reduction in grain size was coupled with an enhancement in the hardness, tensile strength by 66.6%, and 52%, respectively compared to the as-annealed counterpart. Processing through 1-pass and 2-passes resulted in a strong texture with significant rotation for the texture components whereas 4-passes processing led to losing the symmetry of the texture with significant reduction in the texture intensity.

1. Introduction

Aeronautical, terrestrial and marine transport applications are faced with extreme lightweight design requirements. Aluminum alloys are ideal materials for these purposes because they have good mechanical properties at relatively low densities [1,2]. Because of their high mechanical performances, the aluminum alloys 7xxx and 2xxxx series are widely used for aerospace, automotive and defense structural parts in many different structural elements [2,3,4,5]. The aluminum alloys AA2xxx series also reveal a high resistance to weight and, in structural applications, a high resistance, excellent resistance to corrosion, good surface finishing and in particular low density [2,6,7,8]. The as-cast microstructure of high Cu content alloys is typically made of aluminum matrix supersaturated with Cu solutes and coarse eutectic Q-Phase (Al2Cu) [9]. The good features such as high hardness, wear resistance, and strength compared with other alloys with a high Cu content revealed in this case that these alloys have a hard step of the Al2Cu-forming effect [10]. The heterogeneous distribution of the Al2Cu fragility process along grain frontiers hampers its widespread use in industrial applications [11], on the other hand. Moreover, earlier studies have shown that 2xxx series are to replace 7xxx alloys gradually because of their high mechanical strength and lower density [12]. In the other hand, some material testing studies have shown that, depending on Hall-Petch relationship, the power of metallic materials with refined microstructuring increases [13,14,15,16,17,18,19,20]. The key reason in the last decade was therefore the development of ultrafine grained AA2xxx aluminum alloys (UFG), which led to considerable improvements in mechanical characteristics [21].
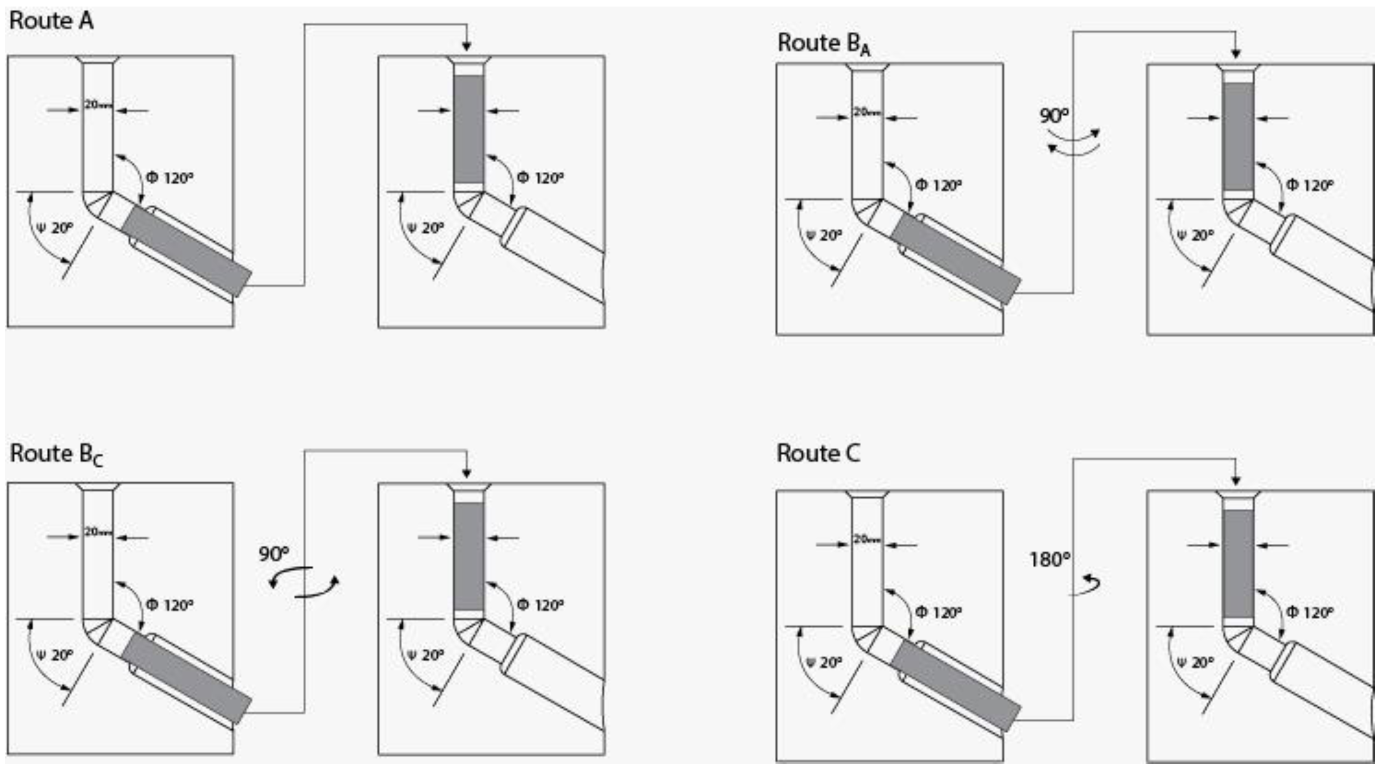
Currently, the most suitable route for producing UFG materials is the use of severe plastic deformation (SPD) techniques which can effectively enhance grain refining for industrial applications [22,23]. Several methods have been originated for processing SPD such as equal channel angular pressing (ECAP) [14,24,25,26,27], high-pressure torsion [18,19,20], twist extrusion (TE) [28], accumulative rolling bonding [29], multi-directional forging [30], multi-channel spiral twist extrude (MCSTE) [15,16,17,31], friction stir welding [32,33,34], rolling in a three high skew rolling mill [35], and extrusion with KOBO [36] for improving ductility and mechanical properties in a wide range of materials. Among various SPD techniques, ECAP fulfilled almost all expectations of an SPD process such as producing nanostructure or UFG structure in metals and alloys as well as its applicability to industrial needs [37,38,39,40]. Within ECAP, a processed sample (ECAPed), which has a high shear strain, consists with two intersecting channels of equal cross-sections intersecting at a channel angle Φ and with a curvature angle Ψ [41] as shown in Figure 1, experiences a considerable amount of shear strain during processing in the ECAP die. It is worth to mentioning here that, the strain can also be altered in ECAP by rotating the rod about an axis along its length. The common routes are: route A, with no rod rotating between subsequent passes; route BA, the sample is rotated 90° clockwise and counterclockwise in alternate passes; route Bc with rod rotating 90° between the subsequent passes; and route C, the sample is rotated 180° as shown in Figure 1. The equivalent plastic strain exerted on the ECAPed sample depends primarily on the angles of die and the number of processing passes [42]. From the following relation can be determined the magnitude of equivalently effective plastic strain (εeq) after n passes [43]:
ε e q = N 3 [ 2 c o t φ + ψ 2 + ψ   c o s e c φ + ψ 2 ]
where n is number of passes, φ is the internal channel angle of the die, and Ψ is the curvature angle of the ECAP die.
During the past few years, several researchers have studied various facets of the ECAP mechanism and have revealed their effects on the mechanical properties of AA2xxx. Romero-Resendiz, et al. [44] found that maximum hardness and grain refinement of the AA2017 alloy depicted after the first ECAP pass after which a gradual decrease in the hardness and grain refinement was appeared due to the dynamic recovery phenomenon.
Roshan et al. [45] found that ECAP processing of AA2014 through more than one pass at room is not possible and causes damage. On the other hand, 1-pass processing experiences a notable effect on the strength of the material. Venkatachalam et al. [46] noted that processing AA2014 through ECAP through route Bc experiences significant improvement in both the hardness and strength compared to route A, Ba, and C (see Figure 2) counterpart due to the continuous deformation in all the planes which could cause effective strain homogenization. The effect of hot forming cold die quenching ECAP on the hardness, mechanical properties and microstructure of AA2024 is investigated in [47,48]. They found that processing via 1-pass experienced a significant increase in the hardness and the yield strength. Goodarzy et al. [49] explored the effect of subsequent annealing after ECAP processing on both the hardness and yield strength of AA2024, they noted that a further improvement on hardness and yield strength of the ECAPed samples coupled with a considerable homogenization in the microstructure compared to the naturally-aged samples. The effect of Cu content on the hardness and mechanical properties was studied in [50]. The noted that increasing both the number of ECAP passes and the Cu content resulted in increasing the ultimate strength and the proof strength, while increasing the Cu content up to 2wt% revealed decreasing in the ductility. On the other hand, increasing the Cu content up to 5wt% showed further increase in the ductility after the first pass.
The finite element technique (FE) is considered is one of the most effective techniques to analyze engineering problems [39,51]. The deformation process, strain and stress distribution, metal flow and simulated relation between the processing load and plunger displacement plots during ECAP processing can be obtained using FE [52,53]. El-Mahallawy et al. [51] conducted a rigid-viscoplastic 3D FE simulations for Al-xCu with Cu content ranged from 0-up to- 5wt% and they noted that the imposed strain during ECAP was maximum in the inner side of the die angle Ψ where the sample contacted with the ECAP die, whereas the imposed strain in the outer side was much lower. Moreover, with the increase in ECAP and copper content, the strain was more homogenous. Mishra et al. [54] simulated the ECAP AA6063 processing using a 110° angle and found that the die channel angle and the tension between sample and die walls were the most effective parameters on the effective pressure. In [55] similar conclusions were concluded. The strain hardening and grain refinement of aluminum alloys during ECAP processing was calculated with dislocation evolution model in [56].
Based on the aforementioned literature, we can see that unfortunately there is a lack of works available on AA2011aluminum alloy processed by ECAP. The objective of the current study is to provide a detailed mapping of the deformation behavior of AA2011 during ECAP as function of increasing the imposed strain via accumulating the shear strain by increasing the number of processing passes using FE simulation. The simulation finding were verified experimentally using the distribution of the hardness values on planes cut parallel and perpendicular to the extrusion direction. In addition, a comprehensive analysis of the effect of ECAP processing on microstructural evolution, crystallographic texture, and mechanical properties were carried out. Finally, the interrelations between the FE simulation, microstructural evolution, mechanical properties, and hardness distribution were presented.

2. Materials and Methods

2.1. Finite Element Method

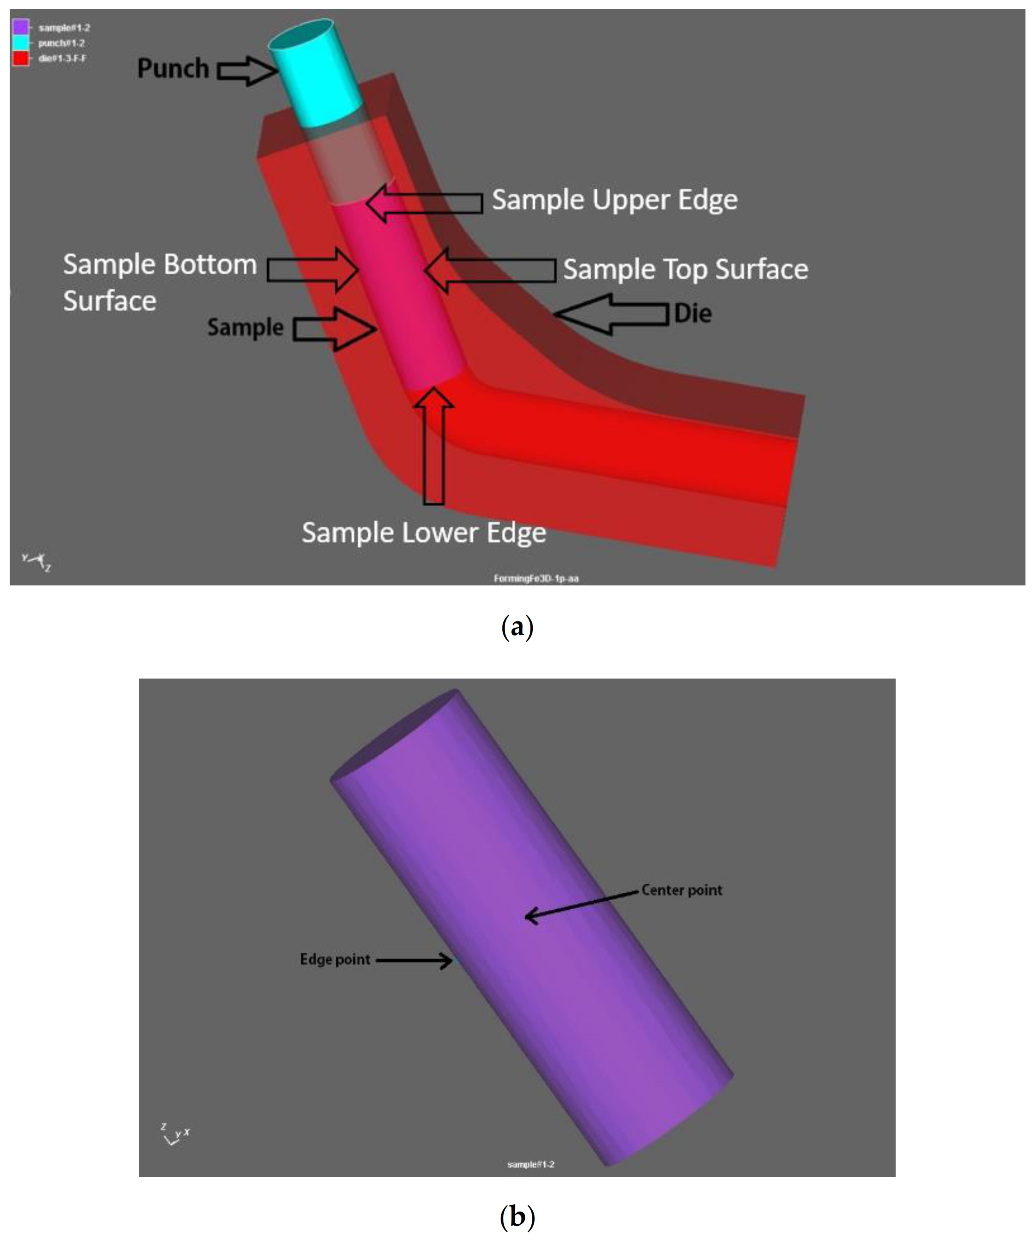
Finite element (FE) analysis was carried out to study the accumulated strain and stress distribution along the sample’s longitudinal and transverse sections (LS and TS) of AA2011 alloy during ECAP processing using a commercial software (Simufact-forming® v18, Simufact Engineering GmbH, Hamburg, Germany). Similar to the experimental work, the FE simulation was carried out at 150 °C via route Bc. To simulate the ECAP process, the worm forming extrusion module was used. The model consisted of the plunger, the ECAP die that consists of two halves, and the ECAPed billets which were prepared by the Solidworks software® (2019, Dassault Systèmes, Villacoublay Cedex, France). The ECAP die and the punch (shown in Figure 3a) considered for FE analyses were made of high strength steel. For clarity and improved visualization, all parts were invisible apart from the AA2011 samples during simulation. The 2-half die, and the plunger were modeled as discrete rigid elements made of an imaginary non-formable material whereas the AA2011 rod was modeled as a deformable object. The die and AA2011 sample dimensions were identical to experimental values. Depending on the local strain conditions, the internal surface of the ECAP movement and the external surface of the sample can be in near contact. AA2011 alloy was selected from the FE software package built-in library as the material of the sample and its mechanical and thermal properties were pre-described. In addition, it has been used for 0.5 mm mesh hexahedral mesh, which is commonly used in computational modelling with 3D normal forms. This gave a total number of nodes ranging from 9500 to 15,000 elements depending on specimen’s degree of distortion and in accordance with the mesh sensitivity analysis. Any improvements in the geometry and dimensions of the ECAPed billet’s is taken into account as an extra precaution because of the deformation. When the components became too skewed during ECAP simulation, the mesh system was immediately revised. Re-meshing criteria were used based on a strain change of 0.1 mm and an element size of 1 mm. For the ECAPed material was modeled both as an isotropic linear elastic material and as a strain hardenable rigid plastic material. Tracked elements located at the plane in the middle of the specimen at the edge where max strain occurs and at the center where SPD has the lowest effect as shown in Figure 3b.
The regions chosen were at the edge where max strain occurs and at the center where SPD has the lowest effect. Ram speed was chosen to be 0.05 mm/s, which equal the ram speed used experimentally. In previous studies [55,57], the coefficient of friction of μ = 0.05–0.1 showed good results. The Coulomb friction model was then used in this analysis with a die friction factor of 0.05. To model and study the behavior of the material during deformation, the Simufact-forming software used the material model shown in Equation (2). The material model parameters for AA2021 is presented in Table 1. Figure 4 shows FE simulation stages of the AA2011 aluminum alloy:
σ = c 1 × e c 2 · T × φ n 1 · T + n 2 × e I 1 · T + I 2 φ × φ ˙ m 1 · T + m 2
where T is the processing temperature, φ is the strain, φ ˙ is the strain rate, and c1, c2, n1, n2, l1, l2, m1, m2 are a model constant which depend on the processing material.
For multiple passes, from the last step in the previous simulation, geometry data is interpolated in the first step of any new pass. The Bc route has been modeled by the software positioning option, in which the last step sample of each pass was used as the first step sample of the next pass. The next step. The ECAPed sample was rotated with angle of 90° around its axis after each pass (route Bc).

2.2. Experimental Procedure

Experiments out on a commercial AA2011 billets with a chemical composition of shown were carried in Table 2, which were received in the form of rolled billets with a 20 mm diameter and length of 500 mm. The AA2011 billets were sectioned and machined using high precision cutting machine to form ECAP samples with a diameter of 20 mm and a length of 60 mm. The billets were annealed at 300 °C for 1 h before ECAP processing followed by furnace cooling to attain an initial homogenous and fully recrystallized starting microstructure.
AA2011 rods were processed through ECAP for 1, 2, and 4 passes through route Bc (with the sample being rotated 90° along its longitudinal axis in the same direction after each pass) at 150 °C with a ram speed of 0.05 mm/s. A graphite-based lubricant was applied to reduce the friction between the ECAPed samples and the die’s inner walls before each pass. The ECAP process was performed using a split die shown in Figure 1 in which the two parts of the channel intersected with an internal channel angle of φ = 120° and with an additional outer corner angle of ψ = 20°. The die geometry imposed an equivalent strain of about 0.65 per pass according to Equation (1).
Microstructural evolution of the AA2011 rods before and after ECAP was characterized using an optical micrograph (OM) and a field emission scanning electron microscope (FESEM, Hitachi, Ltd., Tokyo, Japan) which is equipped a NordlysMax2 EBSD detector. ECAPed rods preparation sequence was as follows: mounting the samples, followed by sample grinding, adequate polishing using alumina solution, and finally etching using Kroll’s reagent (92 mL distilled water, 6 mL HNO3, 2 mL HF) as a final preparation step.
EBSD was used to study the structural evolution and crystallographic texture of the AA2011-rods processed with multiple passes via ECAP. Figure 5a depicts references axes with respect to the ECAPed process. Samples for microstructural characterization (EBSD) were cut from the center of the ECAP samples along their LS on the plane parallel to the pressing direction (flow plane) and perpendicular to the entry channel of the die), where the axes of the reference system coincide with the extrusion ECAP direction “Y” (ED), the normal direction “Z” (ND) and the transversal direction “X” (TD).
The investigated specimens were grinded and mechanically polished with a tripod polisher down to 1 µm diamond particle. A final chemical-mechanically polishing with 0.05 µm colloidal silica was performed for 24 h with a BUEHLER Vibrometer (Buehler, Tucson, AZ, USA). The EBSD measurements were performed on top surface TD-ED plan using a SU-70 SEM (Hitachi, Ltd., Tokyo, Japan) operating at 15 kV and at a typical current of 1.5 nA. Crystallographic orientation maps were obtained using a HKL Channel 5 acquisition system made by Oxford Instruments (Concord, MA, USA). To achieve good statistical data due to the presence of coarser grains, a larger scan area was selected for as-annealed (AA) and processed samples. The EBSD scans were in stitched maps 2 × 3 to cover areas of 12,490 µm × 2750 µm with 3 µm step size. In order to minimize the measurements error and the deformation induced by the preparation stage, misorientations below 3° was not considered in the post-processing data procedure. Also, low angle grain boundaries (LAGB) were defined as misorientation angles between 3° and 15° and presented in white lines on the band contrast maps, while the high-angle grain boundaries (HAGB) were defined when misorientation angles were greater than 15° and presented in black lines on the band contrast maps. Certainly, all grains in the outer frame of each region of interest were excluded.
The billets before and after ECAP process were sectioned along the central longitudinal lines parallel and perpendicular to the extrusion direction, and then grinded and polished to a mirror-like surface. Vicker’s microhardness tests (HV) were conducted on the sample by taking readings following a rectilinear grid pattern with the spacing of 1 mm between each separate indentation starting at the billets’ peripheries and moving towards the center on sections that were cut near the top part of the ECAPed samples. This was conducted on both parallel and perpendicular sections to the extrusion direction to evaluate the hardness variation across the ECAPed rods’ LS and TS. The LS area with 20 mm diameter. Both the LS and TS were cut from the top part of the ECAPed billets. The hardness test was carried out under an applied load of 1 kg for 15 s. The displayed results were averaged over a minimum of 5 equi-spaced indentations. Additionally, the hardness profiles and their degrees of homogeneity were illustrated by color-coded outlines created to display the hardness distribution along the LS and TS of the ECAPed samples.
Tensile tests were performed on a 100 kN universal testing machine at room temperature with at a constant strain rate of 10−3 s−1 (Figure 5b). The tensile samples were prepared according to the specifications set by the American Society for Testing of Materials (E8M/ASTM). All the tensile samples were machined from the center of the ECAPed samples. Two tensile specimens were tested per processing condition to ensure an accurate display of the results.

3. Results

3.1. Finite Element Analysis

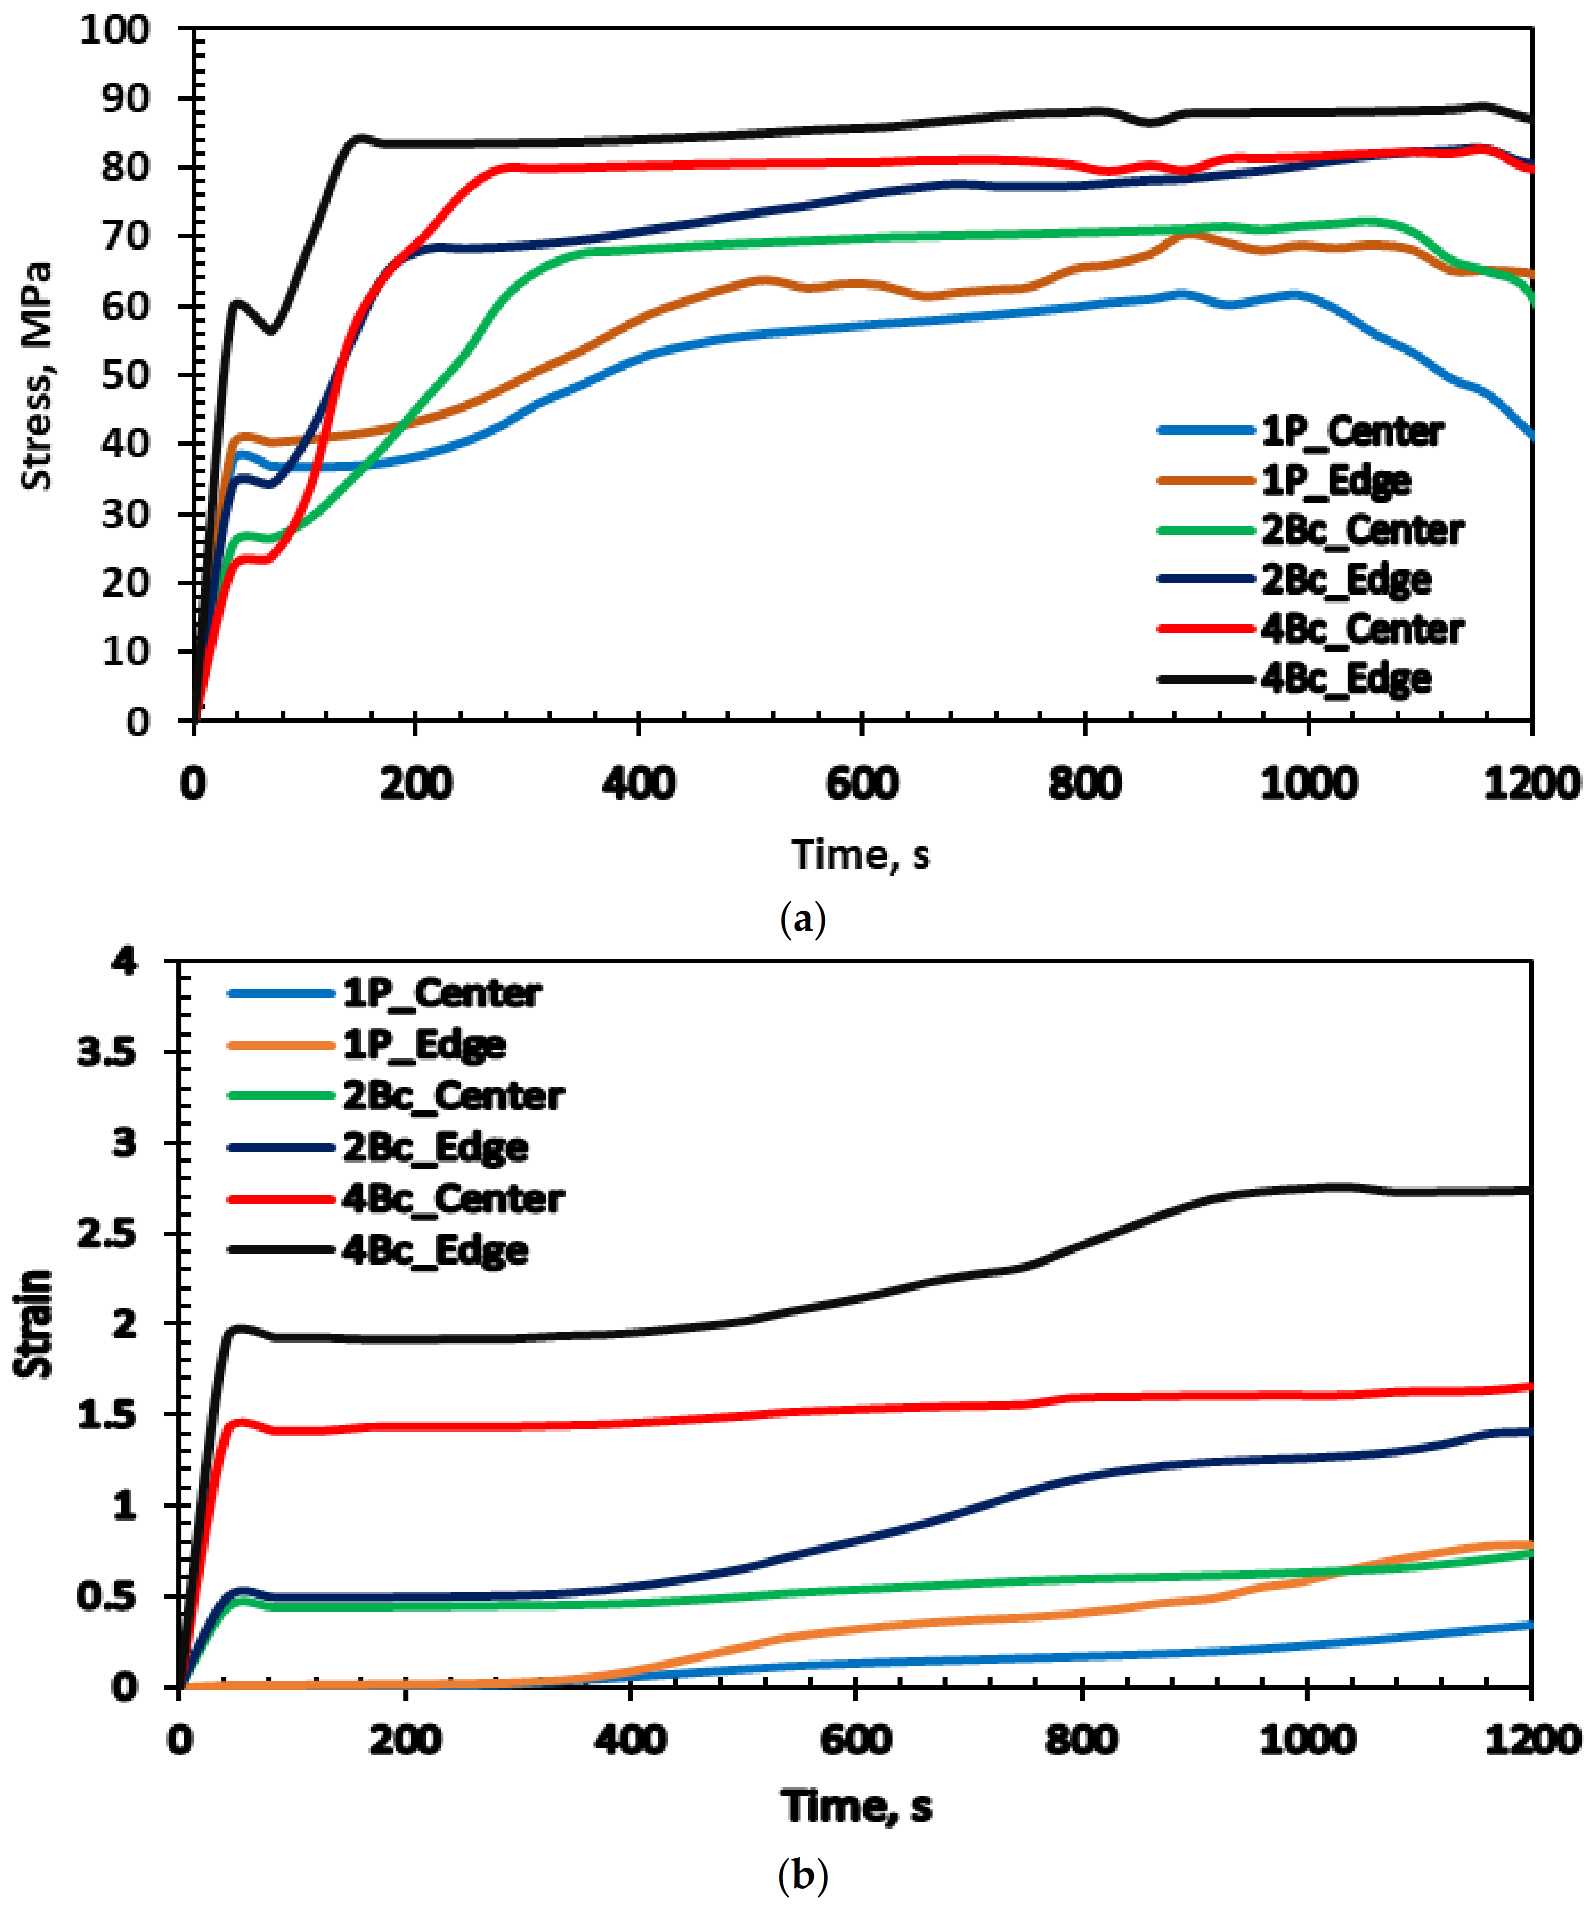
The equivalent stress distribution along the LS and TS which located at the right lower part of the Figure 6 of the ECAPed AA2011 samples processed through 1-pass (1-p), two passes of route Bc (2-Bc) and four passes of route Bc (4-Bc) at 150 °C are presented in 3D color contour maps in Figure 6. Similar plots for the strain distribution are shown in Figure 7. The TS was chosen near the top surface of the AA2011 billets. The ECAP die and plunger have been removed for better visualization. In addition, the stress and strain distribution as a function of pressing time at the points lay at the peripheral and central regions which had monitored by the particle tracking mode were displayed in Figure 8.
Figure 6, Figure 7 and Figure 8 revealed two interesting observations which were consistent for all processing conditions. First, the stress and strain fields exhibit an inhomogeneous distribution as the peripheral regions displayed higher stresses and strain compared to the central regions which can be explained by direct contact between the sample and the ECAP die walls. Second, the top part of the sample experienced higher stress and strain compared to the bottom part of the AA2011 processed samples (Figure 6 and Figure 7) which can be referred to the contact between the ECAPed sample with the corner angle of the ECAP die which agreed with earlier findings [58].
The lower values of effective stress and strain at the bottom part of the ECAPed samples can be attributed to the formation of corner gaps between the bottom of the sample and the die channel during the ECAP processing so that the specimen was no longer in contact with the die in this area [51]. On the other hand, increasing the friction between the sample and the ECAP die walls leads to decreasing the gap angle as reported in [59]. It was worth to mentioning here that, the middle part of the ECAPed sample along the LS shows the steady-stress and strain region (Figure 6 and Figure 7), while the upper and lower parts show inhomogeneous distribution. Figure 7 shows that the imposed strain during ECAP processing was not uniform along the LS of ECAPed sample for all condition processing. In addition, the effective strain increased greatly with increasing the number of ECAP passes. Besides, the distribution of the effective strain across the TS begun to become almost uniform at the 4-Bc condition. As shown in Figure 8a, for all the processing condition, the stress value experienced a drastic increase as the ECAPed sample entered the deformation zone until it reached a steady value followed by a notable decrease in the stress after completing the deformation process. In the first stage the dramatic increase of stress can be attributed to the friction effects between the AA2011 sample and the die inner wall. Whereas in the deformation zone, the AA2011 samples were gradually pushed down along the inner wall of the channel under the steadily stress. However, when the AA2011samples are pushed out of the deformation zone, the stress decreases as shown in Figure 8a. Accordingly, a proper agreement was obtained between the ECAP stress and the experimental one (Figure 8a). This finding is in a good agreement with previous study [60].
As shown in Figure 6a and Figure 8a, processing through 1-p resulted in a maximum stress of 70.5 MPa which was seen in the peripheral regions, whereas the central regions experienced a maximum stress of 61.7 MPa. Moreover, as shown in Figure 6a, it was clear that the head at the upper edge of the AA2011 billet showed higher stresses (70.5 MPa) compared to the lower edge (6.25 MPa) as a result of the direct contact between the sample’s upper part and the plunger which is in a good agreement with previous study [47]. It is worth to mentioning here that the stress distribution at the TS showed a fairly homogenous distribution where a stress of 68.75 MPa was depicted (Figure 6a). A similar trend was observed in the strain distribution (Figure 7a and Figure 8b), whereby 1-p processing resulted in higher values of the equivalent strain at the peripheral regions compared to the central regions. An equivalent strain of 0.7 was seen in the peripheral regions which showed a considerable agreement with the findings obtained from Equation (1), whereas a minimum strain of 0.34 was observed in the central regions. On the other hand, a maximum strain of 0.7 was revealed at the upper part whereas a strain of 0.188 was noted at the lower part of the sample (Figure 7a). The TS section of the strain distribution revealed a homogenous distribution where a strain of 0.56 was observed. The decrease of strain at the bottom part of the ECAPed samples compared to the top part can be explained by the formation of the corner gap, as the lower part of the ECAPed sample is no longer in contact with the die. Consequently, a lower degree of deformation occurred in the lower of the sample [59].
Increasing the processing up to 2-Bc resulted in an increase in the stress in the peripheral and central regions of the AA2011 billets by 14% and 16%, respectively, compared to the 1-p counterpart (Figure 6b and Figure 8a). A homogenous stress distribution was revealed at the TS with an average value of 81.25 MPa as shown in Figure 6b. On the other hand, straining via 2-Bc revealed an equivalent strain at the peripheral and central regions of 1.4 and 0.7, respectively (Figure 7b and Figure 8b). Further increasing of the ECAP passes up to 4-Bc resulted in further increases in the stress at the peripheral and central regions up to 88 and 80 MPa (Figure 6c and Figure 8a), respectively, coupled with an almost homogenous distribution of 81.25 MPa in the TS (Figure 6c). On the other hand, the effective strain experienced a significant increase up to 2.75 and 1.6 near the sample’s edge and center, respectively (Figure 7c and Figure 8b). Accordingly, this inconsistency in the stresses and plastic strain values recorded along both the LS and TS of the AA2011 ECAPed billets will significantly affect the homogeneity in the mechanical properties and microstructural features throughout the sample.

3.2. Microstructural Evolution Using Optical Microscopy

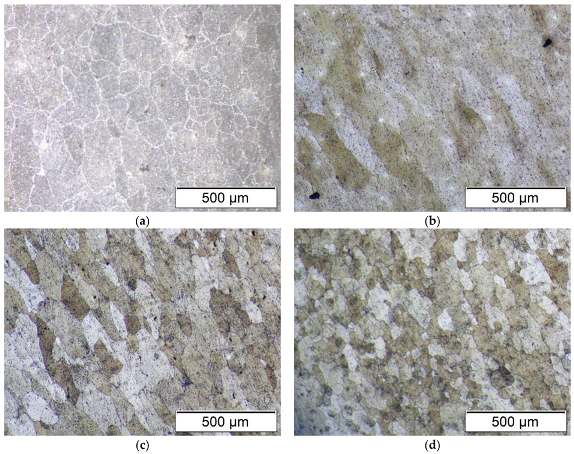
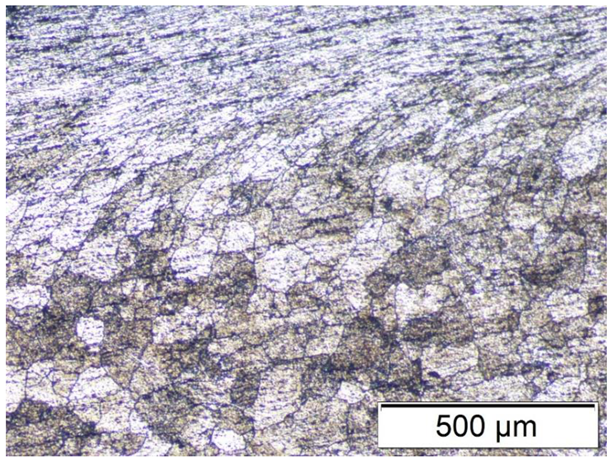
The OM of the AA and ECAPed AA2011 processed through 1-p, 2-Bc, and 4-Bc are shown in Figure 9. The microstructure of the AA sample consists mainly of relatively equiaxed coarse grains with average grain size of 122 μm (Figure 9a). Processing through ECAP via 1-p showed an elongated grain with a big width which aligned parallel to the extrusion direction as shown in Figure 9b. Increasing the accumulated strain up to 2-Bc revealed an elongated with a small width as shown in Figure 9c. On the other hand, after processing through 4-Bc, an UFG structure is homogeneously developed and the recrystallized fine grains dominated the structure forming a relatively UFG homogenous microstructure (Figure 9d). On comparison, 4-Bc condition (Figure 9d) showed a significant refinement in the grain size compared to the AA counterpart (Figure 9a). Notably, the grains near the peripheral regions of the AA2011 processed billets 2-Bc, compared to the AA condition, were elongated parallel to the direction of shear. Figure 10 depicts the material flow pattern at the peripheral regions of the AA2011 billets processed through 2-Bc along the longitudinal direction (flow direction).

3.3. Grain Structure and Crystallographic Texture

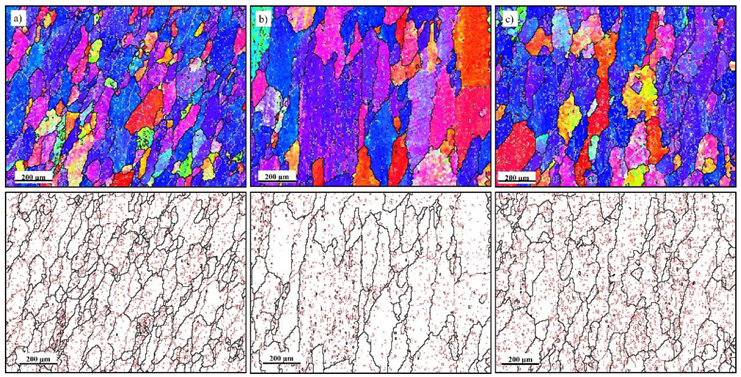
The grain structure and texture of the ECAP processed samples and the base material (BM) AA2011 were investigated using EBSD and the obtained data analyzed and compared. Figure 11 shows the inverse pole figure (IPF) coloring maps and their corresponding grain boundary maps with the high angle grain boundaries (HAGBs) of misorientation angle above 15° are outlined as black lines and low angle grain boundaries (LAGBs) of misorientation between 3° and 15° are depicted in red lines for the AA condition in (a), after ECAP processing for 1-p in (b), 2-Bc in (c) and 4-Bc in (d). The AA IPF map (Figure 11a) shows coarse recrystallized grains with very limited number of LAGB as can be seen from the (grain boundaries) GB map. The microstructure is of mixed extremely large equiaxed free of substructure grains and some relatively small grains with limited substructures. The maximum grain size is about 340 µm and the minimum grain size is 11.5 µm with average grain size of 51 µm. In terms of orientation it can be noted that the AA is dominated by a 100/red orientation. After ECAP processing for 1-p it can be observed that the grains are elongated and orientated with the extrusion direction with very high density of LAGBs can be observed in the maps Figure 11b. The average grain size is reduced after 1-Bc processing to be about 25 µm. It can be noted that the orientation is changed to be dominated by 111/blue orientation. After the second pass it can be observed that more deformation occurred with some reduction in the density of LAGB which can be attributed to dynamic recovery. This is supported by more reduction in the average grain size to 19 µm which indicates an additional portion of fine grains formed after 2-Bc ECAP processing Figure 11c.
After 4-Bc it can be observed that a geometric grain subdivision occurred due to the severe deformation experienced which was indicated by grain refining and very high density of substructures as can be seen in Figure 11d. The average grain size after 4-Bc found to be 8.5 µm. Figure 12 shows the grain size distribution for the AA2011 AA and after the ECAP processing. This grain size refinement after ECAP processing is in agreement with the results reported by Horita et al. [61] in their investigation of ECAP processing of different aluminum alloys. They reported that ECAP was successful in reducing the grain sizes to the submicrometer level in six different commercial, aluminum-based alloys. Abd El Aal and Sadawy [62] obtained ultrafine grains in pure aluminum after 10 passes of ECAP processing. Also Derakhshan et al. [63] reported grain refining and high density of dislocations after ECAP processing of commercial pure aluminum.
Figure 13 shows the 001, 101 and 111 pole figures for the AA and after different ECAP processing passes. The AA is mainly dominated by a strong cube texture with more than 12 times random that indicated by the C ({001}/<1–10>) components simple shear texture at their ideal positions. After ECAP processing for 1-p and 2-Bc, the texture is still strong with significant rotation for the texture components and can be followed through the rotation of the intense 001 pole. For the AA the intense 001 pole was aligned with the ND and after ECAP processing shifted towards the extrusion direction that keep rotation by the increase of the of passes. After 4-Bc it can be noted that the symmetry of the texture is almost lost with significant reduction in the texture intensity. This result is in agreement with the results reported by Figueroa et al. [64] in their study of the effect of the initial ECAP passes on the crystal texture of AA5083. They reported that the microstructural changes were associated with the loss of texture symmetry.
To investigate the microstructure homogeneity across the ECAP sample cross section, EBSD data were collected at the two edges of the sample in addition to the center data. Figure 14 shows the IPF maps for the data obtained across the sample cross section with their corresponding GB maps. The grain orientation is mainly dominated by 111/blue orientation. In terms of grain rotation, it can be observed that the grains at left edge is more rotated than the right edge and the center. Also the grain size average is smaller at the edges than that at the center. Moreover, the left edge showed smaller grain size average than the right edge. Figure 15 shows the grain size distribution and the grain averages are 16.5 µm, 25 µm and 18 µm at left edge, center and right edge, respectively. This can be attributed to the longer shearing path at the left edge than the right edge and center. The grain boundary maps almost show similar LAGB density across the three positions.

3.4. Mechanical Properties

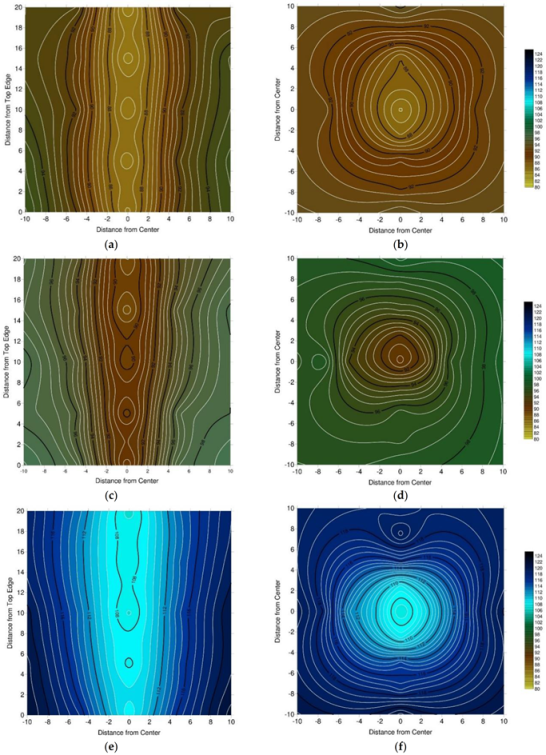
Vicker’s microhardness (HV) values of the AA2011 alloy processed through ECAP via 1-p, 2-Bc, and 4-Bc at 150 °C through across LS and TS cross-sections were plotted in color-codded contour maps as shown in Figure 16. The AA billet experienced almost a homogenous distribution across both the LS and the TS with average of HV = 72.
From Figure 16 it is clear that, a notable increase in the HV occurred as a function of increasing the number of ECAP passes. 1-p processing experienced a gradual increase of the HV along the central and peripheral as shown in Figure 16a, with the heights HV recorded were at the upper part along the periphery (95 HV) compared to that at the lower central part (86 HV). The observed increase in HV at the peripheral regions compared to the central regions can be attributed to the high friction between the ECAPed billets and the die walls. In addition, this observation matched perfectly with the heterogeneity in strain distribution shown in Figure 7 (higher imposed strain at the peripheral regions compared to the central one).
Similar observations were revealed at the TS (Figure 16b). Increasing the ECAP passes up to 2-Bc revealed an additional increase in the HV by 5% at both peripheral and central regions compared to 1-p counterparts (Figure 16c,d). A further increase the imposed strain up to 4-Bc revealed a significant increase in HV across the LS and TS as depicted in Figure 16e,f, respectively. HV-values at the peripheral region and the central regions recorded values of 66.6% and 50%, respectively, compared to the AA counterpart. Table 3 lists the average HV values measured at the peripheral and central regions of the AA2011 billets before and after ECAP. It is worth to mentioning here that the HV distribution across the TS displayed lower degree of inhomogeneity compared to the LS (Figure 16) which agreed with the FE findings shown in Figure 6, Figure 7 and Figure 8. Additionally, it is clear that increasing the equivalent strain by increasing the number of ECAP passes resulted in increasing the hardness from pass to pass which could be explained by the refinement of the grain size (as shown in Figure 11) which led to more work hardening which agreed with previous work [49].
A tensile test was carried out for the AA2011 billets before and after processing through 1-p, 2-Bc, and 4-Bc at 150 °C. Table 3 lists the proof yield strength (YS), ultimate tensile strength (UTS), and elongation percentage (EL%) of the AA2011 alloy. From Table 1, it is clear that processing through 1-p experienced an improvement in the YS and UTS by 6.3% and 14.9%, respectively coupled with improvement in the EL% by 15%. Increasing the straining up to 2-Bc resulted in a significant increase in the UTS and EL% by 24.8% and 95.6%, respectively compared to 1-p counterpart. On the other hand, 2-Bc condition showed a decrease in the YS by 14% which can be attributed to the strain softening which accompanies the ECAP processing at 150 °C [65,66]. Further increase of ECAP passes up to 4-Bc revealed additional increase in the UTS by 6% while an insignificant increase in YS and EL% compared to 2-Bc counterpart. These findings indicate that ECAP processing can improve the strength and the ductility simultaneously of the Al-Cu alloy [67]. It is worth to mentioning here that the notable increase in the UTS with increasing the number of ECAP passes can be attributed to the accumulation of strain after each pass resulting in more grain refinement (as shown in Figure 11). Similar findings reported in previous work [9,51]. On the other hand, the decrease in the YS after the first pass could be attributed to the dynamic recovery which results in dislocation annihilation and absorption at the boundaries of the UFG [17].
The tensile findings are in line with the grain size refinement and the relative increase in HAGBs (Figure 11) with increasing the number of ECAP deformation passes. Moreover, the intensity of the texture is notably increases with ECAP processing as a result of the strain accumulation, resulting in an increased UTS of the ECAPed billets. Furthermore, increasing the HAGBs in SPD processed metals exhibited an obvious effect in producing UFG materials with a higher strength and good ductility [68]. Additionally, the ECAP processing plays a vital role in secondary phases refinement which significantly contributes in strengthening of the alloy [24]. It is worth to mentioning here that, the precipitation and fragmentation of the θ phase in AA2xxx aluminum alloy are considered as the most important strengthening mechanism of Cu element [21,69]. On the other hand, ECAP processing leads to the presence of high dislocation density which hinder the mobility of dislocation hence, increase the hardness and tensile strength of the ECAPed billets [45]. Furthermore, the significant grain refinement shown in Figure 10 qualify the grain boundary strengthening mechanism in improving the mechanical properties of the AA2xxx aluminum alloy which agreed with previous work [9].

4. Conclusions

In this study, a detailed analysis of the effect of ECAP processing on strain homogeneity, microstructural evolution, crystallographic texture and mechanical properties of the AA2011 aluminum alloy was carried out. To this aim, a 3D FE analysis of AA2011 alloy during ECAP of routes Bc up to 4-passes was presented. In addition, EBSD analysis was carried out to investigate the grain structure evolution associated with processing AA2011 through ECAP along the LS of the sample from the right edge through the center to reach the left edge of the ECAPed billets. Finally, the interrelations between the FE simulation, microstructural evolution, mechanical properties, and hardness distribution were presented. The following conclusions can be drawn:
(1)
The plastic strain homogeneity exhibits an inhomogeneous distribution as the peripheral regions displayed higher stresses and strain compared to the central regions.
(2)
A relatively homogenous distribution of the plastic strain was attained along the TS compared to the LS.
(3)
Processing through 1-p experienced an elongated grain which orientated with the extrusion direction with very high density of LAGBs.
(4)
Accumulation of the strain up to 4-Bc revealed an UFG equiaxed structure with an average grain size of 8.5 µm.
(5)
Processing through 1-p and 2-Bc revealed a strong texture with significant rotation for the texture components whereas 4-Bc processing led to losing the symmetry of the texture with significant reduction in the texture intensity.
(6)
A smaller grain size is depicted at the peripheral areas than that at the central one.
(7)
Processing through 4-Bc experienced an enhancement in the hardness, and tensile strength by 66.6%, and 52%, respectively compared to the as-annealed counterpart.

Author Contributions

Conceptualization, M.E.-H., A.N. and W.H.E.-G.; methodology, M.E.-S., M.M.Z.A., A.N., M.E.-H., B.A., Y.Z. and W.H.E.-G.; validation M.E.-S., M.M.Z.A., Y.Z. and W.H.E.-G.; formal analysis, M.E.-S., M.M.Z.A., A.N., M.E.-H. and W.H.E.-G.; investigation, M.E.-S., M.M.Z.A., A.N., M.E.-H., B.A., Y.Z. and W.H.E.-G.; data curation, M.E.-S., M.M.Z.A., Y.Z. and W.H.E.-G.; writing—original draft preparation, M.E.-S., M.M.Z.A., Y.Z. and W.H.E.-G.; writing—review and editing, M.M.Z.A., B.A., Y.Z. and W.H.E.-G.; project administration, M.M.Z.A., A.N., M.E.-H. and W.H.E.-G. All authors have read and agreed to the published version of the manuscript.

Funding

This research received no external funding.

Institutional Review Board Statement

Not applicable.

Informed Consent Statement

Not applicable.

Data Availability Statement

All the raw data supporting the conclusion of this paper were provided by the authors.

Acknowledgments

The authors would like to acknowledge the support extended by Fresh Factory for Tools and Dies, Egypt.

Conflicts of Interest

The authors declare no conflict of interest.

References

  1. Bertrand, R.; Robe, H.; Texiere, D.; Zedan, Y.; Feulvarch, E.; Bocher, P. Analysis of AA2xxx/AA7xxx friction stir welds. J. Mater. Process. Technol. 2019, 271, 312–324. [Google Scholar] [CrossRef] [Green Version]
  2. Bononi, M.; Giovanardi, R. Hard anodizing of AA2011-T3 Al-Cu-Pb-Bi free-cutting alloy: Improvement of the process parameters. Corros. Sci. 2018, 141, 63–71. [Google Scholar] [CrossRef]
  3. Jha, A.K.; Narayanan, P.R.; Diwakar, V.; Kumar, K.S.; Mittal, M.C. Metallurgical analysis of cracked aluminum alloy (AFNOR 7020) components used in satellite launch vehicles. Eng. Fail. Anal. 2004, 11, 463–474. [Google Scholar] [CrossRef]
  4. Kumar, M.C.; Sotirov, N.; Chimani, C.M. Investigations on warm forming of AW-7020-T6 alloy sheet. J. Mater. Process. Technol. 2014, 214, 1769–1776. [Google Scholar] [CrossRef]
  5. Bethencourt, M.; Botana, F.J.; Cano, F.J.; Marcos, M.; Sánchez-Amaya, J.M.; González-Rovira, L. Behaviour of the alloy AA2017 in aqueous solutions of NaCl. Part I: Corrosion mechanisms. Corros. Sci. 2009, 51, 815–824. [Google Scholar] [CrossRef]
  6. Sekar, K.; Vasanthakumar, P. Mechanical properties of Al-Cu alloy metal matrix composite reinforced with B4C, Graphite and Wear Rate Modeling by Taguchi Method. Mater. Today Proc. 2019, 18, 3150–3159. [Google Scholar] [CrossRef]
  7. Won, S.; Seo, B.; Park, J.M.; Kim, H.K.; Song, K.H.; Min, S.H.; Ha, T.K.; Park, K. Corrosion behaviors of friction welded dissimilar aluminum alloys. Mater. Charact. 2018, 144, 652–660. [Google Scholar] [CrossRef]
  8. Sinhmar, S.; Dwivedi, D.K. A study on corrosion behavior of friction stir welded and tungsten inert gas welded AA2014 aluminium alloy. Corros. Sci. 2018, 133, 25–35. [Google Scholar] [CrossRef]
  9. Jia, H.; Bjørge, R.; Marthinsen, K.; Li, Y. The deformation and work hardening behavior of a SPD processed Al-5Cu alloy. J. Alloys Compd. 2017, 697, 239–248. [Google Scholar] [CrossRef] [Green Version]
  10. Al-Obaisi, A.M.; El-Danaf, E.A.; Ragab, A.E.; Soliman, M.S. Precipitation hardening and statistical modeling of the aging parameters and alloy compositions in Al-Cu-Mg-Ag alloys. J. Mater. Eng. Perform. 2016, 25, 2432–2444. [Google Scholar] [CrossRef]
  11. Fang, D.R.; Zhang, Z.F.; Wu, S.D.; Huang, C.X.; Zhang, H.; Zhao, N.Q.; Li, J.J. Effect of equal channel angular pressing on tensile properties and fracture modes of casting Al–Cu alloys. Mater. Sci. Eng. A 2006, 426, 305–313. [Google Scholar] [CrossRef]
  12. Abd El Aal, M.I.; El Mahallawy, N.; Shehata, F.A.; Abd El Hameed, M.; Yoon, E.Y.; Kim, H.S. Wear properties of ECAP-processed ultrafine grained Al–Cu alloys. Mater. Sci. Eng. A 2010, 527, 3726–3732. [Google Scholar] [CrossRef]
  13. Ma, Y.M.; Yoon, K.B. Assessment of tensile strength using small punch test for transversely isotropic aluminum 2024 alloy produced by equal channel angular pressing. Mater. Sci. Eng. A 2010, 527, 3630–3638. [Google Scholar] [CrossRef]
  14. Alateyah, A.I.; Alharbi, M.; Abd El-Hafez, H.; El-Garaihy, W.H. The Effect of Equal-Channel Angular Pressing Processing on Microstructural Evolution, Hardness Homogeneity, and Mechanical Properties of Pure Aluminum. SAE Int. J. Mater. Manuf. 2021, 14, 1–14. [Google Scholar]
  15. Fouad, D.M.; Moataz, A.; El-Garaihy, W.H.; Salem, H.G. Numerical and Experimental Analysis of Multi-Channel Spiral Twist Extrusion Processing of AA5083. Mater. Sci. Eng. A 2019, 764, 138216. [Google Scholar] [CrossRef]
  16. Fouad, D.M.; El-Garaihy, W.H.; Ahmed, M.M.Z.; El-Sayed Seleman, M.M.; Salem, H.G. Influence of multi-channel spiral twist extrusion (MCSTE) processing on structural evolution, crystallographic texture and mechanical properties of AA1100. Mater. Sci. Eng. A 2018, 737, 166–175. [Google Scholar] [CrossRef]
  17. El-Garaihy, W.H.; Fouad, D.M.; Salem, H.G. Multi-Channel Spiral Twist Extrusion (MCSTE): A Novel Severe Plastic Deformation Technique for Grain Refinement. Metall. Mater. Trans. A 2018, 49, 2854–2864. [Google Scholar] [CrossRef]
  18. El-Garaihy, W.; El Rassoul, E.S.A.; Ateyah, A.A.; Alaskari, A.M.; Oraby, S. Data Manipulation Approach and Parameters Interrelationships of the High-Pressure Torsion for AA6061-15%SiCp Composite. SAE Int. J. Mater. Manuf. 2018, 11, 167–182. [Google Scholar] [CrossRef]
  19. El-Garaihy, W.H.; Rassoul, E.S.; Salem, H.G. Consolidation of High Performance AA6061 and AA6061-SiCp Composite Processed by High Pressure Torsion. Mater. Sci. Forum. 2014, 783–786, 2623–2628. [Google Scholar] [CrossRef]
  20. Salem, H.G.; El-Garaihy, W.H.; Rassoul, E.S.M. Influence of High Pressure Torsion on the Consolidation Behavior and Mechanical Properties of AA6061-SiCp Composites Powders. In Supplemental Proceeding: Volume 1, Materials Processing and Interfaces; TMS (The Minerals, Metals & Materials Society): Pittsburgh, PA, USA, 2012; pp. 553–560. [Google Scholar]
  21. Abd El Aal, M.I. Influence of the pre-homogenization treatment on the microstructure evolution and the mechanical properties of Al–Cu alloys processed by ECAP. Mater. Sci. Eng. A 2011, 528, 6946–6957. [Google Scholar] [CrossRef]
  22. Valiev, R.Z.; Islamgaliev, R.K.; Alexandrov, I.V. Bulk nanostructured materials from severe plastic deformation. Prog. Mater. Sci. 2000, 45, 103–189. [Google Scholar] [CrossRef]
  23. Li, Y.; Jiang, Y.; Xu, Q.; Ma, A.; Jiang, A.; Liu, H.; Yuan, Y.; Qiu, C. Achieving single-pass high-reduction rolling and enhanced mechanical properties of AZ91 alloy by RD-ECAP pre-processing. Mater. Sci. Eng. A 2021, 804, 140717. [Google Scholar] [CrossRef]
  24. Alateyah, A.; Aljohani, T.A.; Alawad, M.O.; El-Hafez, H.A.; Almutairi, A.N.; Alharbi, E.S.; Alhamada, R.; El-Garaihy, B.W.; El-Garaihy, W.H. Improved Corrosion Behavior of AZ31 Alloy through ECAP Processing. Metals 2021, 11, 363. [Google Scholar] [CrossRef]
  25. Alateyah, A.I.; Ahmed, M.M.Z.; Zedan, Y.; El-Hafez, H.A.; Alawad, M.O.; El-Garaihy, W.H. Experimental and Numerical Investigation of the ECAP Processed Copper: Microstructural Evolution, Crystallographic Texture and Hardness Homogeneity. Metals 2021, 11, 607. [Google Scholar] [CrossRef]
  26. Nassef, A.; Samy, S.; El-Garaihy, W.H. Enhancement of mechanical properties for Al-Mg-Si alloy using equal channel angular pressing. Int. J. Chem. Nucl. Mater. Metall. Eng. 2015, 9, 131–136. [Google Scholar]
  27. Abbas, A.T.; Pimenov, D.Y.; Erdakov, I.N.; Taha, M.A.; El Rayes, M.M.; Soliman, M.S. Artificial Intelligence Monitoring of Hardening Cutting Conditions and Their Effects on Surface Roughness, Performance, and Finish Turning Costs of Solid-State Recycled Aluminum Alloy 6061 Chips. Metals 2018, 8, 394. [Google Scholar] [CrossRef] [Green Version]
  28. She, J.; Peng, P.; Tang, A.T.; Zhang, J.Y.; Mao, J.J.; Liu, T.T.; Zhou, S.B.; Wang, Y.; Pan, F.S. Novel on-line twist extrusion process for bulk magnesium alloys. Mater. Des. 2019, 182, 108011. [Google Scholar] [CrossRef]
  29. Ghazanlou, S.I.; Eghbali, B.; Petrov, R. Microstructural evolution and strengthening mechanisms in Al7075/graphene nano-plates/ carbon nano-tubes composite processed through accumulative roll bonding. Mater. Sci. Eng. A 2021, 807, 140877. [Google Scholar] [CrossRef]
  30. de Faria, C.G.; Silva Almeida, N.G.; Balzuweit, K.; Paulino Aguilar, M.T.; Cetlin, P.R. The effect of initial strain in the severe plastic deformation of aluminum on the subsequent work hardening regeneration through low strain amplitude multi-directional forging. Mater. Lett. 2021, 90, 129462. [Google Scholar] [CrossRef]
  31. Fouad, D.M.; Moataz, A.; El-Garaihy, W.H.; Salem, H.G. Multi-objective Optimization of Multi-Channel Spiral Twist Extrusion Process Using a Response Surface Approach and Finite Element Analysis. In Proceedings of the Materials Science & Technology Conference & Exhibition Proceeding (MS &T 2018), Columbus, OH, USA, 14–18 October 2018; pp. 1470–1477. [Google Scholar]
  32. Ahmed, M.M.Z.; Seleman, M.M.E.; Zidan, Z.A.; Ramadan, R.M.; Ataya, S.; Alsaleh, N.A. Microstructure and Mechanical Properties of Dissimilar Friction Stir Welded AA2024-T4/AA7075-T6 T-Butt Joints. Metals 2021, 11, 128. [Google Scholar] [CrossRef]
  33. Ahmed, M.M.Z.; Ataya, S.; Seleman, M.M.E.; Allam, T. Grain Structure, Crystallographic Texture, and Hardening Behavior of Dissimilar Friction Stir Welded AA5083-O And. Metals 2021, 11, 181. [Google Scholar] [CrossRef]
  34. Ahmed, M.M.Z.; Wynne, B.P.; El-Sayed Seleman, M.M.; Rainforth, W.M. A Comparison of Crystallographic Texture and Grain Structure Development in Aluminum Generated by Friction Stir Welding and High Strain Torsion. Mater. Des. 2016, 103, 259–267. [Google Scholar] [CrossRef]
  35. Pater, Z.; Tomczak, J.; Bulzak, T. Problems of forming stepped axles and shafts in a 3-roller skew rolling mill. J. Mater. Res. Technol. 2020, 9, 10434–10446. [Google Scholar] [CrossRef]
  36. Dutkiewicz, J.; Kalita, D.; Maziarz, W.; Tański, T.; Wojciech Borek, W.; Ostachowski, P.; Faryna, M. Efect of KOBO Extrusion and Following Cyclic Forging on Grain Refinement of Mg–9Li–2Al–0.5Sc Alloy. Met. Mater. Int. 2020, 26, 1004–1014. [Google Scholar] [CrossRef] [Green Version]
  37. Hasani, A.; Sepsi, M.; Feyzi, S.; Toth, L.S. Deformation field and texture analysis in T-ECAP using a flow function. Mater. Charact. 2021, 173, 110912. [Google Scholar] [CrossRef]
  38. Alawadhi, M.Y.; Sabbaghianrad, S.; Huang, Y.; Langdon, T.G. Evaluating the paradox of strength and ductility in ultrafine-grained oxygen-free copper processed by ECAP at room temperature. Mater. Sci. Eng. A 2021, 802, 140546. [Google Scholar] [CrossRef]
  39. Shuai, G.L.; Li, Z.; Zhang, D.T.; Tong, Y.X.; Li, L. The mechanical property and electrical conductivity evolution of Al–Fe alloy between room temperature and elevated temperature ECAP. Vacuum 2021, 183, 109813. [Google Scholar] [CrossRef]
  40. Ghosh, A.; Ghosh, M. 3D FEM simulation of Al-Zn-Mg-Cu alloy during multi-pass ECAP with varying processing routes. Mater. Today Commun. 2021, 26, 102112. [Google Scholar] [CrossRef]
  41. Ebrahimi, M.; Attarilar, S.; Gode, C.; Djavanroodi, F. Damage prediction of 7025 aluminum alloy during equal-channel angular pressing. Int. J. Miner. Metall. Mater. 2014, 21, 990–998. [Google Scholar] [CrossRef]
  42. Jia, H.; Li, Y. Texture evolution of an Al-8Zn alloy during ECAP and post-ECAP isothermal annealing. Mater. Charact. 2019, 155, 109794. [Google Scholar] [CrossRef]
  43. Naik, G.M.; Narendranath, S.; Kumar, S.S.S. Effect of ECAP Die Angles on Microstructure Mechanical Properties and Corrosion Behavior of AZ80 Mg Alloy. J. Mater. Eng. Perform. 2019, 28, 2610–2619. [Google Scholar] [CrossRef]
  44. Romero-Resendiz, L.; Figueroa, I.A.; Reyes-Ruiz, C.; Cabrera, J.M.; Braham, C.; Gonzalez, G. Residual stresses and microstructural evolution of ECAPed AA2017. Mater. Charact. 2019, 152, 44–57. [Google Scholar] [CrossRef]
  45. Roshan, M.R.; Jenabali Jahromi, S.A.; Ebrahimi, R. Predicting the critical pre-aging time in ECAP processing of age-hardenable aluminum alloys. J. Alloys Compd. 2011, 509, 7833–7839. [Google Scholar] [CrossRef]
  46. Venkatachalam, P.; Kumar, S.R.; Ravisankar, B.; Paul, V.T.; Vijayalakshmi, M. Effect of processing routes on microstructure and mechanical properties of 2014 Al alloy processed by equal channel angular pressing. Trans. Nonferrous Met. Soc. Chain. 2010, 20, 1822–1828. [Google Scholar] [CrossRef]
  47. Barenji, A.B.; Eivani, A.R.; Jafarian, H.R.; Park, N. Effects of hot forming cold die quenching and solution treatment on formability and pressing load during equal channel angular deformation of AA2024 aluminum alloy. J. Mater. Res. Technol. 2020, 9, 5599–5609. [Google Scholar] [CrossRef]
  48. Barenji, A.B.; Eivani, A.R.; Hasheminiasari, M.; Park, N.; Jafarian, H.R. Application of hot forming cold die quenching for facilitating equal channel angular pressing of AA2024 aluminum alloy. J. Alloys Compd. 2019, 791, 265–277. [Google Scholar] [CrossRef]
  49. Goodarzy, M.H.; Arabi, H.; Boutorabi, M.A.; Seyedein, S.H.; Hasani Najafabadi, S.H. The effects of room temperature ECAP and subsequent aging on mechanical properties of 2024 Al alloy. J. Alloys Compd. 2014, 585, 753–759. [Google Scholar] [CrossRef]
  50. El Mahallawya, N.; Shehata, F.A.; Abd El Hameed, M.; Abd El Aal, M.I. Effect of Cu content and number of passes on evolution of microstructure and mechanical properties of ECAPed Al/Cu alloys. Mater. Sci. Eng. A 2009, 517, 46–50. [Google Scholar] [CrossRef]
  51. El Mahallawy, N.; Shehata, F.A.; Abd El Hameed, M.; Abd El Aal, M.I.; Kim, H.S. 3D FEM simulations for the homogeneity of plastic deformation in Al–Cu alloys during ECAP. Mater. Sci. Eng. A 2010, 527, 1404–1410. [Google Scholar] [CrossRef]
  52. Almenaif, O.; Alhumaydan, Y.; Alnafisah, M.; Aldhalaan, M.; Alateyah, A.I.; El-Garaihy, W.H. A Computational Investigation into the Effect of Equal Channel Angular Processing on the Mechanical Properties of Severely Deformed ZK 60 Alloy Validated by Experiments. Am. J. Appl. Sci. 2020, 13, 296–310. [Google Scholar] [CrossRef]
  53. Agwa, M.A.; Ali, M.N.; Al-Shorbagy, A.E. Optimum processing parameters for equal channel angular pressing. Mech. Mater. 2016, 100, 1–11. [Google Scholar] [CrossRef]
  54. Mishra, B.; Mohapatra, S.K.; Ranjan, V.; Maity, K. Equal channel angular pressing of the aluminum alloy: A numerical investigation. Mater. Today Proceeding 2020, 26, 2173–2178. [Google Scholar] [CrossRef]
  55. Esmailzadeh, M.; Aghaie-Khafri, M. Finite element and artificial neural network analysis of ECAP. Comput. Mater. Sci. 2012, 63, 127–133. [Google Scholar] [CrossRef]
  56. Zhang, S.R.; Peng, Y.H.; Li, D. FEM simulation of micro-crystalline materials during ECAP based on the dislocation evolution method. Chaos Solitons Fractals 2016, 89, 139–146. [Google Scholar] [CrossRef]
  57. Alkorta, J.; Sevillano, J.G.A. A comparison of FEM and upper-bound type analysis of equal-channel angular pressing (ECAP). J. Mater. Process. Technol. 2003, 141, 313–318. [Google Scholar] [CrossRef]
  58. Deng, G.Y.; Lu, C.; Su, L.H.; Liu, X.H.; Tieu, A.K. Modeling texture evolution during ECAP of copper single crystal by crystal plasticity FEM. Mater. Sci. Eng. A 2012, 534, 68–74. [Google Scholar] [CrossRef]
  59. Djavanroodi, F.; Ebrahimi, M. Effect of die channel angle, friction and back pressure in the equal channel angular pressing using 3D finite element simulation. Mater. Sci. Eng. A 2010, 527, 1230–1235. [Google Scholar] [CrossRef]
  60. Chen, W.; Feng, P.; Dong, L.; Liu, B.; Ren, S.; Fu, Y. Experimental and theoretical analysis of microstructural evolution and deformation behaviors of CuW composites during equal channel angular pressing. Mater. Des. 2018, 142, 166–176. [Google Scholar] [CrossRef]
  61. Horita, Z.; Fujinami, T.; Nemoto, M.; Langdon, T.G. Equal-Channel Angular Pressing of Commercial Aluminum Alloys: Grain Refinement, Thermal Stability and Tensile Properties. Metall. Mater. Trans. A 2000, 31, 691–701. [Google Scholar] [CrossRef]
  62. Ibrahim, M.; El, A.B.D.; Sadawy, M.M. Influence of ECAP as Grain Refinement Technique on Microstructure Evolution, Mechanical Properties and Corrosion Behavior of Pure Aluminum. Trans. Nonferrous Met. Soc. China 2015, 25, 3865–3876. [Google Scholar]
  63. Derakhshan, J.F.; Parsa, M.H.; Jafarian, H.R. A Microstructure and Mechanical Properties Variations of Pure Aluminum Subjected to One Pass of ECAP-Conform Process. Mater. Sci. Eng. A 2019, 747, 120–129. [Google Scholar] [CrossRef]
  64. Figueroa, I.A.; Braham, C.; Alfonso, I. Effect of the Initial ECAP Passes on Crystal Texture and Residual Stresses of 5083 Aluminum Alloy. Int. J. Miner. Metall. Mater. 2020, 27, 801–808. [Google Scholar]
  65. Xu, J.; Li, J.; Shan, D.; Guo, B. Microstructural evolution and micro/meso-deformation behavior in pure copper processed by equal-channel angular pressing. Mater. Sci. Eng. A 2016, 664, 114–125. [Google Scholar] [CrossRef]
  66. Xu, J.; Li, J.; Shan, D.; Guo, D. Strain softening mechanism at meso scale during micro-compression in an ultrafine grained pure copper. AIP Adv. 2015, 5, 1–6. [Google Scholar] [CrossRef]
  67. Zhang, Z.F.; Wu, S.D.; Li, Y.J.; Liu, S.M.; Wang, Z.G. Cyclic deformation and fatigue properties of Al–0.7 wt.% Cu alloy produced by equal channel angular pressing. Mater. Sci. Eng. A 2005, 412, 279–286. [Google Scholar] [CrossRef]
  68. Ma, E.; Zhu, T. Towards strength-ductility synergy through the design of heterogeneous nanostructures in metals. Mater. Today 2017, 20, 323–331. [Google Scholar] [CrossRef]
  69. Iwahashi, Y.; Horita, Z.; Nemoto, M.; Langdon, T.G. An investigation of microstructural evolution during equal-channel angular pressing. Acta Mater. 1997, 45, 4733–4741. [Google Scholar] [CrossRef]
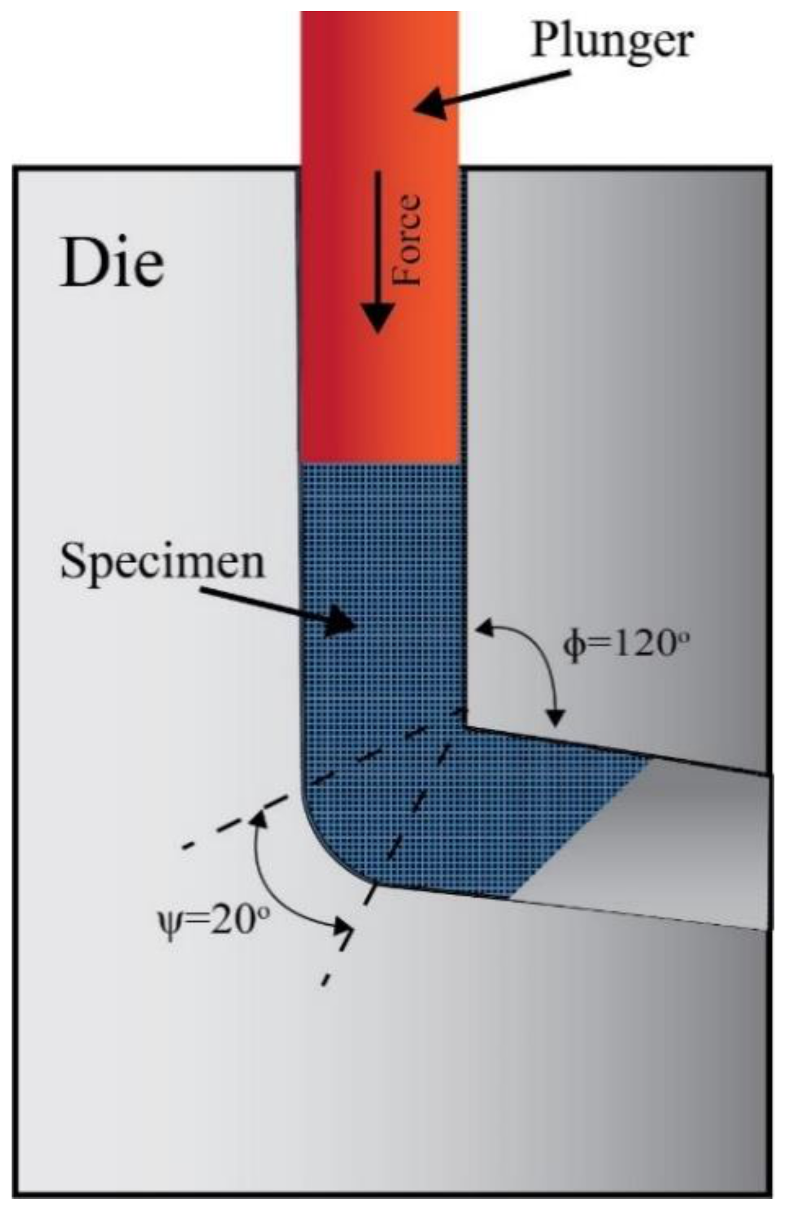
Figure 1. The schematic of the equal channel angular pressing (ECAP) die [25].
Metals 11 00938 g001
Figure 2. Schematic of four routes of multi-pass ECAP [14].
Metals 11 00938 g002
Figure 3. The ECAP die, punch, and sample used in FE simulation (a), Tracked elements located at the plane in the middle of the specimen at the sample’s edge and at the center (b).
Metals 11 00938 g003
Figure 4. FE simulation stages of the AA2011 aluminum alloy.
Metals 11 00938 g004
Figure 5. (a) Representation of the references axes with respect to the ECAPed sample [25], (b) The ECAPed AA2011 sample during tensile test.
Metals 11 00938 g005
Figure 6. Stress distribution along both the LS and TS of the ECAPed AA2011 samples processed through 1-p (a), 2-Bc (b) and 4-Bc (c) at 150 °C.
Metals 11 00938 g006
Figure 7. Strain distribution along both the LS and TS of the ECAPed AA2011 samples processed through 1-p (a), 2-Bc (b) and 4-Bc (c) at 150 °C.
Metals 11 00938 g007
Figure 8. Stress versus time (a) and strain versus time (b) at the central and peripheral regions of AA2011 processed through 1-p, 2-Bc, and 4-Bc at 150 °C.
Metals 11 00938 g008
Figure 9. OM micrographs of AA2011 for (a) AA, (b) 1-p, (c) 2-Bc, and (d) 4-Bc at 150 °C.
Metals 11 00938 g009
Figure 10. OM micrograph of AA2011 after processing through 2-Bc at the peripheries.
Metals 11 00938 g010
Figure 11. Inverse Pole figure coloring maps and their corresponding grain boundary maps for the BM AA2011 (a) and the ECAP processed AA2011 for different passes, (b) 1-p, (c) 2-Bc, (d) 4-Bc.
Metals 11 00938 g011
Figure 12. Grain size distribution calculated from the EBSD data presented in Figure 10 for the AA2011 BM after ECAP processing for different passes.
Metals 11 00938 g012
Figure 13. 100, 101 and 111 pole figures calculated from the EBSD data presented in Figure 10 for the AA2011 BM and after ECAP processing for different passes.
Metals 11 00938 g013
Figure 14. IPF maps and their corresponding GB maps of the 1-p ECAP processed AA2011 (a) left edge, (b) center, (c) right edge.
Metals 11 00938 g014
Figure 15. Grain size distribution across the 1 pass ECAP processed AA2011 calculated from the EBSD data presented in Figure 10 (a) left edge, (b) center, (c) right edge.
Metals 11 00938 g015
Figure 16. Color-coded contour maps for the hardness values recorded on the (a,c,e) LS and (b,d,f) TS of the AA2011 billets processed via ECAP processing after (a,b) 1-p, (c,d) 2-Bc, and (e,f) 4-Bc at 150 °C.
Metals 11 00938 g016
Table 1. The adopted model processing parameters for AA2011.
Processing ParameterValue
Temperature range (°C)150–450
Strain Range (φ)0.05–5
Strain Rate Range ( φ ˙ )0.01–63
c1506.503
c2−0.00444724
n1−4.81802e−5
n20.106109
l15.75635e−5
l2−0.0280168
m10.000256
m2−0.010893
Table 2. Chemical composition of the AA2011 aluminum alloy used in this work (in Wt. %).
ElementCuFePbZnTiVAl
Wt %5.750.4170.20.1370.0090.004balance
Table 3. Mechanical properties of AA2011 processed via ECAP at 150 °C.
Processing ConditionHV-ValueYS
(MPa)
UTS
(MPa)
Elongation
(%)
CenterPeriphery
AA72 ± 272 ± 2251 ± 1235 ± 120 ± 0.5
1-p86 ± 295 ± 2267 ± 1270 ± 123 ± 0.5
2-Bc89 ± 299 ± 2229 ± 1337 ± 145 ± 0.5
4-Bc108 ± 2122 ± 3249 ± 1358 ± 146 ± 0.5
Publisher’s Note: MDPI stays neutral with regard to jurisdictional claims in published maps and institutional affiliations.