Article

Comparative EIS Study of AlxCoCrFeNi Alloys in Ringer’s Solution for Medical Instruments

by
Pedro P. Socorro-Perdomo
1,
Néstor R. Florido-Suárez
1,
Ionelia Voiculescu
2 and
Julia C. Mirza-Rosca
1,*
1
Mechanical Engineering Department, Las Palmas de Gran Canaria University, 35017 Las Palmas de Gran Canaria, Spain
2
Faculty of Industrial Engineering and Robotics, Politehnica University of Bucharest, 313 Splaiul Independentei, 060042 Bucharest, Romania
*
Author to whom correspondence should be addressed.
Metals 2021, 11(6), 928; https://doi.org/10.3390/met11060928
Submission received: 17 May 2021 / Revised: 1 June 2021 / Accepted: 5 June 2021 / Published: 7 June 2021
(This article belongs to the Special Issue Corrosion without Limit: From Past to Future)

Abstract

:
Depending on the properties required for the medical instruments, compared with the classical materials, the high-entropy alloys (HEAs) are a versatile option. Electrochemical Impedance Spectroscopy (EIS) measurements have been performed on AlxCoCrFeNi-type high-entropy alloys with various concentrations of Al content (x = 0.6, 0.8, and 1.0) in order to characterize their passive film and corrosion resistance at 37 °C under infectious simulated physiological conditions (Ringer´s solution acidulated with HCl) at pH = 3. The impedance spectra were obtained at different potential values between −0.7 and +0.7 V vs. SCE. Analysis of the impedance spectra was carried out by fitting different equivalent circuits to the experimental data. Two equivalent circuits, with one time constant and two time constants respectively, can be satisfactorily used for fitting the spectra: one time constant represents the characteristics of the compact passive film, and the second one is for the porous passive film. With the decreasing of Al content, the obtained EIS results are correlated with the evolution of the microhardness and microstructure, which is characterized by Optical Microscopy (OM), Scanning Electron Microscopy (SEM), and Energy-Dispersive X-Ray Spectroscopy (EDAX). It can be observed for all alloys that the resistance of the passive film is very high and decreases with the potential: the very high resistance of the passive film implies a high corrosion resistance, which can be assigned to the formation of the protective oxide layer and demonstrates that the analyzed alloys fulfill the prerequisites for their use as new materials for the manufacturing of medical instruments.

1. Introduction

The high-entropy alloys (HEAs), due to their particular composition, offer an alternative point of view for the new generation of materials that can possibly change the properties limitations of the classical materials. Two definitions of HEA are widely accepted: one based on the composition of the alloy and another based on the entropy concept. The first definition categorizes HEAs as materials containing five or more elements where every element has an atomic proportion between 5% and 35% [1]. According to the second definition, HEAs are considered to be alloys that have a conformational entropy larger than 1.61 R where R is the universal gas constant [2]. The high-entropy solid solutions are typically FCC alloys, BCC alloys, and also amorphous-structured alloys (high-entropy bulk metallic glass), but HCP-structured alloys were also reported [3]. Actually, there has been a great increase in the number of works that report on these novel microstructures with excellent properties [4,5,6,7].
The high-entropy solid solution AlCoCrFeNi was developed by Zhang’s team at Beijing University of Science and Technology [8]. The microstructure, yield stress, compressive strength, plastic strain, and fracture mechanism of this alloy were studied [8,9]. The modification of Al content to high-entropy alloys (HEA) with cubic face-centered structures (FCC) leads to significant modifications in its physical and structural characteristics [10]. These changes are due to Al’s ability to introduce a grading tendency within the FCC matrix, as well as a network disturbance due to the increased atomic radius of Al (142 Å) in comparison with the remaining elements of HEAs (with an average of the atomic radius of Co, Fe, Ni = 125 Å) [11]. For these reasons, many studies on this HEA with different aluminum concentration were performed. For instance, the following properties were measured: Vickers hardness for Al0.25 [12]; microstructure and tensile behaviors for Al0.3 [13,14,15]; microstructure, hardness, and corrosion properties of Al0.5 [16], tribological properties for Al0.6 [17]; and compressive strength, Vickers, and Brinell Hardness for Al0.8 [18].
Since the properties of the AlxCoCrFeNi change significantly with aluminum concentration, comparative studies with x varying at different values from 0 to 3 were performed, and some characteristics were investigated: microstructure [19,20,21], hardness [16,22], electrochemical properties [23,24,25], electric, magnetic, and Hall properties [26]. Review articles and books were also written [3,8,27,28,29], and as a result, AlCoCrFeNi was found to exhibit high hardness, toughness, and stiffness, low modulus of electricity, and high thermal stability, which are properties that make it an option as a material for medical instruments such as cutters, saws, scissors, etc.
Despite the very good properties, AlCoCrFeNi alloy can produce metallic ions that can be diffused through passive oxide films. Some of these ions react with chlorine ions from the human body, forming complexes and precipitates; those that react with the water can form hydroxides and oxides, and in these conditions, the local change of pH is produced. Accordingly, pH gradients are produced along the different areas of the medical instruments, and this condition can produce and perpetuate crevice corrosion [30]. Consequently, local proliferation of the corrosion on some zones of HEA could appear.
However, the investigation of the degradation behavior of AlxCoCrFeNi in simulated body fluid does not exist yet (for their use as medical instruments: cutting elements, tissue detachment sewing, etc.), so this study clarifies how the Al content impacts on the passive films formed on these alloys. In addition, the relationship between the characteristics of the oxide film and the Al concentration is examined by varying the potential between −0.7 and 0.7 V vs. SCE. The corrosion in the physiological environment is mainly due to the chlorine ions that it contains, to pH, and to the special conditions of use such as infections, hematomas, allergies, etc. In this paper, an infectious physiological environment was simulated by adding HCl to Ringer solution until it reached pH = 3 at 37 °C.

2. Materials and Methods

2.1. Materials and Samples Preparation

The VAR (Vacuum Arc Remelting) process was used for the manufacture of high-entropy AlxCrFeCoNi alloys (see Table 1) by using the MRF ABJ 900 VAR (Allenstown, Merrimack, NH 03275, USA) at ERAMET Laboratory. High-purity granular base materials of Al, Cr, Fe, Co, and Ni (99.9%) were used and classified according to ASTM B214-16 [31]. Eventual losses of material by vaporization are to be expected in accordance with the theoretical chemical elements assimilations degree into the melt. Both conditions are taken into account for the charge. The obtained alloys were melted in a VAR unit up to six times, making use of argon as inert atmosphere, so that an adequate homogeneity could be achieved. The mini ingot was presented in the shape of a cylindrical rod of approximately 10 cm in length and 1.5 cm in diameter. For a microstructural quality examination, the first step is to cut the samples. A precision sectioning saw (BUEHLER USA, Lake Bluff, IL 60044, USA), IsoMet®4000 Buehler, is used to ensure cuts with minimal deformation. To simplify the manipulation of the samples and also to protect the edges of the samples, they have been pasted with an epoxy system. Then, with a Struers grinding-polishing machine (Struers Inc., Cleveland, OH 44145, USA), model TegraForce-1, the specimens were wet ground and polished with 260 to 3000 grain SiC papers and continued by a 0.1 µm alumina suspension for final polishing. To remove traces of other substances, as we do with all materials [32], the specimens were ultrasonically cleansed in ethanol for 10 min followed by rinsing two times with deionized water. The experimental steps complied with the ASTM E3-11(2017) standard for the preparation of metallographic samples [33].

2.2. Test Environment

All data were obtained in Ringer Grifols solution (from Grifols Laboratories, Barcelona, Spain) with the corresponding contents in mmol/L: Na+ 129.9; K+ 5.4; Ca2+ 1.8; Cl 111.7; and C3H5O3 27.2 and acidified with HCl until reaching a pH = 3. The Ringer Grifols solution is a complex physiological mixture in which some of the chloride ions are substituted by lactate ions and some of the sodium ions are substituted by calcium and potassium ions. A thermostatic bath at 37 ± 0.1 °C was used to obtain the test data.

2.3. Microstructural Characterization

The microstructure of the samples was studied through optical microscopy. The surface of the samples was electrochemically etched with a 10% solution of oxalic acid where the samples were immersed for 10 s and 5 A current. The optical observations of the surface were made using a Zeiss AxioVert A1 microscope (Carl-Zeiss QEC GmbH, Ostfildern, Germany). The SEM and the EDAX observations were performed with an environmental scanning electron microscope model Fei XL30 ESEM (MTM, Leuven, Belgium) with LaB6 cathode coupled to an analyzer by energy-dispersive electron probe X-ray, model EDAX Sapphire. Finally, the samples were coated by spraying with gold for the analysis of the cross-section of the passive layer.

2.4. Microhardness

The microhardness of the samples was studied by performing an indentation test with a microhardness tester model Remet HX-1000 (NCS Lab., Carpi, Italy). The sample, which had been polished to a mirror finish as explained previously, was inspected with an optical microscope, and then, the microhardness determinations were conducted perpendicularly to the surface. The indentations were placed every 0.5 mm on the diameter of the sample. A load of 100 g and dwell time of 15 s were performed [32]. Finally, the average level for individual samples was calculated and reported as Vickers hardness (HV).

2.5. Electrochemical Measurements

The influence of potential on the passive film of HEAs under simulated physiological conditions was investigated by Electrochemical Impedance Spectroscopy (EIS). The equipment consists of a potentiostat PAR 263 A connected with a lock-in amplifier, model PAR 5210, to a conventional electrochemical cell. Three electrodes are needed to perform this technique: first, the working electrode (experimental sample); second, the electrode used as reference is the saturated calomel electrode (SCE); and third, as counter electrode, a platinum grid was used.
AC impedance measurements were recorded at open circuit potential, with an AC potential amplitude of 10 mV, and single sine wave measurements were conducted at frequencies between 10−1 and 105 Hz. To analyze the characteristics of the oxide film, the impedance spectra were recorded between −0.7 and +0.7 V with a 0.2 V step permitting the system to be stabilized for 10 min at each potential. Thus, the electrodes are polarized in a continuous way [33]. A personal computer was used for data acquisition and analysis using ZSimpWin software (AMETEC, Princeton, NJ, USA) to interpret the spectra.

3. Results and Discussion

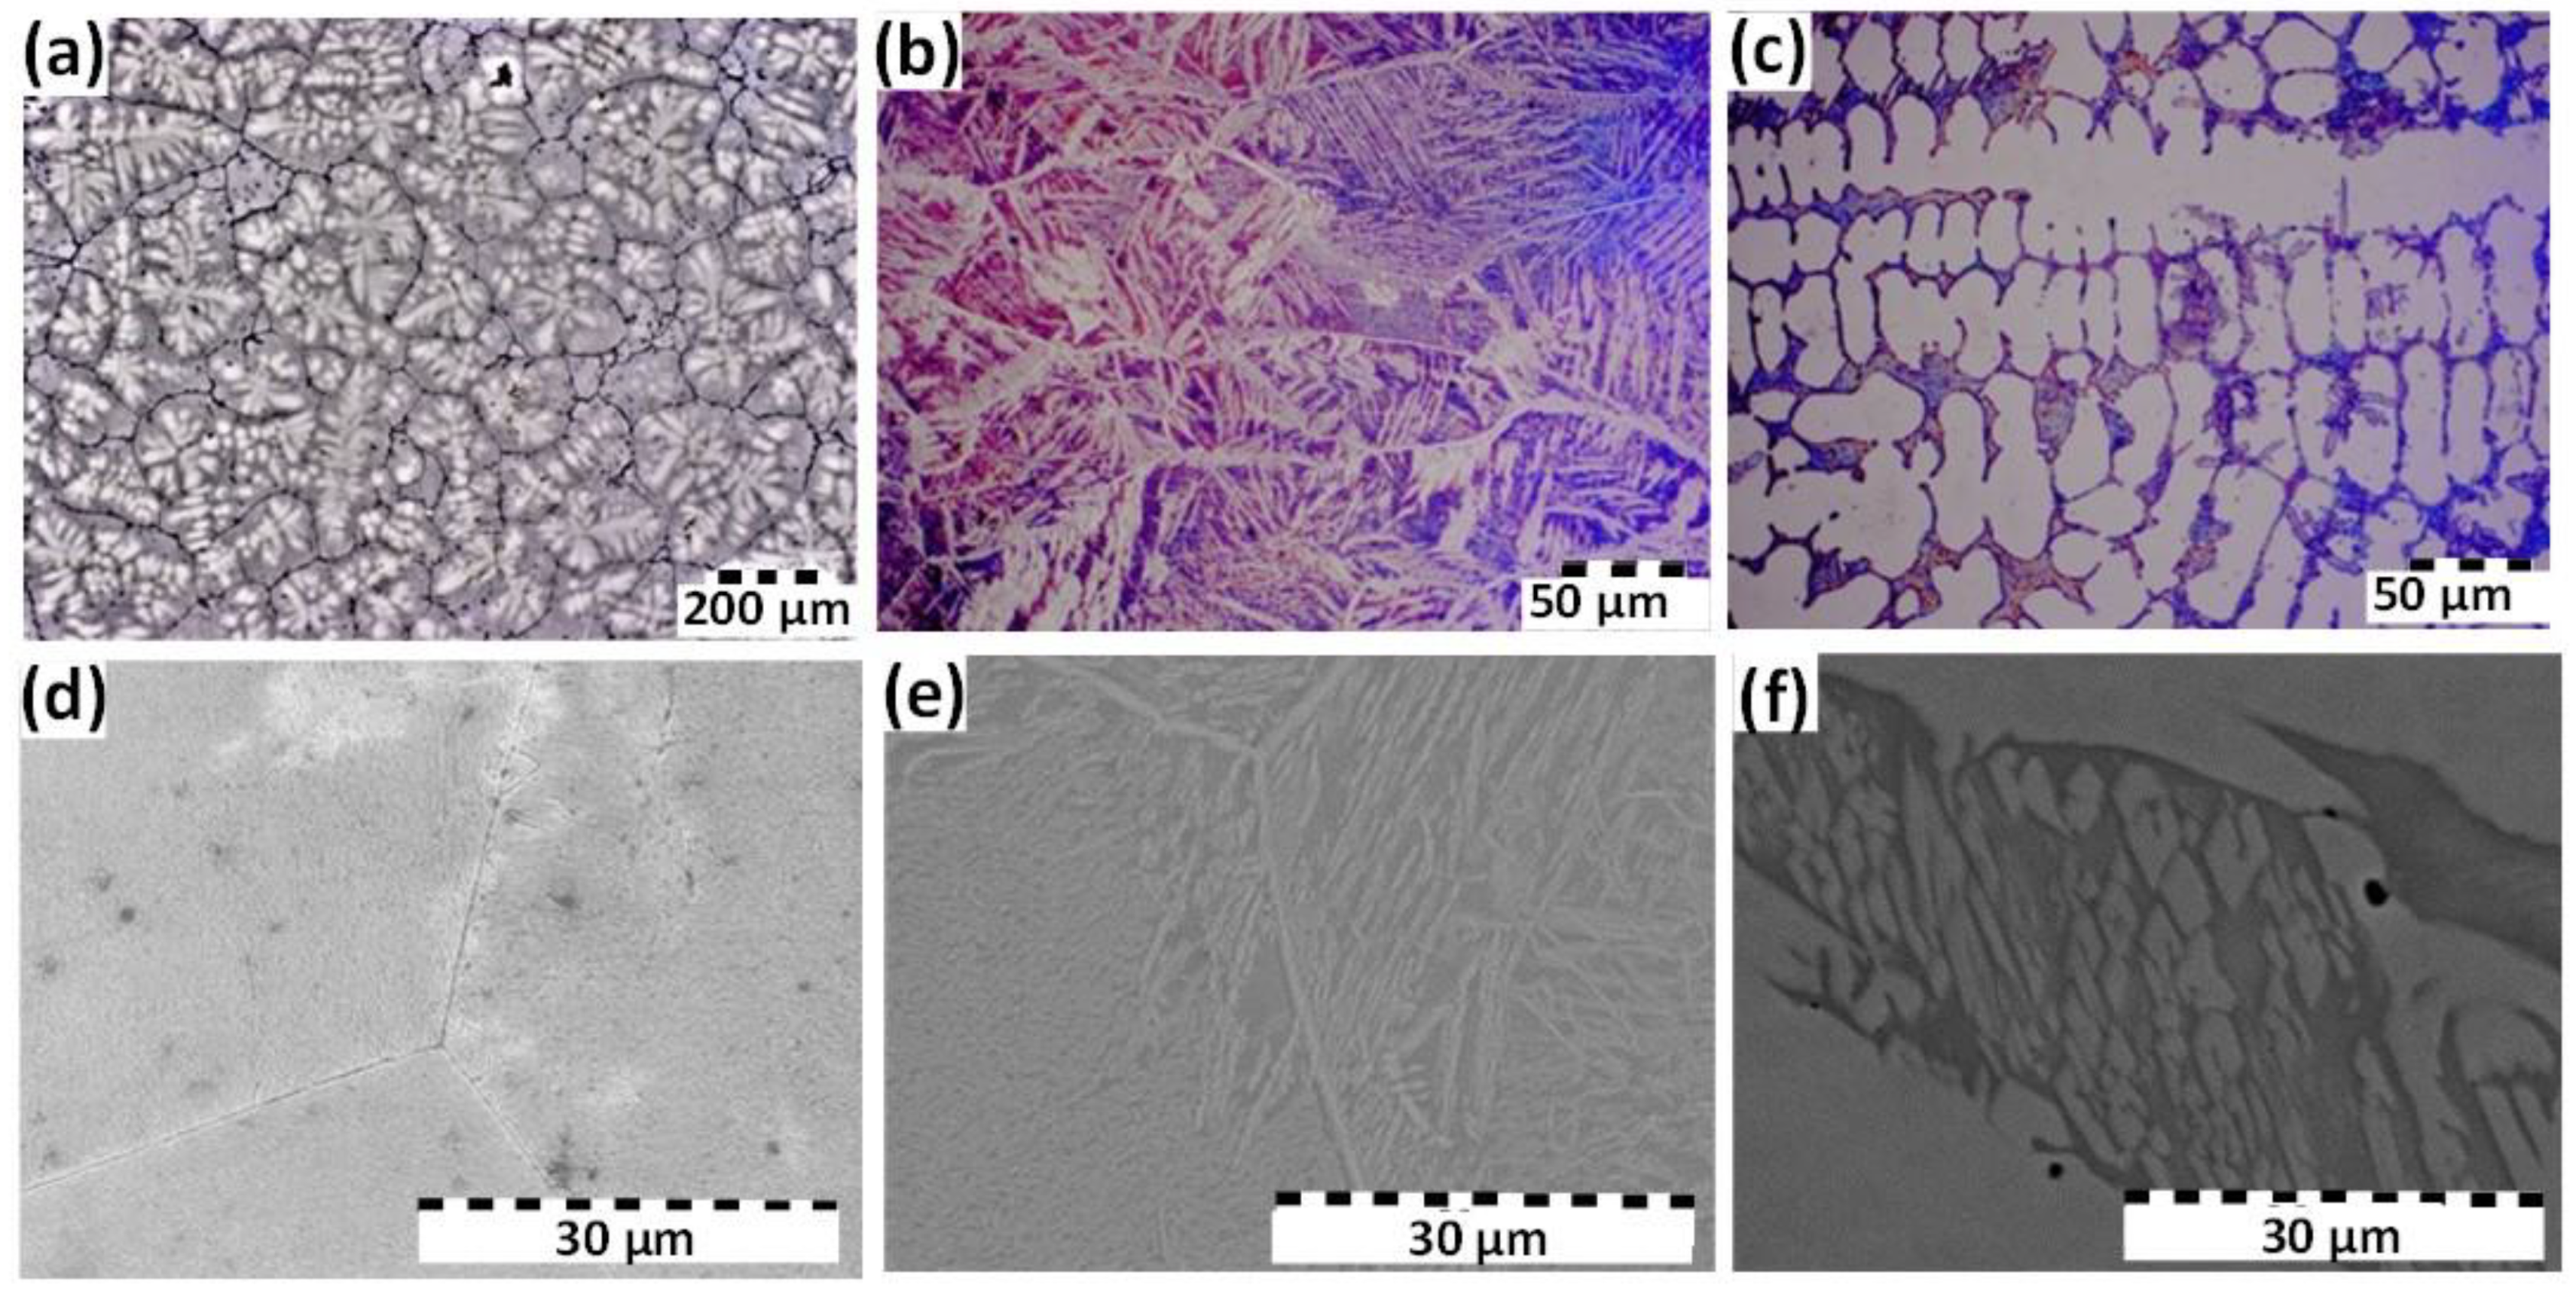
3.1. Microstructural Characterization
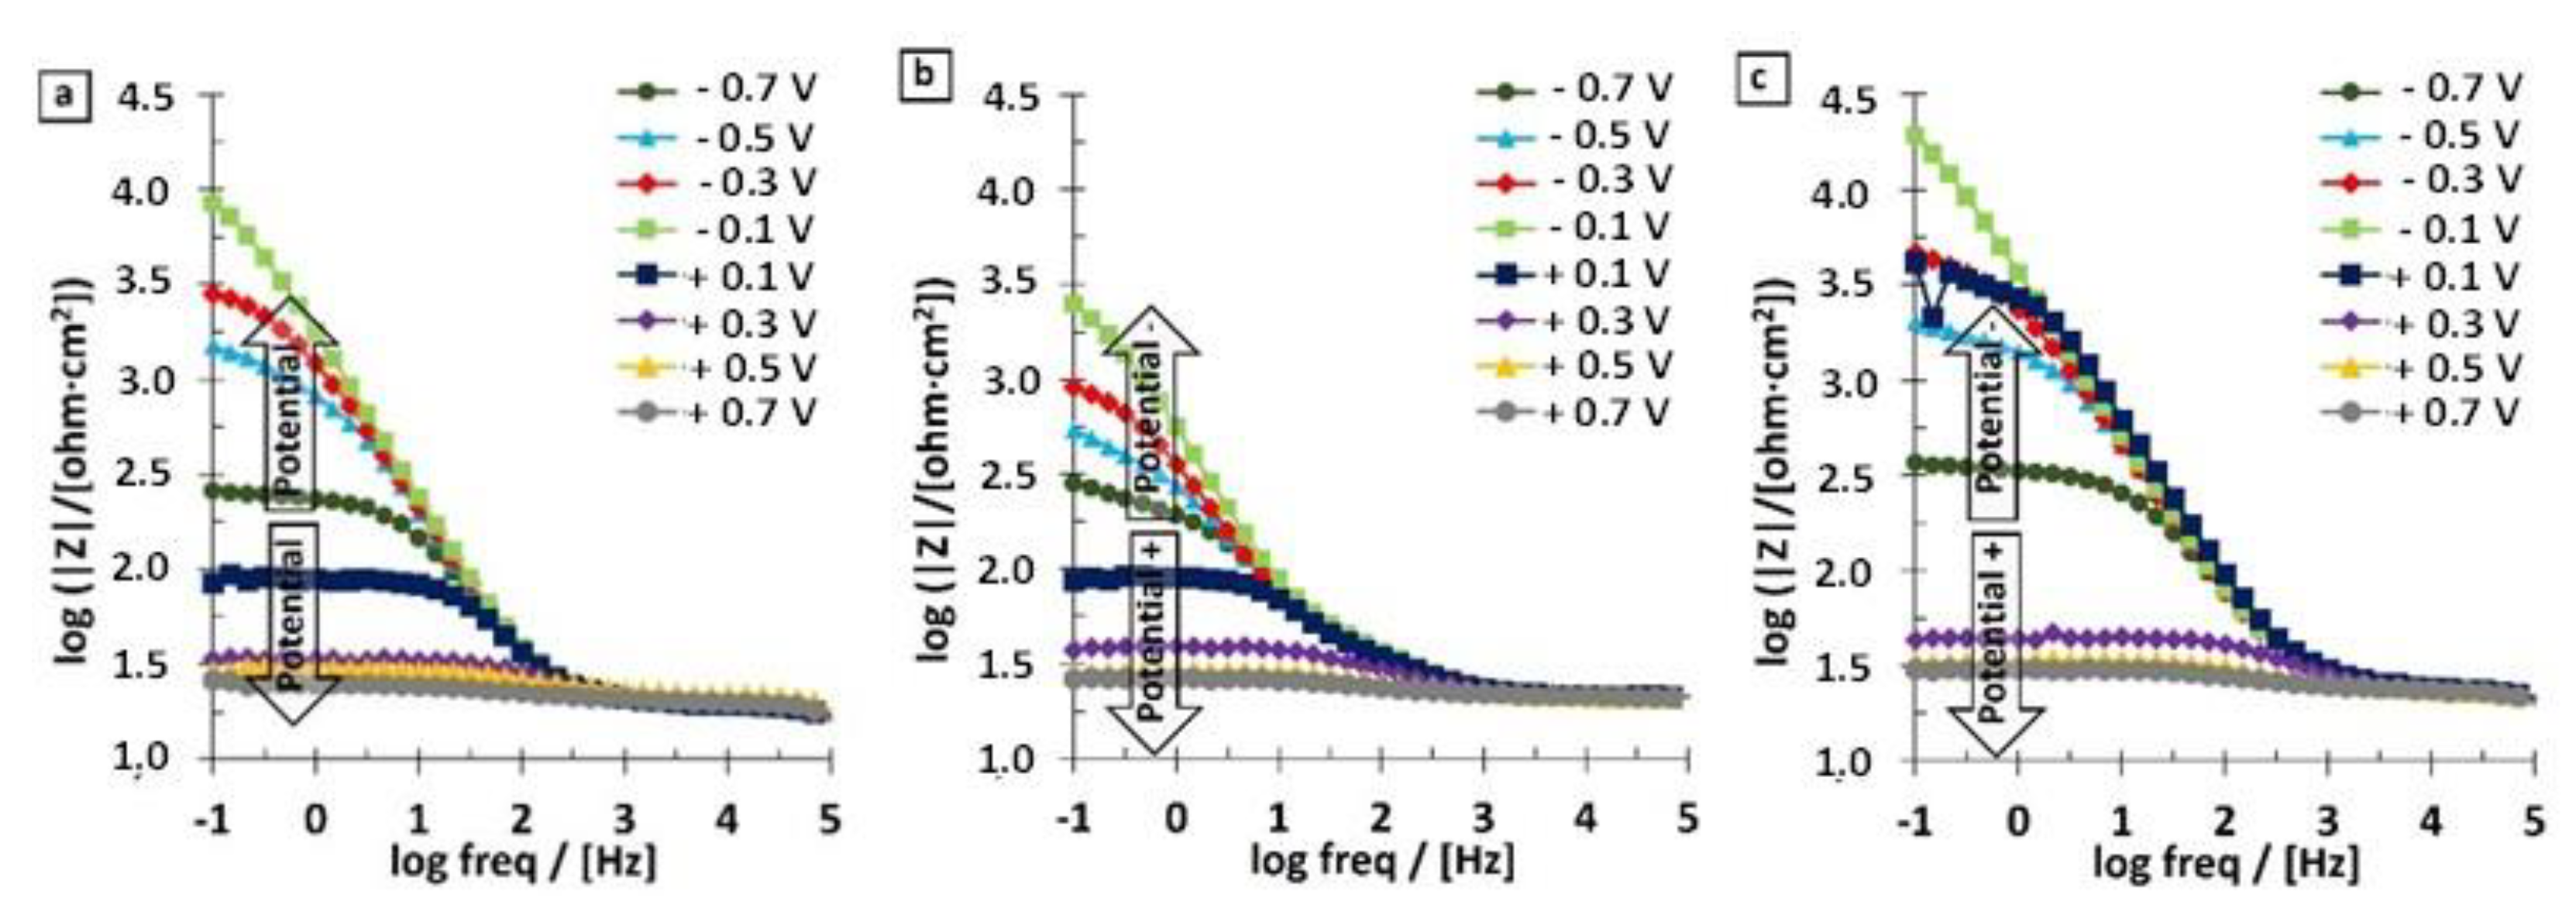
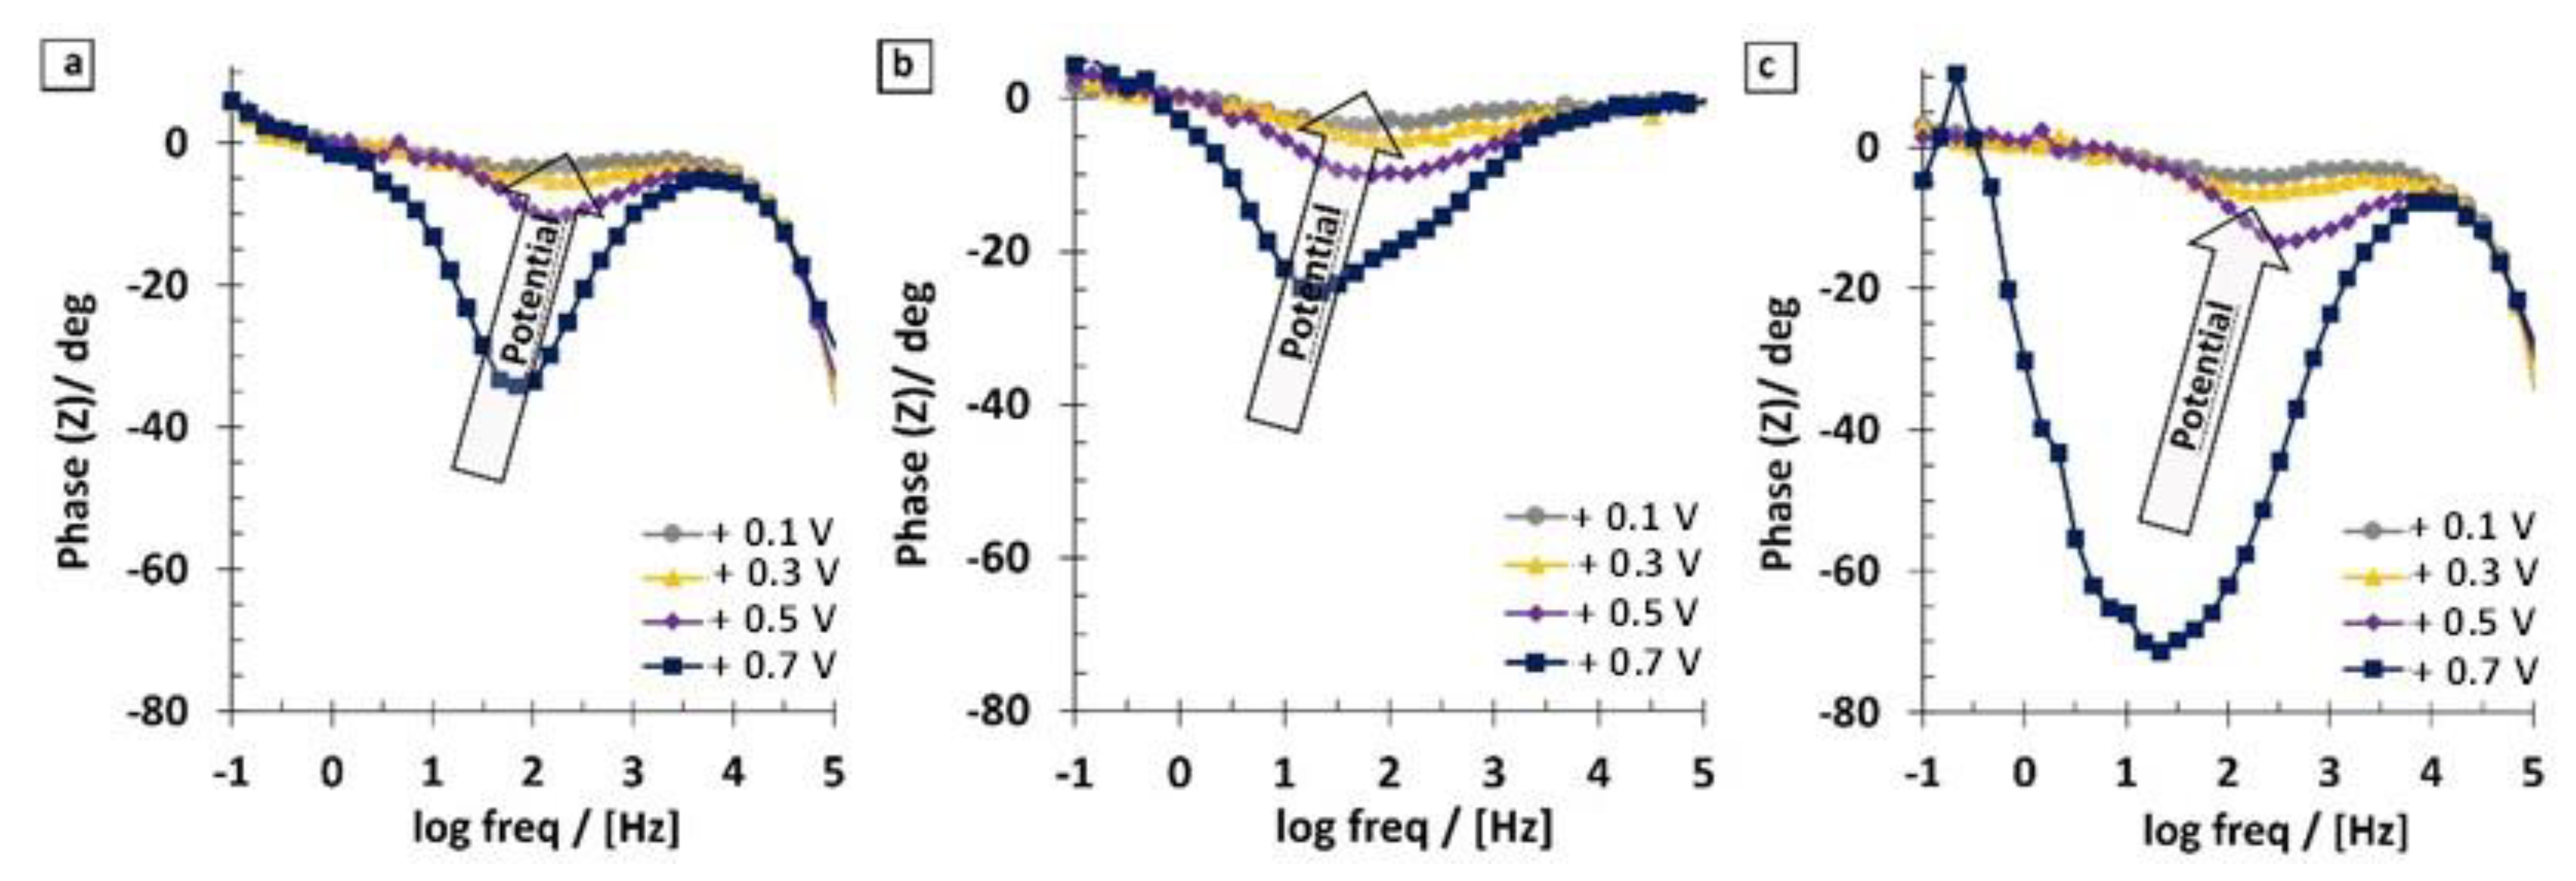
Optical images can be seen in Figure 1a–c in which the general characteristic of the microstructure is dendritic. The individual concentration of the elements in the different alloys influences the morphology of the phases. Accordingly, in the case of Al1.0 and Al0.6, the aspect of the dendrites is almost rounded, while for Al0.8, it presents acicular forms with different orientations. It was found that even for small changes in the chemical composition, there are changes in the phases and compounds in these alloys. The explanation is that at certain proportions of Al in this matrix, the crystal structures change from FCC to BCC + FCC or to BCC. The SEM microstructural aspects at higher magnifications shown in Figure 1d–f are comparable to those found by optical microscopy. At higher magnifications, the individual features of each alloy are emphasized. For instance, in the case of Al1.0 (Figure 1d), the microstructure is constituted by phases disposed in an orderly manner in the metallic matrix, which is flanked by straight grain edges. The microstructure of Al0.8 (Figure 1e) reveals the propensity of growth of acicular phases (Widmanstätten), resulting in significantly larger grain boundaries. In regard to the Al0.6 sample (Figure 1f), the two phases are significantly different. Since the structure of the alloy with x = 0.6 is the one that presents in wide spaces the presence of two phases and therefore is the most representative, we have chosen it to show the EDAX results (see Figure 2 and Table 2).
On the surface of the HEA, there are two zones: a dendritic zone (D) and an interdendritic zone (ID) with significant compositional differences of the elements (see Table 3). A segregation factor [9], the segregation ratio (SR), was used to calculate the level of element segregation, which is defined as:
S R = e l e m e n t   c o n c e n t r a t i o n   i n   D   a r e a e l e m e n t   c o n c e n t r a t i o n   i n   I D   a r e a .
For Al0.6CrFeCoNi, the nanoscale analysis revealed the dendritic region rich in Fe and Co but depleted in Ni and Al and the interdendritic region rich in Al and Ni but depleted in Co and Fe. Only chromium shows no significant difference in the two areas with a somewhat higher concentration in the interdendritic zone.
As the content of Al increments, the effect of chromium is more powerful, and Co shows no obvious difference in the two zones, which is in accordance with the results of other researchers [9].
Aluminum and chromium increase their segregation ratios, while nickel and cobalt decrease it. We would say that they form less intermetallic compounds (or that they “precipitate” less). Iron does not substantially vary its segregation ratio.
It could almost be said that the increase in aluminum reduces the solubility limit of the solid phase for nickel and cobalt, increases it for chromium, and iron is almost unaffected.

3.2. EIS Results

To evaluate the passive layer characteristic, the impedance data will be used. In Nyquist plots (Figure 3), it can be noted that all samples present three distinct region consisting of (i) an arc with a small ratio at high frequencies (low impedances); (ii) another arc at medium frequencies with the ratio bigger than that of high frequencies and (iii) a line at low frequencies (high impedances). This is clearly indicative of the feedback from at least two different frequency-dependent processes with their respective time constants.
From the Bode-phase spectra in the range −700 to −100 mV (Figure 4) for the three HEAs, the changing of a widely capacitive film to a resistive one can be observed, and this is a measure of the integrity of the film and therefore of the corrosion resistance.
The Bode-phase spectra show the phase shift as a function of frequency for different potentials vs. the reference electrode. The single-phase shift peak for the potentials between −0.7 and −0.1 V indicates that any time constants associated with the corrosion process must be close in frequency. The maximum phase shift is centered at about 10 Hz for Al0.8 and 100 Hz for Al0.6 and systematically shifts to lower frequencies as the potential increases, reaching a value of about 1 Hz for Al0.8 and 5 Hz for Al0.6. This shift to lower frequencies is an indication of the increases of the polarization resistance and can occur without a shift in interfacial capacitance.
In the Bode–IZI plots (see Figure 5), for the three HEAs, at high and middle frequencies, the impedance spectra show superimposable curves. All the spectra show a significant drop between −0.1 and +0.1 V. This drop continues with the increasing of potential until the end of the experiment, and the resistance of the film at that moment was reduced more than 200 times for all the HEAs. The impedance of the low-frequency flat surface is associated with the inherent quality of the film. This low-frequency platform represents the addition of the surface layer resistance, the transfer resistance, and the electrolyte resistance. Since both last resistances change slightly for the same HEA, changes in the low-frequency plateau represent changes in the film, and these can be due to the conductive paths through the film.
The increase in low-frequency impedance with the potential is indicative of a richer corrosion resistance of the film formed on the HEA surface. The highest corrosion resistance belongs to the alloy with x = 0.6; the value is more than double that for the alloy with x = 1, and this confirms that the Al content decrease has changed the passive film characteristics.
In Figure 5, from 0.1 to 0.7 V, a diffusion-controlled process has become a significant part of the total impedance. This is shown by the spectral region with a slope of about 1/4, which occurs from a log frequency of 4.5 to a log frequency of 3.0 and by the spectral region with slope increasing from 1/4 to 1/2, which occurs from a log frequency of 3.0 to 1.0. These data suggest a corrosion process with diffusion-controlled ionic conductivity [34], and the impedance is dominated by transfer resistance rather than film resistance. This difference in behavior may be attributed to the filling of pores in the film.
When the spectra curve registered from +0.1 to 0.7 V vs. SCE (increasing and decreasing tendency, see Figure 6), strange behavior was observed at lower frequencies where the phase angle changed the direction of evolution at about 50 Hz. This behavior is probably due to a drift of Ecorr and polarization of the HEA during the impedance measurement [34].
Based on the visual observations of the impedance spectra, the corrosion process parameters have been modeled by the equivalent circuits presented in the Figure 7a and Figure 8a [35].
The elements components of the equivalent circuits are the electrolytic resistance (R), the resistance of the passive film (Rp), the capacitance of the passive film (Cp), the double-layer capacitance (Cdl), and the charge transfer resistance (Rct).
The analysis of the impedance spectra was performed by matching the experimental data with those obtained through the ZSimpWin software. The quality of the fit with an equivalent circuit was initially evaluated by the chi-square value and then by the comparison of the experimental data with the simulated ones. A chi-square value of 10−5 indicates a very good fit by using a low number of elements. All elements of the equivalent circuit behaved consistently.
R is the unbalanced electrolyte resistance and is dependent on the distance from the working electrode to the reference electrode (which remained the same in all the experiments).
Rp is representing the resistance of the passive film pores and is assigned to the resistance of the ion conduction path within the passive layer structure. It indicates the degree of the efficiency of the passive film in protecting the base alloy against corrosion.
Rct represents the polarization resistance at the interface alloy/passive film by considering the entry of the electrolyte into the pores. Fitting procedures have shown that as results of inhomogeneities and porosity, a better coincidence between the theoretical and experimental data is achieved if instead of pure capacitance a constant-phase element is introduced.
CPE constant phase elements were employed (representing the variation from the typical capacitive behavior) and the impedance of a CPE (symbolized with Q) is shown by [36]:
Q : Z = ( j ω ) n · Y 0 .
Z represents the impedance of CPE, j is the imaginary number (j2 = −1), ω is the angular frequency (rad·s−1), Y0 is the constant of CPE [S(s·rad−1)n] where n is the power number, n = α(π/2) where α is the constant phase angle of the CPE (rad). If n = 1, CPE = C; if n = 0, CPE = R, and if n = 0.5, CPE = W.
In this way, all the capacities of the two equivalent circuits have been replaced by phase constant elements.
First, the experimental data have been modeled with the simple circuit of one time constant, the Randles circuit; see Figure 7a. This circuit, called R(QR), is composed of a resistance (Rct) in parallel with Qdl, and these two elements are connected in series with the electrolyte resistance R. To calculate the total impedance of the equivalent circuit, we calculate the admittance of the parallel combination (RctQdl):
1 Z e q = 1 Z R c t + 1 Z Q d l .
Even a constant phase element was used for fitting the experimental data; because n is close to 1, the obtained Y0 value is taken as a capacity in the forthcoming discussion:
1 Z e q = 1 R c t + j   w   C d l .
Multiplying by Rct, the left side term, Zeq, is:
Z e q = R c t j   ( w   C d l R c t 2 ) 1 + ( w   C d l R c t ) 2 .
After adding the resistance of the electrolyte, the total impedance is:
Z e q = R Ω + R c t j   ( w   C d l R c t 2 ) 1 + ( w   C d l R c t ) 2 .
Rct is considered the corrosion resistance of the analyzed materials. The values of Rct obtained by adjusting the experimental data with the simulated values from the used equivalent circuit are shown in Figure 7b. Initially, at a potential of −700 mV, the values of Rct for the three HEAs are very similar. As the potential increases, Rct also increases, reaching a maximum value at −100 mV vs. SCE. This increase of Rct (and implicitly of the resistance against the corrosion) with the increase of the potential is due to the passive layer that is formed on the surface of the HEAs modifying its characteristics as a function of the potential: (a) it is more and more compact, since the parameter “n” of the constant phase element approaches 1, the ideal behavior of a capacity and, (b) it is more and more thick (Y0 decreases with the potential); see Figure 7c. The maximum value of Rct at −100 mV belongs to Al0.8, but the one that maintains the maximum value in a longer potential interval is Al0.6. This can be explained by the smaller concentration of Al species (oxide and hydroxide) in the passive film, which is a species that promotes a more defective film.
As the potential is shifted from −100 mV to more positive values, Rct decreases (and implicitly decreases the corrosion resistance). This is because the oxide layer on the sample surface is porous; thus, chlorine ions from the electrolyte can easily pass through it and corrode the unprotected metal surface. This process is proved by the decrease of the n-parameter corresponding to the diffusion process, while Yo increases a lot due to the increase of the surface exposed to the electrolyte (caused by the pores in the passive layer); see Figure 7c.
Considering that at potentials higher than −100 mV, the diffusion stage occupies an increasingly important place in the mechanism of the corrosion process, a better fitting of the experimental data is obtained by using an equivalent electrical circuit with two time constants (see Figure 8a). This circuit, called R(Q(R(QR)), considers both the characteristics of the external porous passive layer (process dominated by ion diffusion) and the internal compact layer (process dominated by charge transfer).
For this circuit, the total impedance is
Z e q = R Ω + 1 j   w   C p + 1 R p + 1 1 R c t + j   w   C d l .
After standard calculations, the following equation was obtained:
Z e q = R 1 + R w 2 R T + w 2 A B ( 1 w 2 T ) 2 + w 2 R 2 + j w B R A w 2 T B ( 1 w 2 T ) 2 + w 2 A 2
where:
  • R = R 2 + R 3
  • T = τ 1 τ 2
  • A = τ 1 + τ 2 + C 1 R 3
  • B = τ 2   R 2
  • τ 1 time   constant   of   porous   layer   [ s ]
  • τ 2 time   constant   of   compact   layer   [ s ]
No significant difference between the Rct values of the analyzed HEAs was observed (see Figure 8c). The evolution of Rp, represented in Figure 8b, shows some differences in the case of sample A0.8: the resistance of the porous passive film decreases slightly with the potential due to pores that increase in number and fill with electrolyte. At 0.7 V vs. SCE, the Rp of the HEAs decreases as the aluminum content grows: increasing the Al content in the alloys leads to a rise of Al and a diminishing of Cr in the passive films. This increase in the amount of Al contained in the passive film takes the form of Al oxides and hydroxides, which effectively build up porous layers that finally result in a thicker passive film. Accordingly, we present in Figure 8d the evolution with the potential of n and Y0p.
It is well known that Co, Ni, and Cr are extremely corrosion-resistant elements and form a strong passive film on the surface. Co2+, Co3+, Ni2+, and Cr3+ species, which are generated in the polarization process [36], form a uniform and compact passive film that successfully inhibits the contact of the Cl with the metallic surface, thus reducing the corrosion rate and improving the corrosion resistance of the alloy (see Rct evolution in Figure 8c). The decrease of resistance as the applied potential increased at positive values can be attributed to film thinning and breakdown at higher potentials.
There is a small variation in the values of the parameter n of the Ydl associated with the roughness of the electrode surface (see Figure 8e). In the positive range of potential, a variation of “n” is indicative of modifications of non-uniformity and the roughness of the passive film with respect to the metallic surface.
This could be explained by the fact that the dendritic zone of Al0.8 has much more chromium than the dendritic zone of Al0.6, and being zones of large area, the higher the Cr content in the phase, the better the corrosion resistance property of the passive film formed. However, as the potential increases, the total Al content in the alloy is prevalent, and the higher corrosion resistance is achieved by the alloy with less aluminum.

3.3. Microhardness

For each sample, five indentations were performed, and the average value is then determined.
To correlate the Vickers hardness with yield strength σy using a constant Cv that is approximately equal to 3, the Tabor equation [37] can be used:
σ y = H V C v .
Microhardness HV values for HEAs are converted into equivalent yield stress values using this equation (see Table 4).
It was observed that the decrease in aluminum concentration significantly decreased the hardness [38] and consequently the Young’s modulus and the yield strength of such alloys (see Table 4). Fan et al. observed that by increasing the level of aluminum from 0.5 to 1, the microstructure of the HEA system was changing from an FCC structure to a duplex FCC structure plus BCC and then to a simple BCC structure [39]. A previous study carried out [39] reported that the hardness of the BCC phase is greater than that of the FCC phase, which can be confirmed by our results.

4. Conclusions

The variation of aluminum content in the AlxCrFeCoNi system has a significant influence on the microstructure and the behavior of alloys in simulated body fluid.
As the aluminum content decreases, the solidified microstructure varies from equiaxed dendritic grain to equiaxed non-dendritic grain and then to columnar dendritic structure. In the equiaxed non-dendritic grain structure, Widmanstätten side plates can be observed.
The decrease in aluminum content increases the solubility limit of the solid phase for Ni and Co, decreases it for Cr and, Fe is almost unaffected.
Electrochemical Impedance Spectroscopy is a very powerful technique to study the corrosion performance of high-entropy alloys in a simulated human body environment. The obtained results were confirmed by the other techniques that were employed in this study. Circuits composed of one and two time constants in addition to the ohmic resistance of the electrolyte are proposed as equivalent circuits to fit the corrosion behavior of HEAs. The charge transfer resistance in parallel with the double layer capacitance is represented by the low frequency time constant, whereas the medium frequency one is related to the reactions of the alloy´s constituents on the metal surface. Through this technique, information was obtained about the changes of the protective capacity of the passive layers, according with the composition of the alloy and the exposure potential, which demonstrates that the analyzed alloys fulfill the prerequisites for their use as new materials for the manufacturing of medical instruments.

Author Contributions

P.P.S.-P.: writing—original draft preparation, investigation, data curation; N.R.F.-S.: conceptualization, validation, writing—review and editing; I.V.: methodology, investigation, resources; J.C.M.-R.: methodology, visualization, supervision, project administration. All authors have read and agreed to the published version of the manuscript.

Funding

This research received no external funding.

Institutional Review Board Statement

Not applicable.

Informed Consent Statement

Not applicable.

Data Availability Statement

Not applicable.

Acknowledgments

The research was sponsored by the Executive Agency for Higher Education, Research, Development, and Innovation (CNCS CCDI—UEFISCDI), within the framework of grant project Ref. PN-III-P1-1.2-PCCDI-2017-239/60PCCDI 2018—Obtaining and expertise of new biocompatible materials for medical applications—MedicalMetMat; the grant project no. PN-III-P2-2.1-PED-2019-3953/514PED 2019—New composite material with ceramic layers deposited by laser processing for applications at high temperatures and corrosion—LASCERHEA, and project number CABINFR2019-07 Gran Canaria Cabildo.

Conflicts of Interest

The authors declare no conflict of interest.

References

  1. Yeh, J.W.; Chen, S.K.; Lin, S.J.; Gan, J.Y.; Chin, T.S.; Shun, T.T.; Tsau, C.H.; Chang, S.Y. Nanostructured high-entropy alloys with multiple principal elements: Novel alloy design concepts and outcomes. Adv. Eng. Mater. 2004, 6, 299–303. [Google Scholar] [CrossRef]
  2. Chen, H.S.; Tsai, C.W.; Tung, C.C.; Yeh, L.W.; Shun, T.T.; Yang, C.C.; Chen, S.K. Effect of the substitution of Co by Mn in Al-Cr-Cu-Fe-Co-Ni high-entropy alloys. Ann. Chim. Sci. Mater. 2006, 31, 685–698. [Google Scholar] [CrossRef]
  3. Zhang, Y.; Zuo, T.T.; Tang, Z.; Gao, M.C.; Dahmen, K.A.; Liaw, P.K.; Lu, Z.P. Microstructures and properties of high-entropy alloys. Prog. Mater. Sci. 2014, 61, 1–93. [Google Scholar] [CrossRef]
  4. Lu, Y.; Dong, Y.; Guo, S.; Jiang, L.; Kang, H.; Wang, T.; Wen, B.; Wang, Z.; Jie, J.; Cao, Z.; et al. A promising new class of high-temperature alloys: Eutectic high-entropy alloys. Sci. Rep. 2014, 4, 1–5. [Google Scholar] [CrossRef]
  5. Wang, C.; Yu, J.; Yu, Y.; Zhao, Y.; Zhang, Y.; Han, X. Comparison of the corrosion and passivity behavior between CrMnFeCoNi and CrFeCoNi coatings prepared by argon arc cladding. J. Mater. Res. Technol. 2020, 9, 8482–8496. [Google Scholar] [CrossRef]
  6. Chen, Y.T.; Chang, Y.J.; Murakami, H.; Sasaki, T.; Hono, K.; Li, C.W.; Kakehi, K.; Yeh, J.W.; Yeh, A.C. Hierarchical microstructure strengthening in a single crystal high entropy superalloy. Sci. Rep. 2020, 10, 1–11. [Google Scholar] [CrossRef] [PubMed]
  7. Ríos, M.L.; Perdomo, P.S.; Voiculescu, I.; Geanta, V.; Crăciun, V.; Boerasu, I.; Rosca, J.M. Effects of nickel content on the microstructure, microhardness and corrosion behavior of high-entropy AlCoCrFeNix alloys. Sci. Rep. 2020, 10, 1–11. [Google Scholar] [CrossRef]
  8. Zhang, Y. High-Entropy Materials—A Brief Introduction; Springer Nature: Singapore, 2019. [Google Scholar] [CrossRef]
  9. Wang, Y.P.; Li, B.S.; Ren, M.X.; Yang, C.; Fu, H.Z. Microstructure and compressive properties of AlCrFeCoNi high entropy alloy. Mater. Sci. Eng. A 2008, 491, 154–158. [Google Scholar] [CrossRef]
  10. Dasari, S.; Jagetia, A.; Chang, Y.J.; Soni, V.; Gwalani, B.; Gorsse, S.; Yeh, A.C.; Banerjee, R. Engineering multi-scale B2 precipitation in a heterogeneous FCC based microstructure to enhance the mechanical properties of a Al0.5Co1.5CrFeNi1.5 high entropy alloy. J. Alloys Compd. 2020, 830, 154707. [Google Scholar] [CrossRef]
  11. Tang, Z.; Gao, M.C.; Diao, H. Aluminum Alloying Effects on Lattice Types, Microstructures, and Mechanical Behavior of High-Entropy Alloys SystemsNo Title. JOM 2013, 65, 1848–1858. [Google Scholar] [CrossRef]
  12. Hou, J.; Zhang, M.; Yang, H.; Qiao, J.; Wu, Y. Surface strengthening in Al0.25CoCrFeNi high-entropy alloy by boronizing. Mater. Lett. 2019, 238, 258–260. [Google Scholar] [CrossRef]
  13. Shun, T.T.; Du, Y.C. Microstructure and tensile behaviors of FCC Al0.3CoCrFeNi high entropy alloy. J. Alloys Compd. 2009, 479, 157–160. [Google Scholar] [CrossRef]
  14. Gwalani, B.; Gorsse, S.; Choudhuri, D.; Zheng, Y.; Mishra, R.S.; Banerjee, R. Tensile yield strength of a single bulk Al 0.3 CoCrFeNi high entropy alloy can be tuned from 160 MPa to 1800 MPa. Scr. Mater. 2019, 162, 18–23. [Google Scholar] [CrossRef]
  15. Csaki, I.; Stefanoiu, R.; Geanta, V.; Voiculescu, I.; Sohaciu, M.G.; Soare, A.; Popescu, G.; Serghiuta, S. Researches regarding the processing technique impact on the chemical composition, microstructure and hardness of AlCrFeNiCo high entropy alloy. Rev. Chim. 2016, 67, 1373–1377. [Google Scholar]
  16. Lin, C.M.; Tsai, H.L. Evolution of microstructure, hardness, and corrosion properties of high-entropy Al0.5CoCrFeNi alloy. Intermetallics 2011, 19, 288–294. [Google Scholar] [CrossRef]
  17. Chen, M.; Lan, L.; Shi, X.; Yang, H.; Zhang, M.; Qiao, J. The tribological properties of Al0.6CoCrFeNi high-entropy alloy with the σ phase precipitation at elevated temperature. J. Alloys Compd. 2019, 777, 180–189. [Google Scholar] [CrossRef]
  18. Geantă, V.; Voiculescu, I.; Stefănoiu, R.; Chereches, T.; Zecheru, T.; Matache, L.; Rotariu, A. Dynamic Impact Behaviour of High Entropy Alloys Used in the Military Domain. IOP Conf. Ser. Mater. Sci. Eng. 2018, 374, 012041. [Google Scholar] [CrossRef]
  19. Li, C.; Li, J.C.; Zhao, M.; Jiang, Q. Effect of aluminum contents on microstructure and properties of Al xCoCrFeNi alloys. J. Alloys Compd. 2010, 504, 515–518. [Google Scholar] [CrossRef]
  20. Wang, W.R.; Wang, W.L.; Wang, S.C.; Tsai, Y.C.; Lai, C.H.; Yeh, J.W. Effects of Al addition on the microstructure and mechanical property of Al xCoCrFeNi high-entropy alloys. Intermetallics 2012, 26, 44–51. [Google Scholar] [CrossRef]
  21. Kao, Y.F.; Chen, T.J.; Chen, S.K.; Yeh, J.W. Microstructure and mechanical property of as-cast, -homogenized, and -deformed AlxCoCrFeNi (0 ≤ x ≤ 2) high-entropy alloys. J. Alloys Compd. 2009, 488, 57–64. [Google Scholar] [CrossRef]
  22. Zhao, Y.; Wang, M.; Cui, H.; Zhao, Y.; Song, X.; Zeng, Y.; Gao, X.; Lu, F.; Wang, C.; Song, Q. Effects of Ti-to-Al ratios on the phases, microstructures, mechanical properties, and corrosion resistance of Al2-xCoCrFeNiTix high-entropy alloys. J. Alloys Compd. 2019, 805, 585–596. [Google Scholar] [CrossRef]
  23. Voiculescu, I.; Geanta, V.; Stefanoiu, R.; Patrop, D.; Binchiciu, H. Influence of the chemical composition on the microstructure and microhardness of alcrfeconi high entropy alloy. Rev. Chim. 2013, 64, 1441–1444. [Google Scholar]
  24. Kao, Y.F.; Lee, T.D.; Chen, S.K.; Chang, Y.S. Electrochemical passive properties of AlxCoCrFeNi (x = 0, 0.25, 0.50, 1.00) alloys in sulfuric acids. Corros. Sci. 2010, 52, 1026–1034. [Google Scholar] [CrossRef]
  25. Tang, Z.; Huang, L.; He, W.; Liaw, P.K. Alloying and processing effects on the aqueous corrosion behavior of high-entropy alloys. Entropy 2014, 16, 895–911. [Google Scholar] [CrossRef]
  26. Kao, Y.F.; Chen, S.K.; Chen, T.J.; Chu, P.C.; Yeh, J.W.; Lin, S.J. Electrical, magnetic, and Hall properties of AlxCoCrFeNi high-entropy alloys. J. Alloys Compd. 2011, 509, 1607–1614. [Google Scholar] [CrossRef]
  27. Li, Z.; Zhao, S.; Ritchie, R.O.; Meyers, M.A. Mechanical properties of high-entropy alloys with emphasis on face-centered cubic alloys. Prog. Mater. Sci. 2019, 102, 296–345. [Google Scholar] [CrossRef]
  28. Miracle, D.B.; Senkov, O.N. A critical review of high entropy alloys and related concepts. Acta Mater. 2017, 122, 448–511. [Google Scholar] [CrossRef] [Green Version]
  29. Levine, D.L.; Staehle, R.W. Crevice Corrosion in Orthopedic Implant Metals. J. Biomed. Mater. Res. 1977, 11, 553–561. [Google Scholar] [CrossRef]
  30. ASTM B214-16, Standard Test Method for Sieve Analysis of Metal Powders; ASTM International: West Conshohocken, PA, USA, 2016. [CrossRef]
  31. ISO 14577-1:2015 Metallic Materials—Instrumented Indentation Test for Hardness and Materials Parameters—Part 1: Test Method n.d; ISO: Geneva, Switzerland, 2015.
  32. ISO 16773-1-4:2016 Electrochemical Impedance Spectroscopy (EIS) on Coated and Uncoated Metallic Specimens n.d; ISO: Geneva, Switzerland, 2015.
  33. Scully, R.; Silverman, D.C.; Kendig, M. Electrochemical Impedance: Analysis and Interpretation; ASTM: Philadelphia, PA, USA, 1993. [Google Scholar] [CrossRef]
  34. González, J.E.G.; Mirza-Rosca, J.C. Study of the corrosion behavior of titanium and some of its alloys for biomedical and dental implant applications. J. Electroanal. Chem. 1999, 471, 109–115. [Google Scholar] [CrossRef]
  35. Boukamp, B.A. A nonlinear least squares fit procedure for analysis of immittance data of electrochemical systems. Solid State Ionics 1986, 20, 31–44. [Google Scholar] [CrossRef] [Green Version]
  36. Nascimento, C.B.; Donatus, U.; Ríos, C.T.; Antunes, R.A. Electronic properties of the passive films formed on CoCrFeNi and CoCrFeNiAl high entropy alloys in sodium chloride solution. J. Mater. Res. Technol. 2020, 9, 13879–13892. [Google Scholar] [CrossRef]
  37. Fan, Q.C.; Li, B.S.; Zhang, Y. Influence of Al and Cu elements on the microstructure and properties of (FeCrNiCo)AlxCuy high-entropy alloys. J. Alloys Compd. 2014, 614, 203–210. [Google Scholar] [CrossRef]
  38. Rios, M.L.; Baldevenites, V.L.; Voiculescu, I.; Rosca, J.M. AlCoCrFeNi High Entropy Alloys as Possible Nuclear Materials. Microsc. Microanal. 2020, 26, 406–407. [Google Scholar] [CrossRef]
  39. Li, B.; Peng, K.; Hu, A.; Zhou, L.; Zhu, J.; Li, D. Structure and properties of FeCoNiCrCu0.5Alx high-entropy alloy. Trans. Nonferrous Met. Soc. China 2013, 23, 735–741. [Google Scholar] [CrossRef]
Figure 1. Metallographic microscopy and SEM images for Al1.0CrFeCoNi (a,d), Al0.8CrFeCoNi (b,e), and Al0.6CrFeCoNi (c,f).
Metals 11 00928 g001
Figure 2. EDAX analysis on the surface of the alloy Al0.6CrFeCoNi (the point analysis of chemical composition was in the right upper corner of each rectangle).
Metals 11 00928 g002
Figure 3. Nyquist diagrams evolution with the potential for (a) Al1.0, (b) Al0.8, and (c) Al0.6.
Metals 11 00928 g003
Figure 4. Bode-phase spectra at negative potentials for (a) Al1.0, (b) Al0.8, and (c) Al0.6.
Metals 11 00928 g004
Figure 5. Bode-IZI spectra for (a) Al1.0, (b) Al0.8, and (c) Al0.6.
Metals 11 00928 g005
Figure 6. Bode-phase spectra at positive potentials for (a) Al1.0, (b) Al0.8, and (c) Al0.6.
Metals 11 00928 g006
Figure 7. (a) Simple equivalent circuit used for the fitting; (b) Rct evolution with the potential; (c) Y0 and n parameter corresponding to Cdl for the studied alloys.
Metals 11 00928 g007
Figure 8. (a) Equivalent circuit with two time constants used for the fitting of spectra at positive potentials; (b) Rp evolution with the potential; (c) Rct evolution with the potential; (d) Y0 and n1 parameter corresponding to Cp for the external layer; (e) Y0 and n2 parameter corresponding to Cdl for the internal layer.
Metals 11 00928 g008
Table 1. Composition (wt %) for analyzed HEAs.
Composition (wt %)AlCrFeCoNi
Al1.0CrFeCoNi (Al1.0)10.6720.5522.1323.3223.33
Al0.8CrFeCoNi (Al0,8)8.7221.0022.6123.8223.85
Al0.6CrFeCoNi (Al0,6)6.6821.4723.1224.3624.36
Table 2. The results in weight percentage of EDAX analysis of the alloyAl0.6CrFeCoNi.
SpectrumAlCrFeCoNi
Sum Spectrum6.8720.6624.1824.0424.26
Spectrum 25.7420.9026.2325.0422.09
Spectrum 35.8620.7826.0724.8222.47
Spectrum 46.0220.9325.4324.7122.91
Spectrum 55.7420.8926.1024.8822.38
Spectrum 66.1220.7125.7024.6322.84
Spectrum 78.7522.1222.7022.4823.95
Spectrum 88.1621.0823.0823.4524.24
Spectrum 98.5722.2822.9922.5523.61
Spectrum 109.0421.4822.5922.3824.52
Mean7.0921.1824.5123.9023.33
Standard deviation1.380.581.551.090.89
Table 3. Composition analysis results in D and ID areas and SR values for Al0.6CrFeCoNi and Al0.8CrFeCoNi alloys.
AlloyParametersAlCrFeCoNi
Al0.6CrFeCoNiD5.7420.926.2325.0422.09
ID9.0421.4822.5922.3824.52
SR0.630.971.161.120.90
Al0.8CrFeCoNiD7.9826.6323.3222.1519.92
ID10.8520.9920.6322.3925.15
SR0.741.271.130.990.79
Table 4. Mechanical properties of analyzed HEAs.
PropertyAl1.0CrFeCoNi (Al1.0)Al0.8CrFeCoNi (Al0,8)Al0.6CrFeCoNi (Al0,6)
HV (MPa)562 ± 33427 ± 17245 ± 11
σy (MPa)187.5 ± 11142.3 ± 681.9 ± 4
Publisher’s Note: MDPI stays neutral with regard to jurisdictional claims in published maps and institutional affiliations.

