Abstract
The development of low-cost and high-efficiency catalysts for wastewater treatment is of great significance. Herein, nanoporous Cu/Cu2O catalysts were synthesized from MnCu, MnCuNi, and MnCuAl with similar ligament size through one-step dealloying. Meanwhile, the comparisons of three catalysts in performing methyl orange degradation were investigated. One of the catalysts possessed a degradation efficiency as high as 7.67 mg·g−1·min−1. With good linear fitting by the pseudo-first-order model, the reaction rate constant was evaluated. In order to better understand the degradation process, the adsorption behavior was considered, and it was divided into three stages based on the intra-particle diffusion model. Three different temperatures were applied to explore the activation energy of the degradation. As a photocatalytic agent, the nanoporous structure of Cu/Cu2O possessed a large surface area and it also had low activation energy, which were beneficial to the excellent degradation performance.
1. Introduction
With the development of modern industry, water pollution caused by azo dyes becomes the major source of environmental contamination [1,2,3,4]. The removal of harmful azo dyes as much as possible is of great significance to the well-being of human society. In recent decades, the development of semiconductor photocatalysis in wastewater treatment, such as titanium dioxide (TiO2) and zinc oxide (ZnO), has raised attention due to its outstanding degradation activity [5,6,7]. However, the large band gap limits the effective utilization of sunlight. Cuprous oxide (Cu2O) is known as a p-type semiconductor that possesses a narrower band gap (2.0 eV), which makes it possible to absorb a larger range of visible light when compared with traditional TiO2 and ZnO [8]. Meanwhile, nanoporous materials also exhibit great potentials in azo dye degradation [9,10]. Lately, Cu with nanocluster or three-dimensional hierarchical nanoporous structures have been utilized in azo dye degradation [11,12,13,14,15]. However, the preparation of these nanostructures is complicated. Therefore, it is still a big challenge to exploit nanoporous materials with superior functional performance, outstanding stability, and lower cost. Up to now, nanoscale copper and copper oxides materials have shown enormous potential in optical and catalytical applications [16,17]. The Cu2O@nanoporous copper that was prepared from dealloying, anodizing, and heat treatment exhibited ultrahigh photocatalytic property [18]. The multimodal hierarchical porous structure of Cu2O/CuO@nanoporous copper, which was prepared by the dealloying and anodizing, showed remarkably high photocatalytic degradation performance [19]. In the situation where only Cu2O existed, it merely reached 76% of the methyl orange photocatalytic activity [20].
Dealloying has developed into a rich field. It is widely used to fabricate the high surface area of bicontinuous nanoporous materials [21,22,23,24,25]. In brief, dealloying is a selective dissolution process in which the noble component is diffused and rearranged to form the nanoporous structure, while the active component selectively dissolved [26]. In 2006, Hayes first reported the synthesis of monolithic nanoporous copper by dealloying Mn-Cu alloy [27]. Mn-Cu alloy is suggested to be a suitable precursor, due to the high solubility of single-phase solid and the high difference of the standard reversible potential between Mn/Mn2+ and Cu/Cu2+. Since then, the Cu-based alloys have been widely chosen to be a dealloying precursor [28,29,30,31]. Researchers have tried ternary precursor alloys to tune the nanoporous structure. The resulted pore size of the nanoporous structure is reduced to half of the regular nanoporous gold with the addition of Pt to the Ag–Au alloy [32]. The previous studies have shown that adding a small amount of non-noble nickel to MnCu alloys as a noble part can help refine the nanoporous copper [33]. Unlike this, the addition of an active element to the dealloying precursor has rarely been reported. As is well-known, Al is a common active part of the dealloying precursors [34].
The degradation performance of dealloyed nanoporous copper catalysts and the degradation mechanism are still not clear. The dealloying technique was applied for the one-step preparation of the three kinds of Cu/Cu2O catalysts for the azo dye degradation. In addition, the difference in degradation performance among the dealloyed third element additives (Ni, Al) in the MnCu precursors was explored. Methyl orange, which is a typical anionic azo dye (MO, chemical formula: C14H14N3SO3Na), is used as the target. Moreover, the degradation mechanism of the nanoporous copper catalyst was discussed, based on the adsorption behavior and thermodynamic analysis. Through this work, the dealloying precursor system can be expanded and the degradation mechanism can be revealed as well.
2. Materials and Methods
Precursors for the dealloying with nominal composition of Mn72Cu28 (at %), Mn72Cu25Ni3 (at %), and Mn48Cu28Al24 (at %) were prepared by high-frequency induction melting of pure Mn slice (99.97%), pure Cu block (99.98%), pure Ni block (99.9%), and pure Al block (99.99%). After that, the precursor ribbons with a thickness of 30–50 μm and a width of 3 mm were obtained by melt-spinning on a rotating copper roll under the Ar atmosphere protection.
The nanoporous copper obtained by dealloying from Mn72Cu28 was named NPC1. Similarly, NPC2 stands for that of Mn72Cu25Ni3 and NPC3 stands for that of Mn48Cu28Al24. NPC1 was prepared in 0.1 M HCl solution for 1800 s at 25 °C, NPC2 was obtained in 0.1 M HCl solution for 3600 s at 25 °C, and NPC3 was fabricated in 0.2 M HCl solution for 1200 s at 50 °C. The HCl aqueous solutions were prepared with de-ionized water and de-aerated by charging high-purity Ar. Additionally, the dealloyed specimens were rinsed with de-ionized water and dried in the air for 3 days. X-ray diffraction (XRD) analysis was performed on Bruker-AXS D8 advance equipment (Bruker, Karlsruhe, Germany) by using Cu Kα radiation. The micro-structure morphology and composition of NPC1, NPC2, and NPC3 were characterized by transmission electron microscopy (TEM, TECNAI G2 20 LaB6, FEI, Hillsboro, OR, USA) and selected area electron diffraction (SAED). The chemical compositions were analyzed by using an energy-dispersive X-ray spectrometer (EDS, FEI Quanta 250 FEG, FEI, Hillsboro, OR, USA). The surface area of three kinds of catalysts was measured with an ASAP 2020HD88 instrument (Micromeritics, Norcross, GA, USA) by using the Brunauer–Emmett–Teller (BET) method. The chemical compositions and elemental states were tested by the X-ray photoelectron spectroscopy (XPS, Thermo ESCALAB 250XI, Thermo, Waltham, MA, USA).
Before the MO solution degradation experiment, the agate mortar was used for the grind of the dealloyed ribbons to get a better uniformity of dealloyed samples. The degradation behaviors of the three catalysts were investigated at room temperature under the sunlight from 10 a.m. to 12:00 p.m. on sunny days. The degradation experiment was conducted in a 500 mL 20 mg/L MO solution with 40 mg catalysts added. The MO solution was stirred at the speed of 100 rpm by a magnetic stirring apparatus. Then, 4 mL solution was taken out every 5 min and filtered for the ultraviolet-visible absorption (UV-Vis, SHIMADZU UV-3600 spectrometer, SHIMADZU, Kyoto, Japan). The deionized water was used as the reference solution.
3. Results and Discussion
3.1. Microstructure Characterization
In order to reduce the influence of ligament size differences, the dealloying processes were adjusted to obtain nanoporous coppers with similar feature size. Table 1 lists the contents of all elements contained in the nanoporous copper catalysts obtained by dealloying three precursors. Among them, the copper content of NPC1 was as high as 98.25%, and a small amount of oxygen was detected. The copper contents of the NPC2 and NPC3 samples were relatively close. The oxygen content of NPC2 was 1.88%, and nickel was also retained as the noble component. There was still a little residual Mn and Al that remained in the NPC3 sample, and the oxygen content reached 5.73%. The nickel element in NPC2 and the aluminum element in NPC3 increased the oxidation tendency of nanoporous copper.

Table 1.
EDS data of nanoporous copper catalysts.
The TEM images of the three catalysts and the corresponding SAED patterns are shown in Figure 1. The size of the nanoporous copper catalysts particles ranged from hundreds of nanometers to several microns. The bright-field images exhibited the three-dimensional bicontinuous ligament–pore nanostructure, and the average ligament size was between 30 and 40 nm. The corresponding SAED patterns were composed of several concentric diffraction rings and exhibited typical polycrystalline characteristics. It was different from the single-crystal properties of the nanoporous structure described in the previous literature [25]. The precursors obtained in this paper were all crystalline, which was not identical to the amorphous precursors. It was worth noting that the polycrystalline ring with weak diffraction intensity represented by the red double-line arrow corresponded to the Cu2O (111) and (200). The interplanar spacing of Cu (111) was very close to that of Cu2O (200). The SAED patterns further confirmed that the three photocatalysts contained both Cu and Cu2O. This was due to the large specific surface area and high chemical activity of the nanoporous copper catalysts prepared by dealloying, which could hardly avoid oxidation in the air. Based on the above analysis, the existence of Cu2O on the surface of the nanoporous copper ligament could be ascertained, and Cu2O was formed on the surface of nanoporous copper by epitaxial growth due to the small gap between the two crystal surfaces. Finally, a nanoporous copper containing Cu2O was obtained.

Figure 1.
TEM images and SAED patterns of nanoporous catalysts prepared by dealloying MnCu (a,d), MnCuNi (b,e), and MnCuAl (c,f). The XRD patterns of NPC1, NPC2, and NPC3 are exhibited in Figure 2a. The diffraction peaks at about 43.6°, 51.1°, and 74.8° were assigned to Cu, and some diffraction peaks originating from Cu2O were confirmed. The NPC2 sample with a minor addition of Ni did not cause the emergence of a new phase; this is due to the complete solubility in the Cu-Ni system. As for the NPC3 sample, the addition of Al element was etched away during the dealloying process. The nitrogen adsorption–desorption isotherms and the corresponding pore size distribution of NPC1, NPC2, and NPC3 are exhibited in Figure 2b. It can be seen clearly that the sorption isotherms exhibited hysteresis loops, which were caused by the porous characteristics. The BET surface area for NPC1, NPC2, and NPC3 were 28.832, 31.739, and 36.455 m2 g−1, respectively. The NPC3 catalyst got the relatively high surface area.
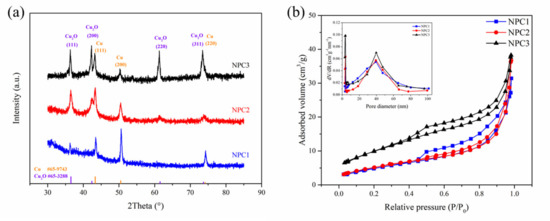
Figure 2.
XRD patterns of the NPC1, NPC2, and NPC3 catalysts (a); N2 adsorption/desorption isotherms of the three catalysts, insert: the corresponding pore size distribution (b).
3.2. MO Degradation Behavior
Figure 3a–c presented the UV-visible light absorption spectra of the three catalysts during the degradation process of methyl orange. The MO solution concentration was proportional to the intensity of the UV-visible absorption peak. The MO solution equilibrium concentrations of adsorption at time t and the initial state were C and C0, respectively. The normalized intensities C/C0 of the UV-Vis absorption peak at 465 nm as a function of the degradation time for the three catalysts are exhibited in Figure 3d. In the degradation process, the absorption intensity gradually decreased with the increase of reaction time. Especially, at the maximum absorption wavelength of 465 nm, corresponding to the azo chromophore (), the characteristic absorbance decreased significantly with the extension of the degradation time. This indicated that the three catalysts could effectively catalyze the degradation of MO solution.
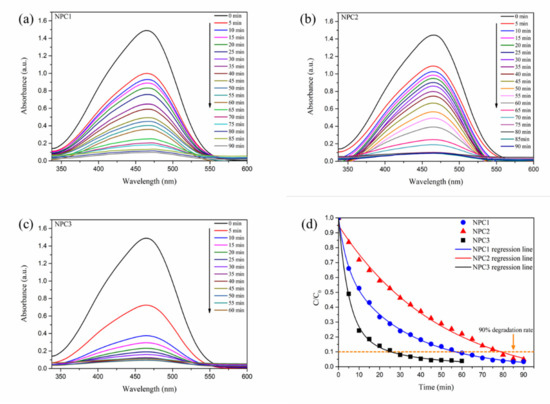
Figure 3.
UV-Vis absorption spectra of degradation process toward MO solution by three different catalysts (a–c) and their relative degradation rate (d).
The degradation rate of MO solution reached more than 90% after 60 min and 80 min when NPC1 and NPC2 were used as catalysts, respectively. In the NPC3 system, the absorbance dropped rapidly within 10 min, and it only took 30 min to reach a degradation rate of more than 90%. The degradation efficiency of NPC3 was significantly improved when compared with that of NPC1 and NPC2, indicating their excellent catalytic degradation performance.
Through nonlinear curve fitting, the degradation behavior at the solid–liquid interface was in good agreement with the first-order exponential decay kinetics, which follows the pseudo-first-order kinetic model:
where k is represented the observed reaction rate constant, and t was the reaction time. The logarithmic formula deformation equation is shown below:
The corresponding fitting results are presented in Figure 4. The regression lines of NPC1, NPC2, and NPC3 catalysts showed a good linear relationship. The slope of the lines denoted the reaction rate constant k and the calculated values were 0.037, 0.028, and 0.064 for NPC1, NPC2, and NPC3, respectively. The enhanced MO degradation performance of NPC3 system may be attributed to the highest k value.
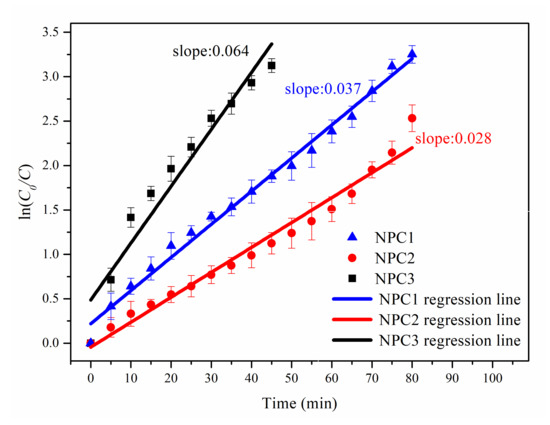
Figure 4.
Regression lines of the pseudo-first-order kinetic model for three different catalysts toward the MO solution degradation process.
Table 2 lists the degradation performances of different catalysts with a degradation rate of more than 90% for methyl orange. Degradation efficiency (De, mg g−1 min−1) was calculated by the following equation:
where C and C0 are the initial concentration and at time t, respectively, V is the solution volume, m is the NPC additive amount, and t is the time. The degradation efficiency of NPC3 was as high as 7.67 mg·g−1·min−1, which was more than twice or three times that of the degradation efficiency of NPC1 and NPC2, respectively. As well, it was much higher than the degradation efficiency achieved by the other reports listed in the table.
Table 2.
Degradation process data of different catalysts.
Moreover, the XPS measurements were conducted to characterize the surface chemical state of three kinds of degraded catalysts powder for further understanding the MO solution degradation behavior. The results are presented in Figure 5, which correspond to the Cu 2p spectra (a) and O 1s spectra (b). NPC1, NPC2, and NPC3 catalysts obtained similar results from XPS. A shoulder was observed at 932.6 eV on the main peak, which proved the coexistence of Cu (I) and Cu (II). The higher binding energy Cu 2p3/2 peak at 934.4 eV and its shakeup satellites were caused by Cu (II). These peaks reflected the presence of Cu/Cu2O and CuO. In the case of the O 1s spectra, there were three states for O, including lattice oxygen, adsorbed oxygen, and oxygen in H2O. The presence of Cu2O on the surface of nanoporous copper was closely related to the degradation behavior. Some of the mixed Cu/Cu2O changed to CuO after the degradation process. The Cu/Cu2O acted as part of the electron donor, and the azo dye molecules acted as the electron acceptor. Thus, a redox reaction was formed during the degradation process.
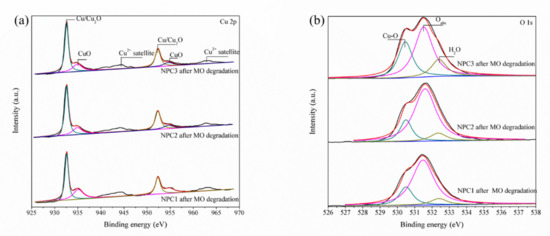
Figure 5.
XPS high-resolution spectra of the Cu 2p (a) and O 1s (b) regions of three nanoporous copper catalysts after MO degradation.
In addition to the high catalytic activity during the degradation process, good catalytic recyclability is also an important factor for industrial application. Figure 6a exhibited the catalytic recyclability of NPC1, NPC2, and NPC3 during the four cycles (90 min for each cycle). It can be seen that over 90% of the degradation ratio could be recovered after four degradation cycles, although there was a slight reduction with increasing cycle numbers. These results demonstrated that the three catalysts had good stability and reusability for the MO degradation. To further clarify if there were any changes after the degradation, the catalysts after the fourth cycle were investigated by XRD (shown in Figure 6b). Compared with Figure 1, the characteristic peaks of Cu and Cu2O are clearly presented.
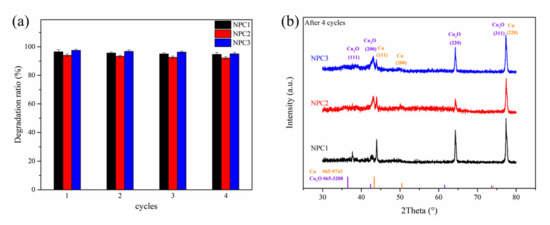
Figure 6.
Cycle runs for the MO degradation by the NPC1, NPC2, and NPC3 catalysts under sunlight (a); XRD patterns of NPC1, NPC2, and NPC3 catalysts after four cycles (b).
The benefits of the bicontinuous nanoporous structure enabled these nanoporous copper catalysts to achieve excellent MO degradation performance. Especially, NPC3 owned the highest degradation efficiency, which meant that the shorter time could obtain better results. Due to the high oxygen content, NPC3 contained much more Cu2O. With the same mass of catalyst added to MO solution, NPC3, which had the relatively high surface area, provided more hydroxyl radical active sites. That might account for the accelerated degradation process. The NPC2 catalyst contained a minor amount of nickel, which may affect the electrical conductivity.
3.3. MO Degradation Mechanism
The process of adsorption, which had a significant effect on the final degradation results, mainly occurred in the MO solution degradation. Meanwhile, the adsorption behavior was investigated to better explore the degradation process and uncover the mechanism. As an anion azo dye, MO molecules were attached to the nanoporous catalysts mainly through electrostatic adsorption [37]. There were evidence that the pH value of the solution could affect the adsorption capacity by changing the surface charge on the interface [38,39]. The previous studies have shown that the MO solution color exhibited red when the chromogenic group received protons and the maximum absorption wavelength increased in a highly acidic solution environment [40]. The MO molecules existed in the form of alkaline structure under alkaline condition. Additionally, a large number of hydroxides and methyl orange anions competed for the adsorption site, which was due to the increased electrostatic repulsion force. Eventually, it was difficult to achieve the degradation effect. Therefore, the adsorption behavior of a 20 mg/L MO solution under the natural state was investigated without any pH adjustment, and the pH value was measured to be 5.79.
A variety of classical adsorption dynamic models can be employed to measure the mass transfer and the vital steps that controlled the reaction rate during the adsorption. Herein, the Weber–Morris intra-particle diffusion model is used for the MO catalysis of the nanoporous copper catalysts. The assumptions of this model are that the diffusion resistance of liquid film can be ignored, or the diffusion resistance of the liquid membrane only works for a very short time during the initial stage of adsorption, and the internal diffusion coefficient was constant and remained unchanged as the absorption time or adsorption site changes. The intra-particle diffusion model formula is presented as follows:
where Kip is the diffusion rate constant (mg·g−1·min−1), also known as the velocity factor, which is used to represent the absorption amount per unit of time, qt is the absorption capacity by unit mass catalysts at t (mg·g−1), and C is constant and related to the thickness of the boundary layer.
Figure 7 presented the fitting lines of the intra-particle diffusion model for the three nanoporous copper catalysts applied to the MO adsorption. The fitting lines exhibited various variation trends. The linear relationship demonstrated the presence of intra-particle diffusion. It was not the only diffusion, because none of the fitting lines went through the origin. The adsorption behavior in the catalytic process was characterized by a continuous segmentation process, indicating that there were two or three adsorption processes. Especially, there were three linear slopes in the NPC3 system, which needed more attention. It illustrated that the adsorption process went through three stages. In phase I, the precipitous line showed the rapidly increasing absorption of MO by the NPC3 catalyst. The methyl orange molecules in the solution spread to the liquid membrane attached to the NPC3 catalyst surface and then broke through. Followed by the catalyst surface diffusion, they gradually reached the active site. At this stage, electrostatic adsorption was the main driving force. In phase II, the MO molecules diffused through the pores of nanoporous copper structure. According to the chemical structural formula of MO and the valence radius of the element, the molecular diameter size was less than 10 nm. The pore size of the nanoporous copper catalyst was in the range of tens of nanometers. When the MO molecules entered the inner pore channels, there was a competitive relationship between each molecule, resulting in diffusion resistance. Therefore, the diffusion rate constant was obviously smaller than that in the first stage. In phase III, the slope value of the third stage was basically zero. After the quick molecular movement and the diffusion through the pore channel of the front two stages, the adsorption active sites on the surface of the NPC3 catalyst had been occupied to near saturation. At this point, a dynamic equilibrium process between adsorption and desorption was presented, and the diffusion rate constant was close to zero.
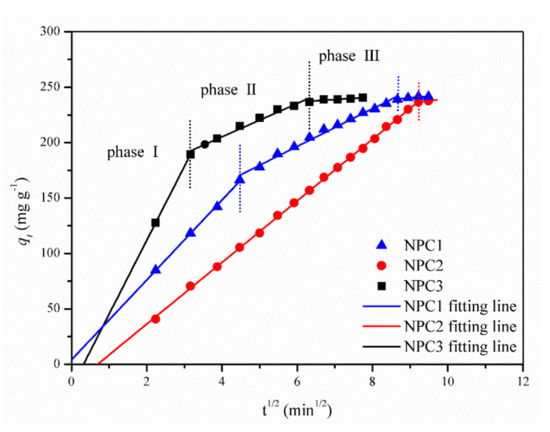
Figure 7.
Plots of intra-particle diffusion model fitting curves for the adsorption behavior of catalysts in MO solution.
The fitting lines of both NPC1 and NPC3 represented a complete three-stage process. Furthermore, it took less time for the NPC3 catalyst to reach each stage. In contrast, for the NPC2 system, the first two stages directly entered the state of adsorption/desorption equilibrium without significant demarcation. According to the reaction rate constant obtained in Figure 4, the reaction rate of the NPC2 system was the slowest. Therefore, there were only two stages in the adsorption behavior of MO by the NPC2 catalyst.
It is known that the difficulty degree of degradation behavior can be evaluated by the Arrhenius formula from the thermodynamic perspective. Activation energy is a measure of the chemical reaction rate constant with the variation of temperature, which reflects the temperature sensitivity. Based on the Arrhenius formula, the degradation activation energy (, kJ mol−1) can be concluded with the variation of temperature using the equation below:
where kT is the reaction rate constant at temperature T, R is the gas constant, and A is the pre-exponential factor. The values of lnk are proportional to the values of −T−1. The corresponding data plots and fitting linear curves are shown in Figure 8. For all three nanoporous copper catalysts, the degradation efficiencies of methyl orange could reach more than 95% within a certain reaction time. By increasing the experimental temperature from 293 to 308 K, or even to 323 K, the degradation trend of the three catalysts did not change significantly. However, the time required to achieve the same degradation efficiency was gradually shortened. It was noted that the increasing reaction temperature was beneficial to the catalytic degradation. The k value could be fitted with the Arrhenius formula, and the resulting curves are shown in Figure 8d. The lnk owned a good linear relationship with 1/T. Based on these results, it could be calculated that the activation energies of the three catalysts NPC1, NPC2, and NPC3 were 24.3, 28.9, and 18.6 kJ mol−1, respectively in the catalytic degradation on methyl orange. They were much lower than the results of other reports [12,41]. Moreover, the value of activation energy indicated the height of the energy barrier that had to be crossed when nanoporous copper began to degrade MO. Therefore, the NPC3 catalyst system with low reaction activation energy was easier to perform. The smaller the activation energy, the more activated molecules would participate in the catalytic degradation reaction, leading to a faster rate of chemical reaction. As a result, the NPC3 catalyst exhibited better catalytic degradation activity.
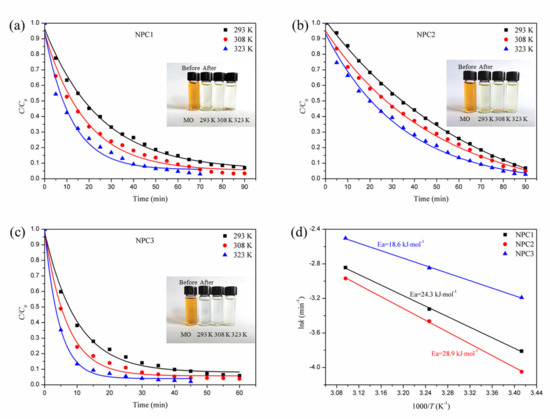
Figure 8.
The normalized concentration (C/C0) with degradation time of nanoporous copper catalysts at three different temperatures, NPC1 (a), NPC2 (b), and NPC3 (c), and the Arrhenius plots of lnk versus 1/T for the degradation toward MO by three different nanoporous copper catalysts (d).
As known, the most active bond is the nitrogen to nitrogen double bonds in the azo dye molecule, which is also the chromophore group. The degradation process of the nanoporous copper catalyst resulted from the cleavage of nitrogen–nitrogen double bonds. According to the results mentioned above, the degradation reaction process of the nanoporous copper catalyst on the methyl orange solution could be described as follows. Firstly, under the interaction of the electrostatic adsorption force, the methyl orange molecules deposited on the catalyst surface and then reached and occupied the active site through surface diffusion and intra-particle diffusion. After that, when the Cu2O on the catalyst surface acquired energy from natural light, the electrons in the valence band transitioned to the conduction band. Meanwhile, the photogenerated holes were produced in the valence band. The water molecules adsorbed on the surface of the nanoporous copper were oxidized by the holes in the valence band to form the hydroxyl radical (·OH). The photogenerated electrons of Cu2O were transmitted to the nanoporous copper. This could realize the effective separation of electron–hole pairs and avoid the loss of photocatalytic efficiency caused by the composite of Cu2O photogenerated carriers. Meanwhile, O2 received an electron to form a superoxide anion radical () and acquired another electron to generate the .The further addition of electrons to the peroxide ion could completely interrupt the oxygen bond to synthesize metastable H2O2. Since the binding bond in H2O2 was weak, it was easy to break into OH. The hydroxyl radicals generated by these two methods reacted with methyl orange molecules through redox reaction. Moreover, the large surface area of the nanoporous structure could also act as the ion diffusion channels for the reaction mass transport and provide more trapping sites for the degradation. Ultimately, the MO degradation was realized through the nanoporous copper catalyst. The photocatalytic degradation reaction mechanism of nanoporous copper catalyst on methyl orange by was presented in Figure 9.
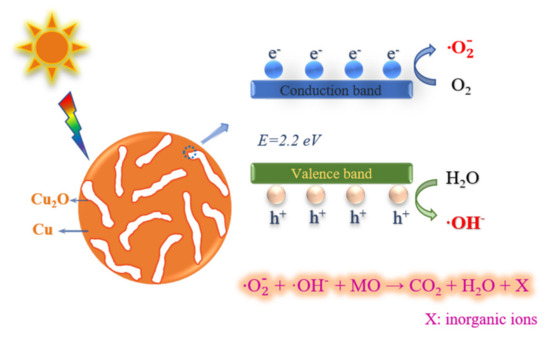
Figure 9.
The schematic illustration of the photodegradation mechanism of nanoporous Cu/Cu2O in MO solution.
The photocatalytic degradation of nanoporous copper catalysts on methyl orange could be described in the following steps:
4. Conclusions
Three kinds of nanoporous copper catalysts with bicontinuous ligament–pore structure and a similar average ligament size were prepared for the degradation of MO. All the catalysts exhibited excellent degradation performance. Especially for NPC3 catalyst, its degradation efficiency was 7.67 mg·g−1·min−1, which was about two and three times higher than that of NPC1 and NPC2, respectively. The degradation kinetics can be well fitted by a pseudo-first-order model. The intra-particle diffusion model was utilized to investigate the adsorption behavior in the degradation process. According to the multiple linear relationship, the absorption process included surface adsorption under electrostatic force, the diffusion of methyl orange molecules along the inner pore channels of the nanoporous structure, and the dynamic equilibrium of final adsorption and desorption. The activation energy of NPC1, NPC2, and NPC3 in the catalytic degradation was calculated to be 24.3, 28.9, and 18.6 kJ·mol−1, respectively. The NPC3 catalyst presented better degradation performance due to the lower activation energy. The photocatalytic degradation mechanism of nanoporous copper on methyl orange could be described as follows: Cu2O on the surface of the nanoporous structure was excited by light to generate electrons and holes; then, it reacted with oxygen and water in the methyl orange solution to obtain free radicals as a strong oxidizing medium. The methyl orange molecule was oxidized, and the azo double bond was interrupted into the inorganic salt fraction. As a photocatalytic agent, the large specific surface area of the nanoporous structure and low activation energy of Cu/Cu2O were responsible for the excellent MO degradation performance. These findings showed that nanoporous copper could be a promising candidate catalyst to expand the potential applications of nanoporous metals in wastewater treatment.
Author Contributions
Methodology, J.W.; investigation, J.W.; writing—original draft preparation, J.W.; review and editing, S.Y.; supervision, S.Y. All authors have read and agreed to the published version of the manuscript.
Funding
This research was funded by Fundamental Research Funds for the Central Universities, grant number30919011412.
Acknowledgments
The partial support of this work from PAPD and Jiangsu Key Lab of Micro-Nano Materials and Technology are also acknowledged.
Conflicts of Interest
The authors declare no conflict of interest.
References
- Boumaza, S.; Kaouah, F.; Hamane, D.; Trari, M.; Omeiri, S.; Bendjama, Z. Visible light assisted decolorization of azo dyes: Direct Red 16 and Direct Blue 71 in aqueous solution on the p-CuFeO2/n-ZnO system. J. Mol. Catal. A Chem. 2014, 393, 156–165. [Google Scholar] [CrossRef]
- Riaz, N.; Chong, F.K.; Man, Z.B.; Khan, M.S.; Dutta, B.K. Photodegradation of Orange II under Visible Light Using Cu–Ni/TiO2: Influence of Cu:Ni Mass Composition, Preparation, and Calcination Temperature. Ind. Eng. Chem. Res. 2013, 52, 4491–4503. [Google Scholar] [CrossRef]
- Marsili, E.; Baron, D.B.; Shikhare, I.D.; Dan, C.; Gralnick, J.A.; Bond, D.R. Shewanella Secretes Flavins That Mediate Extracellular Electron Transfer. Proc. Natl. Acad. Sci. USA 2008, 105, 3968–3973. [Google Scholar] [CrossRef]
- Singh, P.; Iyengar, L.; Pandey, A. Bacterial Decolorization and Degradation of Azo Dyes. Int. Biodeterior. Biodegrad. 2007, 59, 73–84. [Google Scholar]
- Suarez-Parra, R.; Hernández-Pérez, I.; Rincón, M.; López-Ayala, S.; Roldan-Ahumada, M. Visible light-induced degradation of blue textile azo dye on TiO2/CdO–ZnO coupled nanoporous films. Sol. Energy Mater. Sol. Cells 2003, 76, 189–199. [Google Scholar] [CrossRef]
- Gilja, V.; Novaković, K.; Travas-Sejdic, J.; Hrnjak-Murgić, Z.; Kraljić Roković, M.; Žic, M. Stability and synergistic effect of polyaniline/TiO2 photocatalysts in degradation of azo dye in wastewater. Nanomaterials 2017, 7, 412. [Google Scholar] [CrossRef]
- Saleh, S.M. ZnO nanospheres based simple hydrothermal route for photocatalytic degradation of azo dye. Spectrochim. Acta Part A Mol. Biomol. Spectrosc. 2019, 211, 141–147. [Google Scholar] [CrossRef]
- De Jongh, P.; Vanmaekelbergh, D.; Kelly, J. Cu2O: Electrodeposition and characterization. Chem. Mater. 1999, 11, 3512–3517. [Google Scholar] [CrossRef]
- Xia, Y.; Huang, W.; Zheng, J.F.; Niu, Z.J.; Li, Z.L. Nonenzymatic amperometric response of glucose on a nanoporous gold film electrode fabricated by a rapid and simple electrochemical method. Biosens. Bioelectron. 2011, 26, 3555–3561. [Google Scholar] [CrossRef]
- Kou, T.; Jin, C.; Zhang, C.; Sun, J.; Zhang, Z. Nanoporous core–shell Cu@Cu2O nanocomposites with superior photocatalytic properties towards the degradation of methyl orange. RSC Adv. 2012, 2, 12636–12643. [Google Scholar] [CrossRef]
- Stolz, A. Basic and applied aspects in the microbial degradation of azo dyes. Appl. Microbiol. Biotechnol. 2001, 56, 69–80. [Google Scholar] [CrossRef]
- Yang, C.; Zhang, C.; Liu, L. Excellent degradation performance of 3D hierarchical nanoporous structures of copper towards organic pollutants. J. Mater. Chem. A 2018, 6, 20992–21002. [Google Scholar] [CrossRef]
- Udayabhaskar, R.; Mangalaraja, R.V.; Pandiyarajan, T.; Karthikeyan, B.; Mansilla, H.D. High catalytic activity of monometallic Ag, Cu nanostructures in the degradation of acid blue 113 dye: An electron relay effect. Mater. Res. Express 2017, 4, 095002. [Google Scholar] [CrossRef]
- Elbaradie, K.; Elsharkawy, R.; Elghamry, H.; Sakai, K. Synthesis and characterization of Cu(II), Co(II) and Ni(II) complexes of a number of sulfadrug azodyes and their application for wastewater treatment. Spectrochim. Acta Part A Mol. Biomol. Spectrosc. 2014, 121, 180–187. [Google Scholar] [CrossRef]
- Niu, M.Y.; Xu, W.C.; Zhu, S.L.; Liang, Y.Q.; Cui, Z.D.; Yang, X.J.; Inoue, A. Synthesis of nanoporous CuO/TiO2/Pd-NiO composite catalysts by chemical dealloying and their performance for methanol and ethanol electro-oxidation. J. Power Sources 2017, 362, 10–19. [Google Scholar] [CrossRef]
- Jia, F.L.; Zhao, J.H.; Yu, X.X. Nanoporous Cu film/Cu plate with superior catalytic performance toward electro-oxidation of hydrazine. J. Power Sources 2013, 222, 135–139. [Google Scholar] [CrossRef]
- Zhang, J.; Li, C.M. Nanoporous metals: Fabrication strategies and advanced electrochemical applications in catalysis, sensing and energy systems. Chem. Soc. Rev. 2012, 41, 7016–7031. [Google Scholar] [CrossRef]
- Li, M.; Wang, Z.; Zhang, Q.; Qin, C.; Inoue, A.; Guo, W. Formation and evolution of ultrathin Cu2O nanowires on NPC ribbon by anodizing for photocatalytic degradation. Appl. Surf. Sci. 2020, 506, 144819. [Google Scholar] [CrossRef]
- Li, M.; Li, Y.Y.; Zhang, Q.; Qin, C.L.; Zhao, W.M.; Wang, Z.F.; Inoue, A. Ultrafine Cu2O/CuO nanosheet arrays integrated with NPC/BMG composite rod for photocatalytic degradation. Appl. Surf. Sci. 2019, 483, 285–293. [Google Scholar] [CrossRef]
- Prado-Chay, D.; Cortés-Jácome, M.; Angeles-Chávez, C.; Oviedo-Roa, R.; Martínez-Magadán, J.; Zuriaga-Monroy, C.; Hernández-Hernández, I.; Mayoral, P.R.; Gómora-Herrera, D.; Toledo-Antonio, J. Synthesis and Photocatalytic Activity of Cu2O Microspheres upon Methyl Orange Degradation. Top. Catal. 2020, 63, 586–600. [Google Scholar] [CrossRef]
- Ding, Y.; Erlebacher, J. Nanoporous metals with controlled multimodal pore size distribution. J. Am. Chem. Soc. 2003, 125, 7772–7773. [Google Scholar] [CrossRef]
- McCue, I.; Benn, E.; Gaskey, B.; Erlebacher, J. Dealloying and dealloyed materials. Annu. Rev. Mater. Res. 2016, 46, 263–286. [Google Scholar] [CrossRef]
- Liu, L.; Pippel, E.; Scholz, R.; Goesele, U. Nanoporous Pt-Co Alloy Nanowires: Fabrication, Characterization, and Electrocatalytic Properties. Nano Lett. 2009, 9, 4352–4358. [Google Scholar] [CrossRef]
- Ding, Y.; Chen, M. Nanoporous Metals for Catalytic and Optical Applications. MRS Bull. 2009, 34, 569–576. [Google Scholar] [CrossRef]
- Ding, Y.; Kim, Y.J.; Erlebacher, J. Nanoporous gold leaf: “Ancient technology”/advanced material. Adv. Mater. 2004, 16, 1897–1900. [Google Scholar] [CrossRef]
- Erlebacher, J.; Aziz, M.J.; Karma, A.; Dimitrov, N.; Sieradzki, K. Evolution of nanoporosity in dealloying. Nature 2001, 410, 450–453. [Google Scholar] [CrossRef]
- Hayes, J.R.; Hodge, A.M.; Biener, J.; Hamza, A.V.; Sieradzki, K. Monolithic nanoporous copper by dealloying Mn–Cu. J. Mater. Res. 2006, 21, 2611–2616. [Google Scholar] [CrossRef]
- Liu, W.B.; Zhang, S.C.; Li, N.; Zheng, J.W.; Xing, Y.L. Influence of phase constituent and proportion in initial Al–Cu alloys on formation of monolithic nanoporous copper through chemical dealloying in an alkaline solution. Corros. Sci. 2011, 53, 809–814. [Google Scholar] [CrossRef]
- Lu, H.-B.; Li, Y.; Wang, F.-H. Synthesis of porous copper from nanocrystalline two-phase Cu–Zr film by dealloying. Scr. Mater. 2007, 56, 165–168. [Google Scholar] [CrossRef]
- Dan, Z.; Qin, F.; Sugawara, Y.; Muto, I.; Hara, N. Fabrication of nanoporous copper by dealloying amorphous binary Ti-Cu alloys in hydrofluoric acid solutions. Intermetallics 2012, 29, 14–20. [Google Scholar] [CrossRef]
- Liu, W.B.; Zhang, S.C.; Li, N.; Zheng, J.W.; An, S.S.; Xing, Y.L. A general dealloying strategy to nanoporous intermetallics, nanoporous metals with bimodal, and unimodal pore size distributions. Corros. Sci. 2012, 58, 133–138. [Google Scholar] [CrossRef]
- Snyder, J.; Asanithi, P.; Dalton, A.B.; Erlebacher, J. Stabilized Nanoporous Metals by Dealloying Ternary Alloy Precursors. Adv. Mater. 2008, 20, 4883–4886. [Google Scholar] [CrossRef]
- Wang, J.Y.; Yang, S. Nanoporous copper fabricated by dealloying Mn-Cu precursors with minor nickel element addition and heat treatment coarsening. NANO 2018, 13, 1850058. [Google Scholar] [CrossRef]
- Qi, Z.; Zhao, C.C.; Wang, X.G.; Lin, J.K.; Shao, W.; Zhang, Z.H.; Bian, X.F. Formation and Characterization of Monolithic Nanoporous Copper by Chemical Dealloying of Al-Cu Alloys. J. Phys. Chem. C 2009, 113, 6694–6698. [Google Scholar] [CrossRef]
- Zhou, B.; Liu, Z.; Wang, H.; Yang, Y.; Su, W. Experimental study on photocatalytic activity of Cu2O/Cu nanocomposites under visible light. Catal. Lett. 2009, 132, 75–80. [Google Scholar] [CrossRef]
- Li, Y.; Ding, Y. Porous AgCl/Ag nanocomposites with enhanced visible light photocatalytic properties. J. Phys. Chem. C 2010, 114, 3175–3179. [Google Scholar] [CrossRef]
- Huang, L.; Peng, F.; Yu, H.; Wang, H. Synthesis of Cu2O nanoboxes, nanocubes and nanospheres by polyol process and their adsorption characteristic. Mater. Res. Bull. 2008, 43, 3047–3053. [Google Scholar] [CrossRef]
- An, J.-H.; Dultz, S. Adsorption of tannic acid on chitosan-montmorillonite as a function of pH and surface charge properties. Appl. Clay Sci. 2007, 36, 256–264. [Google Scholar] [CrossRef]
- Naidu, R.; Bolan, N.; Kookana, R.S.; Tiller, K. Ionic-strength and pH effects on the sorption of cadmium and the surface charge of soils. Eur. J. Soil Sci. 1994, 45, 419–429. [Google Scholar] [CrossRef]
- Zhang, A.; Fang, Y. Influence of adsorption orientation of methyl orange on silver colloids by Raman and fluorescence spectroscopy: pH effect. Chem. Phys. 2006, 331, 55–60. [Google Scholar] [CrossRef]
- Wang, J.Q.; Liu, Y.H.; Chen, M.W.; Xie, G.Q.; Louzguine-Luzgin, D.V.; Inoue, A.; Perepezko, J.H. Rapid degradation of azo dye by Fe-based metallic glass powder. Adv. Funct. Mater. 2012, 22, 2567–2570. [Google Scholar] [CrossRef]
Publisher’s Note: MDPI stays neutral with regard to jurisdictional claims in published maps and institutional affiliations. |
© 2021 by the authors. Licensee MDPI, Basel, Switzerland. This article is an open access article distributed under the terms and conditions of the Creative Commons Attribution (CC BY) license (https://creativecommons.org/licenses/by/4.0/).