Article

Hot Deformation Behavior of Ultralight Dual-Phase Mg-6li Alloy: Constitutive Model and Hot Processing Maps

1
International Joint Laboratory for Light Alloys (Ministry of Education), Chongqing University, Chongqing 400044, China
2
School of Industrial Engineering, Ningxia Polytechnic, Ningxia 750021, China
3
College of Materials Science and Engineering, Chongqing University, Chongqing 400044, China
*
Authors to whom correspondence should be addressed.
Metals 2021, 11(6), 911; https://doi.org/10.3390/met11060911
Submission received: 8 May 2021 / Revised: 29 May 2021 / Accepted: 31 May 2021 / Published: 3 June 2021

Abstract

:
High-temperature compression tests with dual-phase Mg-6Li alloy were conducted on the Gleeble-3500 thermal-mechanical simulator. Flow stress and micro-structure evolution were analyzed for temperatures (T = 423, 473,523 and 573 K) and strain rates ( ε ˙ = 0.001, 0.01, 0.1 and 1 s−1). On this basis, the constitutive model and hot processing maps were established. Besides, the dynamic re-crystallization (DRX) of α-Mg phase, grain orientation and texture composition under different deformation conditions were analyzed by EBSD technology. The experimental results show that the flow stress of Mg-6Li alloy increased with decreasing deformation temperature and increasing strain rate. In addition, the range of instability zone expanded with the increase of strain. The optimal thermal processing temperature was found to be in the range of 500 K–573 K, and the optimal strain rates were between 0.01 s−1–1 s−1. Model-predicted stress values were compared with experimental values for model verification. The 0.9954 correlation coefficient and the 5.48% average absolute relative error shown by the calculation indicate an acceptable accuracy of the model in predicting thermal deformation behavior of Mg-6Li alloy. Moreover, based on our EBSD data and maps analysis, the DRX proportion of α-Mg phase in Mg-6Li alloy was relatively low, and α-Mg phase formed <0001>//CD basal texture.

1. Introduction

In recent years, ultralight dual-phase magnesium-lithium (Mg-Li) alloys became attractive materials for their desirable properties such as superior damping capacity, excellent electromagnetic shielding performance, lower density [1,2,3]. Compared with traditional Mg alloys, Mg-Li alloys have ultra-low-density (1.35–1.65 g/cm3), relatively better plasticity [4,5] and light weight in comparison with aluminum alloy and stainless steel. Such properties are highly sought after in the automobile, aviation, military, 3C and electronics industries [6,7,8,9,10,11]. However, with their HCP structures magnesium alloys have some shortcoming, such as difficult plastic deformation and low ductility at room temperature, which greatly limits the wider application of these alloys. As a result, various studies have focused on the deformation of magnesium alloys at high temperatures, in which the activation of a large number of slip systems can enhance ductility, and it is also suggested to overcome these defects by means of alloying [12,13,14,15]. The density of Li is only 0.534 g/cm3, which can produce ultra-light Mg-Li alloys. However, according to the dual-phase diagram of Mg-Li alloys, Mg-Li alloys with different Li content exhibit different crystal structures. The Mg-Li alloy consists of a single a-Mg phase with HCP structure with a less than 5.7 wt.% Li content, but magnesium’s HCP structure changes to a dual-phase (HCP + BCC) form after addition of 5.7–10.3 wt.% Li, which alters its strength and ductility. When the Li content is above 10.3 wt.%, the corresponding alloy consists of a single phase of BCC β-Li [2,16]. In addition, the addition of Li reduces the c/a axial ratio of Mg alloy’s HCP lattice, leading to a decrease in the critical shear stress (CRSS) of slip systems, which could enable the activation of more slip systems at room temperature and therefore ease plastic deformation [17,18]. However, β-Li’s relative soft state lowers the strength of the Mg-6Li binary alloy, henceforth considerably limiting the alloy’s applicability [16,18].
At present, dual-phase Mg-Li alloys are mainly studied for alloying and their deformation properties, and there are few studies on microstructure texture evolution, but they are very important for hot forming Mg-Li alloys [4,19,20]. Mg-Li ternary alloys or multi-element alloys have received far less research attention than single-phase Mg-Li alloys [2,6,21,22,23]. However, the mixing of other elements will generate various compound phases, and also affect the evolution of the structure, which will make the study of the micro-structure evolution of dual-phase Mg-Li alloys more complicated. Accordingly, in order to provide a reference for future research on the complex thermal deformation mechanism of Mg-Li binary dual-phase alloys, it is quite essential to study the thermal deformation behavior of Mg-6Li binary dual-phase alloy in details. There are a variety of hot deformation characterization methods, among which constitutive modeling (based on the Zener-Hollomon model (Ζ = ε ˙ exp(Q/RT) = A [ sin h ( α σ ) ] n )) and processing maps (based on dynamic material model (DMM)) have proved useful for investigating the material deformation mechanism during the high-temperature plastic working stage; Shalbafi et al. used this characterization method to study the high temperature plastic deformation of Mg alloys [14,23,24]. In particular, a constitutive model mathematically links material flow stress to thermodynamic parameters, and therefore requires high accuracy for numerical simulation of microstructure constitutive model, which is of great significance for numerical simulation, optimization of process parameters. Xu et al. [25] and Wu et al. [26] imported the established constitutive models into suitable finite element software for simulation calculation, and the results showed that the finite element analysis combined with the physical-based constitutive relationship can reliably predict the hot deformation behavior of the alloys.

2. Materials and Methods

In this study, a dual-phase Mg-6Li alloy was prepared by mixing and melting high-purity Mg and Li (>99.9%) as-cast billets in a resistance furnace at 973.15 K, which was carried out under a pure argon atmosphere to prevent evaporation and oxidation. The melted substance was poured into a graphite mold and cooled to room temperature in air to form a Mg-6Li alloy casting billet with geometrical dimensions of Φ 80 mm × 150 mm. The chemical composition of the specimens was determined by inductively-coupled plasma optical emission spectrometry (ICP-OES), and found to contain 6.39% Li and a corresponding percentage of Mg in line with the design, and the density measured by the drainage method was 1.54 g/cm3. The ingot was homogenized at a temperature of 573 K for 4 h in a vacuum furnace. Subsequently, uniaxial hot compression 10 mm clyndrical samples and 15 mm in height, were cut with an electric spark cutting machine from one cross-section of the ingot to ensure composition consistency. In addition, graphite lubricant was added to both ends of the sample to reduce the friction between the sample and the indenter. A series of isothermal hot compression experiments were then carried out on a Gleeble® 3500 thermal simulation machine (Dynamic Systems, Inc., Poestenkill, NY, USA), and a thermocouple was welded at the mid-point of each sample with electric-resistance welding so as to facilitate monitoring and recording of temperature data. The experiments were performed between 423 K and 573 K in 50 K intervals, and the strain rates ranged from 0.001 s−1 to 1.0 s−1. Then these cylinder homogenized alloys were heated up to a predetermined temperature at a rate of 10 K/s, and then remained for 20 s at that temperature to ensure uniformity throughout the specimen. The compression process would be stopped at 60% strain, to have the specimens quenched rapidly to retain the micro-structure formed.
Data from the above hot compression tests feed the Arrhenius-type constitutive model to calculate the material constants, and a hot processing map of corresponding strains was drawn based on the DMM. X-ray diffraction was conducted on homogenized and compressed samples to identify the existing phases in the Mg-6Li alloy. The compressed samples were sliced to halves through the center line along the compression direction, then polished and etched in order to have their microstructures studied on a scanning electron microscope (SEM) and an electron back-scatter diffraction (EBSD). Specimens for EBSD were prepared by mechanical polishing, then electropolished to release surface stress, the EBSD samples were scanned with a 1.3 μm step size. EBSD data was processed and analyzed by a Channel 5 software (HKL Technology-Oxford Instruments, Abingdon, UK).

3. Results and Discussion

Figure 1 shows the XRD patterns of the two main phase components—α-Mg and β-Li—in the homogenized and compressed specimen (573 K-0.01 s−1) of Mg-6Li alloy. The XRD peaks are unchanged from the homogenized alloy to the compressed alloy, indicating no shift in the phase composition of the alloy through hot compression. Furthermore, the preferred orientation of the α-Mg phase stays still (10 1 ¯ 1), but the highest peak grew higher after the compression at a rate of 573 K-0.01 s−1. Besides, the secondary α-Mg phase peak changes from (0002) to (10 1 ¯ 0), probably related to the change of grain orientation the compression process.

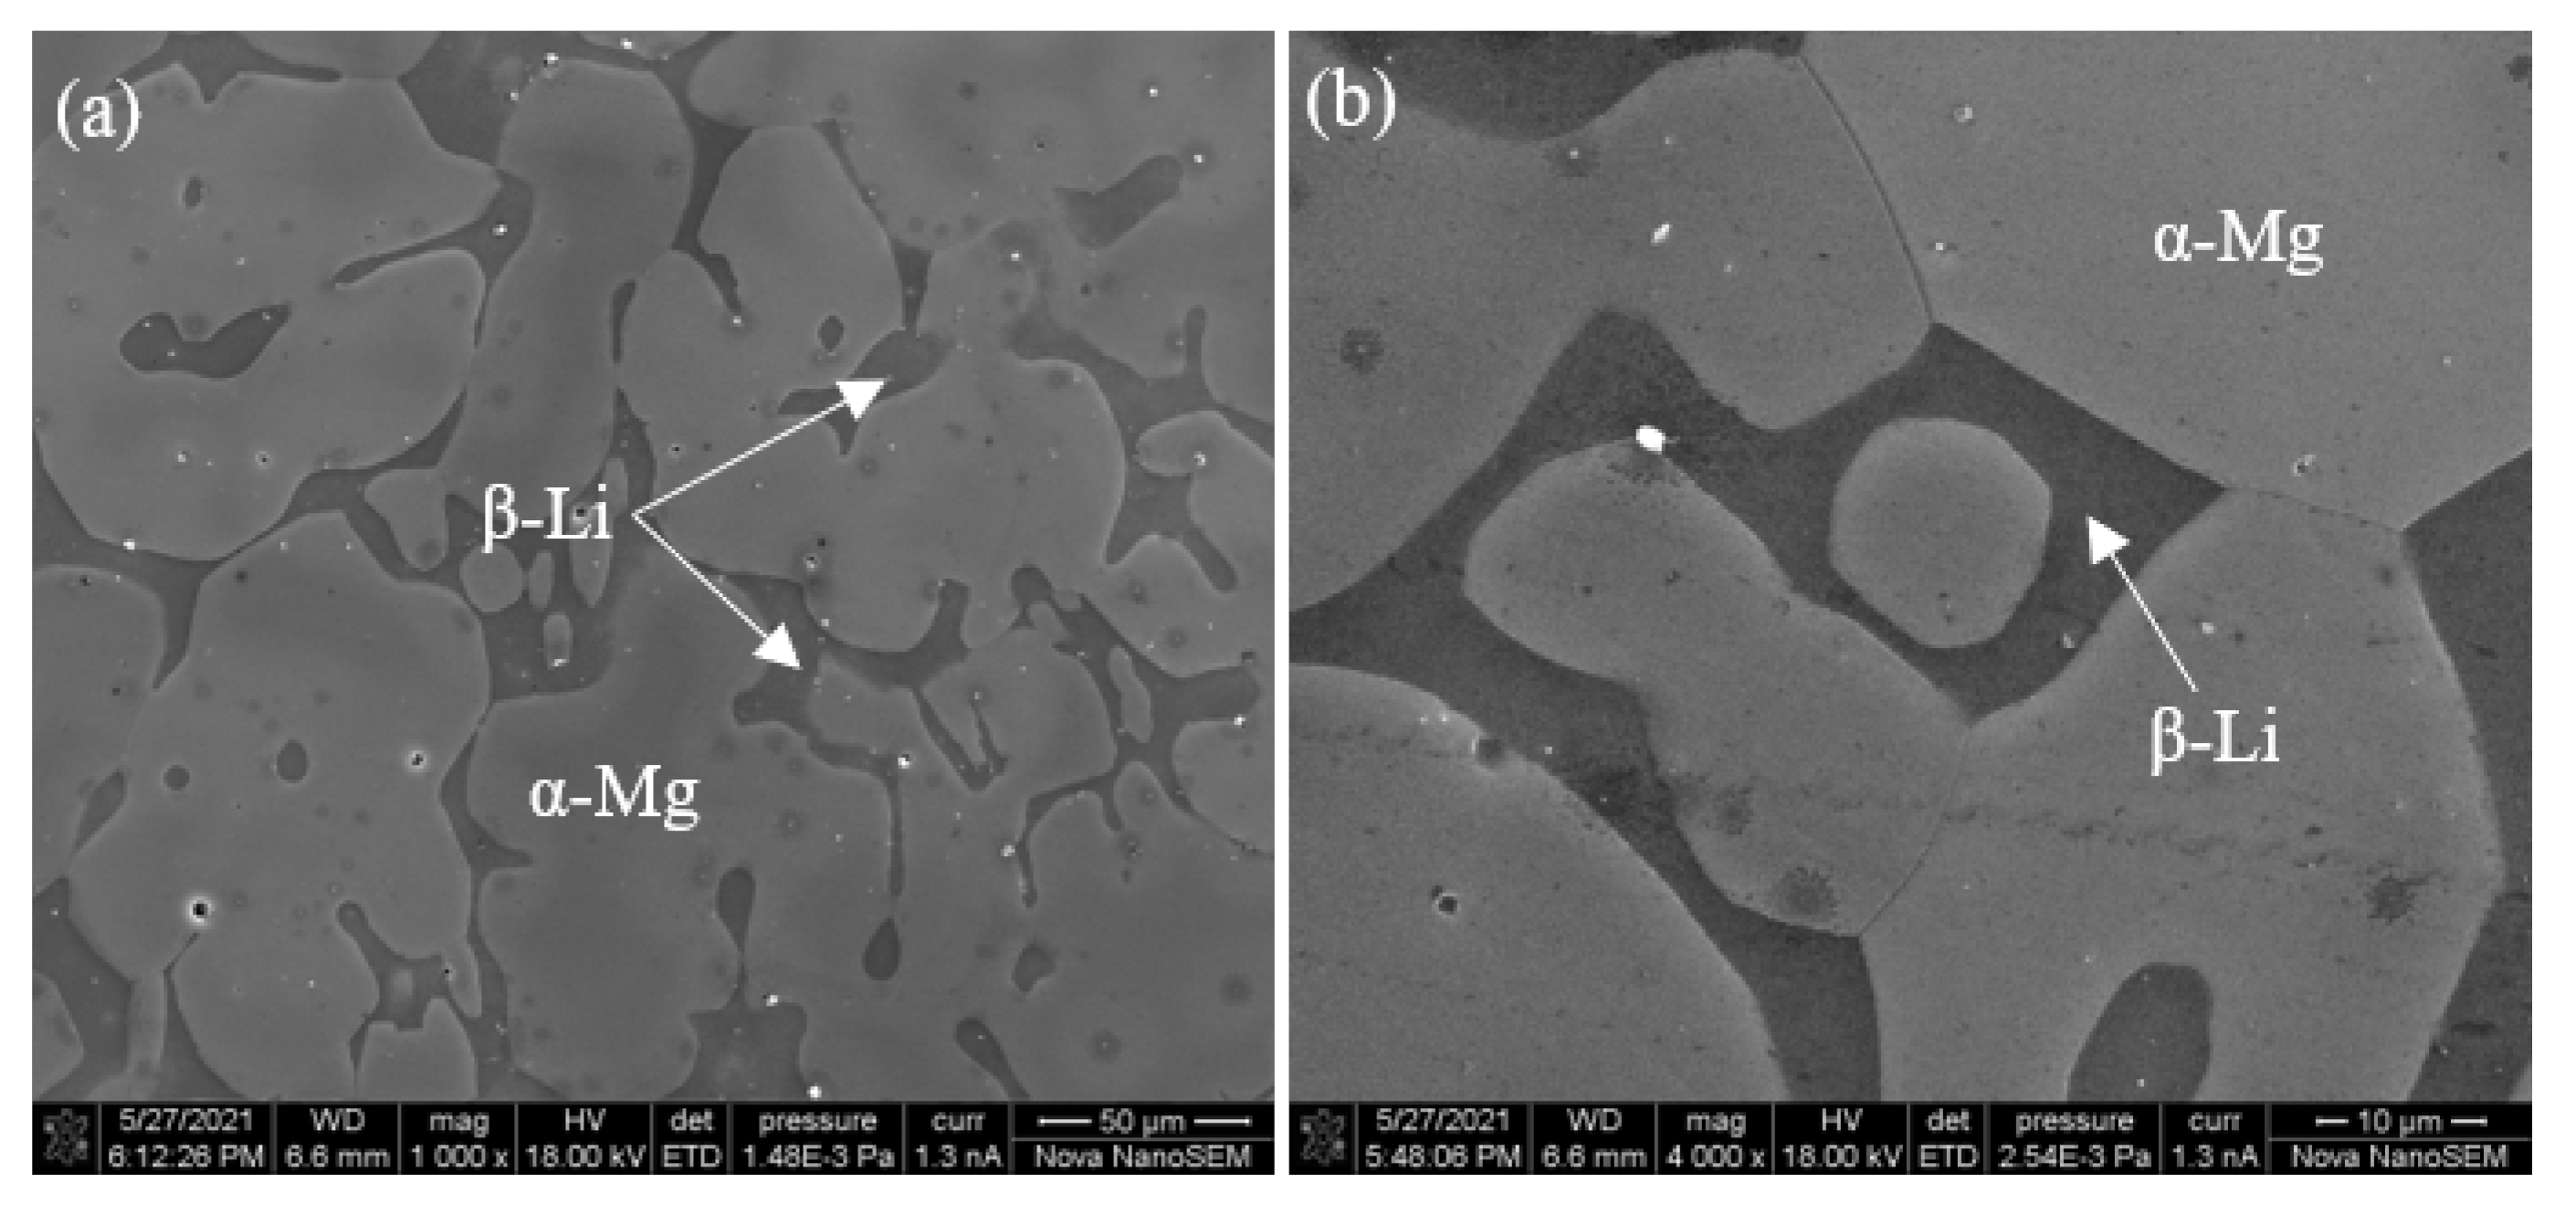
3.1. Microstructure of Homogenized Alloy

The SEM microstructure with different magnification of the Mg-6Li alloy after homogenization treatment is shown in Figure 2, where it is easy to observe that the matrix of Mg-6Li alloy was composed of slightly brighter α-Mg and relatively darker β-Li phases. The HCP-structured α-Mg phases form through dissolution of Li into Mg, while the BCC-structured β-Li phases form with the dissolution of Mg into Li, which are typical duplex-phase features.

3.2. Flow Stress-Strain Curves

Thermal activation processes start to affect plastic deformation effectively as temperature rises above 0.4 Tm (Tm = melting point), indicating a link between the material’s flow behavior to strain rate and temperature [27]. Figure 3 shows true stress-strain curves of Mg-6Li alloy deformed by the strain of 0.6 under different hot-deformation conditions, from which we can easily observe that the curves demonstrate typical DRX characteristics at 423 K.
In the initial stages of deformation, the true stress goes up more rapidly with the increase of strain, slows down gradually before the peak stress. Work hardening as a result of much dislocation multiplication, entanglement and stacking, plays a dominant role in this stage. Subsequently, with the increase of strain, the flow stress reaches the peak stress and decreases gradually until tends to be stable finally, the reason is that there is not only work hardening, but also dynamic recovery (DRV) and DRX exist at this stage [28]. Moreover, the softening effects produced by DRV, DRX and activation of non-basal slip systems exceeds that of work hardening [29,30,31]. On the contrary, the flow stress curve of other conditions directly goes into a flat region after the short hardening, there is no obvious peak, and the steady-state flow trend becomes more obvious with the increase of temperature and the decrease of strain rate. In addition, flow stress curves reach a dynamic balance as the softening and work-hardening effect, they are not smooth, but serrated flow. Such a phenomenon of the hardening and softening effects alternately prevailing can be attributed to the dynamic interaction between solute atoms and dislocations [32].
Comparing the four graphs in Figure 3, the following conclusions can be drawn: First, the stress value drops with the bump of temperature at a certain strain rate. This is probably due to more pronounced thermal activation at high temperatures, as the binding force between atoms weakens leading to greater dislocation movement and faster diffusion of vacancy and interstitial atoms, eventually facilitating the formation of subgrains and recrystallization. Second, flow stress goes up with the rise of strain rate at a certain temperature, which indicates that the influence of temperature and strain rate on flow stress is obvious. Figure 4 similarly finds that lower flow stress values occur with high temperatures and low strain rates. More specifically, it is owing to the fact that the lower strain rate means that the stacking and propagating speed of dislocations is lower, which further weakens the effect of dislocation entanglement and intersection [7,33].

3.3. Constitutive Equation

The Arrhenius formula is generally used to describe thermal deformation behaviors of magnesium alloys, connecting independent stress parameters-strain and temperature-by a mathematical relationship [34,35]. This empirical hyperbolic equation below [36] was first proposed by Sellars and McTegart in 1966 [37]:
ε ˙ = A F ( σ ) exp ( Q / R T )
In which:
F ( σ ) = { σ n α σ < 0.8 exp ( β σ ) α σ > 1.2 [ sinh ( α σ ) ] n for all σ
R in the above equation is the universal gas constant (8.314 J mol−1 K−1); A is the material constant referring to the area swept by dislocation under stress; n is stress exponent, α is an adjustable constant to correct ασ value and can be expressed as a function of β as in α = β/n’; ε ˙ is strain rate (s−1), σ is flow stress (MPa), Q represents activation energy (kJ mol−1), and T for absolute temperature (K). The combined effect of deformation temperature and strain rate on flow stress can be equivalent to a parameter Z (the Zener-Holloman parameter) defined as below [38,39]:
Ζ = ε ˙ exp ( Q / R T )
The mathematical relationship between flow stress and strain rate comes in three sub-equations respectively under different sets of conditions as shown in Equation (2): low stress (ασ < 0.8), high stress (ασ > 1.2) and all conditions. Assuming that Q is not a function of temperature T, by substituting the piecewise-defined Equation (2) into Equation (1), taking natural logarithms on both sides gives us Equations (4)–(6):
ln ε ˙ = ln A 1 + n ln σ Q / R T
ln ε ˙ = ln A 2 + β σ Q / R T
ln ε ˙ = ln A Q R T + n ln [ sinh ( α σ ) ]
where A1, A2 and A are constants related to the material composition but independent of temperature. The material constants α, A, n and Q calculated with regression of data obtained from compression experiments, and they are all related to strains [28,40]. In this study, we use a 0.3 strain value to demonstrate how to calculate material parameters. Based on the experimental results and Equations (4) and (5), the values of n’ and β can be obtained by ln ε ˙ ~lnσ and ln ε ˙ ~σrelations as shown in Figure 5, then we calculate the average value of slope after linear fitting, n’ = 5.95 and β = 0.126.
The equation of α = β/n’ can be used to obtain α = 0.02124. Then by doing partial derivatives of both sides of Equation (6), the equation can be rewritten as:
Q = R { l n ε ˙ ln [ sin h ( α σ ) ] } T { ln [ sin h ( α σ ) ] ( 1000 / T ) } ε ˙
As shown in Figure 6, the relationship between ln ε ˙ ~ln[sinh(ασ)] and ln[sinh(ασ)]~1000/T can be obtained by linear fitting at a given temperature and strain rate respectively. Take the average of line slopes in Figure 6a to get n = Q1 = 4.1934, and similarly get Q2 = 3.0241 in Figure 6b will allow us compute Q = R × Q1 × Q2 = 105.43 kJ/mol. Then based on Formula (6) and the average intercept values of lines in Figure 6a, we get lnA = 21.37, hence A = 1.9 × 10⁹. Thus, Equation (6) can be expressed as:
ε ˙ = 1.9 × 10 9 [ sinh ( 0.02124 σ p ) ] 4.1934 exp ( 105.43 / R T )
Corresponding values of material constants-α, n, lnA and Q- can be calculated using the above calculation process with different strains (0.01, 0.02, 0.05, 0.1, 0.15, 0.2, 0.25, 0.3, 0.35, 0.4, 0.45, 0.5 and 0.55).
Figure 7 shows fitted relationships between different material constants and true strain. The eighth-order polynomial fitting produces sufficiently-good fitting results under large-strain conditions as expressed by Equations (9)–(12). The fitted polynomial coefficients of α, n, lnA and Q are shown in Table 1.
α = α 1 + α 2 ε + α 3 ε 2 + α 4 ε 3 + α 5 ε 4 + α 6 ε 5 + α 7 ε 6
n = n 1 + n 2 ε + n 3 ε 2 + n 4 ε 3 + + n 5 ε 4 + n 6 ε 5 + n 7 ε 6
ln A = A 1 + A 2 ε + A 3 ε 2 + A 4 ε 3 + A 5 ε 4 + A 6 ε 5 + A 7 ε 6  
Q = Q 1 + Q 2 ε + Q 3 ε 2 + Q 4 ε 3 + Q 5 ε 4 + Q 6 ε 5 + Q 7 ε 6
To predict stress values under different strains, the stress can be expressed by Zenner-Hollomon formula, while combining Equations (1)–(3) to produce Equation (13):
σ = 1 α ln { ( Z A ) 1 n + [ ( Z A ) 2 n + 1 ] 1 2 } = 1 α ln { ( ε ˙ exp ( Q R T ) A ) 1 n + [ ( ε ˙ exp ( Q R T ) A ) 2 n + 1 ] 1 2 }
Then predicted stress values are compared with the experimental values as shown in Figure 8, which indicated good agreement between model-predicted values and experimental values in most deformation states.
Figure 9 depicts the linear regression between experimental and predicted values of Mg-6Li alloy at four temperatures and different strain rates (0.001 s−1, 0.01 s−1, 0.1 s−1 and 1.0 s−1). Standard statistical parameters R (correlation coefficient) and AARE (average absolute relative error) are used to evaluate the prediction ability of the model. Which are defined as [27]:
R = i = 1 i = N ( σ e x p i σ ¯ e x p ) ( σ p i σ ¯ p ) i = 1 i = N ( σ e x p i σ ¯ e x p ) 2 i = 1 i = N ( σ p i σ ¯ p ) 2
A A R E = 1 N i = 1 i = N | σ e x p i σ p i σ e x p i | × 100 %
In these two above equations, i represents the i-th data point, N the total number of data points. σexp the experimental value of flow stress, σp the predicted value of flow stress from the constitutive model, σ ¯ exp and σ ¯ p the means of experimental values and predicted values respectively. Figure 9 gives a clear visual that data points have little scatter around the best-linear-fit line, verified by R = 0.9954 and AARE = 5.48% calculated based on Equations (14) and (15), which means that the constitutive model has a high ability of prediction.

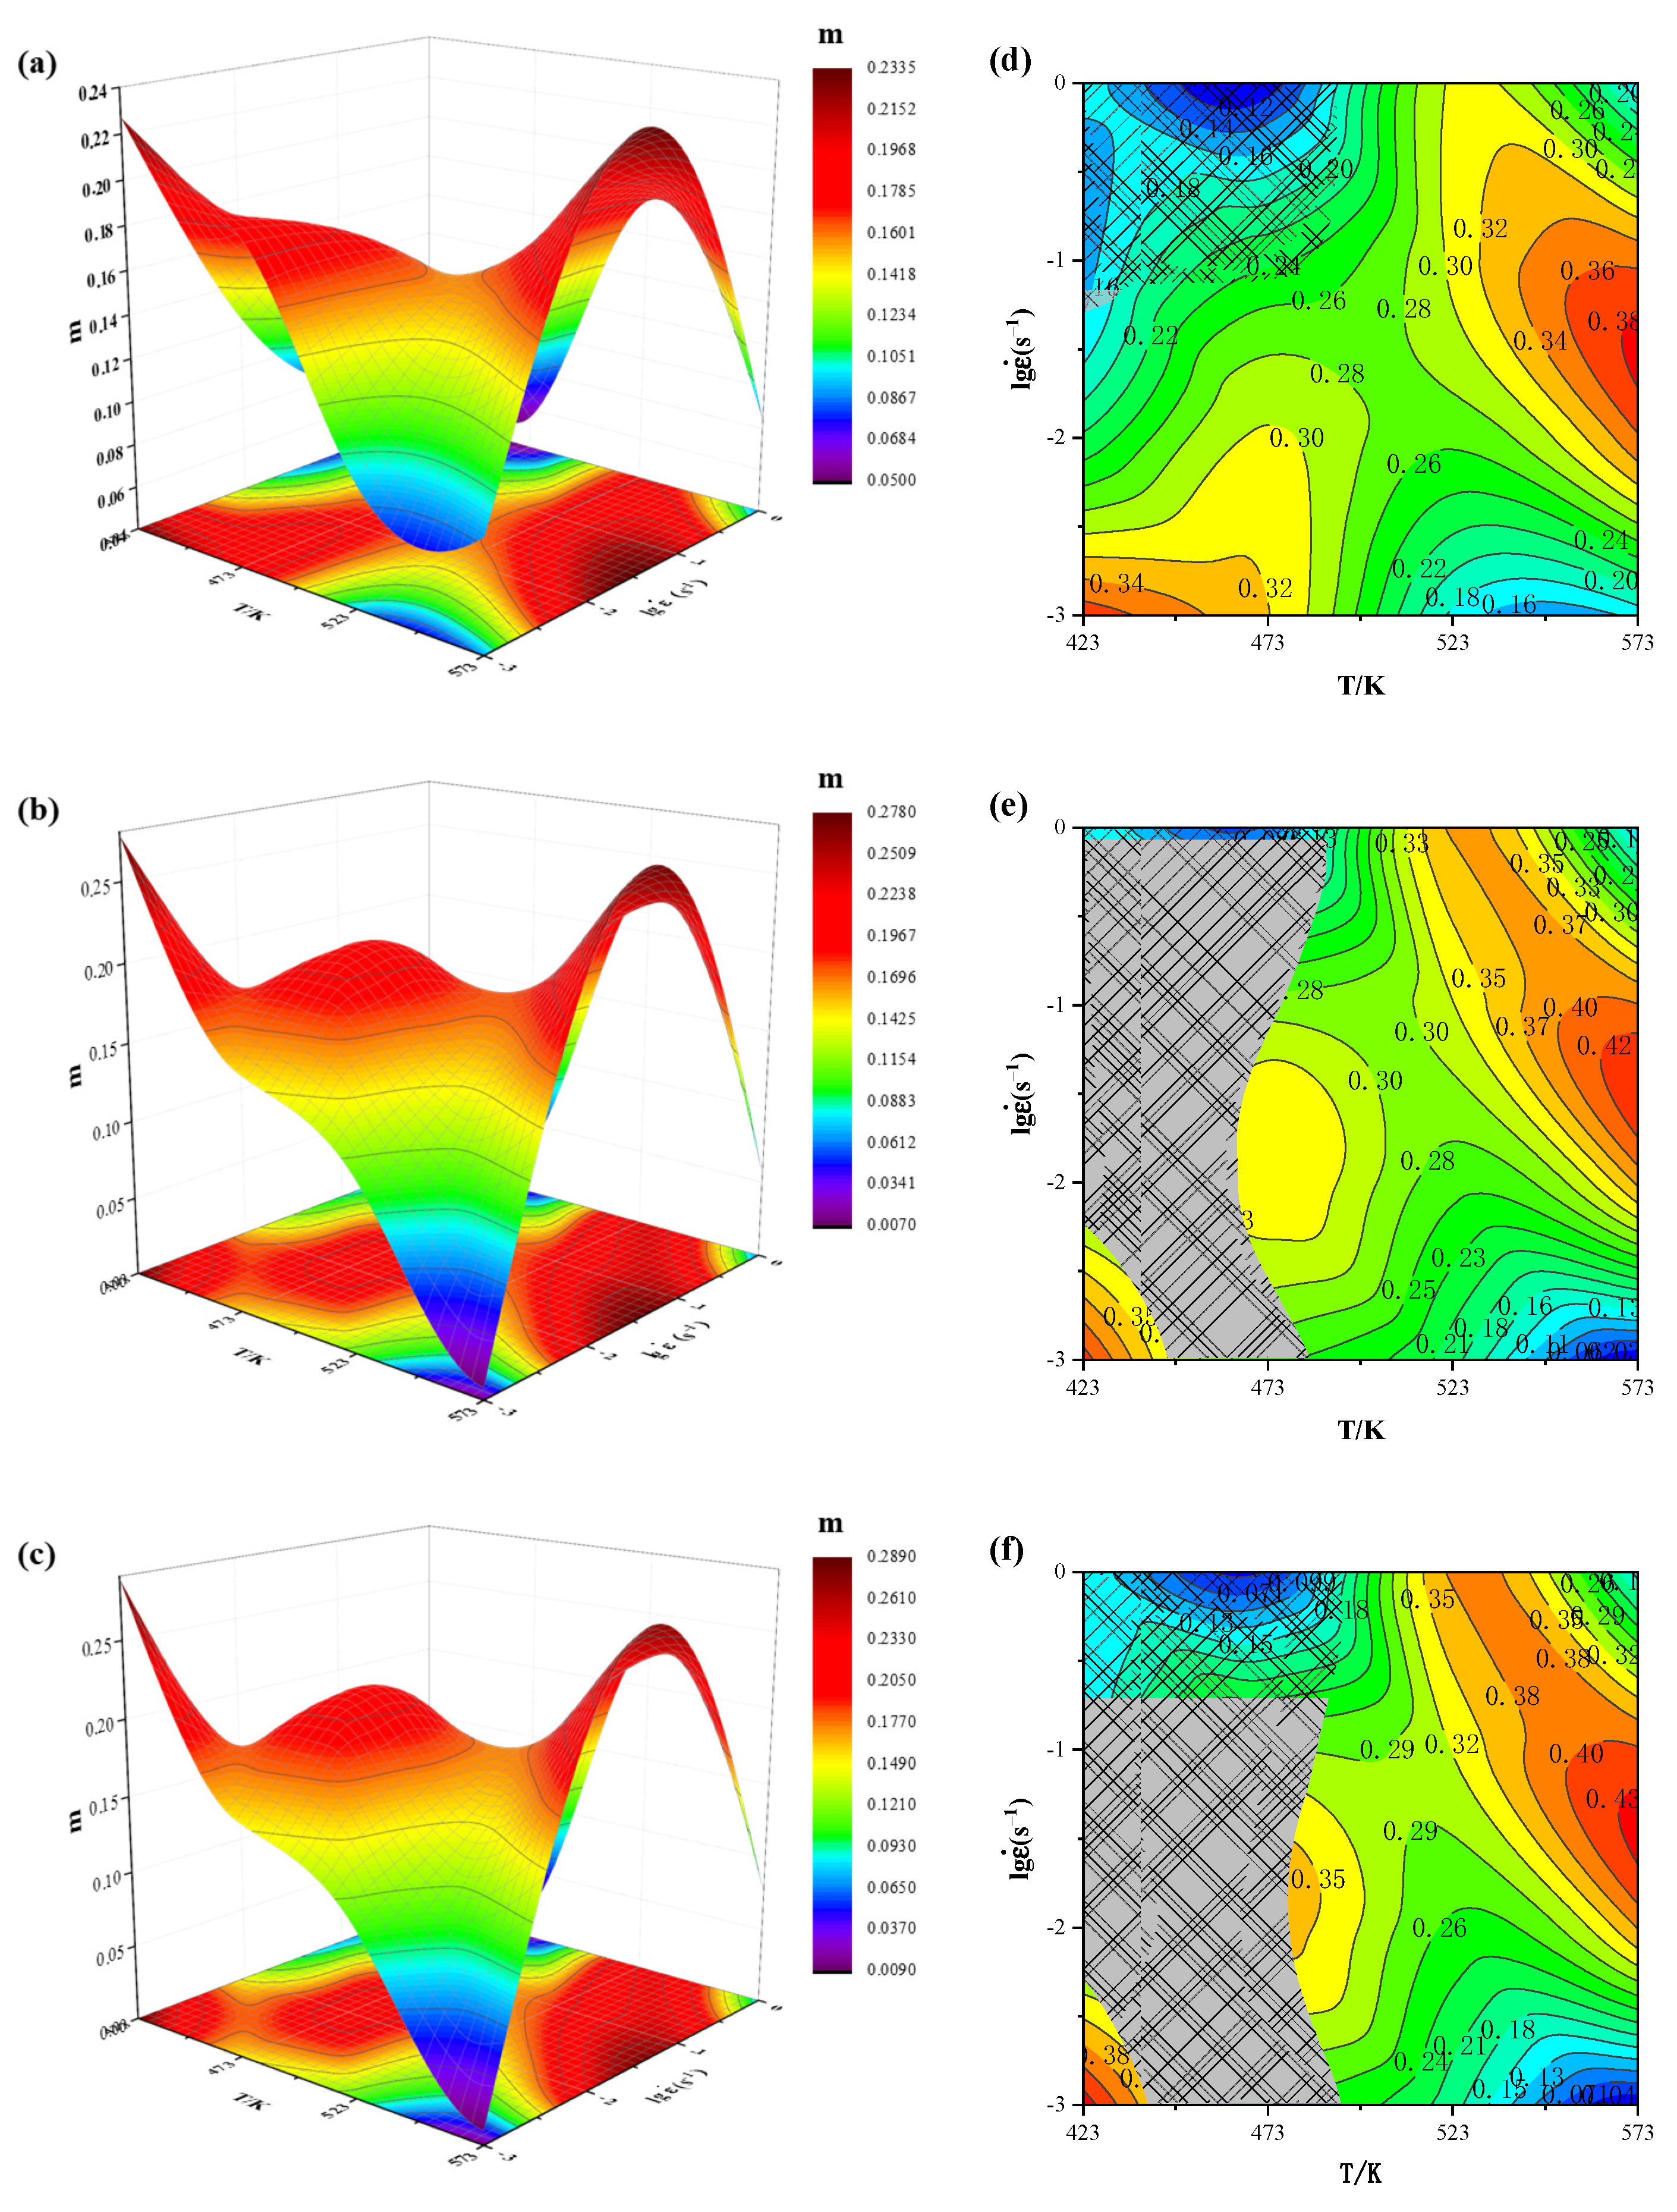
3.4. Processing Maps

Gegel and Prasad et al. [41,42,43] proposed a DMM, which combines deformation medium mechanics with dissipative microstructure evolution, and successfully describes the dynamic response of material structures during hot deformation. Processing maps drawn based on the DMM hot working theory are employed to analyze and predict the deformation characteristics and deformation mechanism of materials under different deformation conditions, in order to work out relatively safe and unsafe areas of hot working for parameter optimization purposes, since they function to depict the energy dissipation mode during micro-structure changes [44]. According to the theory of dissipative structure, P is the total energy input into the system during material deformation. P is expressed in the following equation:
P = σ ε ˙ = 0 ε ˙ σ d ε ˙ + 0 σ ε ˙ d σ = G + J
where, G is the dissipation factor, representing the part of energy converted into deformation heat apart from what is transformed into distortion energy of crystal lattice. J is the dissipative covariant-energy dissipated by the microscopic structure change.
The strain rate sensitivity exponent (m) is an important index of metal’s super-plastic property, and can be expressed in terms of the ratio of dissipation (G) and dissipation covariance (J) as follows:
( J G ) ε , T = ε ˙ d σ σ d ε ˙ = [ ( ln σ ) ( ln ε ˙ ) ] ε , T = m
When the material is in the ideal dissipation state, m = 1, and J reaches the maximum value Jmax:
J m a x = σ ε ˙ 2 = P 2
In order to describe the relationship between the energy consumed by microstructure evolution and the total energy during hot deformation, the parameter η is introduced, equal to the ratio of energy J to Jmax as in Equation (19):
η = J J m a x = 2 m m + 1
Thus, the instability criterion Formula (20) is derived:
ξ ( ε ˙ ) = ln [ m / ( m + 1 ) ] ln ε ˙ + m < 0
The instability parameter ξ ( ε ˙ ) is a function of strain rate and deformation temperature. When ξ ( ε ˙ ) < 0, the system enters the rheological instability region, so the instability map is characterized by different minus ξ ( ε ˙ ) under various deformation conditions.
As noted previously, processing maps can be obtained by superposing the power dissipation diagram and the instability diagram under the same strain. Using the data obtained from Equations (19) and (20), processing maps with the strain of 0.1, 0.3, 0.5 are established, as shown in Figure 10d–f.
It can be seen from Figure 10a–c that m is relatively large at either the combination of high temperatures and for strain rates of 0.01 s−1–0.1 s−1 or low temperatures with low strain rates, and its maximum value tends to increase with the increase of strain. We can easily observe that the amount of strain significantly affects the features of hot processing maps. Although the trend of energy expended in tissue transformation can be seen from the 3-D trend diagram of m values, more detailed analysis can be deepened in conjunction with the energy dissipation diagram and the instability diagram.
The figures on the contour lines in Figure 10d–f represent the power dissipation factor η, and the shadow areas represent the plastic instability area. It can be seen from these graphs that the instability zone ranges between 423 K and 500 K, while it increases with the increase of the deformation degree. Specifically, when the strain is 0.1, the instability zone is within the strain rate of 0.07 s−1–1 s−1, which may be because DRX is difficult to proceed under high strain rate. High strain rates make it hard these primary fine grains cannot grow in such a short time and expand into the original grains that have not undergone DRX, and a higher dislocation density and stress concentration are formed at the grain boundary region, which causes local rheological instability.
When the strain is 0.3 and 0.5, the instability zone runs through the whole strain rate range at low temperatures. Although the shape is similar, the shadow area increases, which may be because the plastic deformation mechanism of magnesium alloy is mainly based on base slip at lower deformation and low temperature, and part of the grains in the favorable orientation begin to slip and deform first, however, the critical shear stress required for the primary fine grains is different from the original coarse grains, which makes it difficult to coordinate deformation, and eventually cracks are generated near the deformation zone [45].
Secondly, the peak value of η appears in two regions, one is in the temperature range of 523 K–573 K and the strain rate range of 0.01 s−1–0.1 s−1; the other region appears at low temperature and low strain rate, but the area is relatively small, although the power dissipation value is relatively large in this region, the nucleation ability provided by low temperature is limited. The main deformation mechanism in both regions is DRX. Liu et al. proposed that, for a dual phase Ti alloy, the efficiency value associated with DRV is about 0.30, the value related to DRX is about 0.30–0.50 [46].
In general, when the value of η is large, the energy consumption is greater, the recrystallization is more sufficient during hot deformation, the dynamic softening behavior is more obvious, and the processability is relatively better [45]. It is not to say that the larger the value of η, the better of workability. In the meantime, actually, various defects, such as cracks, adiabatic shear and so on, are easily produced in the region with larger η value due to the maximum principle of large strain plastic deformation.
To sum up, according to Figure 10d–f, the processing safety zone and power dissipation peak distribution of Mg-6Li alloy vary with the strain values, the hot working process should avoid the rheological instability area at first, and give priority to the dynamic recrystallization area, which is due to the good plasticity and easy control of microstructure and properties in the dynamic recrystallization area. Thus, the best processing safety zone should be selected at the deformation temperature of 500 K–573 K, and the strain rate between 0.01 s−1 and 0.1 s−1, because the rheological resistance of the alloy is small and there is no plastic instability, which could provide a good reference for the process parameter selection of hot extrusion and hot rolling experiments to be carried out later.

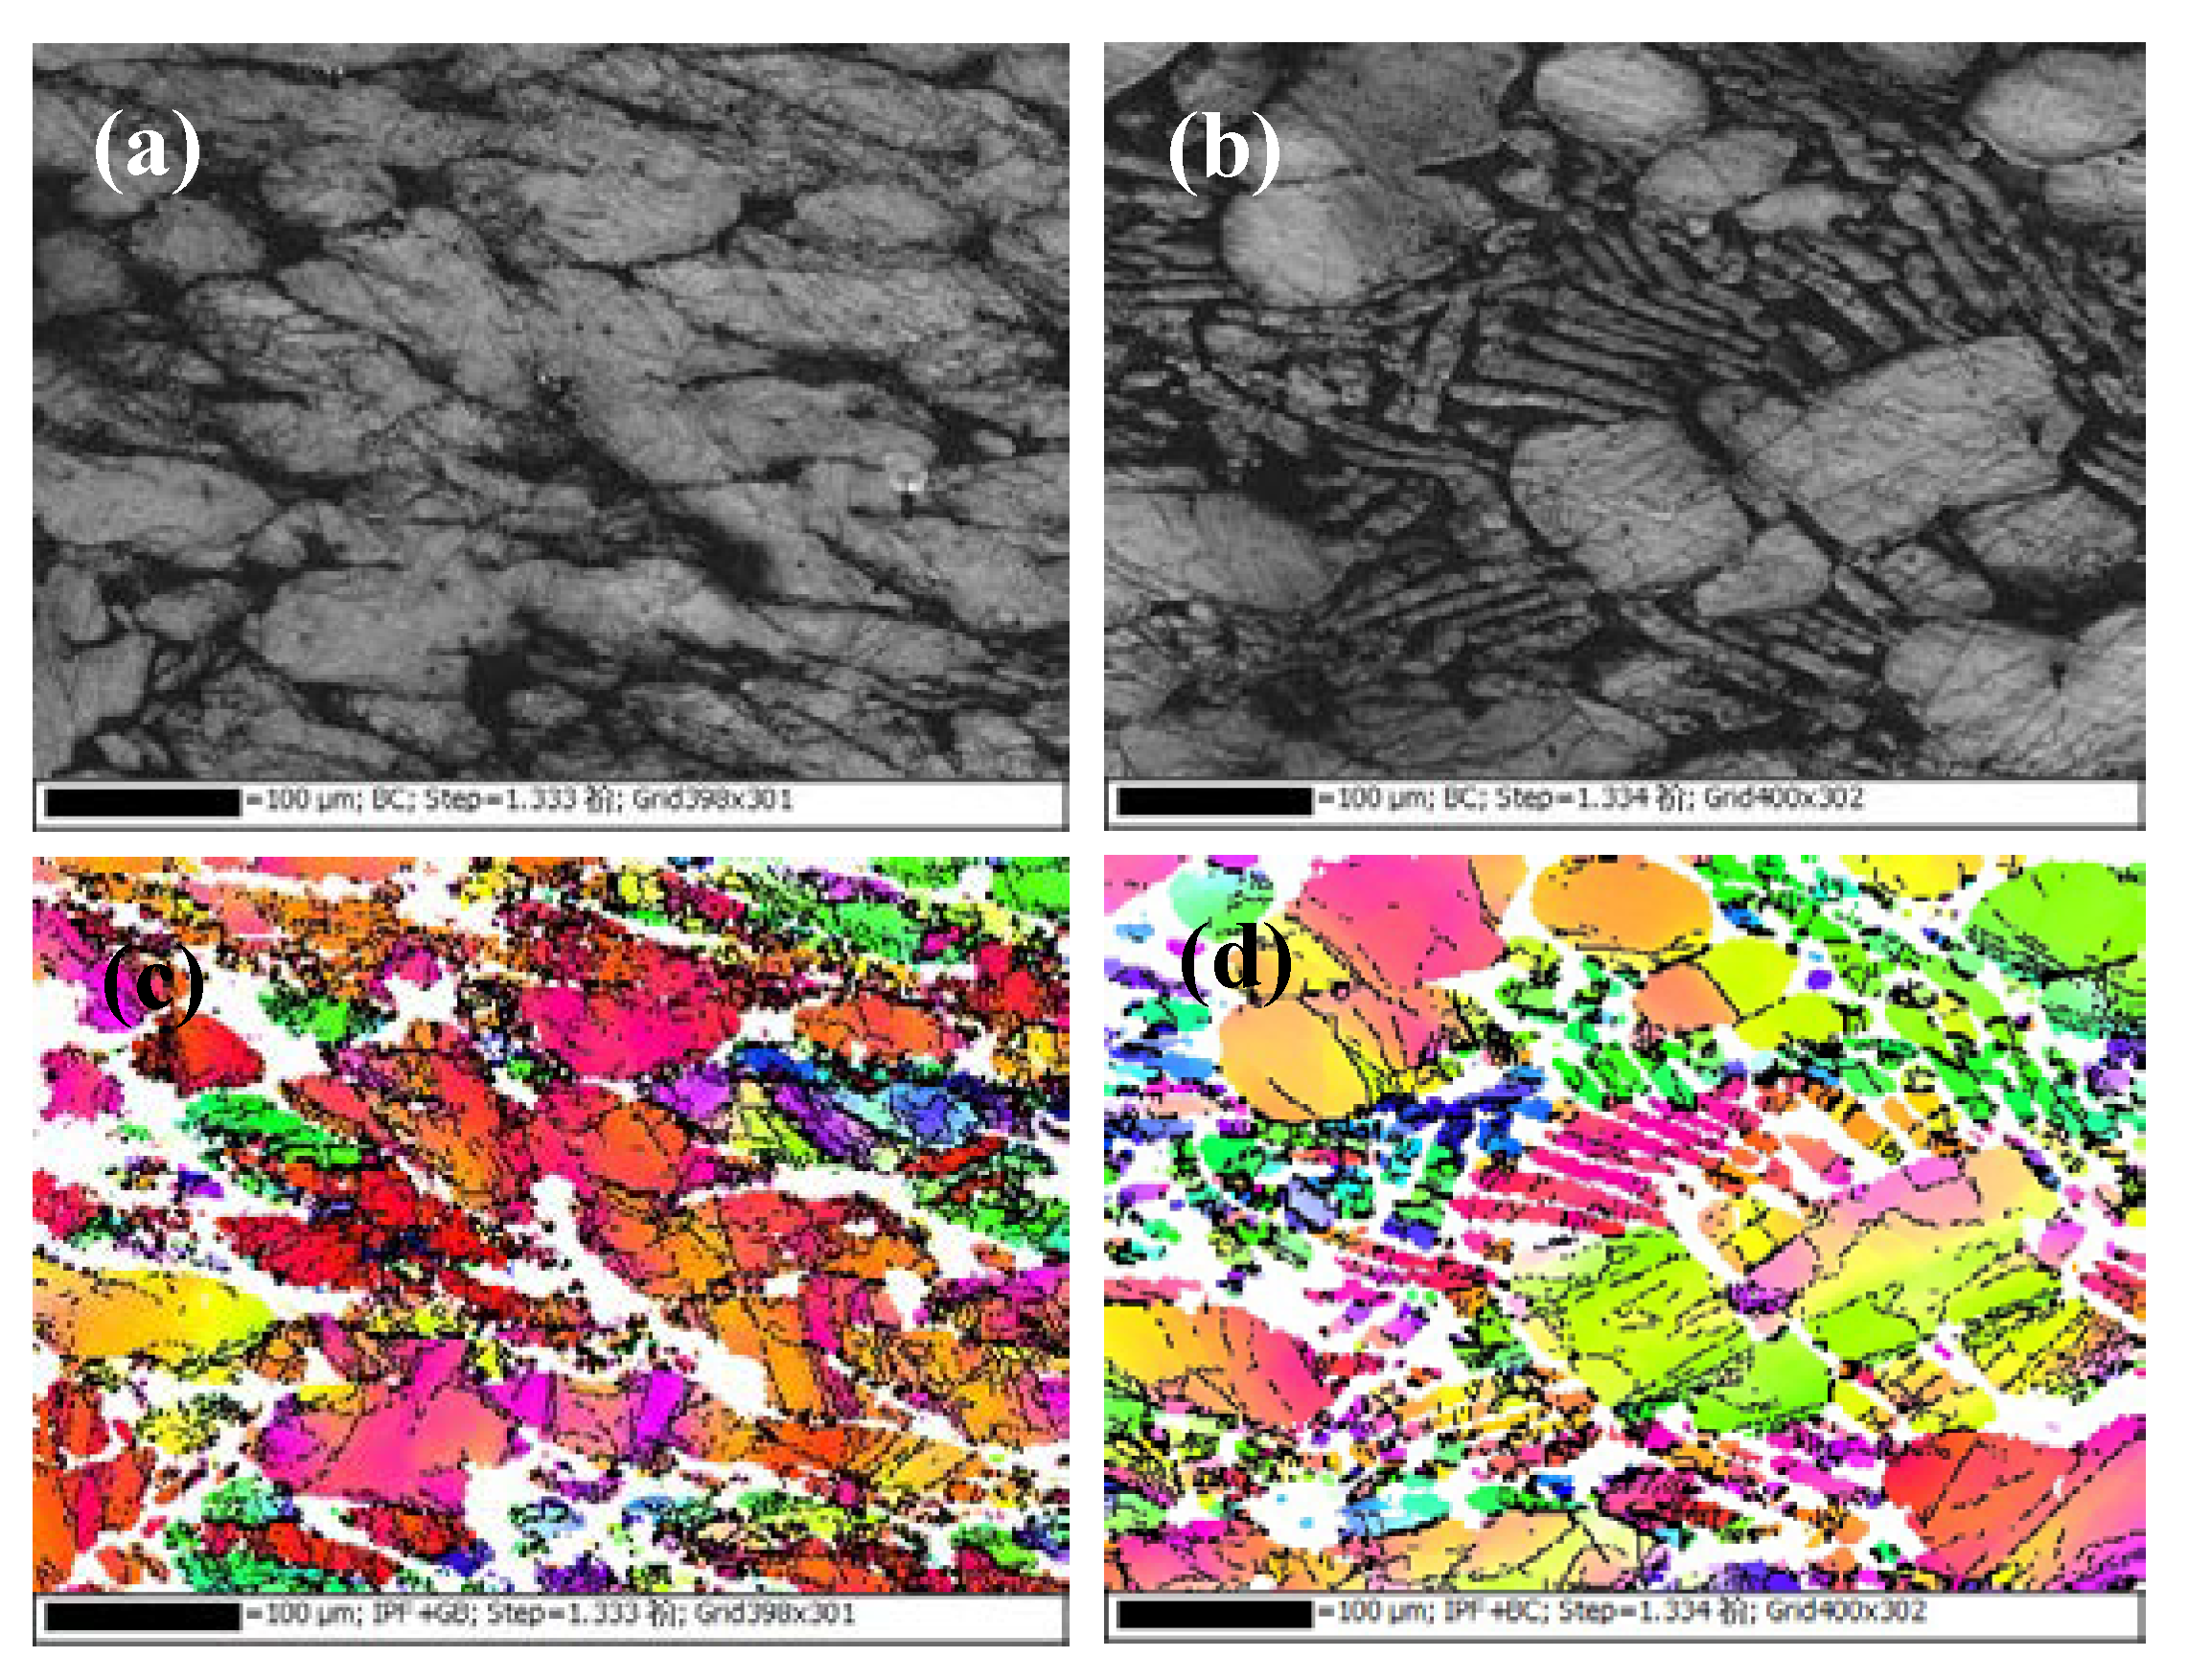
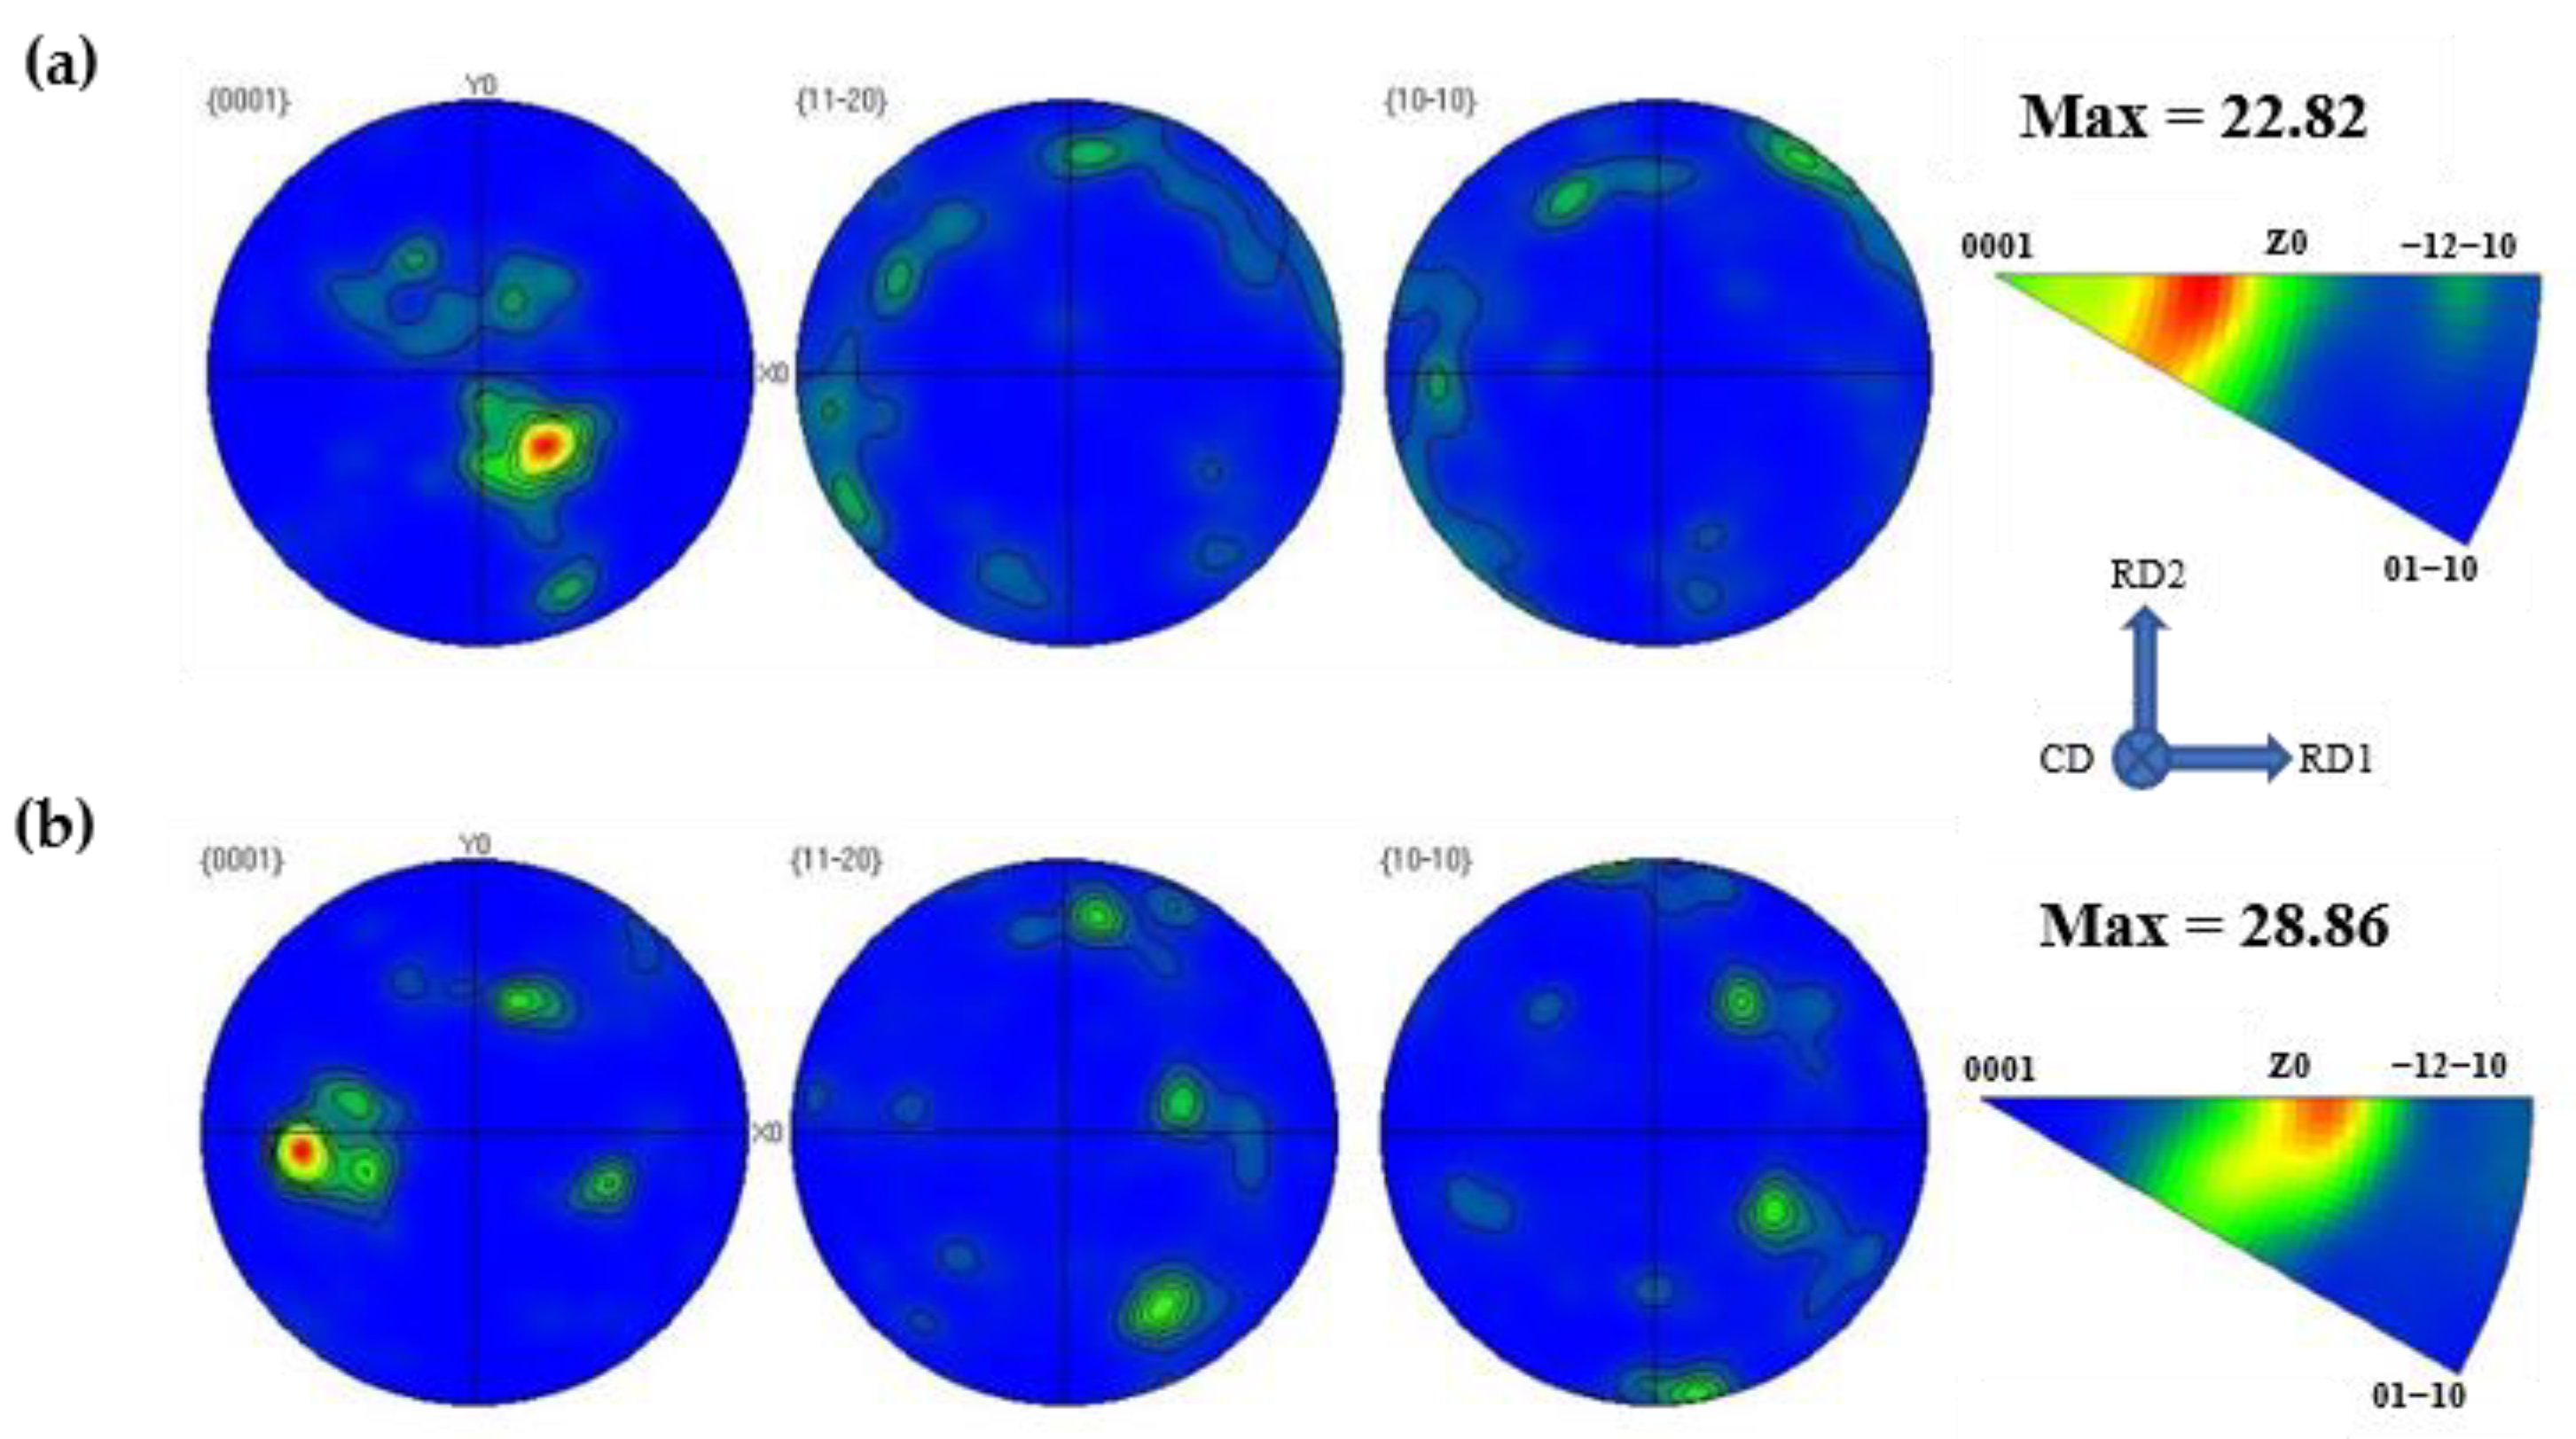
3.5. Micro-Morphology and EBSD Analysis

Generally, the texture, orientation and DRX behavior of magnesium alloys are all different with the changes of deformation temperature, strain, strain rate and other conditions during the deformation process [47]. Figure 11a,b show that a large number of twins appear in α-Mg phase at deformation temperature of 423 K and strain rate of 0.1 s−1. It is approached as the temperature is too low, and there are few independent sliding systems that can be activated, and the generation of twins plays an important role in recrystallization nucleation, coordination of grain growth and preferred orientation of grains. At higher temperatures, more slip systems can be activated, which also means that plastic deformation is more likely to occur, so the role of twinning in deformation is weakened, as shown in Figure 11c,d, without detection to twins [48,49,50,51,52]. It can also be known from the hot processing maps in Figure 10 that the sample is in instability area, however, the nucleation ability provided by low temperature is limited, and most of the power is consumed by twin nucleation.
Figure 12 shows the band contrast (BC) and inverse pole figure (IPF) analysis results of the Mg-6Li alloy at the strain rate of 0.01 s−1 and different deformation temperatures. In Figure 12a,b, the relative white parts are α-Mg phases, and the black parts represent β-Li phases. Comparting Figure 12a,b with Figure 2, it can also be observed that the α-Mg and β-Li are elongated and crushed after hot compression, especially the α-Mg phase in Figure 12b is more significant.
As shown in Figure 12c,d, IPF maps show the grain size and orientation distribution, thin black lines represent low angle grain boundary (LAGBs), each color in the figure represents a crystallography orientation, it is indicated that the crystal grains have similar orientations in similar colors.
As can be seen, with the change of the compression temperature, the preferred orientation of α-Mg has changed significantly, which may be due to the recrystallized nucleation and grown grains rotate into different grain orientations. In addition, it is noteworthy that a large number of LAGBs boundary are distributed within the coarsely deformed grains, and these LAGBs are related to the dislocation substructure caused by DRV, which will hinder the climbing and slipping of dislocations [53]. Moreover, the proportion of LAGBs boundary in Figure 12a is relatively higher than Figure 12b, this may be due to the fact that the dominated deformation is the base slip at low deformation temperatures, and the CRSS for non-base slip is higher. When the temperature rises to 573 K, because the high temperature will accelerate the migration rate of the grain boundary and be beneficial to the expansion of the grain boundary, the ratio of LAGBs boundary is lower than that at 473 K, thereby reducing the dislocation density inside the alloy [49,54].
Figure 13a,b is recrystallized fraction maps and the fraction of three types of microstructure of α-Mg phase under different deformation conditions, where blue represents dynamically recrystallized grains, yellow represents substructure, and red represents deformed grains, and the undetected white part is mainly β-Li phase. It can be seen from Figure 13 that the proportion of deformed grains is relatively large, while the proportion of dynamically recrystallized of α-Mg phase is not high, but it also tends to increase with increasing temperature. The main reasons are as follows: Firstly, since the β-Li phase with BCC structure and the α-Mg phase with HCP structure have different stacking fault energy, so their deformation behavior is different during hot deformation. The stacking fault energy of the α-Mg is higher, the softening is mainly achieved by DRV, while the β-Li stacking fault energy is lower, and its softening is mainly achieved by DRX. Therefore, the deformation processing in the softer β-Li phase firstly during the hot deformation of the Mg-6Li dual-phase alloy. With the continuous increase of the deformation in β-Li phases, the strain will be gradually transferred and accumulated in the α-Mg phase; Secondly, the slip systems in BCC structured β-Li phases is more easily to operate than in HCP structured α-Mg phase during the process of hot deformation. So the β-Li phase is relatively soft and allows greater deformation. Based on the above two reasons, the DRX degree of the α-Mg phase is bound to be decreased during the hot compression, which may be the reason for the low recrystallization ratio of the α-Mg phase [1,50].
Figure 14 shows the texture of α-Mg phase under different deformation conditions. In the figure, CD is the compression direction of the sample, and RDi (i = 1,2) is the radius direction. Figure 14a,b show that the basal texture of <0001>//CD mainly forms in α-Mg phase during the hot compression process. When the temperature is 473 K, the c-axis of most grains tilt ∼ 30° from <0001> to CD, and the strongest texture density is 22.82. The distribution of pole density points tilt ∼ 54° from <0001> to CD and the strongest density is 28.86 when the temperature is 573 K. The reason may be that the deformation mechanism changes from twinning to slip with the temperature increases, which is conducive to the deformation of grains, thereby forming a certain preferred orientation [55]. Furthermore, Qin and Li et al. [47,49] found that the DRX fraction of α-Mg phase increases greatly with the increase of temperature, which weakens the basal texture. However, in this paper, the DRX fraction of α-Mg phase in Mg-6Li alloy is relatively low, which has a tiny contribution to the weakening of the texture.

4. Conclusions

The hot deformation behavior of Mg-6Li alloy in the temperature range of 423 K–573 K and the strain rate range of 0.001 s−1–1 s−1 was systematically studied by constitutive modelling and hot processing maps. Then the microstructure and texture evolution were analyzed by SEM and BESD technology. According to the experimental results, the following main conclusions can be drawn:
(1)
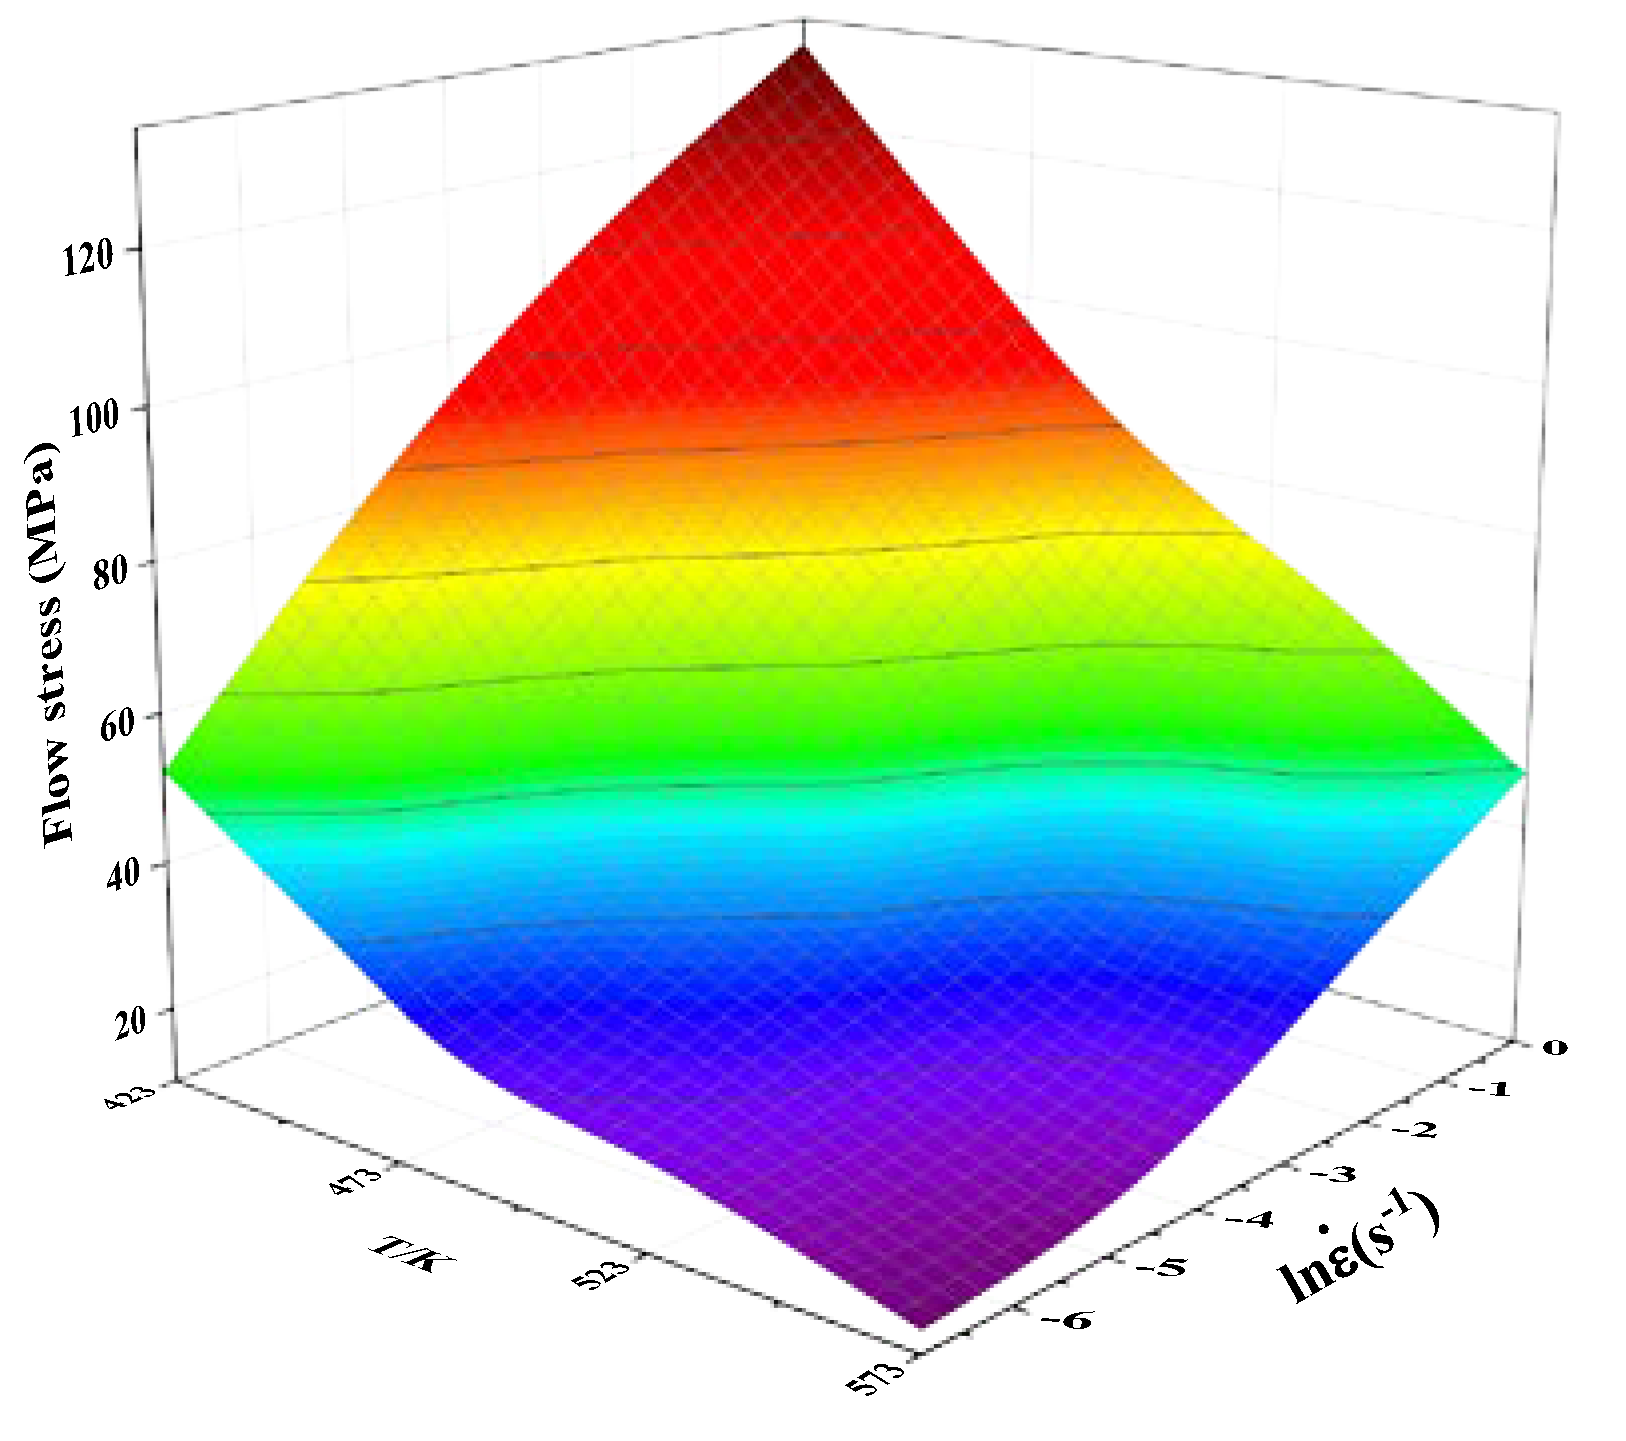
When the temperature is constant, the flow stress increases with the increase of the strain rate; while the strain rate is constant, the flow stress decreases with the increase of temperature, indicating that Mg-6Li alloy is a temperature and strain rate sensitive material.
(2)
According to the calculation, the activation energy of Mg-6Li alloy is 105.43 kJ/mol, and the thermal deformation constitutive model of Mg-6Li alloy can be expressed as:
ε ˙ = 1.9 × 10 9 [ sinh ( 0.02124 σ p ) ] 4.1934 exp ( 105.43 / R T )
(3)
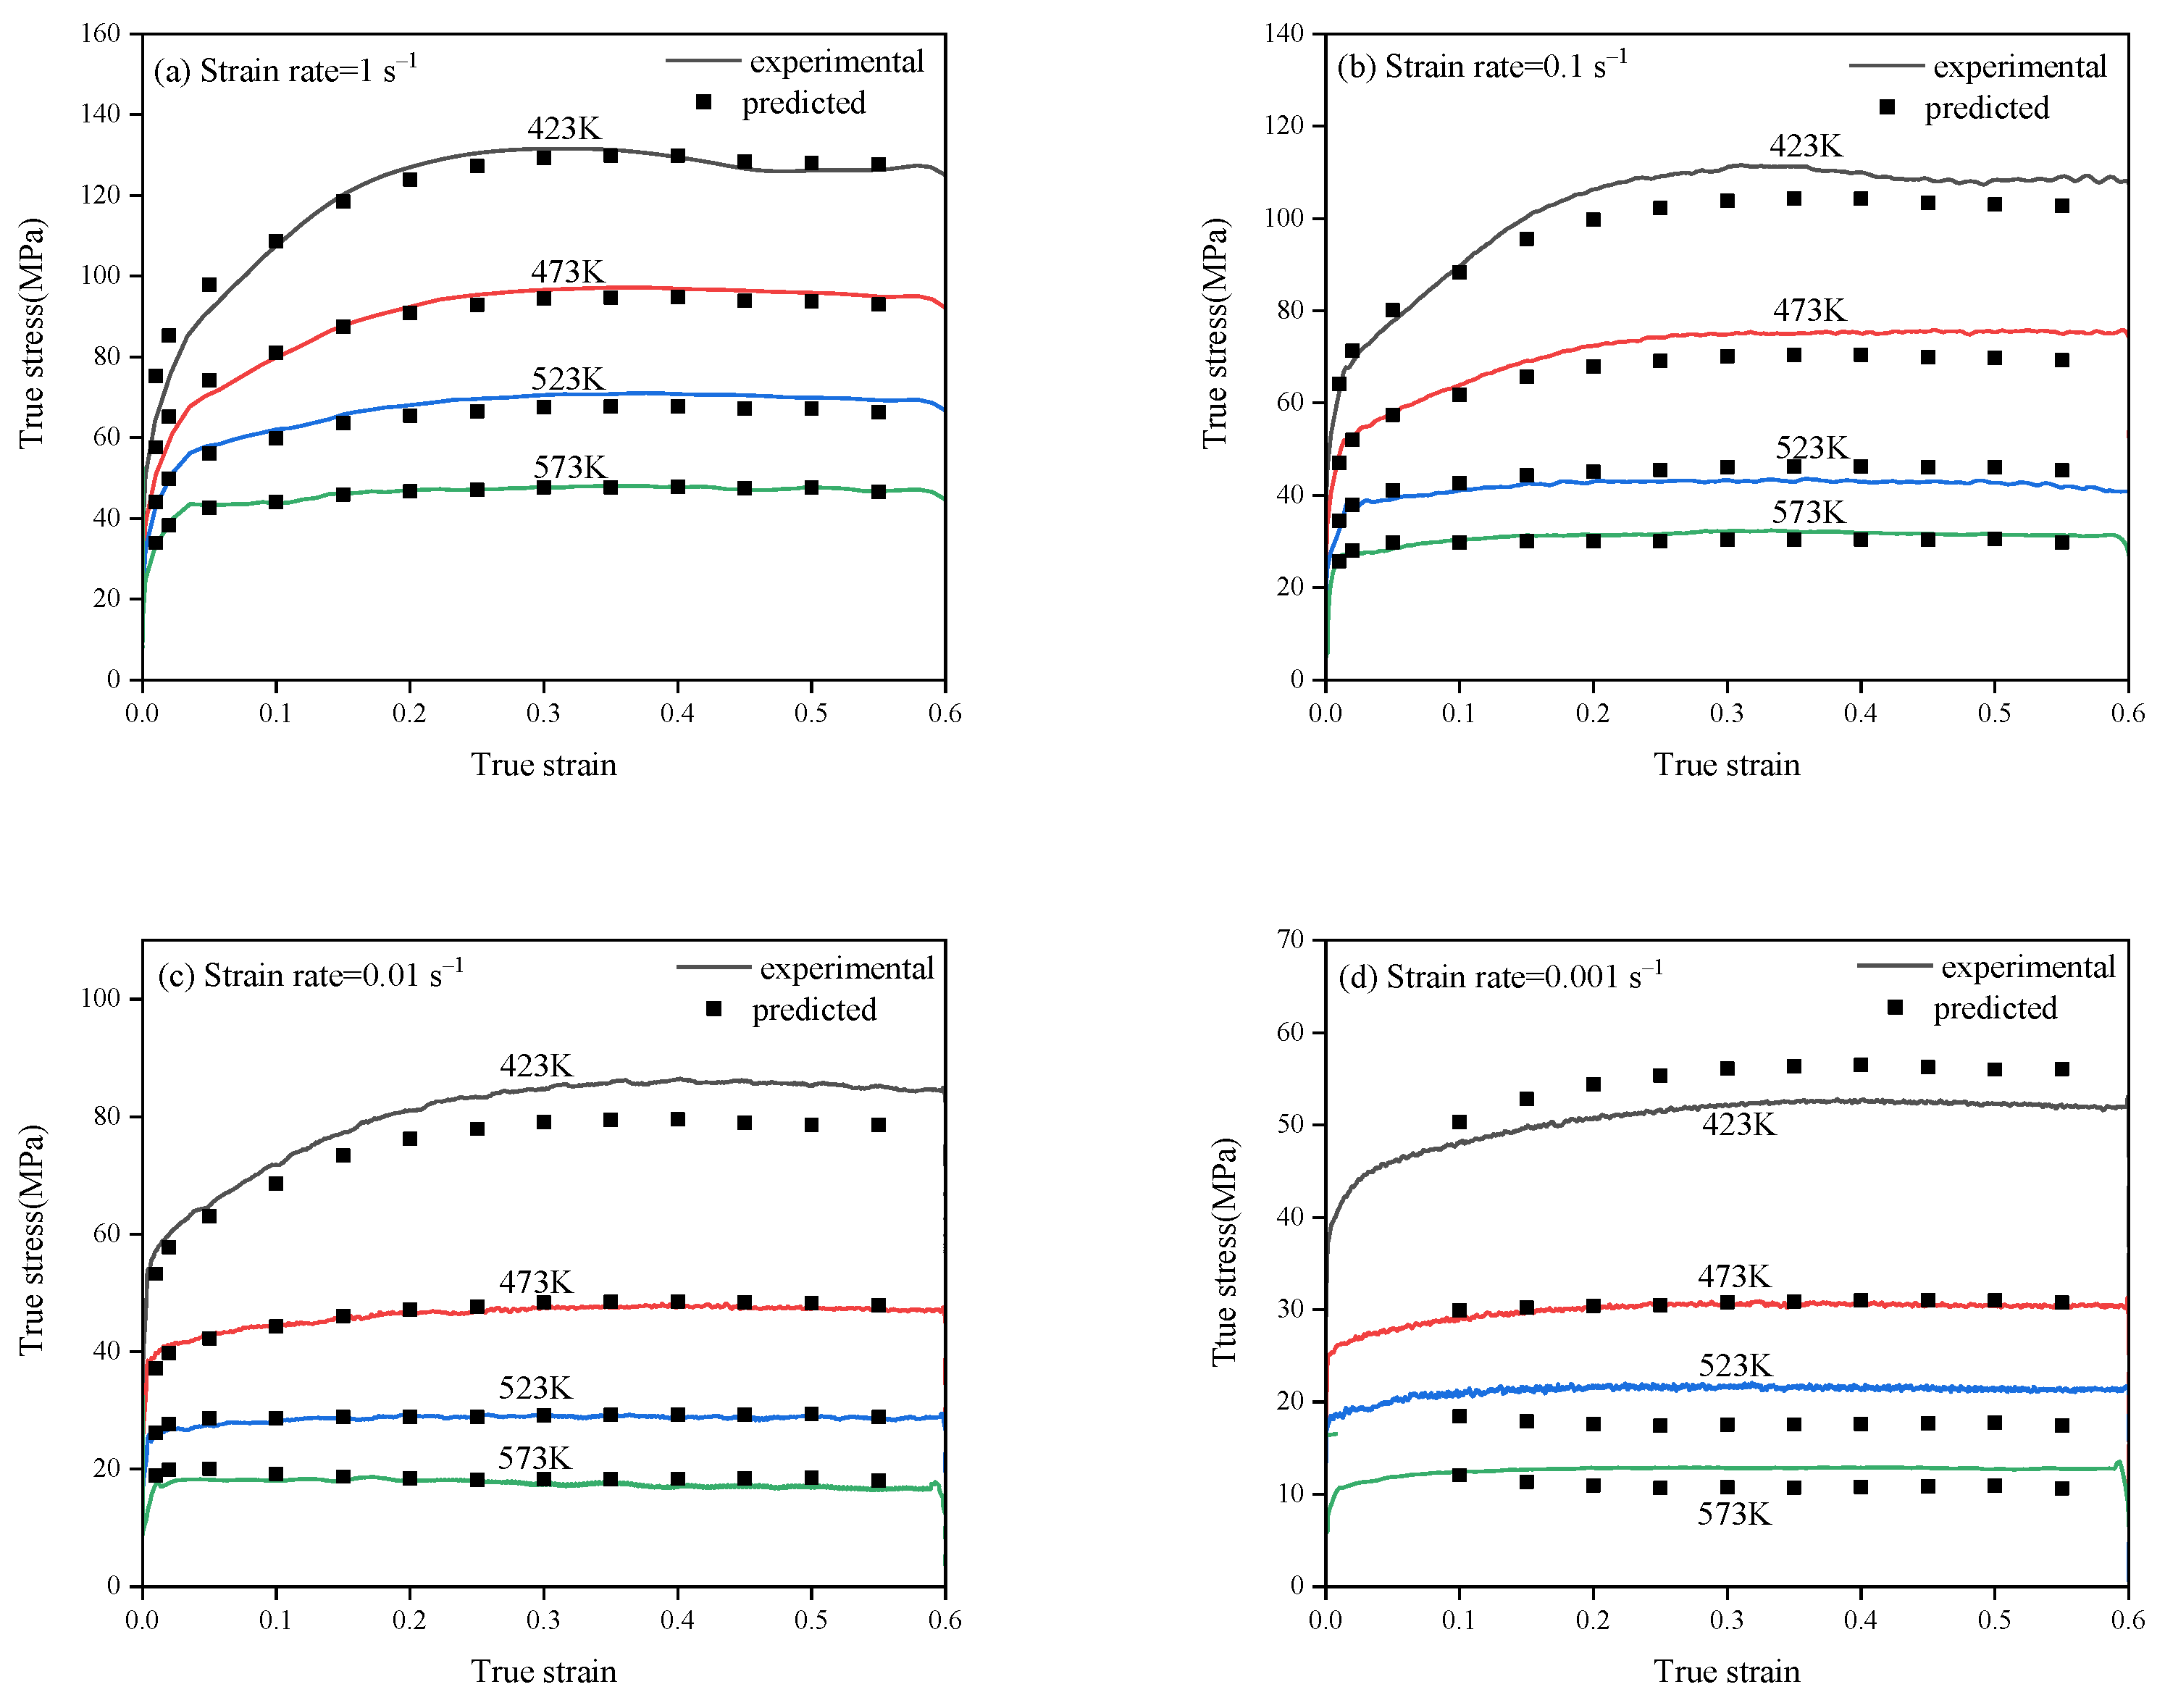
The accuracy of the model was checked through comparing the predicted value of the model and the experimental value. The correlation coefficient R was 0.9954, and the AARE was 5.48%, which indicates that the established constitutive model considering the compensation of strain has better predictive ability.
(4)
Based on the DMM and the instability criterion, the hot processing maps under different strains are established. The range of the instability zone increases while the strain increases. The suitable hot processing parameters of Mg-6Li alloy are obtained as in temperature range of 500 K–573 K, and in the strain rates from 0.01 s−1 to 0.1 s−1.
(5)
When the temperature is 423 K and the strain rate is 0.1 s−1, twins occur in the α-Mg phase; the proportion of DRX of the α-Mg phase is not high; in this experiment, the α-Mg phase forms a relatively strong <0001>//CD basal texture, but there is a tendency to deviate significantly from the CD direction with the increase of deformation temperature.

Author Contributions

Conceptualization, G.L.; methodology, Z.M.; investigation, X.B. and Q.P.; resources, G.W.; writing—original draft preparation, G.L.; writing—review and editing, G.W.; funding acquisition, G.W. All authors have read and agreed to the published version of the manuscript.

Funding

This research was funded by Fundamental Research Funds for the Venture & Innovation Support Program for Chongqing Overseas Returnees (Project No. cx2018057), the Chongqing Research Program of Basic Research and Frontier Technology (Project No. cstc2019jcjy-msxmX0539), the Fundamental Research Funds for the Central Universities (Project No.2020CDJDPT001 and 2020CDJGFCL003).

Data Availability Statement

Not applicable.

Conflicts of Interest

The authors declare no conflict of interest.

References

  1. Askariani, S.A.; Pishbin, S.M.H. Hot deformation behavior of Mg-4Li-1Al alloy via hot compression tests. J. Alloys Compd. 2016, 688, 1058–1065. [Google Scholar] [CrossRef]
  2. Sun, Y.; Wang, R.; Ren, J.; Peng, C.; Feng, Y. Hot deformation behavior of Mg-8Li-3Al-2Zn-0.2Zr alloy based on constitutive analysis, dynamic recrystallization kinetics, and processing map. Mech. Mater. 2019, 131, 158–168. [Google Scholar] [CrossRef]
  3. Wang, B.J.; Xu, D.K.; Cai, X.; Qiao, Y.X.; Sheng, L.Y. Effect of rolling ratios on the microstructural evolution and corrosion performance of an as-rolled Mg-8 wt. %Li alloy. J. Magnes. Alloys 2021, 9, 560–568. [Google Scholar] [CrossRef]
  4. Tang, S.; Xin, T.Z.; Xu, W.Q.; Miskovic, D.; Sha, G.; Quadir, Z.; Ringer, S.; Nomoto, K.; Birbilis, N.; Ferry, M. Precipitation strengthening in an ultralight magnesium alloy. Nat. Commun. 2019, 10, 8. [Google Scholar] [CrossRef] [PubMed]
  5. Peng, X.; Liang, X.; Liu, W.; Wu, G.; Ji, H.; Tong, X.; Zhang, L.; Ding, W. High-cycle fatigue behavior of Mg-8Li-3Al-2Zn-0.5Y alloy under different states. J. Magnes. Alloys 2020. [Google Scholar] [CrossRef]
  6. Chen, Z.; Li, Z.; Yu, C. Hot deformation behavior of an extruded Mg–Li–Zn–RE alloy. Mater. Sci. Eng. A 2011, 528, 961–966. [Google Scholar] [CrossRef]
  7. Li, Y.; Guan, Y.J.; Zhai, J.Q.; Lin, J. Hot deformation behavior of LA43M Mg-Li alloy via hot compression tests. J. Mater. Eng. Perform. 2019, 28, 7768–7781. [Google Scholar] [CrossRef]
  8. Wang, B.; Xu, K.; Xu, D.; Cai, X.; Qiao, Y.; Sheng, L. Anisotropic corrosion behavior of hot-rolled Mg-8 wt. %Li alloy. J. Mater. Sci. Technol. 2020, 53, 102–111. [Google Scholar] [CrossRef]
  9. Mordike, B.L.; Ebert, T. Magnesium: Properties-applications-potential. Mater. Sci. Eng. A 2001, 30, 37–45. [Google Scholar] [CrossRef]
  10. Schino, A.D. Manufacturing and applications of stainless steels. Metals 2020, 10, 327. [Google Scholar] [CrossRef] [Green Version]
  11. Li, C.; He, Y.; Huang, H. Effect of lithium content on the mechanical and corrosion behaviors of HCP binary Mg–Li alloys. J. Magnes. Alloys 2021, 9, 569–580. [Google Scholar] [CrossRef]
  12. Takuda, H.; Matsusaka, H. Tensile properties of a few Mg-Li-Zn alloy thin sheets. J. Mater. Sci. Technol. 2002, 37, 51–57. [Google Scholar]
  13. Watanabe, H.; Mukai, T.; Ishikawa, K. Differential speed rolling of an AZ31 magnesium alloy and the resulting mechanical properties. J. Mater. Sci. Technol. 2004, 39, 1477–1480. [Google Scholar] [CrossRef]
  14. Shalbafi, M.; Roumina, R.; Mahmudi, R. Hot deformation of the extruded Mg–10Li–1Zn alloy: Constitutive analysis and processing maps. J. Alloys Compd. 2017, 696, 1269–1277. [Google Scholar] [CrossRef]
  15. Yuan, W.; Mishra, R.S. Grain size and texture effects on deformation behavior of AZ31 magnesium alloy. Mater. Sci. Eng. A 2012, 558, 716–724. [Google Scholar] [CrossRef]
  16. Wei, G.; Mahmoodkhani, Y.; Peng, X.; Hadadzadeh, A.; Xu, T.; Liu, J.; Xie, W.; Wells, M.A. Microstructure evolution and simulation study of a duplex Mg–Li alloy during double change channel angular pressing. Mater. Des. 2016, 90, 266–275. [Google Scholar] [CrossRef]
  17. Yang, Y.; Peng, X.; Wen, H.; Zheng, B.; Zhou, Y.; Xie, W.; Lavernia, E.J. Influence of extrusion on the microstructure and mechanical behavior of Mg-9Li-3Al-xSr alloys. Metall. Mater. Trans. A 2013, 44, 1101–1113. [Google Scholar] [CrossRef]
  18. Dong, H.; Pan, F.; Jiang, B.; Zeng, Y. Evolution of microstructure and mechanical properties of a duplex Mg–Li alloy under extrusion with an increasing ratio. Mater. Des. 2014, 57, 121–127. [Google Scholar] [CrossRef]
  19. Rahulan, N.; Gopalan, S.; Kumaran, S. Mechanical behavior of Mg-Li-Al alloys. Mater. Today Proc. 2018, 5, 17935–17943. [Google Scholar] [CrossRef]
  20. Yang, Y.; Chen, X.; Nie, J.; Wei, K.; Mao, Q.; Lu, F.; Zhao, Y. Achieving ultra-strong magnesium–lithium alloys by low-strain rotary swaging. Mater. Res. Lett. 2021, 9, 255–262. [Google Scholar] [CrossRef]
  21. Drozd, Z.; Trojanová, Z.; Kúdela, S. Deformation behaviour of Mg–Li–Al alloys. J. Alloys Compd. 2004, 378, 192–195. [Google Scholar] [CrossRef]
  22. Wei, G.; Peng, X.; Hadadzadeh, A.; Mahmoodkhani, Y.; Xie, W.; Yang, Y.; Wells, M.A. Constitutive modeling of Mg–9Li–3Al–2Sr–2Y at elevated temperatures. Mech. Mater. 2015, 89, 241–253. [Google Scholar] [CrossRef]
  23. Yang, Y.; Peng, X.; Ren, F.; Wen, H.; Su, J.; Xie, W. Constitutive modeling and hot deformation behavior of duplex structured Mg–Li–Al–Sr Alloy. J. Mater. Sci. Technol. 2016, 32, 1289–1296. [Google Scholar] [CrossRef]
  24. He, A.; Chen, L.; Hu, S.; Wang, C.; Huangfu, L. Constitutive analysis to predict high temperature flow stress in 20CrMo continuous casting billet. Mater. Des. 2013, 46, 54–60. [Google Scholar] [CrossRef]
  25. Xu, W.; Yuan, C.; Wu, H.; Yang, Z.; Yang, G.; Shan, D.; Guo, B.; Jin, B.C. Modeling of flow behavior and microstructure evolution for Mg-6Gd-5Y-0.3Zr alloy during hot deformation using a unified internal state variable method. J. Mater. Res. Technol. 2020, 9, 7669–7685. [Google Scholar] [CrossRef]
  26. Wu, H.; Xu, W.; Wang, S.B.; Yang, Z.Z.; Guo, B. A cellular automaton coupled FEA model for hot deformation behavior of AZ61 magnesium alloys. J. Alloys Compd. 2019, 816, 152562. [Google Scholar] [CrossRef]
  27. Ashtiani, H.R.R.; Shahsavari, P. Strain-dependent constitutive equations to predict high temperature flow behavior of AA2030 aluminum alloy. Mech. Mater. 2016, 100, 209–218. [Google Scholar] [CrossRef]
  28. Li, X.; Li, X.; Zhou, H.; Zhou, X.; Li, F.; Liu, Q. Simulation of dynamic recrystallization in AZ80 magnesium alloy using cellular automaton. Comput. Mater. Sci. 2017, 140, 95–104. [Google Scholar] [CrossRef]
  29. Xu, Y.; Hu, L.; Deng, T.; Ye, L. Hot deformation behavior and processing map of as-cast AZ61 magnesium alloy. Mater. Sci. Eng. A 2013, 559, 528–533. [Google Scholar] [CrossRef]
  30. Shi, B.-L.; Luo, T.-J.; Wang, J.; Yang, Y.-S. Hot compression behavior and deformation microstructure of Mg-6Zn-1Al-0.3Mn magnesium alloy. Trans. Nonferr. Met. Soc. China 2013, 23, 2560–2567. [Google Scholar] [CrossRef]
  31. Sarebanzadeh, M.; Mahmudi, R.; Roumina, R. Constitutive analysis and processing map of an extruded Mg-3Gd-1Zn alloy under hot shear deformation. Mater. Sci. Eng. A 2015, 637, 155–161. [Google Scholar] [CrossRef]
  32. Wang, C.; Xu, Y.; Han, E. Serrated flow and abnormal strain rate sensitivity of a magnesium–lithium alloy. Mater. Lett. 2006, 60, 2941–2944. [Google Scholar] [CrossRef]
  33. Jin, Z.Z.; Zha, M.; Yu, Z.Y.; Ma, P.K.; Li, Y.K.; Liu, J.M.; Jia, H.L.; Wang, H.Y. Exploring the Hall-Petch relation and strengthening mechanism of bimodal-grained Mg-Al-Zn alloys. J. Alloys Compd. 2020, 833, 7. [Google Scholar] [CrossRef]
  34. Lv, B.J.; Peng, J.; Shi, D.W.; Tang, A.T.; Pan, F.S. Constitutive modeling of dynamic recrystallization kinetics and processing maps of Mg-2.0Zn-0.3Zr alloy based on true stress-strain curves. Mater. Sci. Eng. A 2013, 568, 219. [Google Scholar] [CrossRef]
  35. Wei, G.-B.; Peng, X.-D.; Hu, F.-P.; Hadadzadeh, A.; Yang, Y.; Xie, W.-D.; Wells, M.A. Deformation behavior and constitutive model for dual-phase Mg–Li alloy at elevated temperatures. Trans. Nonferr. Met. Soc. China 2016, 26, 508–518. [Google Scholar] [CrossRef]
  36. Zhang, C.; Zhang, L.; Shen, W.; Liu, C.; Xia, Y.; Li, R. Study on constitutive modeling and processing maps for hot deformation of medium carbon Cr–Ni–Mo alloyed steel. Mater. Des. 2016, 90, 804–814. [Google Scholar] [CrossRef]
  37. Sellars, C.M.; McTegart, W.J. On the mechanism of hot deformation. Acta Metall. 1966, 14, 1136–1138. [Google Scholar] [CrossRef]
  38. Zener, C.; Hollomon, J.H. Effect of strain rate upon plastic flow of steel. J. Appl. Phys. 1944, 15, 22–32. [Google Scholar] [CrossRef]
  39. Tahreen, N.; Zhang, D.F.; Pan, F.S.; Jiang, X.Q.; Li, D.Y.; Chen, D.L. Hot deformation and processing map of an as-extruded Mg–Zn–Mn–Y alloy containing I and W phases. Mater. Des. 2015, 87, 245–255. [Google Scholar] [CrossRef]
  40. Ding, Z.-Y.; Zhang, D.; Hu, Q.-D.; Zeng, L.; Li, J.-G. Constitutive analysis and optimization on hot working parameters of as-cast high Cr ultra-super-critical rotor steel with columnar grains. J. Iron Steel Res. Int. 2017, 24, 916–924. [Google Scholar] [CrossRef]
  41. Prasad, Y.V.R.K.; Gegel, H.L.; Doraivelu, S.M.; Malas, J.C.; Morgan, J.T.; Lark, K.A.; Barker, D.R. Modeling of dynamic material behavior in hot deformation: Forging of Ti-6242. Metall. Trans. A 1984, 15, 1883–1892. [Google Scholar] [CrossRef]
  42. Sahoo, B.N.; Panigrahi, S.K. Deformation behavior and processing map development of AZ91 Mg alloy with and without addition of hybrid in-situ TiC + TiB2 reinforcement. J. Alloys Compd. 2019, 776, 865–882. [Google Scholar] [CrossRef]
  43. Zhu, S.Z.; Luo, T.J.; Zhang, T.A.; Yang, Y.S. Hot deformation behavior and processing maps of as-cast Mg–8Zn–1Al–0.5Cu–0.5Mn alloy. Trans. Nonferr. Met. Soc. China 2015, 25, 3232–3239. [Google Scholar] [CrossRef]
  44. Ji, G.; Li, F.; Li, Q.; Li, H.; Li, Z. Development and validation of a processing map for Aermet100 steel. Mater. Sci. Eng. A 2010, 527, 1165–1171. [Google Scholar] [CrossRef]
  45. Zhang, J.; Wu, C.; Peng, Y.; Xia, X.; Li, J.; Ding, J.; Liu, C.; Chen, X.; Dong, J.; Liu, Y. Hot compression deformation behavior and processing maps of ATI 718Plus superalloy. J. Alloys Compd. 2020, 835, 155195. [Google Scholar] [CrossRef]
  46. Liu, Y.; Ning, Y.; Yao, Z.; Guo, H. Hot deformation behavior of Ti–6.0Al–7.0Nb biomedical alloy by using processing map. J. Alloys Compd. 2014, 587, 183–189. [Google Scholar] [CrossRef]
  47. Qin, D.H.; Wang, M.J.; Sun, C.Y.; Su, Z.X.; Qian, L.Y.; Sun, Z.H. Interaction between texture evolution and dynamic recrystallization of extruded AZ80 magnesium alloy during hot deformation. Mater. Sci. Eng. A 2020, 788, 139537. [Google Scholar] [CrossRef]
  48. Guan, D.; Rainforth, W.M.; Ma, L.; Wynne, B.; Gao, J. Twin recrystallization mechanisms and exceptional contribution to texture evolution during annealing in a magnesium alloy. Acta Mater. 2017, 126, 132–144. [Google Scholar] [CrossRef]
  49. Li, X.; Ren, L.; Le, Q.; Jin, P.; Cheng, C.; Wang, T.; Wang, P.; Zhou, X.; Chen, X.; Li, D. The hot deformation behavior, microstructure evolution and texture types of as-cast Mg–Li alloy. J. Alloys Compd. 2020, 831, 154868. [Google Scholar] [CrossRef]
  50. Liu, G.; Xie, W.; Hadadzadeh, A.; Wei, G.; Ma, Z.; Liu, J.; Yang, Y.; Xie, W.; Peng, X.; Wells, M. Hot deformation behavior and processing map of a superlight dual-phase Mg–Li alloy. J. Alloys Compd. 2018, 766, 460–469. [Google Scholar] [CrossRef]
  51. Guan, D.; Rainforth, W.M.; Gao, J.; Sharp, J.; Wynne, B.; Ma, L. Individual effect of recrystallisation nucleation sites on texture weakening in a magnesium alloy: Part 1- double twins. Acta Mater. 2017, 135, 14–24. [Google Scholar] [CrossRef]
  52. Ansari, N.; Tran, B.; Poole, W.J.; Singh, S.S.; Krishnaswamy, H.; Jain, J. High temperature deformation behavior of Mg-5wt.%Y binary alloy: Constitutive analysis and processing maps. Mater. Sci. Eng. A 2020, 777, 139051. [Google Scholar] [CrossRef]
  53. Lin, Y.C.; Wu, X.-Y.; Chen, X.-M.; Chen, J.; Wen, D.-X.; Zhang, J.-L.; Li, L.-T. EBSD study of a hot deformed nickel-based superalloy. J. Alloys Compd. 2015, 640, 101–113. [Google Scholar] [CrossRef]
  54. Zhang, B.P.; Geng, L.; Huang, L.J.; Zhang, X.X.; Dong, C.C. Enhanced mechanical properties in fine-grained Mg–1.0Zn–0.5Ca alloys prepared by extrusion at different temperatures. Scr. Mater. 2010, 63, 1024–1027. [Google Scholar] [CrossRef]
  55. Barnett, M.R.; Keshavarz, Z.; Beer, A.G.; Atwell, D. Influence of grain size on the compressive deformation of wrought Mg–3Al–1Zn. Acta Mater. 2004, 52, 5093–5103. [Google Scholar] [CrossRef]
Figure 1. XRD patterns of homogenized alloy and the compressed specimen (573 K-0.01 s−1).
Metals 11 00911 g001
Figure 2. Different magnification microstructure of Mg-6Li alloy after homogenization treatment. (a) 1000×, (b) 4000×.
Metals 11 00911 g002
Figure 3. True stress-strain curves of Mg-6Li alloy deformed to the strain of 0.6 at different temperatures and strain rates. (a) strain rate = 1 s−1 (b) strain rate = 0.1 s−1 (c) strain rate = 0.01 s−1 (d) strain rate = 0.001 s−1.
Metals 11 00911 g003
Figure 4. Representation of flow stress as a function of temperature and strain rate at strain of 0.3.
Metals 11 00911 g004
Figure 5. Linear fitting relationships at strain = 0.3: (a) ln ε ˙ ~σ; (b) ln ε ˙ ~lnσ.
Metals 11 00911 g005
Figure 6. Linear fitting relationships at strain = 0.3: (a) ln[sinh(ασ)]~ln ε ˙ ; (b) 1000/T~ln[sinh(ασ)].
Metals 11 00911 g006
Figure 7. The relationship between the values and true strains. (a) α, (b) n, (c) lnA, (d) Q.
Metals 11 00911 g007
Figure 8. Comparison of predicted values and experimental values at different deformation conditions.
Metals 11 00911 g008
Figure 9. Correlation analysis between experimental values and constitutive equation prediction values.
Metals 11 00911 g009
Figure 10. 3-D trend graph of m values (strain rate sensitivity exponent) and hot processing maps. (a,d) ε = 0.1, (b,e) ε = 0.3, (c,f) ε = 0.5.
Metals 11 00911 g010
Figure 11. SEM image of Mg-6Li alloy: (a,b) with different magnification at 423 K and 0.1 s−1. (c) 473 K-0.01 s−1. (d) 573 K-0.01 s−1.
Metals 11 00911 g011
Figure 12. BC maps and IPF maps and of Mg-6Li alloy at the strain rate of 0.01 s−1 and different deformation temperatures. (a,c) 473 K, (b,d) 573 K.
Metals 11 00911 g012
Figure 13. The α-Mg phase’s recrystallized fraction maps and corresponding fraction of three types microstructure when the strain rate is 0.01 s−1. (a,b) T = 473 K and (c,d) T = 573 K.
Metals 11 00911 g013
Figure 14. The α-Mg phase pole figure and IPF of the Mg-6Li alloy at the strain rate 0.01 s−1 (a) 473 K, (b) 573 K.
Metals 11 00911 g014
Table 1. Coefficients of the fitted polynomial functions.
αnAQ
α10.03396n17.40442A127.38325Q1136.89891
α2−0.47535n2−100.99892A2−386.50208Q21870.87388
α39.00370n31792.26120A37989.21128Q338,099.96022
α4−90.52020n4−17,701.72958A4−80,686.03201Q4383,138.59618
α5514.34717n599,781.41437A5455,048.70069Q52.15668 × 106
α61710.94846n6329,484.08701A6−1.50207 × 10⁶Q6−7.11042 × 10⁶
α73300.05776n7630,363.62261A72.87962 × 106Q71.36187 × 107
α83414.20023n8646,468.03774A8−2.96649 × 10⁶Q8−1.40183 × 10⁷
α91464.20506n9274,719.33784A91.26886 × 106Q95.99147 × 106
Publisher’s Note: MDPI stays neutral with regard to jurisdictional claims in published maps and institutional affiliations.

