Article

Warm Hydroforming Process under Non-Uniform Temperature Field for Magnesium Alloy Tubes

Department of Mechanical Systems Engineering, Tokyo Metropolitan University, 1-1 Minamiosawa, Hachioji, Tokyo 192-0397, Japan
*
Author to whom correspondence should be addressed.
Metals 2021, 11(6), 901; https://doi.org/10.3390/met11060901
Submission received: 5 April 2021 / Revised: 8 May 2021 / Accepted: 21 May 2021 / Published: 31 May 2021
(This article belongs to the Special Issue Latest Hydroforming Technology of Metallic Tubes and Sheets)

Abstract

:
The warm tube hydroforming (WTHF) process of lightweight materials such as magnesium alloy contributes to a remarkable weight reduction. The success of the WTHF process strongly depends on the loading path with internal pressure and axial feeding and other process variables including temperature distribution. Optimization of these process parameters in this special forming technique is a great issue to be resolved. In this study, the optimization of the symmetrical temperature distribution and process loading path for the warm T-shape forming of magnesium alloy AZ31B tube was carried out by finite element (FE) analysis using a fuzzy model. As a result, a satisfactory good agreement of the wall thickness distribution of the samples formed under the optimum loading path condition can be obtained between the FE analysis result and the experimental result. Based on the validity validation of FE analysis model, the optimization method was applied to other materials and forming shapes, and applicability was discussed.

1. Introduction

In recent years, the world has begun to move toward carbon neutrality as one of the solutions to prevent global warming. In response to the trend, along with the acceleration toward electric vehicles, the weight of the entire vehicle including the vehicle body is being further reduced. Tube hydroforming (THF), which uses a tubular material with a hollow cross section for high rigidity, is considered to be promising for reducing the weight of vehicles, in addition to material replacement with lightweight materials and high-strength materials, and is actually applied in the automotive industry.
Aluminum, magnesium, and fiber-reinforced polymers have been taken up as typical lightweight materials. Among these, magnesium is the lightest of all practical metals and is attracting attention as one of the important metals for realizing a low-carbon society due to its unique physical and mechanical properties. However, magnesium alloys have been treated as one of the hard-to-form metals at room temperature. So far, several metal forming processes for magnesium alloys using a heat-assisted approach have been introduced in order to enhance the formability and reduce the environmental load.
Most of the research on forming processes for magnesium alloy tubes has been conducted using heat-assisted processing since the mid-2000s, and started with hot spin forming. Yoshihara et al. [1] examined the dome-shape forming characteristics of the tube end while locally heating the formed part with a gas burner for hot spin forming of an AZ31 tube, and Murata et al. [2] investigated the compression spinning process of an AZ31 tube using the heated roller. For the high temperature bulge forming, Okamoto et al. [3] succeeded in warm T-shape forming of an AZ31B tube at 400 °C using nitrogen gas. Manabe et al. [4,5] performed T-shape forming (WTHF) at 250 °C using silicone oil as a pressure medium for AZ31 tube and compared the forming characteristics by experiment and FE analysis. Hwang and Wang [6] have succeeded in a Y-shape forming experiment of AZ61 tube at 250 °C, and it was shown that Y molding can be performed even at 150 °C. He et al. [7] investigated and evaluated the formability in a basic formability test of the AZ31B tube at high temperature. For the drawing process of magnesium alloy tube, Furushima et al. developed a high-frequency induction heating device system to locally heat and cool the AZ31 tube, and it was examined to improve the processing time of dieless drawing and the drawability [8,9]. An in vitro corrosion test [10] of the dieless drawn tube of AZ31B and the dieless drawing process by a laser heating device [11] were also performed.
Other heat-assisted processing technologies applied to hard-to-form metals other than magnesium alloy tubes include warm and hot hydroforming [12,13] for aluminum alloy tubes. Hot gas bulge forming was performed on aluminum alloy tubes [14,15] and high-strength steel tubes [16,17] using a direct resistance heating technique. In addition, profile forming [18], utilizing a bulge deformation under axial compression by local heating using a high-frequency induction device for a double-layer metal tube was performed. As a new heat-assisted forming technology, a novel dieless bellows forming that continuously creates a convolution at the heating portion with a difference in axial feeding speed on both tube sides while locally heating with a high-frequency induction device was developed for the stainless steel SUS304 tubes [19,20]. Additionally, the dieless bending process of tubes [21] is a typical heat-assisted processing technology that applies the local heating and cooling technique, and it has been introduced into practical use since the latter half of the 1960s and is the most widely used processing technology in the industry. Recently, a three-dimensional hot bending and direct quench (3DQ) technology [22] was developed as the latest technology that can be applied to high-strength steel tubes of 1470 MPa class or higher, based on basically a push bending process with a local heating and cooling system using a high-frequency induction device.
The various forming processes described above are classified in the heat-assisted forming technology from the viewpoints of “steady deformation”, “unsteady deformation”, “continuous/sequential processes”, “intermittent process”, and “dieless process” without die for forming objects. The above-mentioned dieless drawing, dieless bellows forming, and dieless bending process belong to sequential/continuous deformation process at the local heating portion, respectively.
The heat-assisted forming technology is classified according to whether or not the heating temperature is uniform over the entire forming portion. If the temperature field is uniform, the main difference in the forming characteristics is only the variation in the physical characteristics of the material.
Meanwhile, in the case of the non-uniform temperature field, there are two types of non-uniform temperature fields. (1) The first is the case where the temperature distribution is formed on the coordinates fixed on the metal blank, and (2) the second is the case where the temperature distribution is formed on the coordinates fixed on the space such as tooling. In sheet metal forming, the former (1) is used in stretch forming and bending, and in the latter (2), the local heating/cooling deep drawing method has been performed since the 1950s.
However, so far, there are very few studies on WTHF for non-uniform temperature fields. The above-mentioned study on the non-uniform temperature field in (1) was reported by Liu et al. [23]. This is an investigation on a warm axisymmetric bulge forming process with die in the non-uniform temperature field. The effectiveness of the non-uniform temperature distribution was confirmed for the AZ31 tube.
On the other hand, the branch protrusion type THF is an asymmetric deformation process and shows more complicated deformation behavior than the axisymmetric bulge forming. It is a similar deformation mode as the deep drawing process in sheet metal forming. Thus, it can be said that the branch protrusion type THF in this non-uniform temperature field has the same forming principle as the local heating/cooling deep drawing method.
The main deformation domain reduces drawing resistance by heating and softening, while the other load-carrying domain is cooled to prevent failure defects including fracture, improving the forming limit and the quality and accuracy of the product. More importantly, the blank material flows through the heating and cooling domains.
Yoshihara et al. [24] adopted the local heating/cooling deep drawing method to improve the deep drawability of AZ31 sheet and achieved a large drawing limit of LDR > 5.
In general, for the warm T-shape THF in the uniform temperature field [4,5], the wall thickness of the blank tube is locally thickened at the place of contact with an axial feeding punch and the bottom on the opposite of protruded branch part. To make the wall thickness distribution of the formed product uniform at the same time, instead of processing under a uniform temperature field, the forming temperature should be kept low at the part where deformation should be suppressed, wall thickness should be suppressed, and the material flow at the other part should be promoted.
Manabe et al. [25,26] investigated the effect of enhancing the hydroforming limit and improving the wall thickness distribution under a non-uniform temperature field by locally heating/cooling warm T-shape forming of an AZ31 magnesium alloy. However, even for the non-uniform temperature field in the previous report [25,26], the above technological issues were not solved enough yet and remain.
The objective of this study is to elucidate the optimum temperature distribution for further improving the formability and wall thickness distribution uniform of magnesium alloy tubes with low hydroformability at room temperature. Therefore, focusing on the non-uniform temperature field in WTHF process, the effect of the temperature distribution in the tooling on the wall thickness distribution of the formed sample is investigated in detail, and the optimum non-uniform temperature field and the optimum loading path for different magnesium materials (AZ31B and AZ61) and forming shapes (T-shape and cross-shape) are examined.

2. Experiments

2.1. Materials

The tubes used in this study were made of AZ31B and AZ61 magnesium alloy with an outer diameter of 42.7 mm and a wall thickness of 1.0 mm, and the test piece for the hydroforming test was 200 mm in length. Table 1 shows the chemical composition of these magnesium alloy tubes. A uniaxial tensile test was carried out using an arc-shaped test piece made by cutting out the tubular material in the longitudinal direction. The tensile test piece used was half the size of JIS 13B. In the tensile test, the test temperature was 20 °C, 100 °C, 150 °C, 200 °C, 250 °C, and 300 °C under 6 conditions, and the tensile speed was 1.5 mm/min, 15 mm/min, and 150 mm/min under 3 conditions (initial strain rate was 0.001 s−1, 0.01 s−1, and 0.1 s−1, respectively). Figure 1 shows the typical stress-strain curves at different temperatures and tensile speeds for AZ31B and AZ61. From these results, the elongation of both materials increases as the temperature rises, and the tensile strength decreases. In addition, although the strain rate dependence is slightly observed as the temperature rises from room temperature, no significant strain rate dependence is observed in the test range, and the temperature dependence is large. Comparing AZ31B and AZ61, AZ61 has a slightly higher strength (deformation resistance) up to about 150 °C, and there is no big difference in elongation.

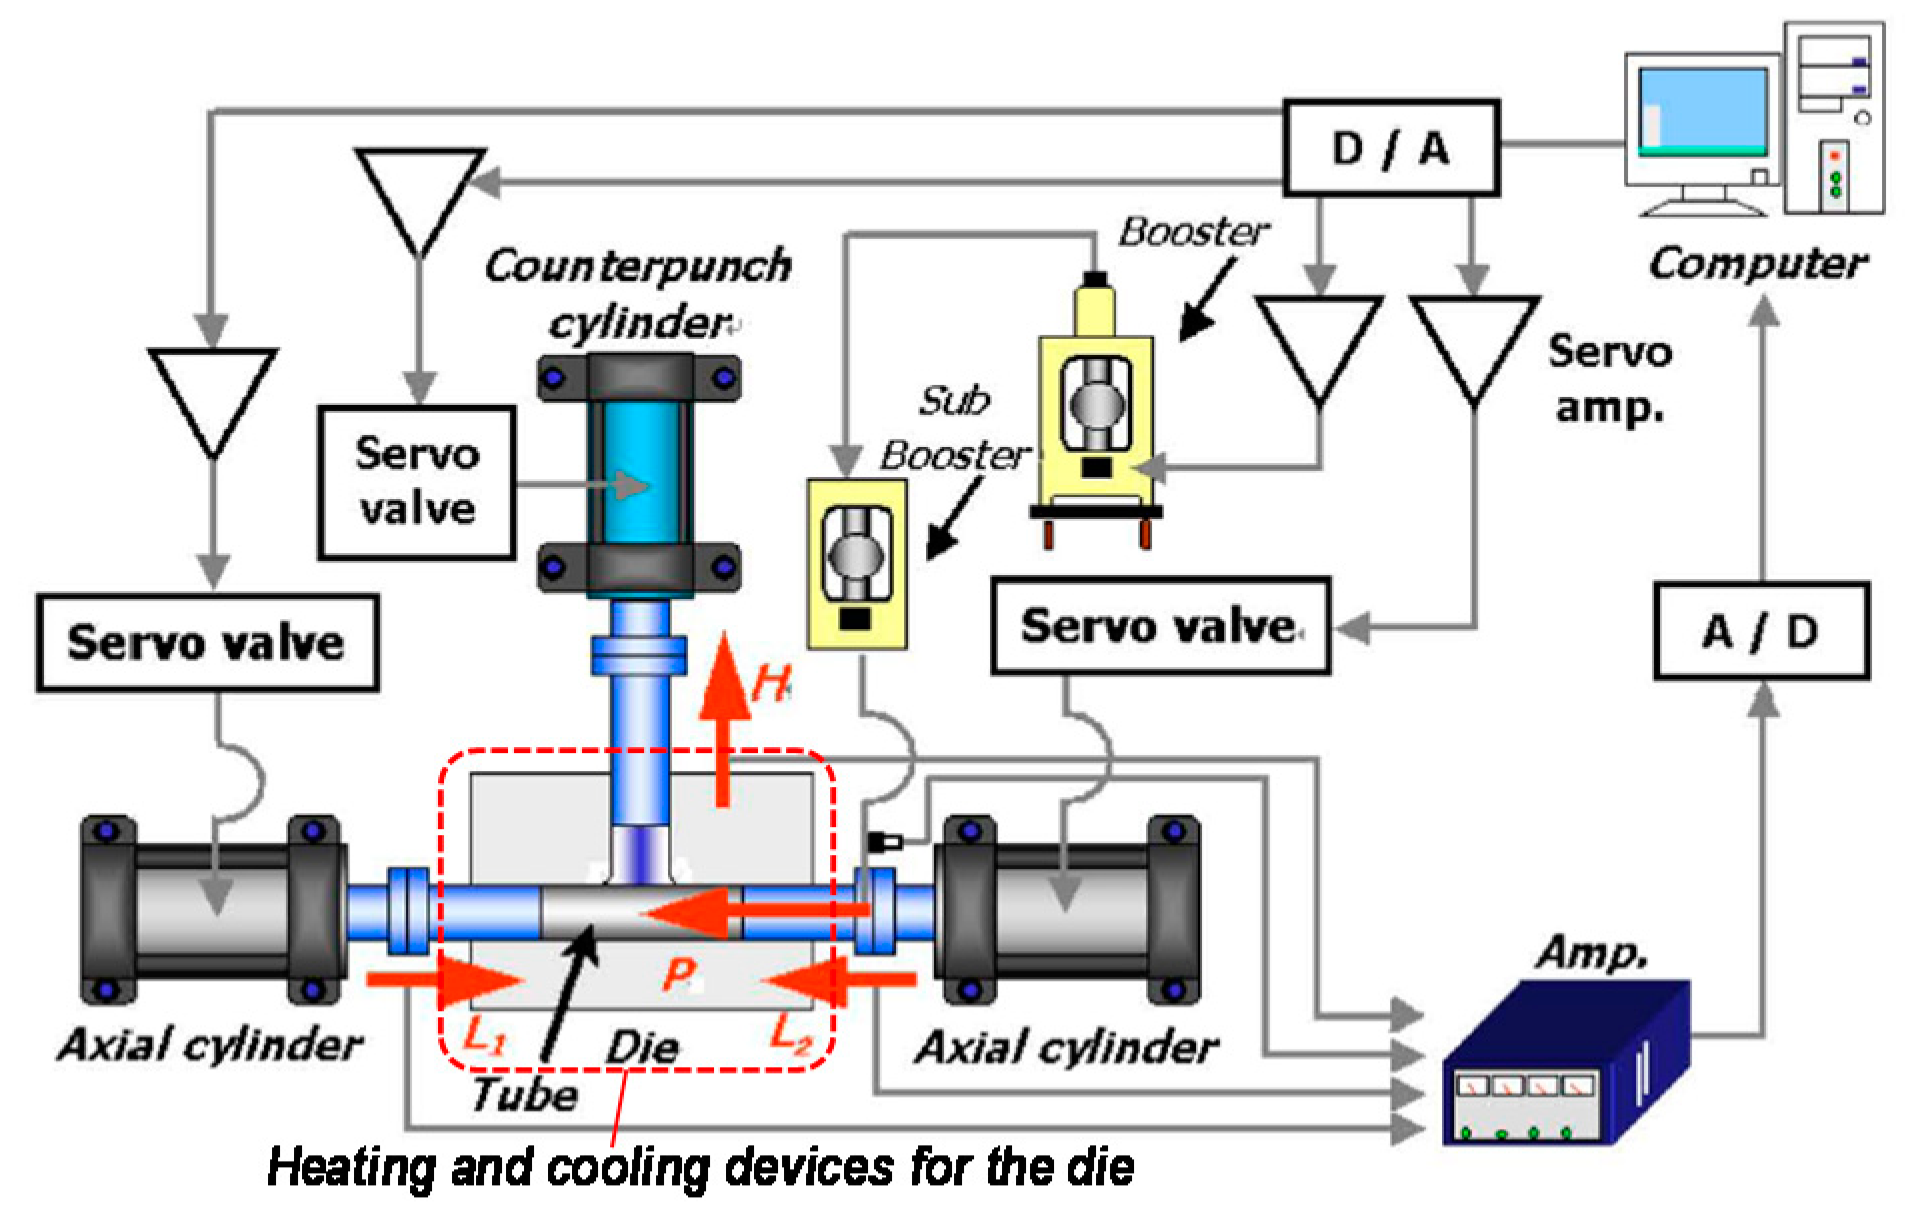
2.2. Experimental Setup and Procedure

Figure 2 and Figure 3 show the schematic illustration of the T-shape forming tooling used in this study and the configuration of the hydraulic circuit and the closed loop control system for the T-shape WTHF process, respectively [2,3,4]. To conduct this experimental work, a new T-shape warm forming machine with a local heating/cooling apparatus for the die was developed. This machine is an improved version of the previously developed equipment [3,4], and it enables controlling the temperature distribution of the die as well. In this testing machine, each cylinder and pressure booster is operated by a command from a computer, and closed-loop control can be performed by sending the measured values of the axial punch displacement and internal pressure from moment to moment to the computer.
Figure 4 shows the appearance of the heating and cooling device. For heating and cooling the die, six through holes are opened for inserting cartridge heaters into the upper and lower dies, and heating for uniform temperature field (Figure 4a) can be performed with a total of 12 cartridge heaters with maximum total output of 11 kW. The forming die was fully covered with the insulator boards.
As the cooling method, we adopted a method of passing compressed air through the four through holes at the upper and lower ends of the heater and a method of cooling by using the heat of vaporization of water mist (Figure 4b). In the case of the water mist cooling, compressed air of about 70 kPa was provided through a larger pipe from a compressor, and a small amount of water was flowed from a tip of a smaller pipe to spray it into a mist for cooling the die (Figure 4c). In addition, there were six other holes on the side of the die for temperature measurement (Figure 4b). A sheath-type K thermocouple was inserted into each hole, and they measured a variation in the temperature distribution during the forming process.
To create a non-uniform temperature field, after heating to 270 °C with all 12 heaters, only the total of eight heaters in the middle continued to be heated, and in the meantime, the cooling devices were attached to the four holes at both ends of the die. After about 30 min, the temperature field became stable. Since the die temperature uniformly shifted down about around 15 °C during the total forming time of about 5 min, the forming experiment started when the temperature at the center reached at around 260 °C to realize the set temperature distribution in the middle of forming process.
The temperature of upper and lower dies was controlled independently using temperature controllers. To confirm uniform temperature distribution over the tubular blank, thermocouples with 0.1 mm diameter are fixed into a groove made on the tube.
Figure 5 shows the typical temperature distributions of the die for T-shape forming realized by using a local heating and cooling system.
The pressure medium was methylphenyl silicone liquid KF-54 (Shin-Etsu Chemical Co., Ltd., Tokyo, Japan), and a dry fluorine lubricant (spray type) was used for the lubrication between the tube and the die.

3. Finite Element Modeling

Finite element (FE) analysis is performed by a thermal-structural coupled dynamic explicit FE commercial code, LS-DYNA ver. 971. (Ansys Inc., Canonsburg, PA, USA). Using a quarter-symmetrical model for T-shape and a one-eighth model for the cross-shape, the tubular blank was divided into two in the wall thickness direction, 60 in the circumferential direction, and 100 in the axial direction. Figure 6 shows the FE model for warm T-shape hydroforming. The material properties obtained from the tensile test in Section 2.1 were employed in the FE analysis. Other input values are the density ρ = 1.78 g/cm3, Poisson’s ratio ν = 0.35, linear expansion coefficient α = 26.5 × 10⁻⁶/K, and specific heat c = 1.05 kJ/kgK.
In the material model considering the temperature dependence, the equivalent stress-equivalent plastic strain relationship was defined by inputting the deformation resistance curve for each temperature, and at the intermediate temperature, the deformation resistance was determined by interpolating each curve. In general, magnesium alloy has a strain rate dependence in the high temperature range. The processing time of this forming experiment, however, was 5 min, and the forming process was performed slowly. In the previously reported FE analysis [2], it was possible to sufficiently predict the detail forming characteristics in the same T-shape forming experiment with a material model that does not consider the strain-rate dependence. Moreover, from the material test results shown in Section 2.2 above, no large strain-rate dependence was observed when the forming temperature conditions and processing time were taken into consideration. Furthermore, under the non-uniform temperature field of 250 °C or less in this study, the region of the formed part where the strain-rate dependence appears changes with time, the temperature conditions there were also different, and the strain-rate dependence was considered to become small. Therefore, we used a material model that did not consider the strain-rate dependence in this study.
The coefficient of friction between the tool and the blank was static friction coefficient μs = 0.02, the kinetic friction coefficient was μd = 0.01, and the heat transfer coefficient was 1400 W/m2K.

4. Results and Discussion

4.1. Process Window in Proportional Loading Path under Uniform Temperature Field and Validation of the FE Modeling

In order to clarify the process window in warm T-shape forming of AZ31B magnesium alloy and the FE modeling validation, WTHF experiments and FE analysis were performed in a proportional loading path under a uniform temperature field. Figure 7 shows the process window for T-shape forming for AZ31B under 250 °C obtained by the experiment and FE analysis. The onset point of “bursting” in the FE analysis was determined as when the wall thickness reduction began to increase rapidly without using any fracture criterion, or when the analysis was stopped. On the other hand, the occurrence of buckling was visually evaluated by visually displaying the deformed shape of the blank tube using the graphic processing of the post processor. It is confirmed that the bursting is predominant under higher internal pressure loading, the buckling is dominant when the axial penetration is predominant, and the successful region between both becomes narrow as the process proceeds.
Figure 8 shows the comparisons of final bulged heights and their shapes at the forming limit between experimental results and FE simulation results in Figure 7. The failure modes in Figure 8a,b are both bursting, as shown in Figure 7, and their formed shapes and bulged heights are in good agreement. Figure 8c,d show different buckling modes, both of which are in good agreement with the experimental and FE analysis results in a uniform temperature field at 250 °C. The results confirmed the validity of this FE model and demonstrated the importance of loading path design using FE analysis.
At the same time, it was confirmed that the loading path has a strong influence on the forming limit. When investigating the effects of temperature fields, the need to determine the appropriate loading paths to avoid bursting and buckling can be understood.

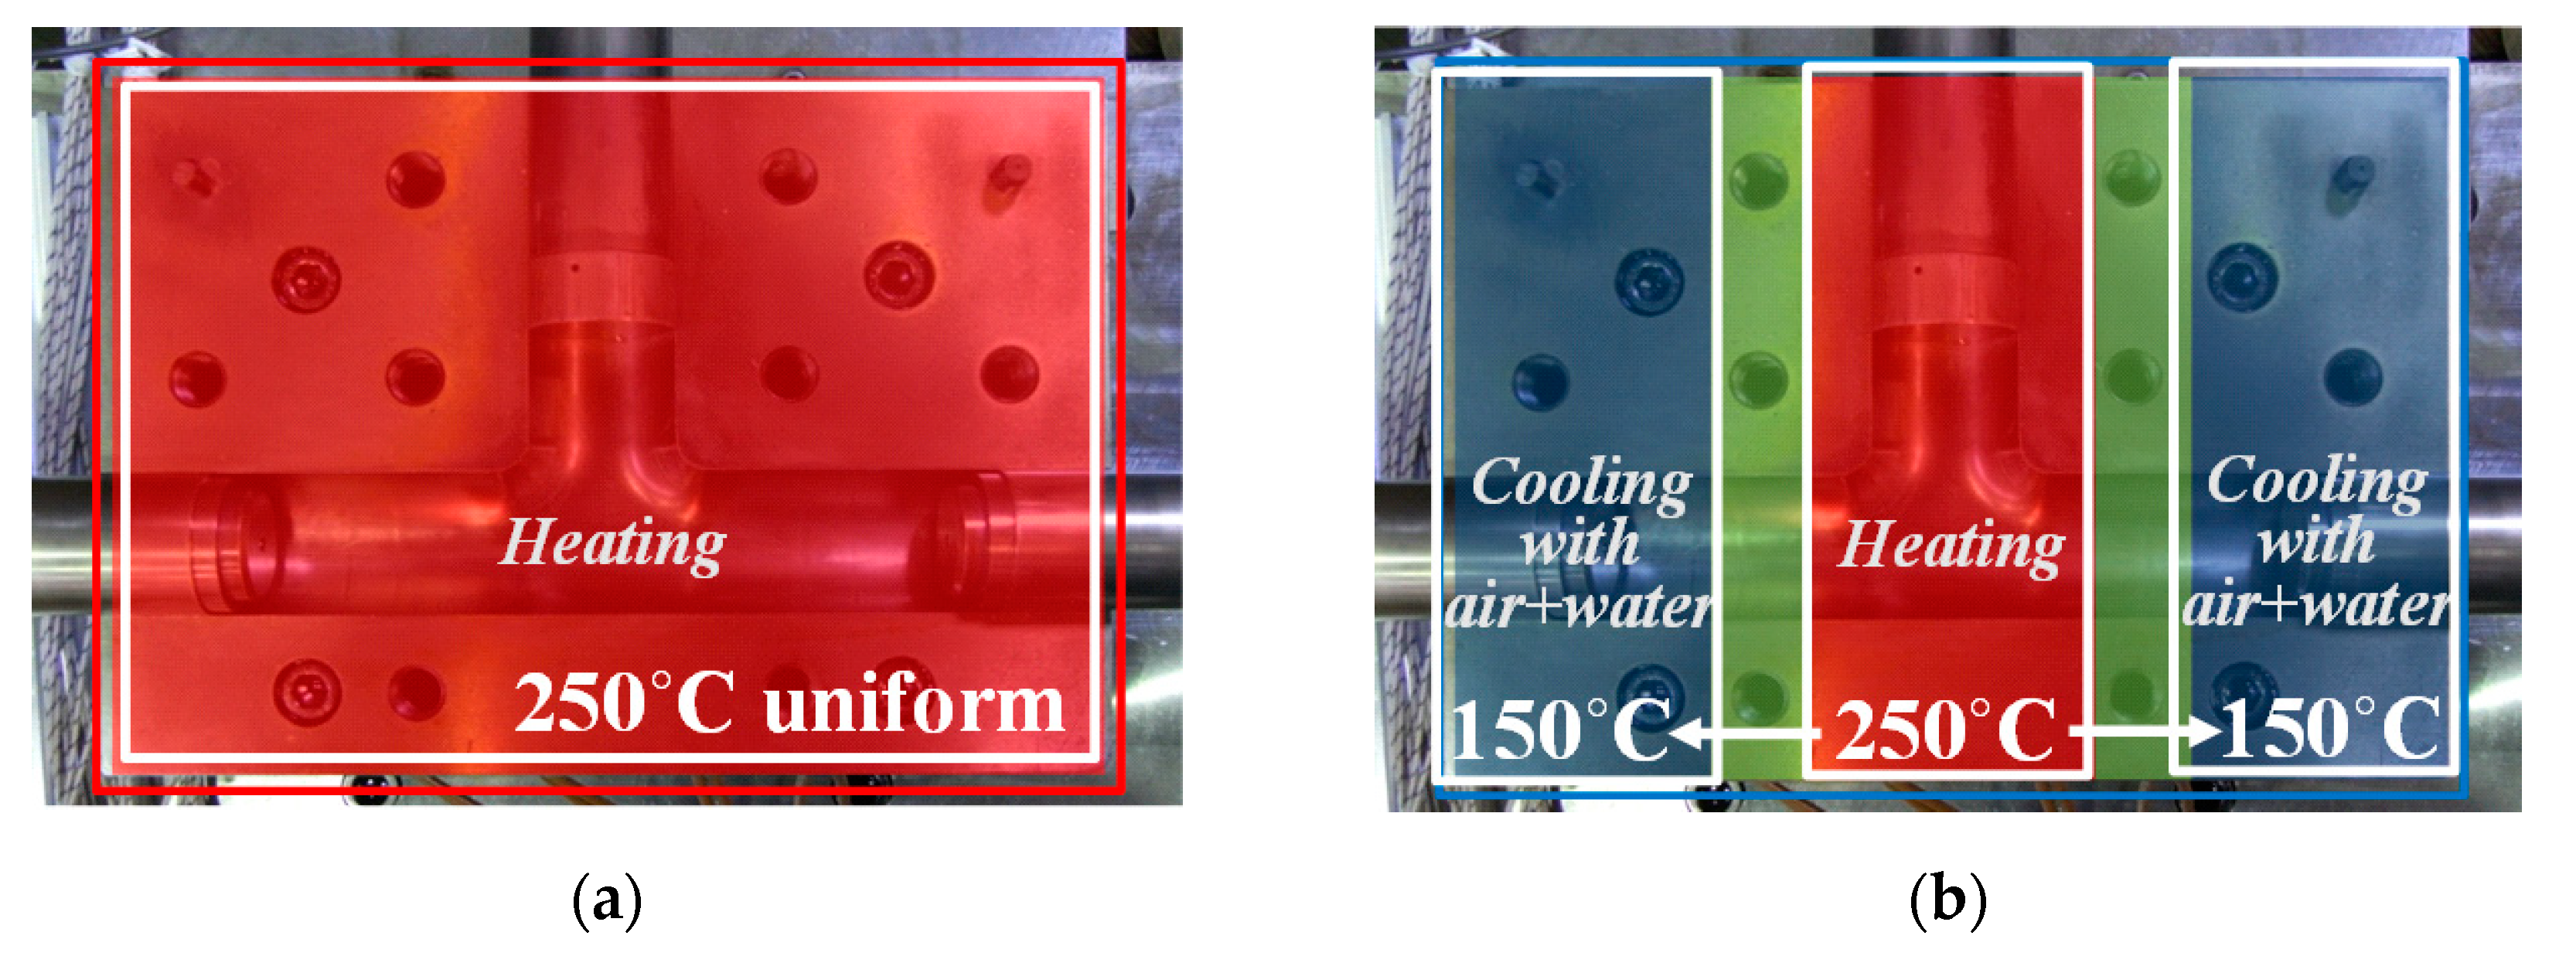
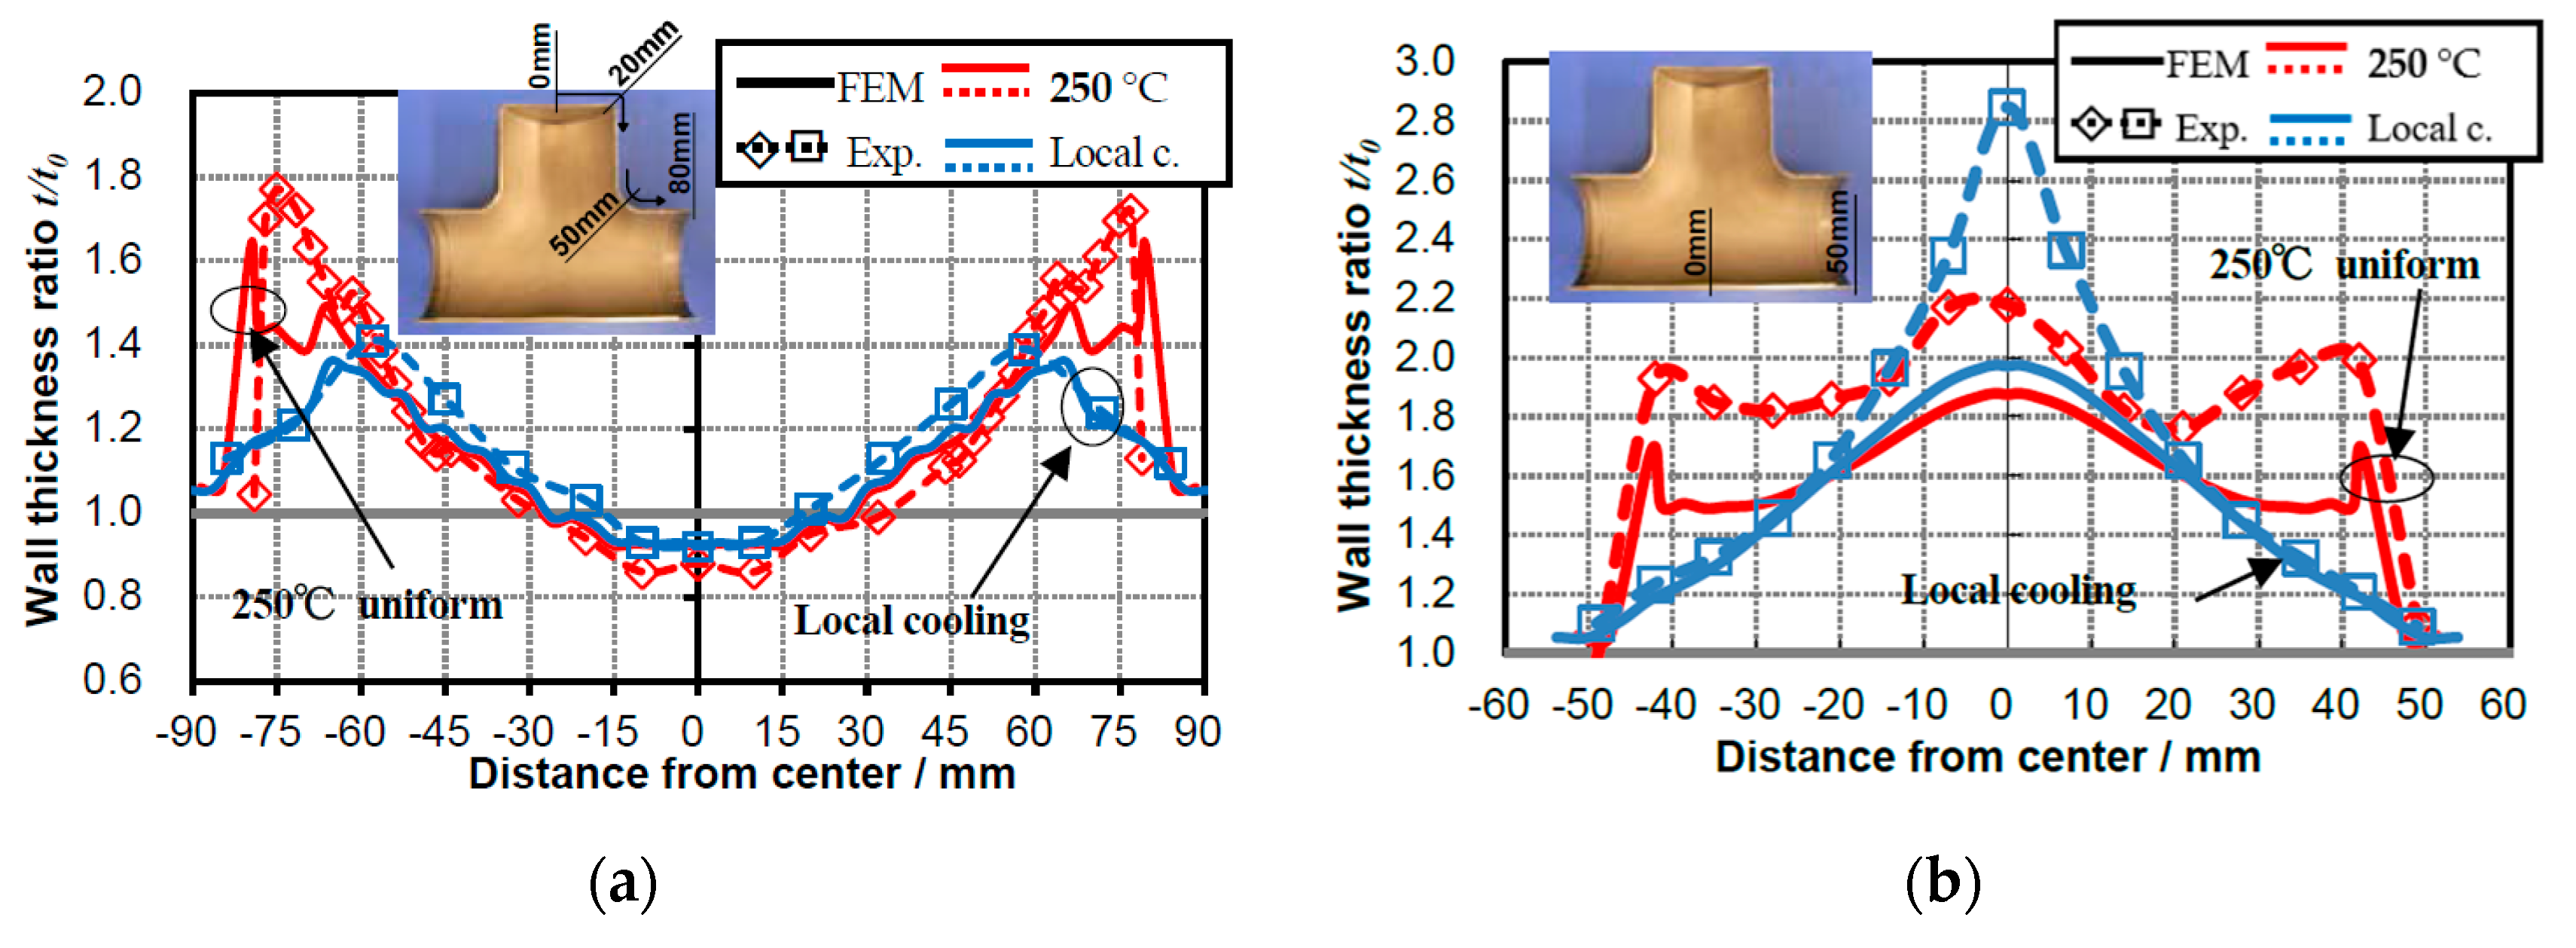
4.2. Effects of Temperature Distribution on Wall Thickness Distribution in Proportional Loading Path under Non-Uniform Temperature Field

The effectiveness of non-uniform temperature distribution for the uniform wall thickness of formed products in the warm T-shape forming process for the AZ31B magnesium alloy tube was reported by a comparison of the FE analysis result by a material model obeying a linear hardening law [4]. In this section, aiming for a more accurate analysis, the effect of the temperature distribution on the wall thickness distribution of formed products is examined by FEM analysis based on the strain hardening characteristics of the material obtained in the tensile test, as described in the previous chapter.
Figure 9 shows the outline of temperature distributions for the die applied for that purpose, one is a uniform temperature field of 250 °C and another is a non-uniform temperature distribution of 250 °C to 150 °C in Figure 5. Figure 10 shows the comparison of experiments and FE analysis results on the wall thickness distribution along the bulged branch side and the bottom side in the T-shape forming under the two different temperature fields shown in Figure 9. Firstly, Figure 10a shows the wall thickness distributions along the bulging branch side of the T-shaped product. The FE analysis results in a uniform temperature field (red solid line) of 250 °C are quantitatively very consistent with the experimental results (red dotted line) except for the seal portions at both ends of the blank tube. As shown in the FE model of Figure 6 above, the shape of the axial punch used in the experiment is stepped to insert into the tube end and seal the internal pressure applied. Therefore, at the ends of the tube where the punch inserts, the deformation shape is constrained. In the non-uniform temperature field (blue line), since this part is a low temperature part at 150 °C, the deformation resistance is larger and the deformation is suppressed and smaller, and it is considered that this region is deformed in the same way as the FE analysis result. On the other hand, in a uniform warm temperature field (red line), both tube-end portions are also easily deformed, so it is considered that a local irregular large deformation occurred near the stepped portion where the punch is inserted. On the other hand, on the bottom side shown in Figure 10b, the experiment and FE analysis results show qualitatively good agreement in a uniform temperature field of 250 °C (red line). In the non-uniform field, both show a good quantitative agreement except for the central part. The T-shape forming process is an asymmetric deformation that shows a complicated deformation behavior and is a difficult deformation target as compared with an axisymmetric bulge deformation. Due to the asymmetry, the tube material also can flow significantly in the circumferential direction even at the bottom, as shown in Figure 10b during the forming process, and the other parts also flow in the circumferential direction accordingly. The difference between the analysis of the wall thickness distribution in Figure 10b and the experiment is considered to be due to this difference in material flow in the circumferential direction. There are various possible reasons for this difference, such as processing conditions and material-side factors, but the major problem is that the stress-strain relationship in the large strain range has not been experimentally obtained for the material properties. Additionally, in the result of this experiment in Figure 10b, the wall thickness strain in the central part reached about 1.0 in true strain. However, its relationship over a large strain range cannot currently be determined by material testing, and it is presumed that extrapolation to this large strain range is also one of the major reasons.
Consequently, the FE analysis is in good agreement with the experimental results. From this, it can be said that the analysis accuracy is improved by approximating the material model to multiple points according to the actual work hardening characteristics. The validity of this FE model for the evaluation of the wall thickness distribution is confirmed.

4.3. Determination and Its Validation of Optimum Loading Path for Improving Formability and Bulged Shape in Warm T-shape Forming Process under Uniform Temperature Field

In THF, the loading path has a great influence on hydro-formability, forming shape, wall thickness distribution, and so on. In the actual forming process, so far the optimum loading path of the internal pressure and axial feeding is empirically determined. In our previous study [27], the optimum loading path using a fuzzy model was predicted and confirmed. Here, firstly the optimum loading path for improving bulged shape and bulged height is investigated, and the obtained loading path is used to clarify the optimum temperature conditions for the non-uniform temperature field.
The final internal pressure pf in the T-shape forming process is given from the following empirical formula [28].
P f = k 2 t 0 σ y D 0
Here, t0 is the wall thickness, σy is the yield stress, D0 is the outer diameter of the bulging part, k is the experimental constant, and 4.7 is used for T-shape forming. By substituting the dimensions and material properties of the magnesium alloy tube at 250 °C into the above equation, pf = 10 MPa was determined.
The axial penetration and the counter punch displacements during the forming process were determined every moment by the same fuzzy inference model in the previous report [27]. Basically, the following typical evaluation functions were employed for evaluating the wavy buckling and the contact length with the counter punch with increasing the internal pressure during the process.
Figure 11 shows the evaluation functions used in the fuzzy inference model for T-shape forming. Figure 11a shows an evaluation function Φ defined as an index for evaluating the risk of wavy buckling in order to suppress the occurrence of the buckling deformation near the die inlet shoulder part during free bulge deformation at the initial forming stage. Rmax on the right side of the equation of the evaluation function Φ in the figure is the maximum bulged height near the die inlet shoulder part, and Rmin is the minimum bulged height near there.
Since the decrease in wall thickness of the bulged part can be suppressed by aggressively feeding the axial punch from the contact of the material with the counter punch to the latter stage of the forming process, the evaluation function Ψ of the contact length with the counter punch is defined as an index for evaluating the risk of the forming failure.
Cl on the right side of the equation of the evaluation function Ψ in Figure 11b is the contact length with counter punch, and Cref is the assumed reference contact length in which the contact length with counter punch increases in proportion to the bulge height.
Input and output variables for fuzzy rules were fuzzified so that the input variables Φ, Φ’ (differential value of Φ), and Ψ, Ψ’ (differential value of Ψ) are “Small” and “Large”, and the output variables were ruled for the axial punch displacement increment ∆APS and the counter punch displacement increment ∆CPS.
As an example of the membership functions that determines the output variables, Figure 12 shows the membership functions for the evaluation function Φ that represents the risk of wavy buckling at the initial stage of forming process. The input and output membership functions (∆APS and ∆CPS) at the main forming stage are similarly ruled.
Fuzzy inference was performed based on the membership functions for each forming stage, and the output value for each forming stage by defuzzification was determined by the centroid method.
The two output variables, ∆APS and ∆CPS, are sequentially determined during the process to maintain an appropriate contact state.
Figure 13 shows a comparison between the loading path at 250 °C assumed from the authors’ past experience and the loading path obtained by the fuzzy inference model. From the comparison of the two, the p of the fuzzy inference result in the loading path is larger than the p of the assumed path after the point A. As a result, in the ∆H-∆L curve for the counter punch, the fuzzy inference model early reaches the maximum setting bulge height of ∆H = 30 mm (point B). Therefore, in the assumed loading path, an axial feeding displacement of ∆L = about 50 mm was required to obtain the final shape, but in the loading path obtained by the fuzzy inference model, the final shape can be obtained by feeding the axial punch to ∆L = about 45 mm (point C). It can be said that efficient forming process can be performed by deriving the loading path using a fuzzy model system.
A T-shape forming experiment was conducted to verify the validity. Figure 14 shows a comparison of the final shape and dimensions with the FE analysis results. Quantitatively good agreements are found on the shape, bulge height, and axial length, demonstrating the effectiveness of the loading path determination by this system.

4.4. Optimum Temperature Distribution for Improving Wall Thicknes Distribution in Warm T-Shape Forming Process Using the Optimum Loading Path under Non-Uniform Temperature Field

Since the loading path affecting hydro-formability was optimized in the previous section, the optimum temperature distribution under the no-uniform temperature field will be examined in that loading path condition.

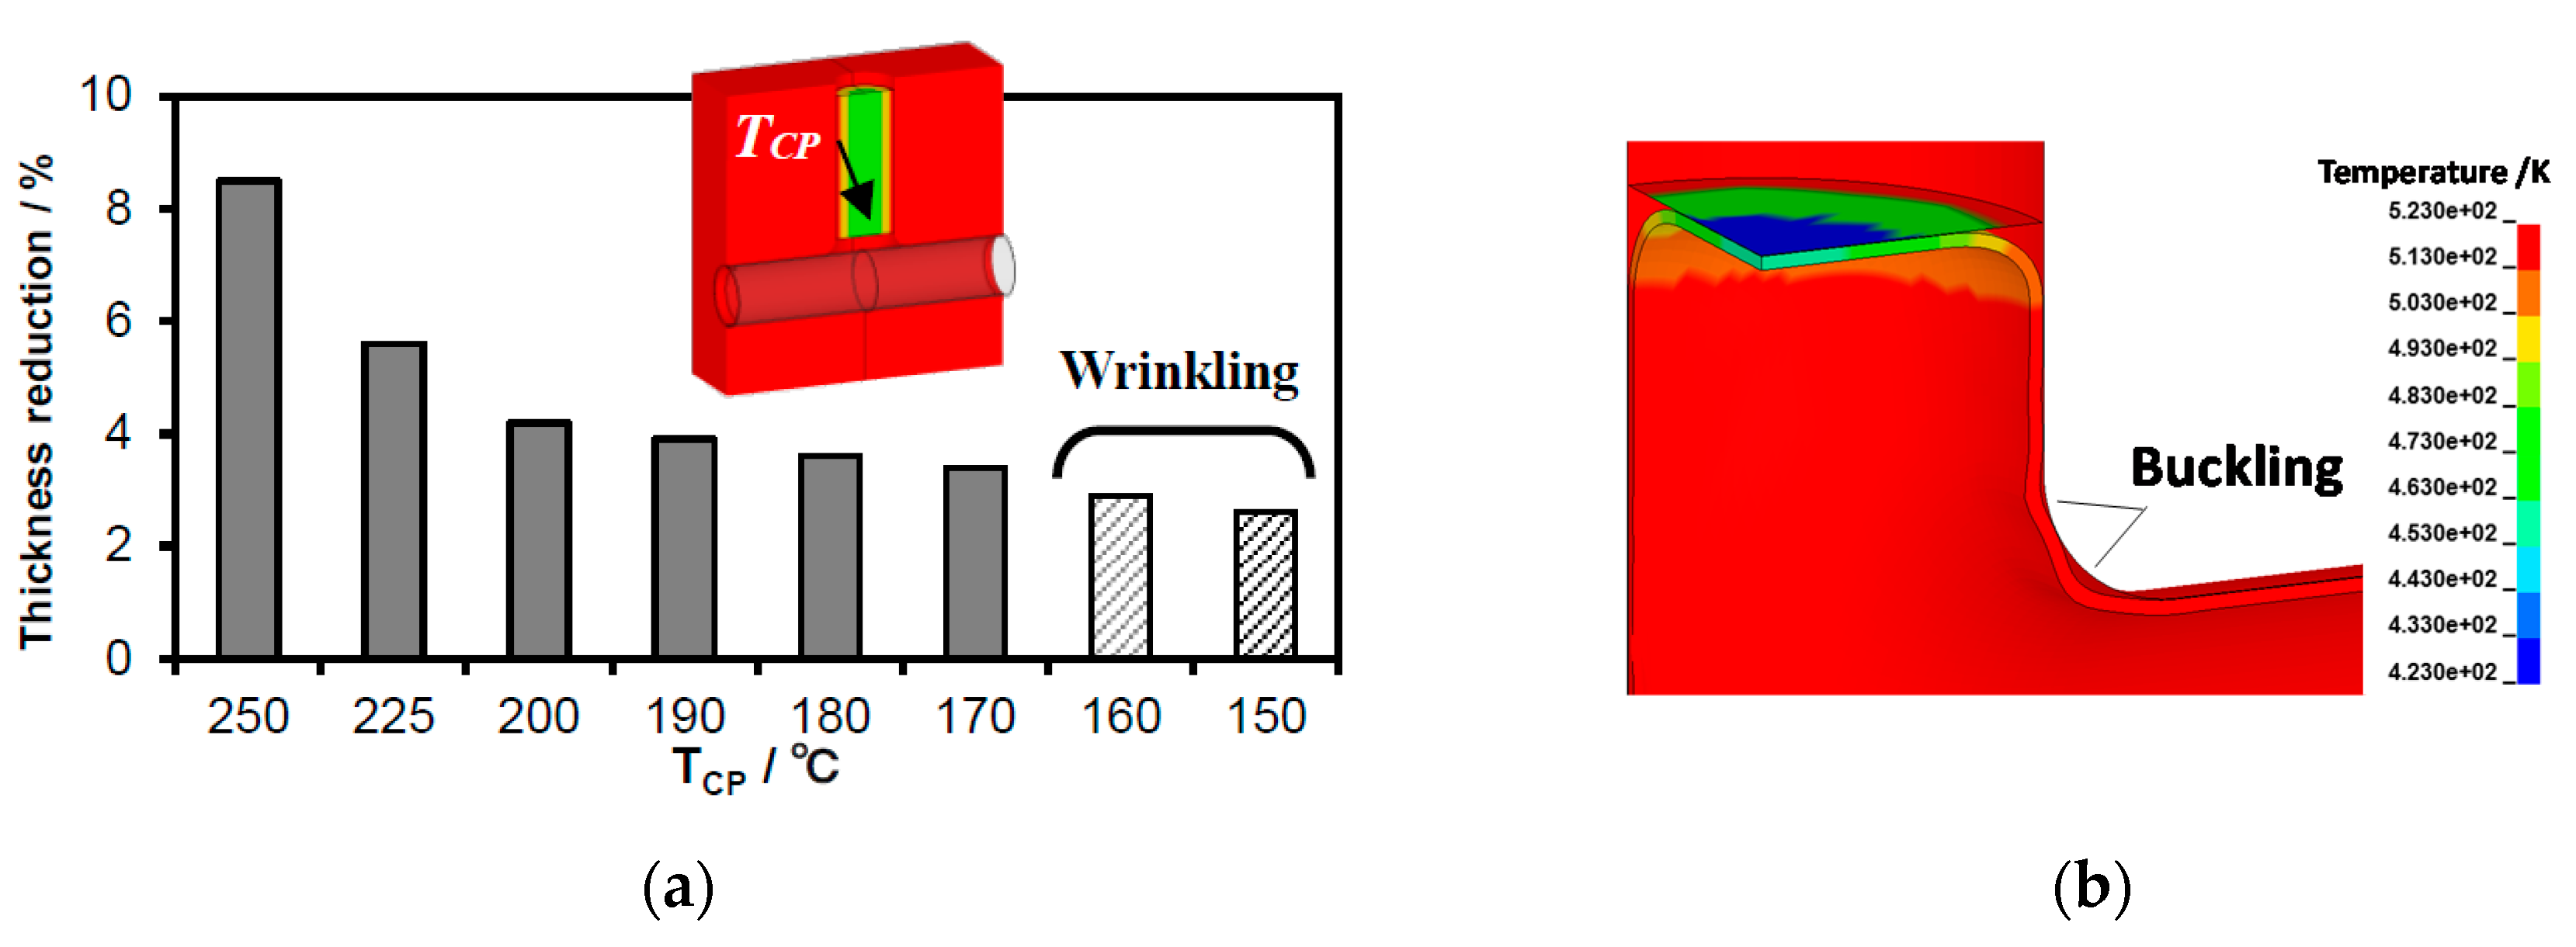
4.4.1. Effect of Temperature of Counter Punch on Thinning Behavior of the Bulged Part under Non-Uniform Temperature Field

In the bulging part including a bulge head, wall thinning occurs due to the internal pressure applied, but it is thought that this can be suppressed by cooling the counter punch and increasing the deformation resistance. Figure 15 shows the effect of the temperature TCP at the center of the counter punch on the wall thinning rate of the bulging part. It can be seen that the wall thinning of the bulging part can be suppressed by reducing TCP. However, since buckling/wrinkling in Figure 15b occurred near the die side and die shoulder part at a temperature of 160 °C or less, it is considered that there is an appropriate temperature range that suppresses wall thinning without causing forming defects, and TCP in T-shape forming of AZ31B. It is suggested that the optimum temperature of the counter punch is 170 °C.

4.4.2. Effect of Temperature of Die Bottom on Wall Thickness Distribution under Non-Uniform Temperature Field

In order to make the wall thickness distribution on the bulging side and its bottom side uniform at the same time, the authors will consider the case of further cooling to the bottom center. For the purpose, the temperature on the straight tube ends side is set to 150 °C, and also the central part on the bottom side is locally cooled to provide a temperature distribution to the central part of the die in the circumferential direction. In this case, in order to quantitatively evaluate the uniformity of the wall thickness distribution and determine the optimum temperature conditions, the root mean square of the bottom wall thickness distribution in each Tbottom, tRMS, was calculated by the following formula,
t RMS = 1 / N i = 1 N t i 2
Figure 16 shows the effect of the bottom center temperature Tbottom on the uniformity of the wall thickness distribution. In this figure, a comparison based on the tRMS is performed. It can be seen that the uniformity of the wall thickness distribution is improved by decreasing the Tbottom. On the other hand, the buckling shown in Figure 16b was confirmed in the bulging part when the temperature of Tbottom was 120 °C or less, so it is possible that there is an appropriate temperature condition for Tbottom to make the wall thickness distribution uniform without causing forming defects. It is suggested that the optimum temperature of Tbottom in T-shape forming of AZ31B is 130 °C. By the way, the difference in the tRMS between the “250 uniform” and the Tbottom “250” in Figure 16 is caused by the temperature distribution of the die. When Tbottom = 250 °C, there is still a temperature distribution of the die in the axial direction of the tube, and the part where the temperature on the tube end side remains low. Due to the influence of the non-uniform temperature field, there is a difference in tRMS from the “250 uniform” for the uniform temperature field.
From the above results, by creating a complex non-uniform temperature field lowering not only the die temperature in the direction of the tube axis but also to 130 °C to the opposite bottom of the bulge branch, it is found that the wall thickness distribution of the entire T-shaped product is further improved compared to under the uniform temperature field. For the T-shape forming of AZ31B, the optimized temperature conditions for the uniformity of the wall thickness of the formed product may be as shown in Figure 17.

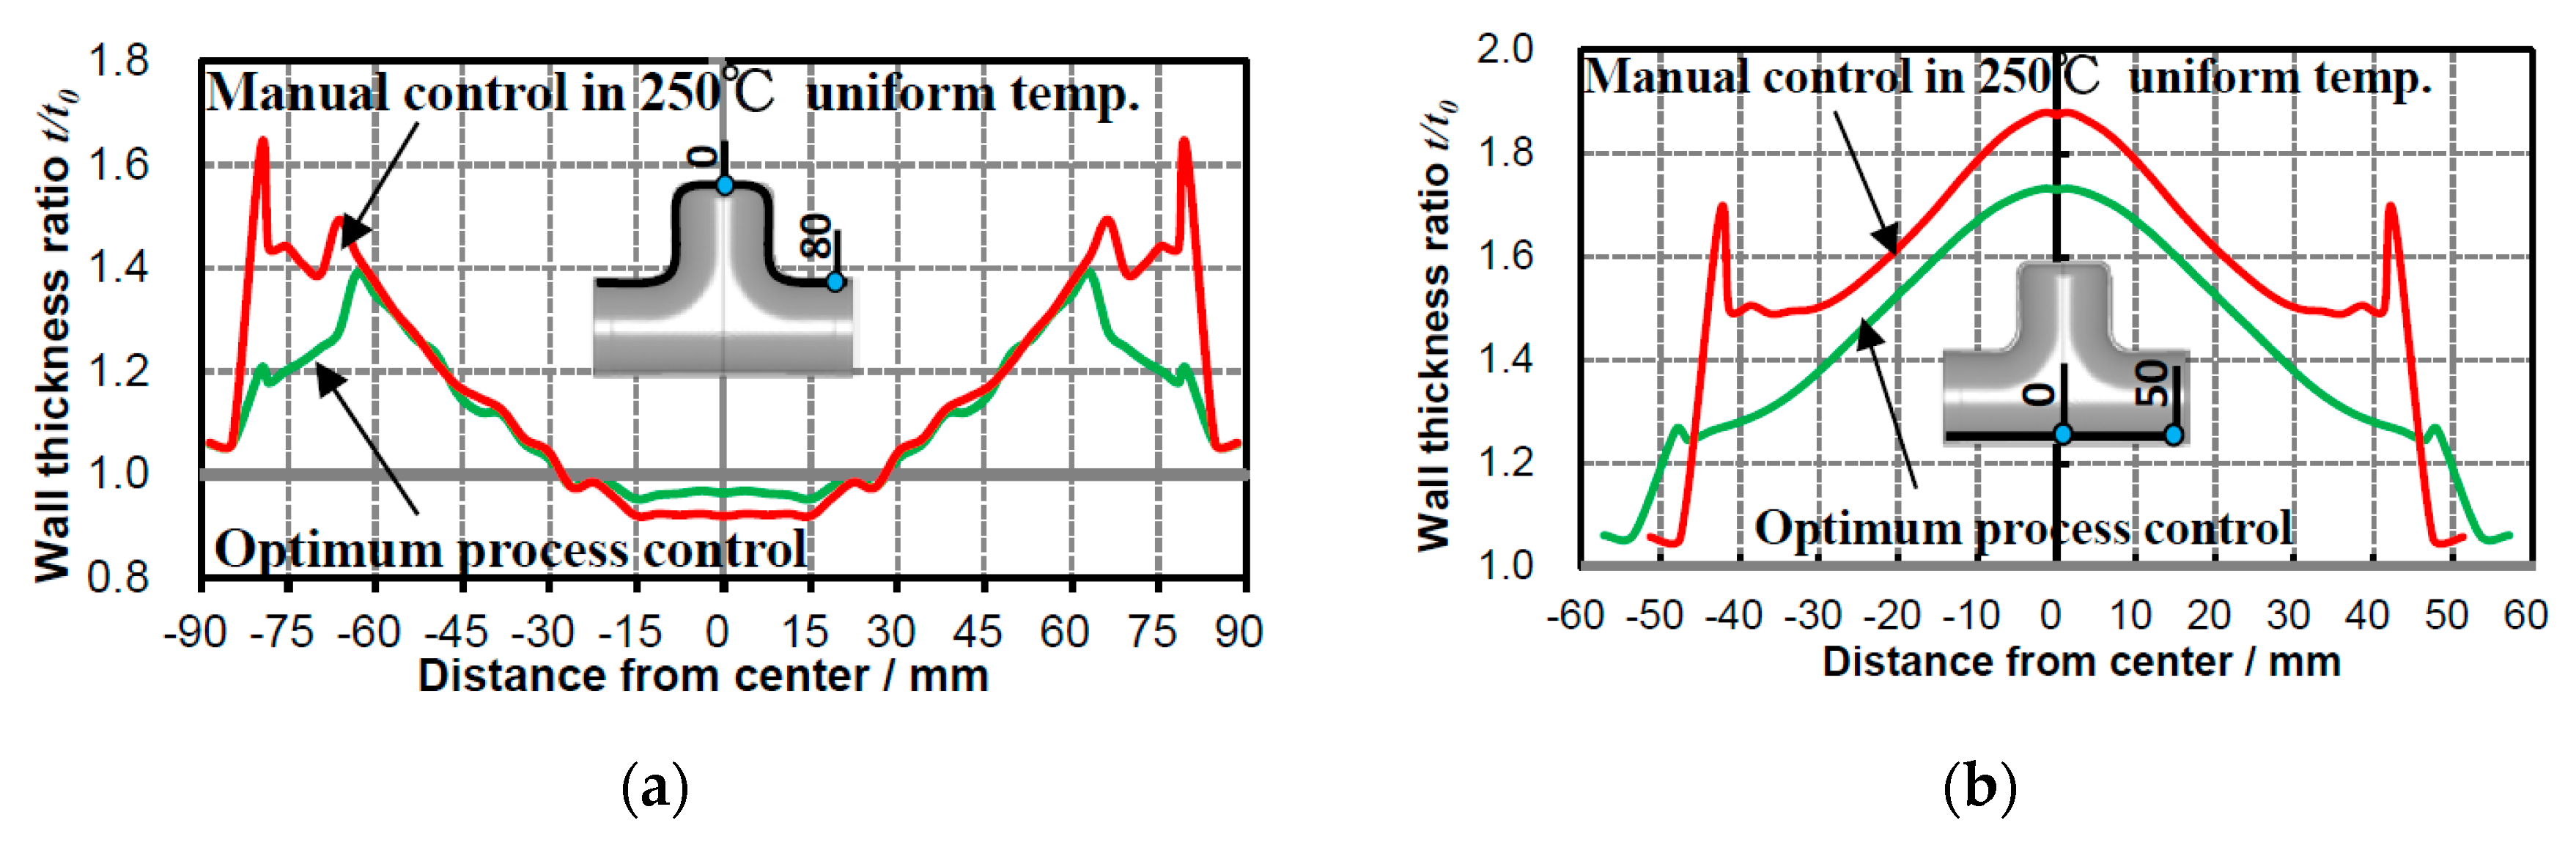
4.5. Wall Distribuntion in the Optimum Loading Path under Optimum Temperature Distribution

Figure 18 shows a comparison of the wall thickness distribution of the obtained formed product between the results of the conventional manual loading path and the optimum loading path. From these figures, it can be seen that a formed product having a more uniform wall thickness distribution is obtained on both the bulging side and the bottom side. It is shown that it is possible to determine appropriate processing conditions for making the formed product uniform by performing the optimum process path in the hydroforming of the T-shaped sample of the AZ31B magnesium alloy tube.

4.6. Application of the Optimization Methods to AZ61 Alloy Tube and Cross-Shape Forming

Up to the previous section, the authors optimized the temperature distribution and loading path in a non-uniform temperature field and demonstrated numerically the possibility of uniform wall thickness distribution and improvement of formed shape and accuracy. Thereby, in this section, the authors will investigate and compare the case where this method is applied to the AZ61 tube of higher strength magnesium alloy and the case where it is applied to cross-shape forming as a forming shape other than T-shape forming. For cross-shape forming, the forming shape is different from T-shape forming; a new fuzzy model for cross-shape forming was created, and the various fuzzy parameters were modified accordingly.

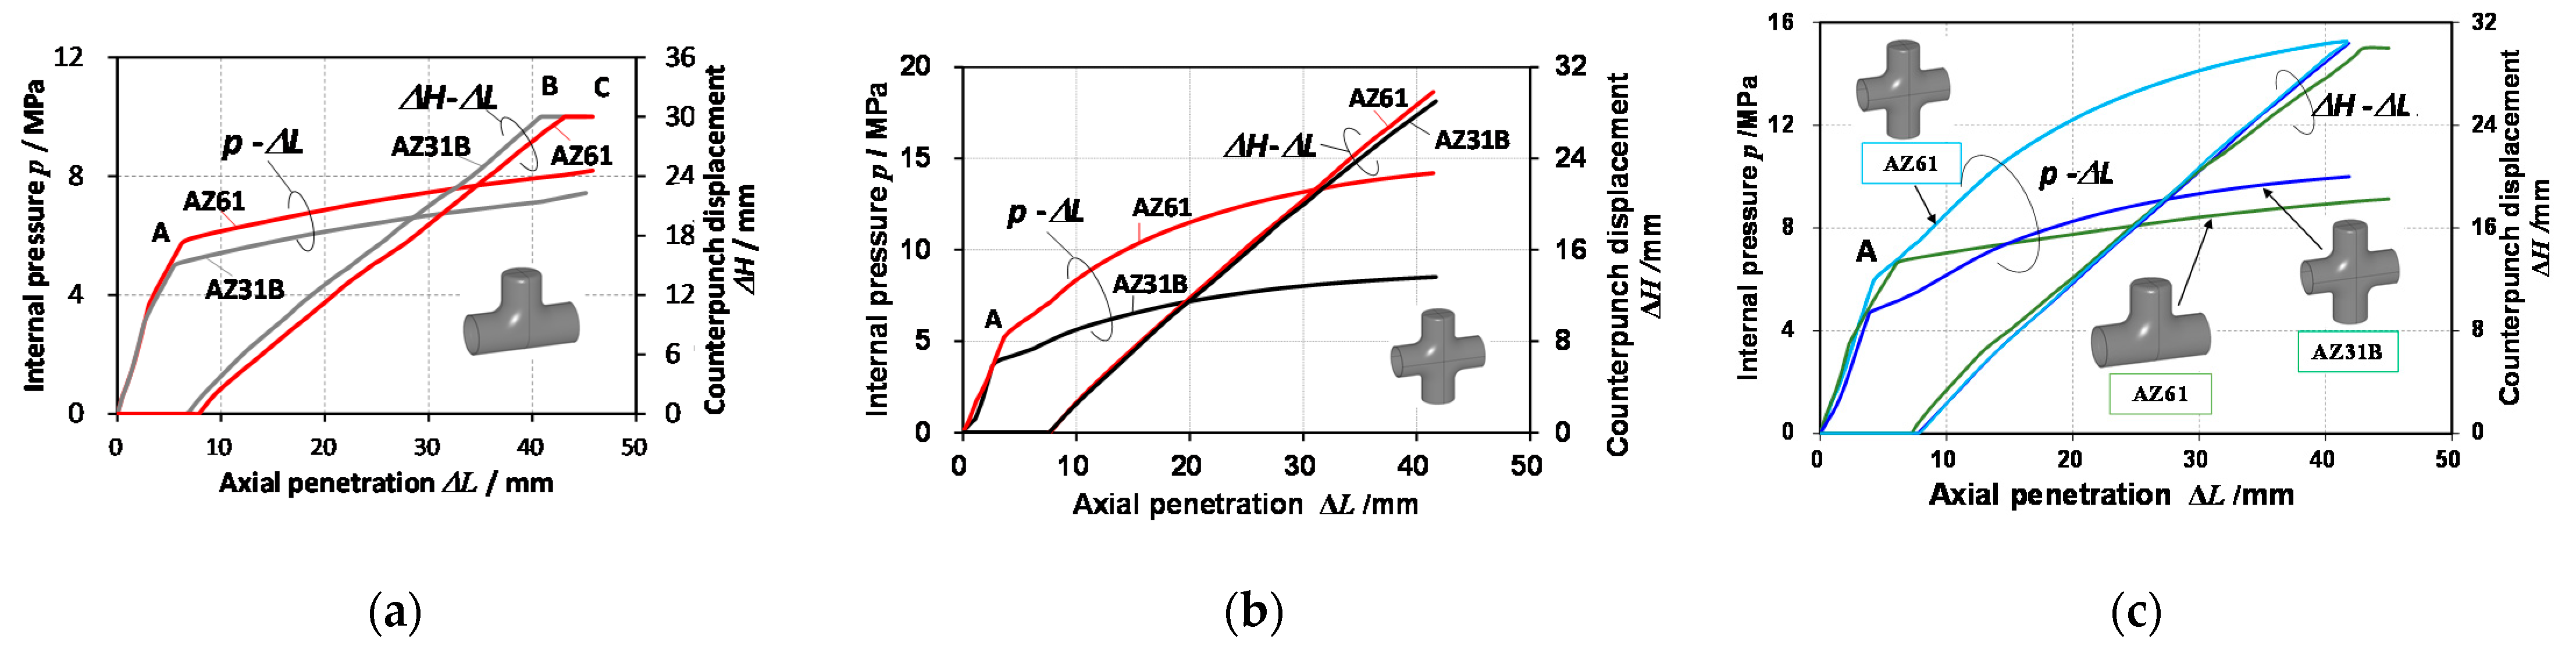
4.6.1. Optimum Loading Path for Different Materials and Formed Shapes

Figure 19 shows the comparison of optimum loading path for T-shape forming and cross-shape forming of AZ31B and AZ61 at 250 °C. Figure 19a shows the effect of the different strength between AZ31B and AZ61 on the optimum loading path in T-shape forming. At the initial stage of the p-∆L curve, the axial punch is feeding at the same time, while the p is applied in order to suppress the thinning of the bulge apex during free bulge deformation, and the p-∆L curve increases almost linearly. On the other hand, in the ∆H-∆L curve for the counter punch, the punch keeps stopping at the initial position of ∆ho = 10 mm until the blank tube contacts the counter punch. After that, the counter punch starts to move behind the feeding of the axial punch. The counter punch moves almost proportionally as the bulge deformation progresses and stops when it reaches the set maximum bulge height (point B), and in that state, the axial punch feeding is further progressing to the point C in order to attain more uniform wall thickness and improvement of the die filling rate and the dimension accuracy of the product.
Regarding the effect of the material on the p-∆L curve, the strength of AZ61 is higher than that of AZ31B, so the p at point A increases corresponding to the increase in strength. The required p is high while being maintained even after the point A. On the other hand, in the ∆H-∆L curve, the effect of the difference in material strength is that the position of the axial punch at which the counter punch starts to move is slightly delayed in AZ61, and then it is almost the same as in AZ31B.
Figure 19b shows the effect of the difference between AZ31B and AZ61 on the optimum loading path in cross-shape forming. The p-∆L curve of the cross-shape forming is significantly different in shape from the T-shape forming in Figure 19a. For T-shape forming, it is represented by two straight lines at point A, but for cross-shape forming, the latter half forming region is dominant except for the initial stage of forming, and the p increases in an upwardly convex quadratic curve. The effects of AZ31B and AZ61 on this quadratic p-∆L curve are similar to those in Figure 19a at the early stage of the process. In the dominant latter half, the effect of the strength difference expands as the forming progresses. It can be seen that the high-strength AZ61 requires about 1.5 times higher internal pressure. On the other hand, in cross-shape forming, the ∆H-∆L curve shows almost no difference between AZ31B and AZ61.
By the way, the effects of T-shape forming and cross-forming on the p-∆L curves, which have different forming shapes, can be clearly seen from the result of AZ61 in Figure 19c, which expresses the vertical axis on the same scale. At the early stage of forming process, there is a slight difference in the p-∆L curve between the two, but there is a slight difference in the p value at point A. It can be seen that the increase in the p is large for the cross-shape forming, and it requires nearly 1.8 as much as in the latter half of T-shape forming. Meanwhile, the ∆H-∆L curve does not differ depending on the forming shape.
Until now, the loading path has been determined by experience and trial and error, but it is expected that this method will be applied to the optimization of processing conditions and the process control.

4.6.2. Optimum Temperature Distribution for Different Forming Shapes

By applying the optimization method for T-shape forming of AZ31B described above, optimization of the non-uniform temperature field was performed for AZ61 tube and cross-shape forming by the same FE analysis. In T-shape forming for AZ61 tube, buckling occurred at the bulged head area when the temperature of Tbottom was 140 °C or lower. The difference in deformation behavior between AZ31B and AZ61 is considered to be due to the deformation resistance of both. The difference in deformation resistance between the two is not large in the high temperature range of 200 °C or higher, but the difference is large in the temperature range of 150 °C or lower. Therefore, in the WTHF of AZ61, it is considered that it becomes difficult to form the bulging part by reducing the temperature Tbottom at the center of the bottom. From these results, it can be said that the optimum temperature of Tbottom, which makes the bottom wall thickness distribution uniform in T-shape forming of AZ61 magnesium alloy, is 150 °C.
In cross-shape forming, the wall thinning of the bulging part can be suppressed by lowering the temperature TCP at the center of the counter punch, but wrinkles occur near the die shoulder by reducing the temperature. The temperature condition at which wrinkles began to occur was TCP < 200 °C for both AZ31B and AZ61. By setting TCP = 200 °C, it is possible to suppress the wall thinning of the bulging part by about 50% compared to the case of uniform temperature field, and the effect of suppressing the wall thinning by cooling the counter punch was confirmed in cross-shape forming for AZ61 as well as for AZ31B.
Figure 20 shows the optimum temperature distribution for T-shape forming of AZ61 and for cross-shape forming of both magnesium alloy tubes. For T-shape forming of AZ61 in Figure 20a, the optimum temperature distribution is different from that of AZ31B in Figure 18. The bottom temperature for AZ61 is 150 °C and 20 °C higher than that of AZ31B. On the other hand, for cross-shape forming shown in Figure 20b, in the cross-shape forming of AZ31B and AZ61, the optimum temperature distribution was the same. It was shown that the die was 250 °C and the counter punch was 200 °C, and for the temperature distribution cooling, only the bulge head was sufficient.

5. Conclusions

In this study, local heating/cooling in the warm T-shape and cross-shape forming processes was carried out for the AZ31B and AZ61 magnesium alloy tube, which is a hard-to-form material at room temperature, to improve the formability, wall thickness distribution, and formed shape accuracy. For this purpose, a new local heating and cooling apparatus was developed and adopted to achieve a high wall-thickness quality of the hydroformed T-shape and cross-shape products. Under experimental constraints with a forming time of 5 min at 250 °C or below, optimization of temperature distribution and loading path during process using fuzzy inference model previously developed by the authors was attempted. As a result, firstly, it was verified that the local heating/cooling approach to creating a non-uniform temperature field is more effective in the hydroforming process for the hard-to-form materials and enhancing the formability and making wall thickness uniform than that under a uniform temperature field. In addition, optimum symmetric and asymmetric temperature distributions for the T-shape and cross-shape forming of tubes were shown. Its effectiveness is considered to be confirmed under other conditions from the verification results obtained by the experiment and FE simulation for the T-shape forming of AZ31B.
It was suggested that the loading path and temperature distribution have important effects on the WTHF process and that these optimizations are necessary to achieve optimum process design and process control.
The influence of the loading path and the temperature condition on each other is not large, and both the optimizations can be realized independently.

Author Contributions

Conceptualization, K.-I.M.; formal analysis, T.M.; investigation, T.M.; validation, T.M.; writing—original draft preparation, T.M.; writing—review and editing, K.-I.M.; supervision, K.-I.M. All authors have read and agreed to the published version of the manuscript.

Funding

This research received no external funding.

Data Availability Statement

Not applicable.

Acknowledgments

The authors sincerely express our thanks to Tsutomu Murai and Humiyuki Nakagawa of Sankyo Tateyama Aluminum Ltd. For providing the test materials, Ryouden Kasei Ltd. for providing the thermal insulation boards, and Tetsuya Yagami and Masamitsu Suetake for their invaluable advice.

Conflicts of Interest

The authors declare no conflict of interest.

References

  1. Yoshihara, S.; Mac Donald, B.; Hasegawa, T.; Kawahara, M.; Yamamoto, H. Design improvement of spin forming of magnesium alloy tubes using finite element. J. Mater. Process. Technol. 2004, 153–154, 816–820. [Google Scholar] [CrossRef]
  2. Murata, M.; Kuboki, T.; Murai, T. Compression spinning of circular magnesium tube using heated roller. J. Mater. Process. Technol. 2005, 162, 540–545. [Google Scholar] [CrossRef]
  3. Okamoto, A.; Naoi, H.; Kuwahara, Y. Study on Hot Bulge Forming for Tees of Magnesium Alloy Pipe Joints. In Proceedings of the TUBEHYDRO 2007 (Tube Hydroforming Technology), Harbin, China, 4–5 June 2007; pp. 121–128. [Google Scholar]
  4. Manabe, K.; Fujita, K.; Tada, K. Experimental and Numerical Study on Warm Hydroforming for T-shape Joint of AZ31 Magnesium Alloy. J. Chin. Soc. Mech. Eng. 2010, 31, 284–287. [Google Scholar]
  5. Manabe, K.; Ogawa, Y.; Fujita, K.; Tada, K. Wall thickness distribution in Warm hydroforming process for AZ31 Magnesium Alloy Tube. In Proceedings of the International Conference on Materials Processing Technology, Bangkok, Thailand, 5–6 January 2010; pp. 60–63. [Google Scholar]
  6. Hwang, Y.M.; Wang, K.H. Study on y-shape tube hydroforming of magnesium alloys at elevated temperatures. Int. J. Mater. Form. 2010, 3, 175–178. [Google Scholar] [CrossRef]
  7. He, Z.; Yuan, S.; Liu, G.; Wu, J.; Cha, W. Formability testing of AZ31B magnesium alloy tube at elevated temperature. J. Mater. Process. Technol. 2010, 210, 877–884. [Google Scholar] [CrossRef]
  8. Furushima, T.; Ikeda, T.; Manabe, K. Deformation and Heat Transfer Analysis for High Speed Dieless Drawing of AZ31 Magnesium Alloy Tubes. Adv. Mater. Res. 2012, 418–420, 1036–1039. [Google Scholar] [CrossRef]
  9. Furushima, T.; Manabe, K. Workability of AZ31 Magnesium Alloy Tubes in Dieless Drawing Process. Steel Res. Int. 2012, 851–854. [Google Scholar]
  10. Du, P.; Furusawa, S.; Furushima, T. Microstructure and performance of biodegradable magnesium alloy tubes fabricated by local-heating-assisted dieless drawing. J. Magnes. Alloys 2020, 8, 614–623. [Google Scholar] [CrossRef]
  11. Milenin, A.; Kustra, P.; Furushima, T.; Du, P.; Němeček, J. Design of the laser dieless drawing process of tubes from magnesium alloy using FEM model. J. Mater. Process. Technol. 2018, 262, 65–74. [Google Scholar] [CrossRef]
  12. Keigler, M.; Bauer, H.; Harrison, D.; Silvia, A. Enhancing the formability of aluminum components via temperature controlled hydroforming. J. Mater. Process. Technol. 2005, 167, 363–370. [Google Scholar] [CrossRef]
  13. Dong, G.L.; Bi, J.; Du, B.; Chen, X.H.; Zhao, C.C. Research on AA6061 tubular components prepared by combined technology of heat treatment and internal high pressure forming. J. Mater. Process. Technol. 2017, 242, 126–138. [Google Scholar] [CrossRef]
  14. Maeno, T.; Mori, K.; Fujimoto, K. Development of the hot gas bulging process for aluminum alloy tube using resistance heating. Key Eng. Mater. 2009, 410–411, 315–323. [Google Scholar] [CrossRef]
  15. Maeno, T.; Mori, K.; Fujimoto, K. Hot gas bulging of sealed aluminum alloy tube using resistance heating. Manuf. Rev. 2014, 1, 5. [Google Scholar]
  16. Maeno, T.; Mori, K.; Adachi, K. Gas forming of ultra-high strength steel hollow part using air filled into sealed tube and resistance heating. J. Mater. Process. Technol. 2014, 214, 97–105. [Google Scholar] [CrossRef]
  17. Paul, A.; Strano, M. The influence of process variables on the gas forming and press hardening of steel tubes. J. Mater. Process. Technol. 2016, 228, 160–169. [Google Scholar] [CrossRef]
  18. Schlemmer, K.L.; Osman, F.H. Differential heating forming of solid and bi-metallic hollow parts. J. Mater. Process. Technol. 2005, 162–163, 564–569. [Google Scholar] [CrossRef]
  19. Furushima, T.; Hung, N.Q.; Manabe, K.; Sasaki, O. Development of semi-dieless metal bellows forming process. J. Mater. Process. Technol. 2013, 213, 1406–1411. [Google Scholar] [CrossRef]
  20. Suproadi, S.; Manabe, K. Enhancement of dimensional accuracy of dieless tube-drawing process with vision-based fuzzy control. J. Mater. Process. Technol. 2013, 213, 905–912. [Google Scholar] [CrossRef]
  21. Asao, H.; Okada, K.; Watanabe, M.; Yonemura, H.; Matsumoto, T.; Umehara, N. Analysis in workability of pipe bending Using High Frequency induction heating. In Proceedings of the 24th International Machine Tool Design and Research Conference (M.T.D.R.), 31 August–1 September 1983; pp. 97–104. [Google Scholar]
  22. Tomizawa, A.; Shimada, N.; Kubota, H.; Okada, N.; Hara, M.; Kuwayama, S. Forming characteristics in three-dimensional hot bending and direct quench process - Development of three-dimensional hot bending and direct quench technology. J. JSTP 2015, 56, 961–966. [Google Scholar] [CrossRef] [Green Version]
  23. Liu, G.; Zhang, W.; He, Z.; Yuan, S.; Lin, Z. Warm hydroforming of magnesium alloy tube with large expansion ratio within non-uniform temperature field. Trans. Nonferrous Met. Soc. China 2012, 22, s408–s415. [Google Scholar] [CrossRef]
  24. Yoshihara, S.; Nishimura, H.; Yamamoto, H.; Manabe, K. Formability enhancement in magnesium alloy stamping using a local heating and cooling technique: Circular cup deep drawing process. J. Mater. Process. Technol. 2003, 142, 579–585. [Google Scholar] [CrossRef]
  25. Manabe, K.; Morishima, T.; Ogawa, Y.; Tada, K.; Murai, T.; Nakagawa, H. Warm Hydroforming Process with Non-Uniform Heating for AZ31 Magnesium Alloy Tube. Mater. Sci. Forum 2010, 654, 739–742. [Google Scholar] [CrossRef]
  26. Manabe, K.; Morishima, T.; Tada, K.; Mac Donald, B.J. Deformation Behavior of AZ31 Magnesium Alloy Tube in Warm Hydroforming Process with Non-uniform Heating. In Proceeding of the 5th International Conference on Tube Hydroforming (Tube Hydroforming Technology 2011), Noboribetsu, Japan, 24–27 July 2011; pp. 84–87. [Google Scholar]
  27. Manabe, K.; Suetake, M.; Koyama, H.; Yang, M. Hydroforming process optimization of aluminum alloy tube using intelligent control technique. Int J Mach Tools Manu. 2006, 46, 1207–1211. [Google Scholar] [CrossRef]
  28. Yoshitomi, Y.; Kamohara, H.; Shimaguti, T.; Asao, H.; Nomura, H. An evaluation method of the applicability of the bulge forming for circular tubes. J. JSTP 1987, 28–316, 432–437. [Google Scholar]
Figure 1. Stress-strain curves of AZ31 and AZ61 at different temperatures and initial strain rates. (a) AZ31B initial strain rate: 0.001 s−1; (b) AZ31B, 0.1 s−1; (c) AZ61, 0.01 s−1.
Metals 11 00901 g001
Figure 2. Outline of the tooling for T-shape forming (Unit: mm).
Metals 11 00901 g002
Figure 3. Configuration of a hydraulic circuit and its closed loop control system in WTHF.
Metals 11 00901 g003
Figure 4. Heating and cooling system for the warm T-shape die. (a) For uniform warm temperature field, the entire circumference of the die is surrounded by heat insulator material; (b) for non-uniform temperature field; (c) cooling device with spray nozzle.
Metals 11 00901 g004
Figure 5. Temperature distributions used in WTHF experiment.
Metals 11 00901 g005
Figure 6. FE model for warm T-shape hydroforming.
Metals 11 00901 g006
Figure 7. Process window and forming limits of T-shape forming for AZ31B tube in a proportional loading under 250 °C. The ①, ②, ③, and ④ in the figure indicate different loading paths (experiment).
Metals 11 00901 g007
Figure 8. Comparisons of final bulged shape between experimental and simulated results at T-shape forming limit for AZ31B tube in a proportional loading under 250 °C. (a) Path ① in Figure 7; (b) Path ②; (c) Path ③; (d) Path ④.
Metals 11 00901 g008
Figure 9. Temperature distribution conditions in warm T-shape forming process for AZ31B. (a) Uniform temperature field at 250 °C; (b) Non-uniform temperature field.
Metals 11 00901 g009
Figure 10. Comparison of wall thickness distribution between uniform temperature and non-uniform temperature fields. (a) Bulged side; (b) bottom side. Solid line: FE analysis result; dashed line: experimental result; red color: 250 °C; blue color: non-uniform temperature.
Metals 11 00901 g010
Figure 11. Evaluation functions for T-shape forming. (a) Evaluation function Φ for the risk of wavy buckling; (b) Evaluation function Ψ for the contact length with counter punch. Rmax: maximum bulged height (radius) near the die inlet shoulder part; Rmin: minimum bulged height (radius) near there; Cl: contact length with a counter punch; Cref: assumed reference contact length. A red rectangle indicates a maximum bulged part region near the die inlet.
Metals 11 00901 g011
Figure 12. Membership functions for the early stage. (a) Input membership function for Φ; (b) output membership function for axial penetration increment ΔAPS.
Metals 11 00901 g012
Figure 13. Comparison of loading path between the manual set from experience and the fuzzy inference model (250 °C), p: internal pressure, ∆H: counterpunch displacement, ∆L: axial penetration.
Metals 11 00901 g013
Figure 14. Comparison between the final shape and dimensions of T-shape formed products. (a) Experiment; (b) FE analysis.
Metals 11 00901 g014
Figure 15. Effect of counter punch temperature TCP on wall thickness reduction at the center of counter punch. (a) Effect of TCP; (b) buckling occurred near the die shoulder.
Metals 11 00901 g015
Figure 16. Effect of Tbottom on RMS of wall thickness distribution along the bottom part. (a) The tRMS; (b) wrinkles occurred at bulging head.
Metals 11 00901 g016
Figure 17. Optimum temperature conditions in T-shape forming for AZ31B magnesium alloy.
Metals 11 00901 g017
Figure 18. Comparison of wall thickness distribution between manual control and optimum process control (FE analysis). (a) Bulge side; (b) bottom side.
Metals 11 00901 g018
Figure 19. Comparison of optimum loading path for T-shape forming and cross-shape forming of AZ31B and AZ61 at 250 °C. (a) T-shape forming; (b) cross-shape forming; (c) comparison between T-shape forming and cross-shape forming. p: internal pressure, ∆H: counterpunch displacement, ∆L: axial penetration.
Metals 11 00901 g019
Figure 20. Optimum temperature conditions to make the wall thickness distribution more uniform. (a) T-shape forming for AZ61; (b) cross-shape forming for AZ31B and AZ61.
Metals 11 00901 g020
Table 1. Chemical composition of AZ31B and AZ61 magnesium alloy tubes (mass %).
MaterialAlZnMnSiFeCuNiCaMg
AZ31B3.280.750.320.0100.0020.0010.0010.001Bal.
AZ615.5–6.50.5–1.50.15–0.4≦0.1≦0.005≦0.05≦0.005-Bal.
Publisher’s Note: MDPI stays neutral with regard to jurisdictional claims in published maps and institutional affiliations.

