Abstract
A study of the pretreatment stage and subsequent leaching of a mixed copper ore with different chloride solutions containing iron was carried out. The first stage considered pretreatment tests to decide the best conditions. Two levels of each factor were analyzed, 20 and 50 kg/t of NaCl, 17 and 25 kg/t of H2SO4, 0 and 25 kg/t of Fe2(SO4)3·9.2H2O, 0 and 25 kg/t of Fe2SO4·7H2O, and a curing time of 15 and 30 days. The results showed a significant effect of NaCl and curing time on the extraction, and less effect was found with the variation of acid and iron salts. The second stage included column leaching using a solution with 0.5 g/L of Cu+2, 80 g/L of Cl−, 10 g/L of H2SO4, and variable concentrations of ferric and ferrous ions (0 and 2 g/L). The best copper extraction of 80.2% was found considering a pretreatment of 30 days, 25 kg/t of H2SO4, 50 kg/t of NaCl, and a leaching solution concentration described previously with 2 g/L of Fe+2. The results showed the leaching of all copper oxide species and 20% of the copper sulfide species. In addition, there was a reduction in the acid consumption as the resting time increases. Furthermore, to evaluate a possible decrease in time and acid in pretreatment and chloride in leaching, tests including 10 and 25 kg/t of H2SO4 and 1, 15, and 30 days of curing and a diminution of the NaCl concentration to 20 g/L (content from seawater) were executed. The results showed a significant effect on curing time below 15 days. Furthermore, the slight influence of the decrease of acid on copper extraction gives cost reduction opportunities. The diminution of chloride concentration (80 to 20 g/L) in leaching solution decreases the extraction from 79% to 66.5%. Finally, the Mellado leaching kinetic model was successfully implemented.
1. Introduction
Copper oxide and copper sulfide ores are processed in hydrometallurgical and concentrator plants, respectively. Due to the nature of deposits and the deepening of the pits, there is a depletion of the oxide copper ores and greater presence of sulfide ores [1]. This situation has led to the study of new economically and environmentally feasible processes. Heap leaching in chloride media of copper sulfide ores has attracted increasing interest [2,3,4,5]. In arid regions, seawater or discarded brines can be used as leaching media [6,7,8,9].
Many authors concluded that chloride media is effective in copper sulfide ore dissolution for many reasons. The increase of the solubility of metallic ions such as copper and iron, the improvement in the redox properties of the system caused by the formation of chlorocomplexes and the stabilization of couple Cu+1/Cu+2, and the generation of porous layers in the surface of the ore allowing optimal diffusion of the leaching agents are some of them [2,6,10,11,12,13,14,15].
On the other hand, according to the Pourbaix diagram, copper sulfides as Chalcopyrite (CuFeS2), Bornite (Cu5FeS4), Chalcocite (Cu2S), and Covellite (CuS) need low pH (less than pH 4) and redox potentials above 0.4 V (SHE). These potential levels can be achieved using oxidants as ferric ions in the leaching solution [16]. The couple Fe+2/Fe+3 variation can lead to modifications on the solution potential readily [17,18,19,20]. Diverse authors have studied these antecedents [21,22,23,24,25,26].
For example, Niu et al. [27] studied chalcocite column leaching using acid solutions containing ferric sulfate, obtaining a maximum of 80% at 30 °C after 250 h of leaching. The mechanism was described as a two-stage dissolution process, with the production of secondary covellite as an intermediate, according to Reactions (1) and (2).
On the other hand, Hashemzadeh et al. [28] studied and modeled the kinetics of chalcocite agitated leaching with ferric chloride. Additionally, the effects of parameters such as chloride, ferric, ferrous concentrations, ferric/ferrous ratio, temperature, and particle size were analyzed. Similarly to Niu et al. [27], the authors proposed a two-stage dissolution mechanism; the main difference is the production of non-stoichiometric compounds such as djurleite, digenite, anilite, and secondary covellite, among others, as products in the first stage (Reaction (3)). In the second stage, the non-stoichiometric compounds are oxidized, as seen in Reaction (4).
Based on the kinetics, it was concluded that the diffusion of ferric ions controlled the first stage. In contrast, the second stage was controlled by a combination of the ore decomposition and ferric reduction.
Additionally, Miki et al. [29] studied and compared the leaching kinetics of covellite, chalcocite, and digenite. The potential was controlled by varying the chloride and acid concentrations. The leaching rate is similar at 600 mV and 650 mV potentials, while at potentials below 500 mV, it is noticeably less. The leaching rates of chalcocite and digenite are faster than that of covellite. The secondary covellite can be leached at potentials above 550 mV, as was predicted previously.
Nicol and Zhang [30] and Nicol et al. [31] studied the cathodic reduction of Fe+3 and Cu+2 and the anodic oxidation of Fe+2 and Cu+1 in the leaching of several copper sulfides using chloride solutions.
The results showed variable reactivity of the minerals for Fe+2 oxidation and Cu+1 ions. At the studied conditions, passivation of the oxidation of Fe+2 at high potentials occurs on all minerals, except pyrite. Low passivation of Cu+1 oxidation occurs only in chalcopyrite and covellite at high potentials. The passivation of minerals oxidation cause is not established, but according to the authors, the passivation causes are the same in cuprous and ferrous ions. Similarly, the authors found variable reactivity of the sulfide minerals for the reduction of Fe+3 and Cu+2. The results showed that all minerals have greater reactivity for the reduction of Cu+2 than Fe+3.
In the case of chalcopyrite, the leaching at high potentials has been questioned (i.e., high ferric concentration in leaching solution). Studies show an inhibition of chalcopyrite at high ferric concentrations [16]. Conversely, ferrous ions increase the leaching kinetics [32,33].
Hiroyoshi et al. [34] found that the copper dissolution from chalcopyrite increases with the use of ferrous sulfate instead of ferric sulfate. Later, Hiroyoshi et al. [35] proposed a leaching model including ferrous ions in the leaching solution. The model included a two-stage process: first, the reduction of chalcopyrite to Cu2S in the presence of ferrous ions. Second, the oxidation of Cu2S to cupric ions and elemental sulfur via oxygen and/or ferric ions. Yang et al. [36] found that the chalcopyrite leaching increased with the redox potential decrease. This condition was achieved with the increase of the ferrous ions. A Cu+2 and Fe+2 leaching system was more effective than a Cu+2 and Fe+3 system.
Along with the operational conditions described previously, implementing a pretreatment of the ore helps increase the extraction and reduce the leaching cycle. The pretreatment consists of agglomerate and acid curing of the ore. The agglomerate promotes the aggregation of the fine particles to avoid segregation and improves the percolation of the heap, whereas the acid curing inhibits the dissolution of impurities and accelerates the extraction [37,38].
The optimal curing and agglomeration conditions depend on the size distribution and the ore mineralogy. Cerda et al. [39] studied the pretreatment and leaching of a copper sulfide ore in a chloride media. The maximal copper extraction was 85% using a pretreatment stage and agitated leaching. Without the pretreatment, the extraction reached was 55% at the same leaching conditions. In a column leaching, the extraction reached 49% at room temperature.
Bahamonde et al. [40] found an increment in the copper extraction when a pretreatment stage with sodium chloride and sulfuric acid was included in the process. The copper concentrate was composed of bornite and chalcopyrite in a proportion of 66.7% and 19.8%, respectively. They concluded that the efficiency of the pretreatment process depends majorly on the formation of hydrochloric acid in the mixture at the particle level.
Quezada et al. [41] and Velasquez-Yévenes et al. [42] studied the effect of pretreatment on different scenarios. In the case of leaching of secondary copper sulfide ores, it was demonstrated that the agglomeration with acid and chloride ions and curing for an extensive period increases the copper extraction with a maximal extraction of 72% considering 50 days of curing. Decreasing the time to 3 days reduces the copper extraction to 58%. Similarly, the pretreatment helps to enhance the copper extraction from an ore compose majorly of chalcopyrite. Increasing the curing time from 15 to 80 days (and additionally 100 g/L of acid, 160 g/L of NaCl, and 0.5 g/L of Cu+2) and considering 20 days of column leaching can approximately increase the extraction from 20 to 60%. The increase in chloride content can enhance the extraction by more than 20 percentage points at the studied conditions.
Undoubtedly, heap leaching of copper sulfide ores has been a matter of broad research to elucidate their mechanisms and controlling factors. One technique used to support the experimentation is the use of modeling techniques to forecast the metal production and the controlling variables. Several models have been developed, from a simple spreadsheet to complex phenomenological models [43]. The forecast metal extraction can be obtained from empirical data from other operations or extrapolated column leach tests. More complex spreadsheet-based models applied additional scale-up factors to improve the accuracy of the extractions from laboratory column testing [44] and/or complement the former models with the solution inventory from inside the heap at the end of the period. Phenomenological models can represent leaching processes incorporating the transport of liquid, gas, solutes, and heat into, through, and out the leaching heap at different time scales [45]. Examples of phenomenological models based on the characteristics mentioned previously can be found in [45,46,47,48,49].
On the other hand, Mellado et al. [50,51,52] developed a series of analytical models that, combined with phenomenology aspects, are used to interpolate and extrapolate the behavior of the heap. These models are suitable for scaling up the heap leach process of solids reactants from porous pellets producing accurate solutions for actual industry heap leach operations. Saldaña et al. [53] presented a methodology for evaluating heap leach incorporating discrete event simulation for feed mineral composition variation and the behavior of the heap, using the analytical models developed by Mellado.
This work aims to determine the effect of ferric and ferrous ions in a pretreatment stage with the subsequent leaching stage using a copper mixed ore in an acid–chloride media. The experimental design considered two sets of tests. The first set evaluates the addition of reagents such as sulfuric acid (17 and 25 kg/t), chloride (20 and 50 kg/t), ferric sulfate (0 and 25 kg/t), ferrous sulfate (0 and 25 kg/t), and the curing time (15 and 30 days) in the ore pretreatment. Once the best condition on pretreatment that maximizes the copper extraction is identified, the second set of tests is executed, evaluating the incorporation of ferric ions (0 or 2 g/L) or ferrous ions (0 or 2 g/L) into the leaching solution to continue increasing the copper extraction. In addition, a final evaluation of the pretreatment/leaching cycle and acidification is performed.
2. Materials and Methods
Mixed copper ore samples from Antofagasta Region in Chile are used. The ore size is reduced to −3/8″ with P80 equal to 10.9 mm. The ore composition is obtained by inductively coupled plasma atomic emission spectroscopy (ICP-AES) and corroborated by atomic absorption spectrometry (AAS) (ICP-AES, ICPE-9000, Shimadzu, Tokyo, Japan); see Table 1. The total copper concentration is 0.44%, and the soluble copper concentration is 0.24% with 23.9 Kg H2SO4/T ore. Table 2 shows the mineral composition determined by optical microscopy. The most abundant mineral species is Atacamite, with 0.37%. The majority of copper insoluble species are Chalcopyrite, Chalcocite, and Covellite, corresponding in total to 0.2% of the ore sample. There is also Limonite in the sample, contributing with iron as an oxidant element.

Table 1.
Chemical composition of ore sample (%).

Table 2.
Mineral characterization in the ore sample.
A set of tests was designed to identify the best conditions in pretreatment and leaching of the described ore. Variables in the composition of reagents such as NaCl, Fe2(SO4)3, FeSO4, H2SO4, and curing time were studied. Figure 1 shows the experimental procedure, including the evaluation stages.
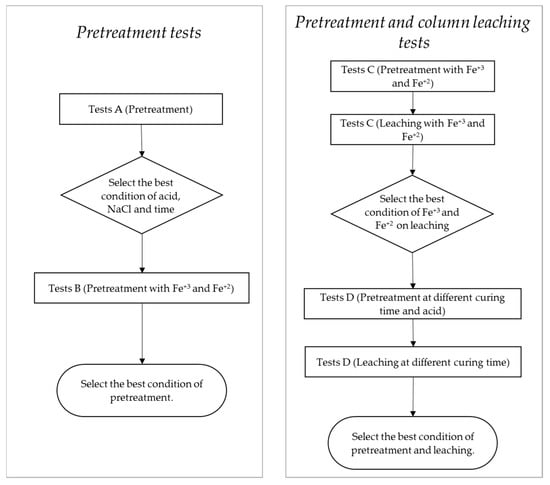
Figure 1.
Experimental procedure for pretreatment and pretreatment-leaching tests.
2.1. Pretreatment Tests
To evaluate the variables described previously, eight samples of 500 g and size below 3/8″ were used. First, the samples were placed on a plastic carpet. Then, solid NaCl is added to the ore sample, and it is homogenized. Next, the acid is added using a pipette; then, water is sprayed, and finally, the ore sample is homogenized. When iron salts are added, the process is similar. First, solid NaCl and iron salts are added to the ore sample, and then acid and water are added.
In tests, the acid dosage is defined as 75% and 100% of the ore acid consumption. The ore is mixed with the defined acid and solid NaCl concentration; then, the humidity is adjusted to 6% with seawater. After the curing time, the ore is washed at 90 °C in flasks at 910 rpm for 2 h. Finally, the solid residue is dried at 60 °C and analyzed by AAS to quantify the remained copper. The first stage of pretreatment, test A, examined the effect of NaCl, H2SO4, and curing time on the copper extraction; see Table 3. For all experiments, the copper extraction is determined.

Table 3.
Pretreatment tests A.
After the best condition of H2SO4 and NaCl dosage and curing time is found, a new set of pretreatment tests is performed. The effect of ferric and ferrous ions is analyzed using Fe2(SO4)3·9.2H2O and FeSO4·7H2O on a 25 kg/t dosage. The reagent dosage procedure of test B4 differed from the other test in the set. In this test, the solid NaCl is added together with the acid and the ore. Once the curing period of seven days is completed, the ore humidity is adjusted to 6% with seawater, and then the curing continues for 30 days in total. Table 4 shows the set of experiments B. All tests were carried out for 30 days of curing time.

Table 4.
Pretreatment tests B.
2.2. Pretreatment-Leaching Tests
Using the best conditions found in tests A and B as a precedent, a new set of tests was designed to evaluate the pretreatment and leaching as an integrated process. The pretreatment contemplated in tests C is the same considered in tests B. The pretreatment in tests D kept the dosage of NaCl constant but evaluated less acid and less curing time due to the previous stage results. After curing the ore, column leaching tests were implemented in columns of 9.5 cm diameter and 40 cm high. The irrigation was an on–off 12 h cycle. The leaching rate was set to 8 L/h m2 without recycling. The variables such as mass flow rate, pH, and oxidation-reduction potential (ORP) (Hanna portable pH/ORP meter, model HI991003, accuracy ± 0.02 pH y ± 2 mV, Ag/AgCl reference electrode) were controlled when samples were taken. Samples of drainage solutions were obtained to determine the total copper and acid concentration by AAS. The samples were taken every day for the first nine days, then every two days, and finally every four days to complete the 30 days.
After the leaching cycle is completed, every column is drained for two days, and then, the washed ore is dried at 60 °C. The first set of leaching experiments, called tests C, studied the effect of ferric and ferrous ions in the leaching solution, as shown in Figure 1. The experimental conditions are shown in Table 5. The reagent dosage in tests C4 and C5 is the same, differing in the addition procedure. The test C4 considers the NaCl addition with the sulfuric acid with a consecutive ore repose for seven days. Once the resting time is reached, water is added until the humidity reached 6%. After that, the ore pretreatment was carried out according to the optimal conditions founded in Tests B. Additionally, we analyzed the effect of ferric and ferrous salts. The composition of the leaching solution considered 10 g/L of H2SO4, 80 g/L of chloride (e.g., 20 g/L from seawater and 60 g/L from additional NaCl), and 0.5 g/L of Cu+2 according to results found in [54]; see Table 5.

Table 5.
Experimental conditions of pretreatment (25 kg/t H2SO4, 50 kg/t NaCl, humidity 6%, 30 d of curing time) and leaching (0.5 g/L Cu2+, 80 g/L Cl−, 10 g/L H2SO4), tests C.
The second set of experiments, called tests D, studied the decreasing effect of the acid concentration and curing days on pretreatment. There is no addition of NaCl to the leaching solution, and the chloride content is due to seawater use. These tests aim to optimize the pretreatment conditions from the previous tests C. The leaching solutions for all tests was the same: 0.5 g/L Cu2+, 20 g/L Cl− (provide for seawater), 10 g/L H2SO4, 2 g/L Fe2+, and leaching time of 10 days (initial pH and ORP, 0.7 and 588.7 mV, respectively). The experimental conditions are shown in Table 6.

Table 6.
Experimental conditions of pretreatment (50 kg/t NaCl, 6% humidity) tests D.
3. Results and Discussion
3.1. Pretreatment Test Results
From the first set of tests A, it can be noticed that the best extraction was found in test A4. This test included 25 kg/t ore of H2SO4, 50 kg/t ore of NaCl, and 30 days of curing, obtaining 62.8% of copper extraction. The lowest extraction of 42.7% was obtained in tests A5. This test considered only 17 kg/t ore of H2SO4, 20 kg/t ore of NaCl, and 15 days of pretreatment; see Figure 2.
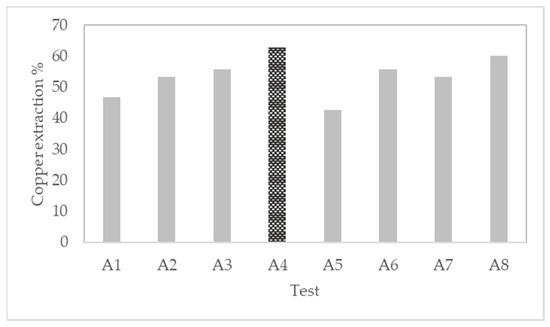
Figure 2.
Evaluation of pretreatment conditions in tests A expressed in copper extraction.
Figure 3 shows the main effect of the variables to evaluate the impact of the reagents and curing time on the extraction. The main effect plot represents the mean extraction at each level of the analyzed variables (i.e., sulfuric acid, sodium chloride, and curing time). The addition of sodium chloride and curing days significantly impacted the pretreatment, increasing the copper extraction by 17% approximately in both cases. On the other hand, the acid dose had a minimal effect, improving the extraction by only 3%.
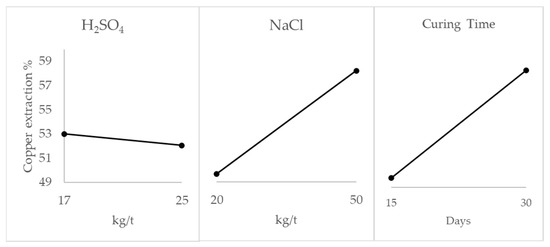
Figure 3.
Effect of variables sulfuric acid, sodium chloride, and pretreatment time on pretreatment stage (test A).
After the optimal conditions are found in the first stage of pretreatment tests, the best conditions are implemented in the second stage of tests, called tests B. The results are shown in Figure 4. Adding FeSO4·7H2O into the pretreatment increased the extraction by 8% compared to test A4 (without iron salt). Less effect can be found adding Fe2(SO4)3·9.2H2O, increasing the extraction by 4.8%.
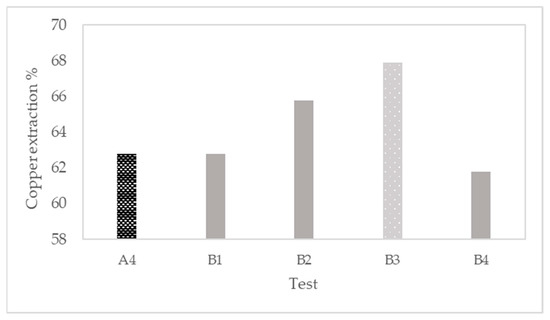
Figure 4.
Evaluation of ferrous and ferric salts in pretreatment (test B) expressed in copper extraction.
3.2. Pretreatment and Leaching Tests Results (Test C)
Figure 5 shows the extractions obtained for all columns. After 30 days of pretreatment at optimal conditions defined previously, the maximum is obtained in column C4. The copper extraction was 80.2%, and the asymptote was reached after 15 days of leaching. On the other hand, the lowest extraction was obtained in column C6. The pretreatment stage in these columns considered acid and chloride salt but no iron salts. In the leaching stage, the reagents added were the same as in column C4 except for the ferrous salt in column C6. This condition reduced the extraction to 75.5% approximately.
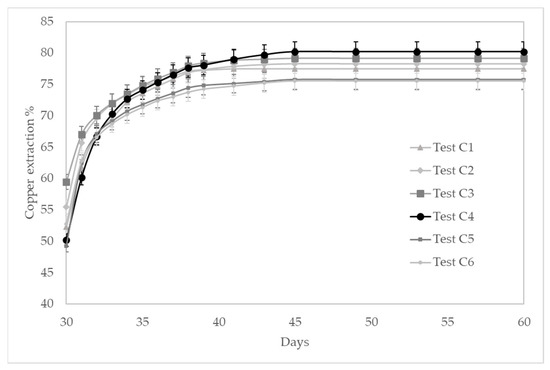
Figure 5.
Copper extraction kinetics in tests C.
Test C6 considered no addition of ferric and ferrous salts either in the pretreatment or leaching stage, maintaining the ORP above the 680 mV SHE. The addition of ferrous ions into the leaching solution (i.e., columns C2 to C5) held the potential below 660 mV SHE on average, and the addition of ferric ions to C1 in a concentration of 2 g/L increases the ORP above 700 mV SHE in average. The effect of ferric or ferrous salts in the pretreatment (columns C2 and C3) is negligible at the defined concentrations. The best extractions are obtained at moderated ORP values, around 650 mV SHE on average. The pregnant leach solution (PLS) copper composition varies from 2.29 g/L in column C6 to 20 g/L in column C4; on the other hand, the iron composition varies from 25.07 g/L in column C6 to maximum values of 86.8 g/L (column C3) and 79.4 g/L (column C2). These latter columns correspond to tests that included iron salts in the pretreatment.
As mentioned previously, the ore composition is a mixed ore with Atacamite as the main oxide species and Chalcocite, Covelline, and Chalcopyrite as the main copper sulfide species. Due to the heterogeneity of the ore, it is difficult to compare the results with the literature. Articles related to the relation between potential and extraction are focused mainly on primary and secondary copper ores separately.
The mineralogy analysis from the residues showed that the Atacamite is leached completely. Concerning the sulfide species, the chalcocite was also not detected in the residues. The covellite composition remained constant, which was probably due to the transformation of chalcocite to covellite, according to Reaction (1). In addition, the chalcopyrite composition remained constant.
Figure 6 shows the acid consumption per unit of extracted copper of each column. Test C5 had the highest acid consumption with a high rate of 0.63 kg/t Cu, which is equivalent to 48 kg/t ore.
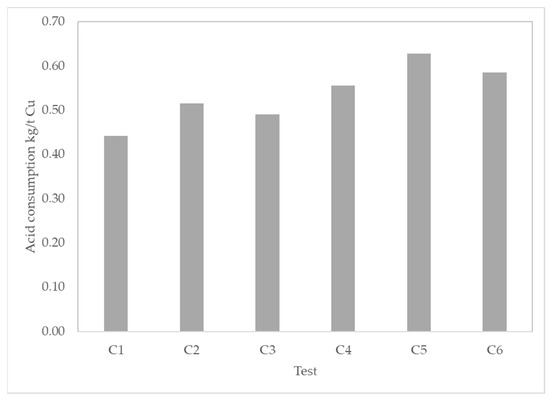
Figure 6.
Acid consumption in kg/t Cu for each column in tests C conditions.
Furthermore, to the study of the effect of iron salts on the pretreatment and leaching stages, the second set of experiments was performed to evaluate new conditions of acid and time on curing (Table 6) to optimize cycles and acid consumption. Table 7 shows the results from tests D (operational conditions are shown in Table 6). We noticed a slight effect on the copper extraction while the acid concentration in curing varies. On the other hand, changing the curing time from 1 to 15 days can increase the copper extraction by 10 percentage points. In addition, when increasing curing days to double, the extraction increases only 3 percentage points. All experiences shown in Table 7 considered 10 days of leaching after curing. Figure 7 shows the total acid consumption per unit of extracted copper. The lowest acid consumption per unit of copper extracted is obtained in test D3 with 0.32 kg/t Cu. The ORP varied from 620 to 650 mV on average approximately. The highest ORP was found in the test with the best copper extraction.

Table 7.
Extraction in percentage for tests D.
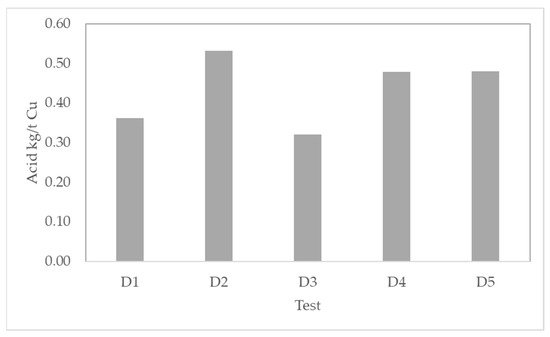
Figure 7.
Total acid consumption in kg/t Cu for all columns in tests D.
4. Column Leaching Modeling
To represent the behavior of the leaching kinetics in the studied conditions, it is implemented the model proposed by Mellado et al. [50,55]. The copper extraction in column is represented in a negative exponential curve characterized by an asymptotic limit, which is defined by the maximal copper extraction ; a kinetic parameter is defined and shown in Equation (5)
where is the column height, , , , and are fitted parameters, and is time. The parameters , , and are defined as
The parameters and are kinetic parameters, is the delay time in reaction, is the particle porosity, is the particle size, is the volumetric fraction of the solution of the bulk, is the superficial velocity, and is the effective diffusivity of the pore of the reagent. Due to the performed experiences, the bulk and leaching current properties remained constant; therefore, Equation (5) can be simplified to Equation (9).
The curing stage before leaching is included as an initial copper extraction at a time modifying Equation (9) to Equation (10).
The total copper extraction is contributed by the extraction of every copper mineral species. Equation (11) includes the extraction of all mineral species leached, according to the data from Table 8.

Table 8.
Kinetic parameters adjusted from tests C.
Subindex i represents each mineralogical species.
Table 8 shows the adjusted parameter for Equation (11). The methodology used for model fitting was the Generalized Reduced Gradient algorithm (GRG) for nonlinear problems. The data represent the first 15 days of leaching until the asymptote was reached.
Figure 8 shows the copper extractions from tests (black dots), the extractions of the developed model for the total copper extraction (black lines), Atacamite (dark gray lines), and Chalcocite (light gray lines). Figure 9 showed the sum of the squared residuals (SSE) and the standard deviation of the distance between the data values and the fitted values (S) for each column. It can be noticed that the model adequately represents the extraction of the column leaching process. The extraction calculated from the model has a deviation of less than three percentage points from the experimental data.
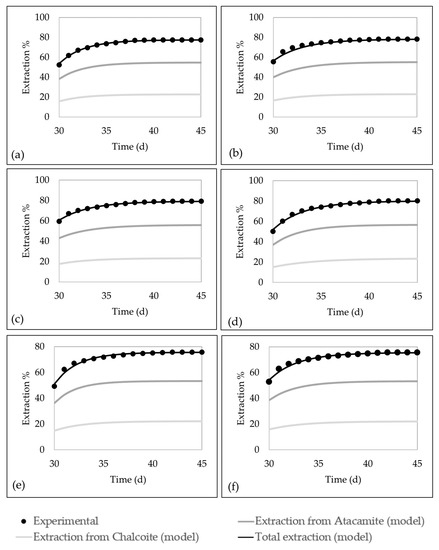
Figure 8.
Comparison between experimental copper extraction and model adjustment for columns of tests C. (a) Test C1. (b) Test C2. (c) Test C3. (d) Test C4. (e) Test C5. (f) Test C6.
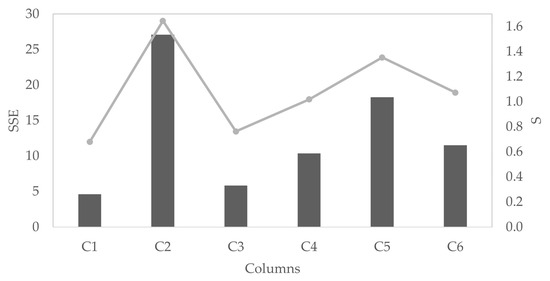
Figure 9.
The goodness of fit for each column (test C) modeled, represented in sum of the squared residuals (SSE) (gray columns) and standard deviation of the distance between the data values and the fitted values (S indexes) (light gray line).
On the other hand, Table 8 shows the standard deviation (σ) and the coefficient of variation (CV) of each adjusted parameter. All parameters that exhibited low dispersion can be interpreted as invariant parameters to the variability of the pretreatment and leaching conditions except Kτ, which exhibits a CV near 80%.
The high value of the weight of kinetic factor λ indicates that the kinetic is controlled by the first term of the expression involving the constant Kθ. Therefore, the kinetic expression can be simplified to Equation (12). The statistical analysis of this model also showed extremely low values of S and SSE, exhibiting a good approach.
5. Conclusions
The leaching of a copper mixed ore composed of Atacamite, Chalcopyrite, Covellite, and Chalcocite, including pretreatment stage and consecutive leaching stage with different oxidants and reductants, is studied. The main conclusions are the following:
- The first stage of pretreatment tests showed a maximal copper extraction of 62.5% with 25 kg/t of acid, 50 kg/t of NaCl, and 30 days of curing. The pretreatment can be improved by incorporating ferrous salts in the curing, increasing the extraction to 67.9%. The main effect plot showed that the concentration of NaCl and curing time could significantly affect the efficiency of the curing process.
- The second stage of tests showed that the maximal extraction of 80.2% is obtained by adding 25 kg/t of acid, 50 kg/t of NaCl, and 25 kg/t of FeSO4·7H2O in the pretreatment and 0.5 g/L of Cu+2, 80 g/L of Cl−, 10 g/L of H2SO4, and 2 g/L of Fe+2 in the leaching solution. At these conditions, the ORP remained below the 650 mV SHE on average. The acid consumption was 0.55 kg acid/t Cu.
- From tests D, we found that a decrease in the chloride content in the leaching solution from 80 to 20 g/L (content in seawater) decrease the copper extraction from 79 to 66.5% (considering ten days of leaching both cases). Additionally, the analysis showed that a decrease in the acid concentration in pretreatment does not mostly affect copper extraction. Conversely, the curing time could affect the extraction on values below 15 days.
- The analytic kinetic model implemented showed acceptable values of SSE and S, demonstrating the goodness of fit. It was concluded that the kinetics constant Kθ presents low variability with pretreatment and leaching at the evaluated leaching conditions.
Author Contributions
P.C.H. contributed in experimental design and analysis of results, N.E.J. contributed in results review and writing. M.E.T. contributed in review and editing, A.P.P. contributed in research and results analysis, and T.A.G. contributed in the modeling section and review. All authors have read and agreed to the published version of the manuscript.
Funding
The authors are grateful for the financial support provided by the Project ING2030 CORFO Code 16ENI2-71940.
Institutional Review Board Statement
Not applicable.
Informed Consent Statement
Not applicable.
Data Availability Statement
Not applicable.
Conflicts of Interest
The authors declare no conflict of interest.
References
- Valdés, M.; Sepúlveda, F. Opportunities in Hydrometallurgy: A Vision from the Bussiness. In Proceedings of the 10th International Seminar on Process Hydrometallurgy, Santiago, Chile, 20–22 July 2018. [Google Scholar]
- Watling, H. Chalcopyrite hydrometallurgy at atmospheric pressure: 2. Review of acidic chloride process options. Hydrometallurgy 2014, 146, 96–110. [Google Scholar] [CrossRef]
- Senanayake, G. Review of theory and practice of measuring proton activity and pH in concentrated chloride solutions and application to oxide leaching. Miner. Eng. 2007, 20, 634–645. [Google Scholar] [CrossRef]
- Velásquez-Yévenes, L.; Nicol, M.; Miki, H. The dissolution of chalcopyrite in chloride solutions: Part 1. The effect of solution potential. Hydrometallurgy 2010, 103, 108–113. [Google Scholar] [CrossRef]
- Bobadilla-Fazzini, R.A.; Pérez, A.; Gautier, V.; Jordan, H.; Parada, P. Primary copper sulfides bioleaching vs. chloride leaching: Advantages and drawbacks. Hydrometallurgy 2017, 168, 26–31. [Google Scholar] [CrossRef]
- Hernández, P.; Taboada, M.; Herreros, O.; Torres, C.; Ghorbani, Y. Chalcopyrite dissolution using seawater-based acidic media in the presence of oxidants. Hydrometallurgy 2015, 157, 325–332. [Google Scholar] [CrossRef]
- Jeldres, R.I.; Forbes, L.; Cisternas, L.A. Effect of Seawater on Sulfide Ore Flotation: A Review. Miner. Process. Extr. Met. Rev. 2016, 37, 369–384. [Google Scholar] [CrossRef]
- Cisternas, L.A.; Gálvez, E.D. The use of seawater in mining. Miner. Process. Extr. Met. Rev. 2018, 39, 18–33. [Google Scholar] [CrossRef]
- Velásquez-Yévenes, L.; Reyes, V.Q. Influence of seawater and discard brine on the dissolution of copper ore and copper concentrate. Hydrometallurgy 2018, 180, 88–95. [Google Scholar] [CrossRef]
- Carneiro, M.F.C.; Leão, V.A. Lixiviação da calcopirita com cloreto férrico e cloreto de sódio. Rem. Rev. Esc. Minas 2005, 58, 231–235. [Google Scholar] [CrossRef]
- Herreros, O.; Quiroz, R.; Longueira, H.; Fuentes, G.; Viñals, J. Leaching of djurleite in Cu2+/Cl− media. Hydrometallurgy 2006, 82, 32–39. [Google Scholar] [CrossRef]
- Carneiro, M.; Leão, V. The role of sodium chloride on surface properties of chalcopyrite leached with ferric sulphate. Hydrometallurgy 2007, 87, 73–82. [Google Scholar] [CrossRef]
- Herreros, O.; Vinals, J. Leaching of sulfide copper ore in a NaCl–H2SO4–O2 media with acid pre-treatment. Hydrometallurgy 2007, 89, 260–268. [Google Scholar] [CrossRef]
- Torres, C.; Taboada, M.; Graber, T.; Herreros, O.; Ghorbani, Y.; Watling, H. The effect of seawater based media on copper dissolution from low-grade copper ore. Miner. Eng. 2015, 71, 139–145. [Google Scholar] [CrossRef]
- Veloso, T.C.; Peixoto, J.J.; Pereira, M.S.; Leao, V.A. Kinetics of chalcopyrite leaching in either ferric sulphate or cupric sulphate media in the presence of NaCl. Int. J. Miner. Process. 2016, 148, 147–154. [Google Scholar] [CrossRef]
- Córdoba, E.; Muñoz, J.; Blázquez, M.; González, F.; Ballester, A. Leaching of chalcopyrite with ferric ion. Part I: General aspects. Hydrometallurgy 2008, 93, 81–87. [Google Scholar] [CrossRef]
- Córdoba, E.; Muñoz, J.; Blázquez, M.; González, F.; Ballester, A. Leaching of chalcopyrite with ferric ion. Part II: Effect of redox potential. Hydrometallurgy 2008, 93, 88–96. [Google Scholar] [CrossRef]
- Hiroyoshi, N.; Kitagawa, H.; Tsunekawa, M. Effect of solution composition on the optimum redox potential for chalcopyrite leaching in sulfuric acid solutions. Hydrometallurgy 2008, 91, 144–149. [Google Scholar] [CrossRef]
- Li, J.; Kawashima, N.; Kaplun, K.; Absolon, V.; Gerson, A. Chalcopyrite leaching: The rate controlling factors. Geochim. Cosmochim. Acta 2010, 74, 2881–2893. [Google Scholar] [CrossRef]
- Kaplun, K.; Li, J.; Kawashima, N.; Gerson, A. Cu and Fe chalcopyrite leach activation energies and the effect of added Fe3+. Geochim. Cosmochim. Acta 2011, 75, 5865–5878. [Google Scholar] [CrossRef]
- Elsherief, A. The influence of cathodic reduction, Fe2+ and Cu2+ ions on the electrochemical dissolution of chalcopyrite in acidic solution. Miner. Eng. 2002, 15, 215–223. [Google Scholar] [CrossRef]
- Al-Harahsheh, M.; Kingman, S.; Al-Harahsheh, A. Ferric chloride leaching of chalcopyrite: Synergetic effect of CuCl2. Hydrometallurgy 2008, 91, 89–97. [Google Scholar] [CrossRef]
- Liu, Q.; Li, H. Electrochemical behaviour of chalcopyrite (CuFeS2) in FeCl3 solution at room temperature under differential stress. Int. J. Miner. Process. 2011, 98, 82–88. [Google Scholar] [CrossRef]
- Ghahremaninezhad, A.; Dixon, D.; Asselin, E. Kinetics of the ferric–ferrous couple on anodically passivated chalcopyrite (CuFeS2) electrodes. Hydrometallurgy 2012, 125-126, 42–49. [Google Scholar] [CrossRef]
- Lu, J.; Dreisinger, D. Copper leaching from chalcopyrite concentrate in Cu(II)/Fe(III) chloride system. Miner. Eng. 2013, 45, 185–190. [Google Scholar] [CrossRef]
- Olvera, O.; Rebolledo, M.; Asselin, E. Atmospheric ferric sulfate leaching of chalcopyrite: Thermodynamics, kinetics and electrochemistry. Hydrometallurgy 2016, 165, 148–158. [Google Scholar] [CrossRef]
- Niu, X.; Ruan, R.; Tan, Q.; Jia, Y.; Sun, H. Study on the second stage of chalcocite leaching in column with redox potential control and its implications. Hydrometallurgy 2015, 155, 141–152. [Google Scholar] [CrossRef]
- Hashemzadeh, M.; Dixon, D.G.; Liu, W. Modelling the kinetics of chalcocite leaching in acidified ferric chloride media under fully controlled pH and potential. Hydrometallurgy 2019, 186, 275–283. [Google Scholar] [CrossRef]
- Miki, H.; Nicol, M.; Velásquez-Yévenes, L. The kinetics of dissolution of synthetic covellite, chalcocite and digenite in dilute chloride solutions at ambient temperatures. Hydrometallurgy 2011, 105, 321–327. [Google Scholar] [CrossRef]
- Nicol, M.J.; Zhang, S. Anodic oxidation of iron(II) and copper(I) on various sulfide minerals in chloride solutions. Hydrometallurgy 2016, 166, 167–173. [Google Scholar] [CrossRef]
- Nicol, M.J.; Tjandrawan, V.; Zhang, S. Cathodic reduction of iron(III) and copper(II) on various sulfide minerals in chloride solutions. Hydrometallurgy 2016, 166, 113–122. [Google Scholar] [CrossRef]
- Yoo, K.; Kim, S.-K.; Lee, J.-C.; Ito, M.; Tsunekawa, M.; Hiroyoshi, N. Effect of chloride ions on leaching rate of chalcopyrite. Miner. Eng. 2010, 23, 471–477. [Google Scholar] [CrossRef]
- Li, Y.; Kawashima, N.; Li, J.; Chandra, A.; Gerson, A.R. A review of the structure, and fundamental mechanisms and kinetics of the leaching of chalcopyrite. Adv. Colloid Interface Sci. 2013, 197, 1–32. [Google Scholar] [CrossRef]
- Hiroyoshi, N.; Hirota, M.; Hirajima, T.; Tsunekawa, M. A case of ferrous sulfate addition enhancing chalcopyrite leaching. Hydrometallurgy 1997, 47, 37–45. [Google Scholar] [CrossRef]
- Hiroyoshi, N.; Miki, H.; Hirajima, T.; Tsunekawa, M. A model for ferrous-promoted chalcopyrite leaching. Hydrometallurgy 2000, 57, 31–38. [Google Scholar] [CrossRef]
- Yang, C.-R.; Jiao, F.; Qin, W.-Q. Leaching of chalcopyrite: An emphasis on effect of copper and iron ions. J. Cent. South Univ. 2018, 25, 2380–2386. [Google Scholar] [CrossRef]
- Dhawan, N.; Safarzadeh, M.S.; Miller, J.D.; Moats, M.S.; Rajamani, R.K. Crushed ore agglomeration and its control for heap leach operations. Miner. Eng. 2013, 41, 53–70. [Google Scholar] [CrossRef]
- Lu, J.; Dreisinger, D.; West-Sells, P. Acid curing and agglomeration for heap leaching. Hydrometallurgy 2017, 167, 30–35. [Google Scholar] [CrossRef]
- Cerda, C.P.; Taboada, M.E.; Jamett, N.E.; Ghorbani, Y.; Hernández, P.C. Effect of Pretreatment on Leaching Primary Copper Sulfide in Acid-Chloride Media. Minerals 2017, 8, 1. [Google Scholar] [CrossRef]
- Bahamonde, F.; Gomez, M.; Navarro, P. Pre-Treatment with Sodium Chloride and Sulfuric Acid of a Bornitic Concentrate and Later Leaching in Chloride Solution. In Proceedings of the 9th International Seminar on Process Hydrometallurgy and the International Conference on Metal Solvent Extraction, Hydroprocess-ICMSE, Santiago, Chile, 21–23 June 2017. [Google Scholar]
- Quezada, V.; Velásquez, L.; Roca, A.; Benavente, O.; Melo, E.; Keith, B. Effect of curing time on the dissolution of a secondary copper sulphide ore using alternative water resources. IOP Conf. Ser. Mater. Sci. Eng. 2018, 427, 012030. [Google Scholar] [CrossRef]
- Velásquez-Yévenes, L.; Torres, D.; Toro, N. Leaching of chalcopyrite ore agglomerated with high chloride concentration and high curing periods. Hydrometallurgy 2018, 181, 215–220. [Google Scholar] [CrossRef]
- Marsden, J.; Botz, M. Heap leach modeling—A review of approaches to metal production forecasting. Miner. Met. Process. 2017, 34, 53–64. [Google Scholar] [CrossRef]
- Lampshire, D.; Braun, T. Heap Leaching Operations and Practices at Cortez Gold Mines. In Proceedings of the SME Annual Conference & Expo, Salt Lake City, UT, USA, 28 February–2 March 2005; Society for Mining, Metallurgy & Exploration: Englewood, CO, USA, 2005. [Google Scholar]
- Dixon, D.G. Heap Leach Modeling—The Current State of the Art. In Proceedings of the Hydrometallurgy 2003—Fifth International Conference in Honor of Professor Ian Ritchie, Vancouver, BC, Canada, 24–27 August 2003; pp. 289–314. [Google Scholar]
- Vegliò, F.; Trifoni, M.; Pagnanelli, F.; Toro, L. Shrinking core model with variable activation energy: A kinetic model of manganiferous ore leaching with sulphuric acid and lactose. Hydrometallurgy 2001, 60, 167–179. [Google Scholar] [CrossRef]
- Safari, V.; Arzpeyma, G.; Rashchi, F.; Mostoufi, N. A shrinking particle—Shrinking core model for leaching of a zinc ore containing silica. Int. J. Miner. Process. 2009, 93, 79–83. [Google Scholar] [CrossRef]
- Dixon, D.G.; Hendrix, J.L. A general model for leaching of one or more solid reactants from porous ore particles. Met. Mater. Trans. A 1993, 24, 157–169. [Google Scholar] [CrossRef]
- Dixon, D.G.; Hendrix, J.L. A mathematical model for heap leaching of one or more solid reactants from porous ore pellets. Met. Mater. Trans. A 1993, 24, 1087–1102. [Google Scholar] [CrossRef]
- Mellado, M.E.; Cisternas, L.A.; Gálvez, E.D. An analytical model approach to heap leaching. Hydrometallurgy 2009, 95, 33–38. [Google Scholar] [CrossRef]
- Mellado, M.E.; Cisternas, L.A.; Lucay, F.A.; Gálvez, E.D.; Sepúlveda, F.D. A Posteriori Analysis of Analytical Models for Heap Leaching Using Uncertainty and Global Sensitivity Analyses. Minerals 2018, 8, 44. [Google Scholar] [CrossRef]
- Mellado, M.E.; Casanova, M.P.; Cisternas, L.A.; Gálvez, E.D. On scalable analytical models for heap leaching. Comput. Chem. Eng. 2011, 35, 220–225. [Google Scholar] [CrossRef]
- Saldaña, M.; Toro, N.; Castillo, J.; Hernández, P.; Navarra, A. Optimization of the Heap Leaching Process through Changes in Modes of Operation and Discrete Event Simulation. Minerals 2019, 9, 421. [Google Scholar] [CrossRef]
- Yévenes, L.V.; Miki, H.; Nicol, M. The dissolution of chalcopyrite in chloride solutions: Part 2: Effect of various parameters on the rate. Hydrometallurgy 2010, 103, 80–85. [Google Scholar] [CrossRef]
- Mellado, M.E.; Gálvez, E.D.; Cisternas, L.A. Stochastic analysis of heap leaching process via analytical models. Miner. Eng. 2012, 33, 93–98. [Google Scholar] [CrossRef]
Publisher’s Note: MDPI stays neutral with regard to jurisdictional claims in published maps and institutional affiliations. |
© 2021 by the authors. Licensee MDPI, Basel, Switzerland. This article is an open access article distributed under the terms and conditions of the Creative Commons Attribution (CC BY) license (https://creativecommons.org/licenses/by/4.0/).