Article

Towards Understanding the Cathode Process Mechanism and Kinetics in Molten LiF–AlF3 during the Treatment of Spent Pt/Al2O3 Catalysts

1
Laboratory of Physics and Chemistry of Metallurgical Processes and Materials, Siberian Federal University, 660025 Krasnoyarsk, Russia
2
IME Process Metallurgy and Metal Recycling, RWTH Aachen University, 52056 Aachen, Germany
*
Author to whom correspondence should be addressed.
Metals 2021, 11(9), 1431; https://doi.org/10.3390/met11091431
Submission received: 9 August 2021 / Revised: 31 August 2021 / Accepted: 7 September 2021 / Published: 10 September 2021
(This article belongs to the Special Issue Advances in Understanding Metal Electrolysis Processes)

Abstract

:
Electrochemical decomposition of spent catalyst dissolved in molten salts is a promising approach for the extraction of precious metals from them. This article reports the results of the study of aluminum electrowinning from the xLiF–(1-x)AlF3 melt (x = 0.64; 0.85) containing 0–5 wt.% of spent petroleum Pt/γ-Al2O3 catalyst on a tungsten electrode at 740–800 °C through cyclic voltammetry and chronoamperometry. The results evidence that the aluminum reduction in the LiF–AlF3 melts is a diffusion-controlled two-step process. Both one-electron and two-electron steps occur simultaneously at close (or same) potentials, which affect the cyclic voltammograms. The diffusion coefficients of electroactive species for the one-electron process were (2.20–6.50)∙10−6 cm2·s–1, and for the two-electron process, they were (0.15–2.20)−6 cm2·s−1. The numbers of electrons found from the chronoamperometry data were in the range from 1.06 to 1.90, indicating the variations of the partial current densities of the one- and two-electron processes. The 64LiF–36AlF3 melt with about 2.5 wt.% of the spent catalysts seems a better electrolyte for the catalyst treatment in terms of cathodic process and alumina solubility, and the range of temperatures from 780 to 800 °C is applicable. The mechanism of aluminum reduction from the studied melts seems complicated and deserves further study to find the optimal process parameters for aluminum reduction during the spent catalyst treatment and the primary metal production as well.

1. Introduction

The platinum group metals (PGMs) are extensively used in various fields such as the petroleum industry for improving gasoline quality [1], organic synthesis for cycloisomerization, in the hydrogen evolution reaction [2] and medicine [3]. Platinum coated alumina substrate is used as a catalyst in the reforming and isomerization process to create higher octane components for gasoline. The lifespan of catalysts varies between 3 to 5 years after which either the precious metals can be extracted from the spent catalysts or they can be regenerated [4]. Hydrometallurgical [5,6,7,8] and pyrometallurgical methods are extensively used at laboratory and industrial scales for the recovery of PGMs from the spent catalysts, while electrochemical techniques are infrequently used [9,10,11,12]. New methods and materials are reported annually. Dendrimer-based adsorbents were found suitable for the recovery of precious metals due to their well-defined molecular composition with N-bearing functionalities, which led to selective extraction of metal ions from aqueous and non-aqueous solutions [13]. A supported ionic liquid-based method for the separation of platinum group metals was proposed by Lanaridi et al. [14]. Separation of Pt and Pd from Rh and other interfering elements and recovery of Pt (86%) and Pd (96%) in solution was successfully performed with acidified thiourea solutions. While the retention of Pd and Pt on the recycled polySILP (supported ionic liquid phases) remained excellent, the separation of Pt and Pd from interfering elements was not possible, indicating that further improvements for the recycling of the spent material are required.
A solvometallurgical process for near-zero waste recycling of PGMs from spent automotive catalysts was developed and successfully applied by Nguyen et al. [15]. The oxidative dissolution of PGMs using organic lixiviants depended on the temperature, leaching time, oxidizing agent concentration and S/L ratio.
Bioprocesses are generally recognized as sustainable alternatives for the recovery of heavy metals [16]. The intrinsic capability of some microorganisms to mobilize metals via processes such as bioleaching and subsequent biosorption, bioaccumulation, bioreduction and biomineralization may provide a more sustainable pathway for the recovery of these metals.
Fajar et al. [17] assessed the recovery of Pt, Pd and Rh from a spent catalyst leachate solution using polymer inclusion membranes containing the ionic liquid trioctyl(dodecyl) phosphonium chloride (P88812Cl). It was found that more than 90% of Pt and Pd in the extraction solutions could be recovered with remarkably high purity.
Extracting PGMs from the feedstock using pyrometallurgy, employing copper as the PGM collector, followed by a molten salt electrolysis process was proposed by SINTEF [18,19]. The PGM recovery rates in the alloy phase were close to 100%, and the copper-collector recovery rates were in the range of 82 to 100%. The optimal parameters were 10 wt.% copper-collector, 10–15 wt.% calcium oxide, 1600–1650 °C and 1–1.5 h holding time. In the electrolysis step, the Cu–PGM alloy was used as anode in an electrorefining cell with the eutectic LiCl–KCl as electrolyte at 450 °C. Copper was recovered at the cathode with a current efficiency of 70%, and the PGMs (and other impurities) remained in the anode residue.
Another combination of pyrometallurgical and electrochemical methods was proposed in [20] where the process was performed at a much lower temperature between 700 and 850 °C. A liquid bipolar electrode made of aluminum was used as a collector for PGMs and divided the cell into two sections. The first section acted as an electrolysis cell with the MF-AlF3 (M = Li, K) electrolyte containing spent catalyst, where the catalyst carriers decomposed into aluminum and oxygen while the PGMs were accumulated in aluminum. The second section acted as a refinery cell with the NaCl–KCl–AlF3 melt, where the dissolution followed by reduction of aluminum at the liquid aluminum cathode took place [21]. The PGM concentration in the bipolar electrode increased with time. The initial tests [20] showed that concentration of Pt in the bipolar electrode was 100 times higher than in the refined aluminum after about 30 h of electrolysis. In this technique, one can obtain an Al–Pt alloy with 10–20 wt.% of Pt, which should be further extracted by known hydrometallurgical methods [22] or by molten salt electrolysis.
Since the electrochemical process seems attractive for zero-waste and energy-efficient recovery of precious metals from spent catalysts, the understanding of aluminum reduction mechanism and kinetics becomes important to provide the recovery with high productivity. The cathode process of aluminum reduction on tungsten as a working electrode was previously studied in the LiF–AlF3–CaF2 melt with the addition of various amounts of spent Pt/Al2O3 catalyst [10]. The results indicated that the cathodic process had mixed kinetics with the diffusion coefficients of aluminum ions varying in the range (0.36–11.56)10–8 cm2·s–1, which is extremely low for molten salts. The obtained results indicated that the mechanism of aluminum reduction in the LiF–AlF3-based melts is not completely understood.
The present work is devoted to enhancing the understanding of the electrochemical behavior of aluminum in the LiF–AlF3 melt with various compositions in the presence of the spent catalyst at 740–800 °C. The tungsten rod was used as an electrode because the material possesses high chemical stability towards liquid aluminum and the cathode process on tungsten has been widely studied in fluoride and chloride melts [23,24,25,26,27,28].
The reduction of aluminum on tungsten begins at potentials more negative than 0 V in KF–AlF3–Al2O3 (vs. Al reference electrode) [25] and about −0.6 V in NaF–AlF3–Al2O3 (vs. W reference electrode) [26]. In both cases, there was a peak related to Al–W compound formation observed in the cyclic voltammograms. In the NaF-based melt, there were two close cathodic peaks most likely indicating the stepwise nature of the cathode process where the two-electron discharge is followed by the one-electron discharge. In the KF-based melt, there was a single cathodic peak related to aluminum electroreduction; however, this peak was rather wide. One of the possible explanations was the discharge of aluminum from the different electroactive ions [24]. The peak current densities of aluminum reduction at a scan rate of 0.1 V·s–1 were about 0.78 [24] and 0.24 A·cm–2 [26] in the KF-based (at 715 °C) and the NaF-based (at 860 °C) melts, respectively. The electrolysis of KF–AlF3–Al2O3 melts at 750 °C should be carried out at a cathode current density not higher than 0.35–0.50 A·cm−2. One of the reasons for the formation of the limiting current flat and the peak on the voltammograms is the partial salt passivation of the cathode.
In experiments performed in the NaF-based melts with cathode current densities up to 0.45·A·cm−2, the current efficiency reached 83.5%, and an increase in cathode current density to 0.7–0.8 A·cm−2 led to the formation of a solid conductive salt crust on the cathodes.
The aluminum reduction in the KF-based melts was considered [24] the irreversible process of the electroactive particle discharge, which may be due to slow charge transfer, preceding or subsequent chemical reactions, adsorption phenomena and also slow phase formation. The reduction of Al4W alloy and the deposition of metallic Al in the NaF-based melts were both considered [26] diffusion-controlled and quasi-reversible. Tao et al. [29] came to the conclusion that the formation of Al4W in the NaF–KF–AlF3–Al2O3 melts is predominantly controlled by mass transport while the deposition of aluminum is primarily controlled by charge transfer. The diffusion coefficient of Al(III) ions found in [26] was 1.77 × 10⁻⁸ cm2·s−1, which is rather low compared to the value 3.34 × 10⁻⁶·cm2·s−1 (even though the temperature was 110° lower) obtained by Liu et al. [30] who also stated that the aluminum reduction in the KF–AlF3 melt is diffusion-controlled. Al4W alloy existed on the electrode surface and was tightly attached to the tungsten electrode surface after potentiostatic electrolysis.
Lithium fluoride-based melts are widely used as electrolytes for the electrodeposition of metals [31,32,33] from their oxides due to a reasonably high solubility [34]. Low-temperature electrolysis is attractive due to lower energy consumption and higher corrosion resistance of electrodes and lining. Eutectic LiF–AlF3 has a liquidus temperature below 700 °C. At a relatively low temperature, the LiF–AlF3 melt has a better electrical conductivity compared to the NaF–AlF3 and the KF–AlF3 systems. Alumina has the least solubility in the LiF–AlF3 melt compared to the other two [34,35]. It was found that the maximum solubility in the LiF–AlF3 melt (unlike in the other two) is reached at the cryolite ratio ( [ LiF ] [ AlF 3 ] , mol · mol 1 ) equal to 2.0, which corresponds to the eutectic composition and indirectly indicates that alumina dissolves as Al2OF62− according to the reaction:
Al 2 O 3 + 4 AlF 5 2 = 3 Al 2 OF 6 2 + 2 F
The confirmation of this statement was obtained with Raman spectroscopy [34]; however, Rakhmatullin et al. [36] pointed out that Al2O2F44– is formed after the addition of MgO to the LiF–AlF3 melt that would result in maximum solubility at CR = 3.0. The experimental values of Al2O3 solubility vary between 1.5–3.5 wt.% (approx.) in the temperature range of 750 to 850 °C at CR = 2.0 [34]. The LiF–AlF3 melts also demonstrated good performance in the aluminum refinery studies [37,38]. The reduction kinetics of Al from the spent catalyst in molten salts has been poorly examined, and studying its electrochemical behavior in various molten salts can promote understanding of the recovery parameters for the PGM. The intention of this work is to:
  • Improve the understanding of the mechanism and kinetic parameters of different electroactive ions (of monovalent and trivalent aluminum) in the LiF–AlF3 melts of various compositions;
  • Fill the gap in knowledge of diffusion coefficients of Al ions in the LiF–AlF3 melts and the LiF–AlF3–Al2O3 melts with two compositions (85–15 mol.% and 64–36 mol.%), at two concentrations of spent catalyst (2.5 and 5.0 wt.%) and four temperatures (740, 760, 780 and 800 °C);
  • Tighten the connection between the experimental data and theoretical representation of electrochemical processes in molten salts.

2. Experiment

2.1. Laboratory Setup

The electrochemical measurements were performed in a three-electrode graphite cell heated by an electric furnace. The cell design and the experimental procedure were similar to the one in [10]. A tungsten (W) rod of 2 mm diameter with an active surface of 0.659 cm2 was the working electrode. The graphite crucible acted as a counter electrode. The reference electrode was made of liquid aluminum placed in a boron nitride closed-end tube with a 2 mm diameter tungsten rod that acted as a lead for circuit connection. The capillary was drilled at the bottom of the BN tube to provide a connection between the liquid aluminum and the molten salt. The reference electrode standard potential was –1.412 V at 740 °C. The experiments were performed at a temperature range between 740 and 800 °C. The electrodes were connected to the Autolab PGSTAT302n (MetrOhm Autolab B.V., Utrecht, The Netherlands). The Nova 2.1.2 software (MetrOhm Autolab B.V., Utrecht, The Netherlands) was used to apply and record the potential and the current. Cyclic voltammetry (CV) and chronoamperometry techniques were performed. CV was performed with a sweep rate between 0.01 and 0.05 V·s–1. The scanning ranges in most cases were from −0.55 to +0.40 V vs. AlF3/Al. The reduction process took place initially, and it was followed by the oxidation process. The resistance was determined with the i-interrupt technique, and IR compensation was performed.
In the chronoamperometry technique, the process was performed by applying the Al reduction peak potential obtained from the CVs and shifted with 0.05 V (negative and positive) to calculate the diffusion coefficient. The experimental values were compared to theoretical ones. The temperature of the cell was measured using a k-type thermocouple and maintained constant (±2 K) using the USB-TC01 thermocouple module.

2.2. Electrolyte Preparation

The melt was synthesized using individual reagent-grade salts LiF and AlF3 supplied by Reachim (Russia). The salts were dried for 4 hours at 200 °C before the experiment. The petroleum R-56 spent catalyst (SC) supplied by KRASTSVETMET (Russia) had the composition 93.70 wt.% γ–Al2O3, 0.25Pt, 6.0LOI (loss on ignition), 0.05 rest. The SC was roasted in the electric furnace at 800 °C under an air atmosphere for 30 min with manual stirring to remove organic compounds and residual water. After roasting, the SC was ground to the particle size of 5–15 μm. The weight of the melt in the cell was 200 g. The electrolyte was heated to operating temperature then purified using the graphite electrode at 0.2 V (vs. the Al3+/Al potential) for 2 h. The experiments were performed for the following parameters shown in Table 1.
The concentration of Alz+ species that came from AlF3 is 0.0089 and 0.0087 mol·cm−3 at SC content 2.5 and 5.0 wt.%, respectively, at 740 °C. An addition of 2.5 wt.% of SC increases it approximately by 0.0010 mol·cm−3.

3. Results and Discussion

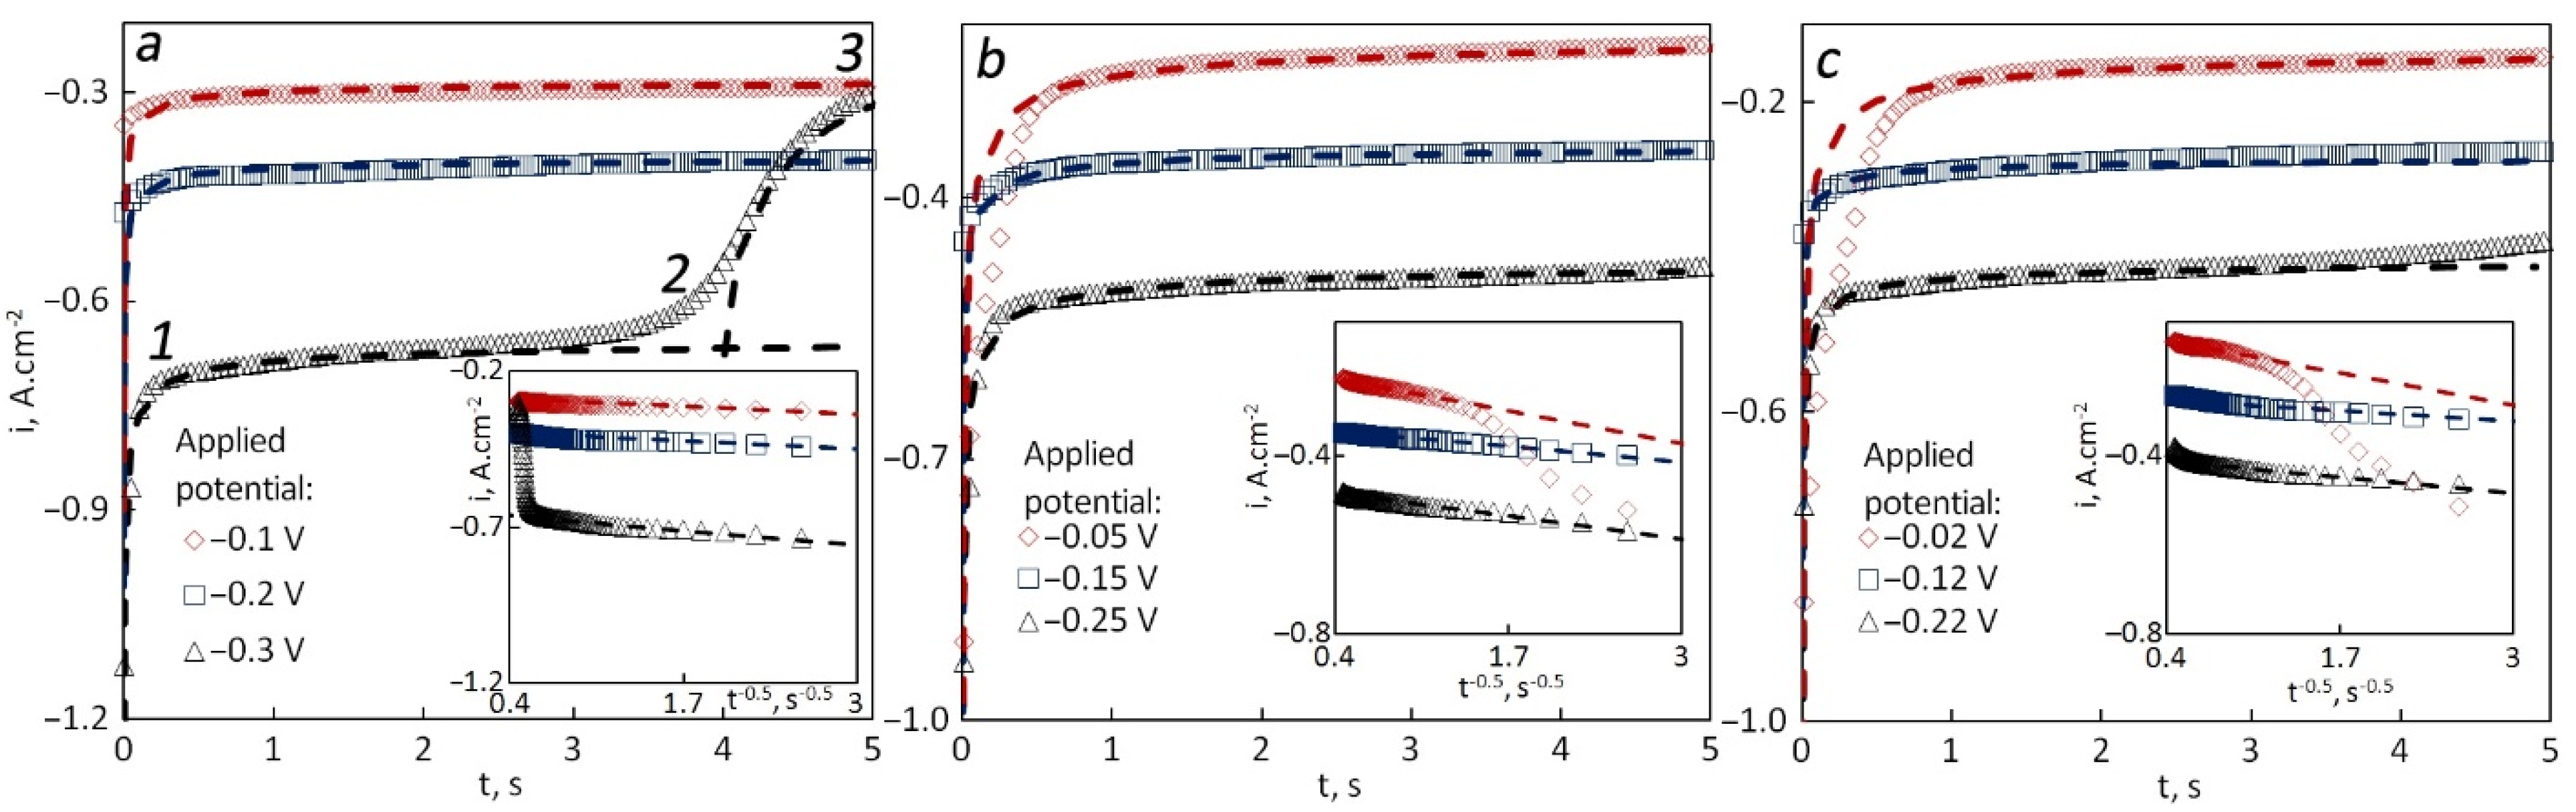
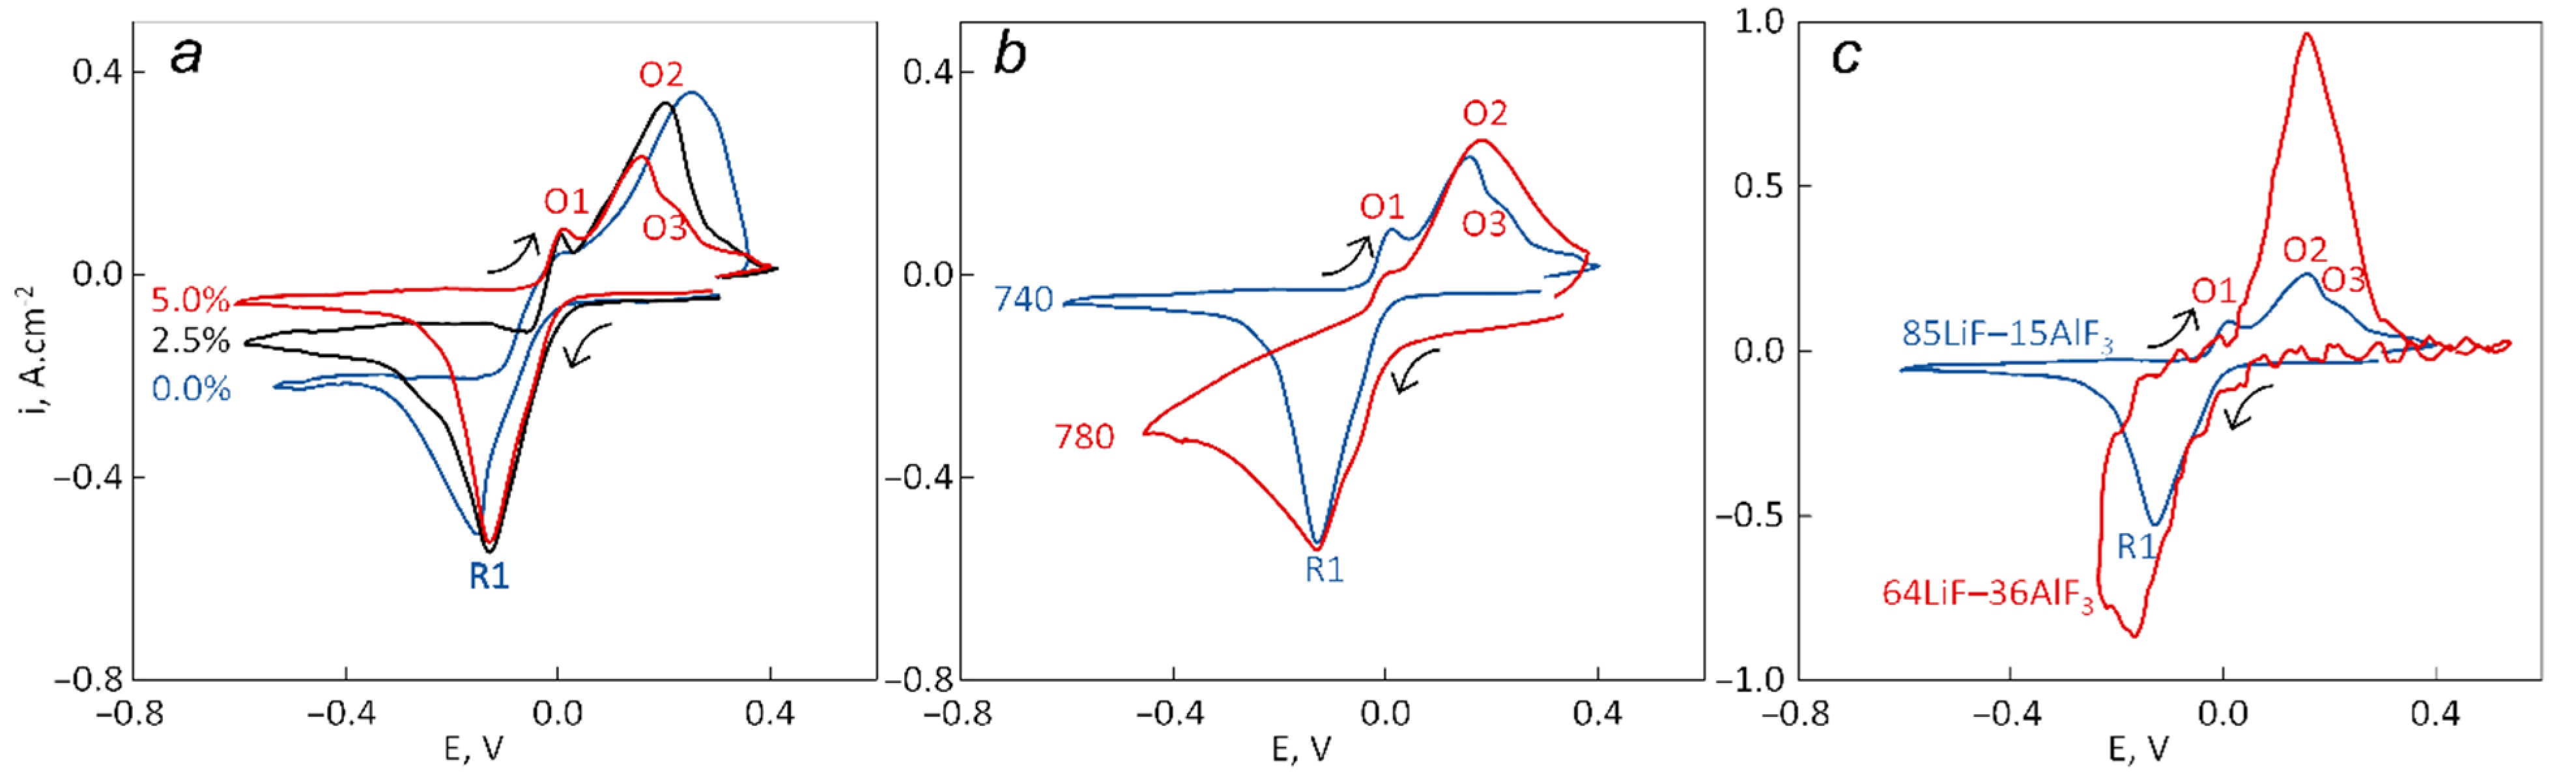
3.1. Effect of Catalyst Content

The content of catalysts in the melt directly determines the concentration of dissolved alumina. Alumina interacts with the fluoride melt and forms complex Al–O–F ions increasing the viscosity and decreasing the electrical conductivity of the melt. The presence of complex ions affects the mass-transport parameters; thus, it reduces the dissolution rate of spent catalyst in the melt and reduces the diffusion coefficients of electroactive species transport towards an electrode. The reduction of aluminum occurs from both oxyfluoride and fluoride ions at the same time. To study the effect of catalyst content on the cathodic process the cyclic voltammetry was performed over the pure 85LiF–15AlF3 melt and after the addition of 2.5 and 5.0 wt.% of catalyst as shown in Figure 1.
From the cyclic voltammograms (CVs), it is visible that aluminum ion reduction started at ~0 V in the pure melt and slightly shifted positively after the addition of the catalysts. The same applies to the cathodic peak R2 potentials. This peak is related to aluminum reduction as well as the R3 wave observed on some of the CVs. The R1 peak was observed in the CV recorded at 50 mV·s–1 sweep rate in the pure melt. The nature of this peak is not clear. In the upper left corners of CVs, the cathodic peak current densities icp were plotted versus the square root of the sweep rate. For a diffusion-controlled process, this dependence should be linear, which is observed neither in the current study nor in previous publications [10]. Even in the case of linearity being observed, the experimental data often do not agree with theoretical predictions made with the Randles–Sevcik equation (the slope and the intercept are different):
j cp = 0.4463 ( zF ) 3 / 2 C ( ν D RT ) 1 / 2
where z is the number of electrons transferred, F is Faraday’s constant (F = 96485 C·mol−1), C is the concentration of electroactive particles (mol·cm−3), ν is the sweep rate (V·s–1), D is the diffusion coefficient (cm2·s–1), R is the universal gas constant (8.314 J·mol–1·K–1) and T is the temperature (K).
Further evidence of a diffusion-control process is the absence of any dependence between the cathodic peak potential and the sweep rate (placed in the bottom right corner from CVs), which often is also not observed.
It seems that both cathodic peak R2 and wave R3 relate to aluminum reduction, but one is responsible for the discharge of the Al3+ ion with two-electron transfer and the other for discharge of Al+ and one-electron transfer. The anodic part of each CV had at least two peaks, O2 and O3, responsible for the oxidation of Al(0) and Al+. In some cases, O1 and O4 peaks were also detected. The O4 peak (or wave) relates to the oxidation of aluminum from Al–W alloy while the nature of O1 is not clear.
Both the one-electron and the two-electron processes being parallel affected the cathodic peak R2. Al3+ and Al+ species had different concentrations and diffusion coefficients (due to different ionic radii, mobility and charge). Each of these parallel processes has its partial current density, which may change during the polarization depending on sweep rate and time. In the icp–ν 0.5 plot, two theoretical lines were placed for z = 1 and z = 2. It is seen that experimental data are shifted from one line (z = 1) to another (z = 2) showing that the partial current density of the two-electron process is increasing with an increase in the sweep rate. That may indicate the abundance of Al3+ ions before the polarization. At high sweep rates, the time passed before the R2 peak is too short to accumulate enough Al+ ions, which may affect the peak current density.
The two-step reaction involving complex oxyfluoride ions described by Machado et al. [39] can be described by the equations:
[Al3OF11]4– + 2e = [AlF2] + [Al2OF8]4– + F
[AlF2] + e = Al(l) + 2F
[Al2OF8]4– + [AlF4] = [Al3OF11]4– + F
If no oxyfluorides are involved, then Equation (3) can be replaced by:
[AlF4] + 2e = [AlF2] + 2F
Kinetic parameters obtained from the first series of experiments are presented in Table 2.
The content of the catalyst affected the kinetic parameters. At 2.5 wt.%, the peak current densities had the highest values among all three experiments. The slope of the line on the Ecp–ln(ν) increased with an increase in the SC content. For z = 1, the diffusion coefficients were in the range of 0.4 × 10⁻⁶ to 6.5 × 10⁻⁶ cm2·s–1 and decreased with an increase in the SC content. For z = 2, the values varied from 4.0 × 10⁻⁷ to 1.5 × 10⁻⁶ cm2·s–1 with the highest value observed at 2.5 wt.% of SC in the melt. The appearance of two parallel reactions with the fluctuating partial current densities made it difficult to establish the reliability of the obtained parameters. Chronoamperometry was additionally performed to understand the reduction mechanism.
Three potentials were applied where one was the cathodic peak potential; the other two were shifted 100 mV negative and positive as shown in Figure 2. A clear plateau current can be seen in some of the chronopotentiograms, while in others, the steady state was not reached. After the steady state is achieved, the ions are delivered to the cathode in a free convection mode.
The current density was plotted vs. t–0.5 (where t is the time) to confirm that the electrode process was diffusion-controlled. The plots were placed in the bottom right corners from the chronopotentiograms. If the current density is linearly dependent on the reciprocal square root of the time, then the process is considered diffusion-controlled according to the Cottrell behavior [40]. The theoretical values of current density (dashed lines) were calculated by the Cottrell equation:
i = zFCD 0.5 ( π t ) 0.5
C = ( ω AlF 3 M AlF 3 + 2 ω Al 2 O 3 M Al 2 O 3 ) ρ bath
where i is the current density (A·cm–2), ω AlF 3 is the mass fraction of AlF3 (g·g–1) ( mass AlF 3 mass bath ) , ω Al 2 O 3 is the mass fraction of Al2O3 (g·g–1) ( mass Al 2 O 3 mass bath ) , M AlF 3 is the molar mass (g·mol−1), M Al 2 O 3 is the molar mass (g·mol–1) and ρ bath is the bath density (g·cm–3) [41].
The steady-state current density decreased with a shift of the applied potential from the negative to the positive side in all cases except for one curve obtained in the pure melt at −0.3 V where two sections 1–2 and 2–3 were observed. The first one fits the theoretical curve calculated with z = 1, D = 1.5 × 10⁻⁷ cm2·s−1 and C = 0.0017 mol·cm−3, while the second one fits z = 2, D = 0.7 × 10⁻⁷ cm2·s−1 and C = 0.0083 mole·cm−3. The reason is that initially, the melt contained sufficient quantities of Al+ ions, and the applied potential was negative enough to enable the discharge of mentioned ion. After the concentration of Al+ ions decreased, the current dropped, and the one-electron process became dominant. The total concentration of Al ions calculated from the amount of AlF3 added was close to the sum of concentrations of Al+ and Al3+ assumed for theoretical curves (0.00916 vs. 0.01 mol·cm−3), but the diffusion coefficients were much lower. The concentration of electroactive species should be considerably reduced to obtain higher diffusion coefficients via the calculation. That may indicate that not all added Al ions should be considered electroactive, although the chemical potentials of Al3+ in different complexes should rather be considered equal.
As for the rest of chronoamperograms, there is a single section on them, but the i–t−0.5 dependence obtained at the most positive potentials shows the transition between two processes. There is a change in partial current densities of the one-electron and the two-electron processes. In the graphs obtained in the melts with 2.5 and 5.0 wt.% of SC, both theoretical curves were calculated for z = 1.8, D = 0.8 × 10⁻⁷ cm2·s−1 and C = 0.002 mol·cm−3. The theoretical curves fit the late part of the curve (1–5 s) but for the early part (0–1 s), the effect of the one-electron discharge is non-negligible. For a better understanding of the reduction mechanism, similar experiments were performed at different temperatures (760, 780 and 800 °C).

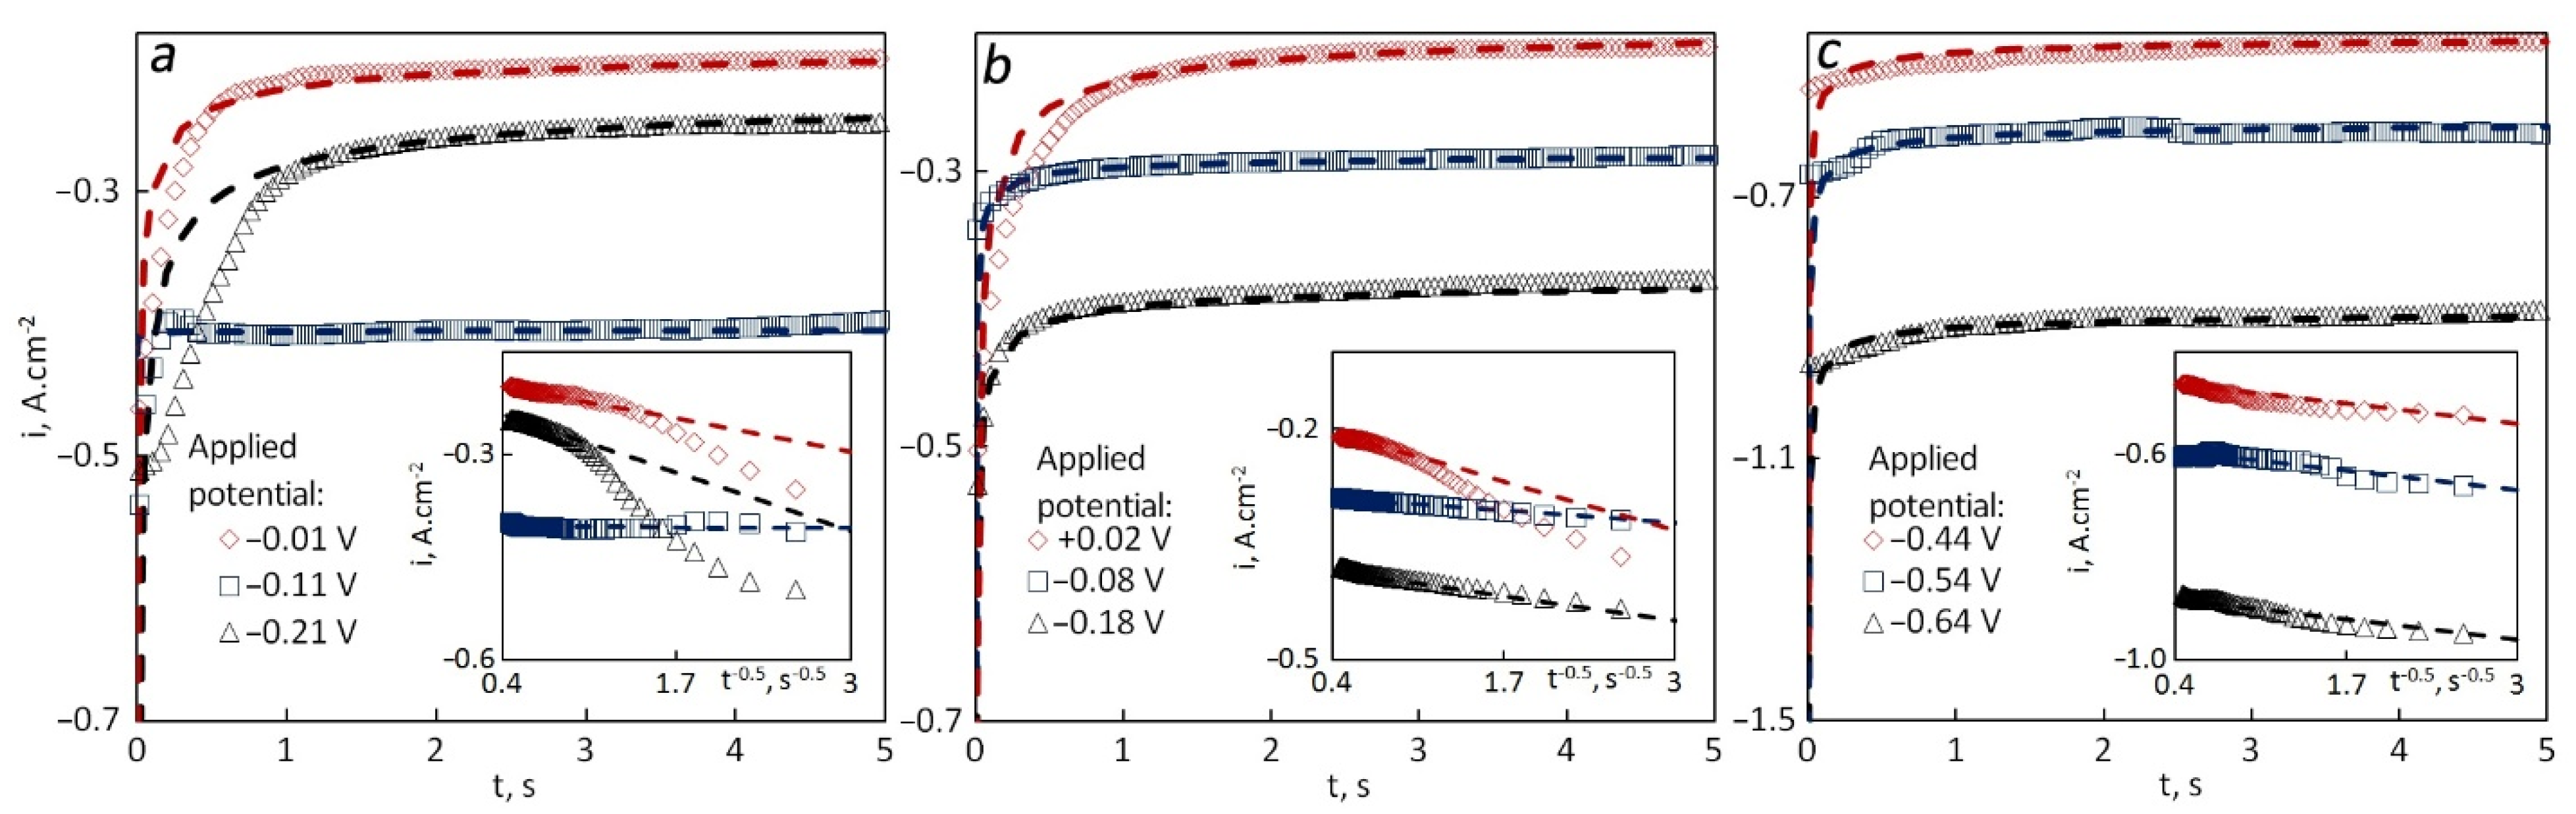
3.2. Effect of Temperature

CVs were recorded for a similar electrode in the same electrolyte containing 5 wt.% of SC as shown in Figure 3.
Similar reduction and oxidation peaks were observed after the temperature was increased. An increase in the temperature from 760 to 780 °C led to a shift of the cathodic peak potentials towards a positive side. CVs recorded at 800 °C were quite different when compared to lower temperatures in terms of the peak potentials and current densities. Despite that, the diffusion coefficients were calculated for reference. The dependencies of cathodic peak current densities vs. the square root of the sweep rate were close to linear but deviated from the theoretical line. The experimental values fluctuated between two lines representing the one-electron and the two-electron processes. The estimated diffusion coefficients for both processes increased with an increase in the temperature from 760 to 800 °C.
The diffusion coefficients for the one-electron process were much higher than those related to the two-electron process which is similar to what was observed at 740 °C at different catalyst content. The slope of the line on the Ecp–ln(ν) graph was increasing with an increase in the temperature. For a deeper understanding of the effect of temperature on the kinetic parameters, chronoamperograms were recorded under the same conditions as it is shown in Figure 4.
For all the cases except the one at 760 °C, the steady-state current density decreased with a shift of the applied potential towards positive values. At higher temperatures, the deviation between the experimental and the theoretical values was less than that at 740 and 760 °C. At 760 °C, the theoretical values were calculated with z changing from 1.8 at more negative potentials to 2 at E = −0.01 V. Diffusion coefficients were (1.4–3.6) × 10−7 cm2·s−1 and they increased with a shift of the applied potential to a negative side. The concentrations were around 0.001 mol·cm−3, while the amounts of added AlF3 and Al2O3 should have given the concentration of Al3+ at least 10 times higher. The experimental values obtained at the peak potential (=−0.11 V) were possible only at extremely low concentrations (10−5 mol·cm−3) or very low diffusion coefficients. An explanation of this phenomenon is yet to be found.
According to the chronoamperograms, the increase in the temperature led to the increase in the one-electron process dominance over the two-electron one. The reason might be an increase in the concentration of Al+ due to the dissolution of reduced aluminum with the temperature according to the reaction:
[AlF6] + 2Al(l) = 3[AlF2]
At a relatively high concentration of [AlF2] the disproportionation should occur and lead to deposition of liquid aluminum at a high rate. The theoretical values of the current densities at 780 °C were calculated with D = (1–2) × 10–7 cm2·s–1, and at 800 °C, they were around 3 × 10⁻⁷ cm2·s–1 at all the applied potentials. The concentration of electroactive species in all the cases was about 10 times lower than expected from the added amounts of AlF3 and Al2O3, which may be evidence that some of Al3+ is not available for the reduction at certain potentials. If so, the reason for that is yet to be discovered. It is worth noting that the steady-state current density increased with an increase in the temperature.
Studying the effect of the electrolyte composition in the reduction mechanism and kinetics is of both practical and theoretical importance because it would help to find the optimal conditions of the process of the spent catalyst treatment and also demonstrate how the concentration of Al3+ in the melt affects the electrochemical parameters.

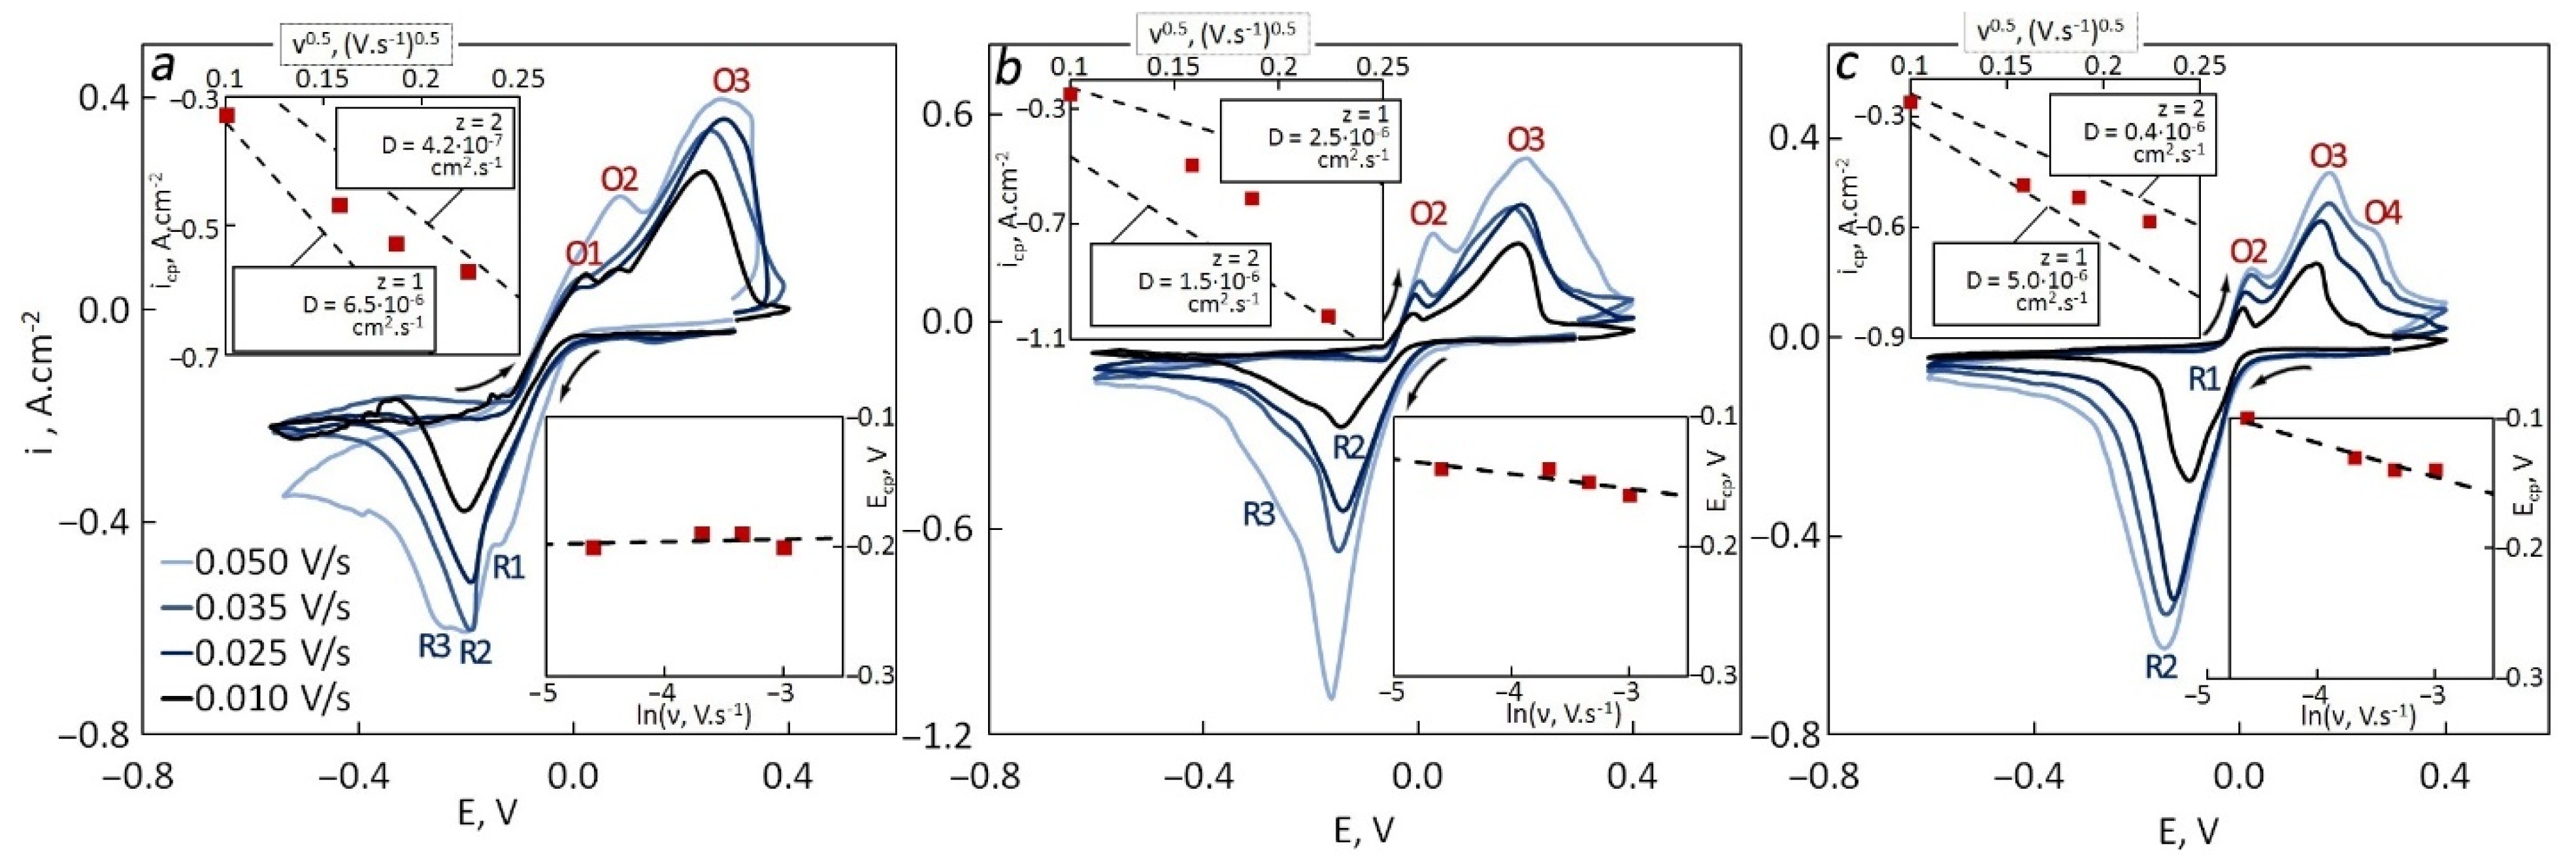
3.3. Effect of Electrolyte Composition

As an alternative to the 85LiF-15AlF3 melt, another eutectic composition 64LiF-36AlF3 apparently having higher alumina solubility [34] was chosen. The recorded CVs and chronoamperograms are shown in Figure 5.
CVs recorded in the 64LiF–36AlF3 melt have more fluctuations than those recorded in 85LiF-15AlF3, and the potentials were shifted negatively. The reason for shifted potentials may lie in the incorrect performance of the reference electrode, which apparently shifted positively towards tungsten potential. Nevertheless, the peak current densities can be determined and analyzed properly. At least one cathodic peak R1 related to aluminum reduction and one wave R2 associated with lithium reduction were observed at all temperatures. The reduction of lithium was assumed based on the standard electrode potential with respect to aluminum and previous articles [24,25]. The anodic peaks of aluminum O3 and lithium O1 oxidation are also present at all temperatures but not at all sweep rates. In one case, there is an additional anodic peak O2 found between O1 and O3. In all the cases, cathodic peak potentials shift negatively with an increase in the sweep rate, but unlike the results obtained in 85LiF–15AlF3, the slope was decreasing. The cathodic peak current densities fluctuated between the theoretical lines plotted for the one-electron (z = 1) and the two-electron (z = 2) processes. The diffusion coefficients for both z = 1 and z = 2 processes increased with the temperature except for T = 760 °C, and the values fluctuated from (2.20–3.80)–6 cm2·s–1 for z = 1 and (0.15–2.20)–6 cm2·s–1 for z = 2.
Unlike in the previous cases, the steady-state current densities obtained in chronoamperometry did not decrease with a shift of the applied potential towards positive values. At 740 and 760 °C, the behavior was atypical. In almost all the cases the deviation between the experimental and the theoretical values was lower. At 740 °C, the theoretical values were calculated with z changing from 1 to 2 at different applied potentials. With an increase in temperature, the lower value of z increased and was equal to 1.6 at 760 °C and 1.8 at 780 and 800 °C. The diffusion coefficients were (0.36–2.70) × 10–6 cm2·s–1, and they increased with an increase in the temperature. The maximum values of the diffusion coefficients were obtained at the applied potentials equal to the cathodic peak potentials. The concentrations of electroactive particles increased with a shift of the applied potential to more negative values, which indicates the potential window between the one-electron and the two-electron process.

3.4. Final Remarks

To obtain a deeper understanding of the influence of all parameters on the kinetic parameters of aluminum reduction, the recorded CVs were plotted on the same graphs as presented in Figure 6.
The addition of the spent catalyst as well as an increase in the temperature slightly increases the cathodic R1 peak current density as the concentration of aluminum ions increases in the first case and viscosity decreases in the second. The addition shifts the R1 peak potential towards positive values and the O2 peak potential towards negative values. The current of the plateau, which appears after this peak, decreases with an increase in the content of the spent catalyst and a decrease in the temperature. An increase in AlF3 content after changing the electrolyte composition from 85LiF–15AlF3 to 64LiF–36AlF3 naturally leads to a considerable increase in both the anodic (O2) and the cathodic peak currents. An increase in the temperature leads to an appearance of a visible wave in the cathodic side before the peak R1 that was not observed at 740 °C regardless of the content of the spent catalyst in the melt. The anodic wave O3 appears after the content of the spent catalyst reaches 5 wt.% and disappears after the increase in the temperature up to 780 °C. A residual current before the R1 peak is higher when the temperature is higher. All the estimated kinetic parameters were collected in Table 3.
In the 64LiF–36AlF3 melt (experiments 7–10), the diffusion coefficients obtained in chronoamperometry were in the range between the values obtained by cyclic voltammetry for z = 1 and z = 2. In the 85LiF–15AlF3 melt the values from AM were much lower than those obtained from CV.
The diffusion coefficients for z = 1 were higher than those for z = 2 at all temperatures and all catalyst concentrations. According to CV, in the 85LiF–15AlF3 melt, the diffusion coefficients were higher than those obtained in the 64LiF–36AlF3 melt, which may be the consequence of the high content of Li+ ions. If we compare the obtained diffusion coefficients with those predicted by the Stokes–Einstein equation:
D = k B T 6 π η r
where kB is the Boltzmann’s constant (1.3810–23 J·K–1); η is the dynamic viscosity (2.4–2.6 mPa·s roughly estimated from the data in [41]) and r is the ionic radius (~2.14 × 10⁻¹⁰·m for [AlF4] according to [42], then we can determine a noticeable disagreement between theoretical and experimental data. Equation (10) predicts the value 1.3910–5 cm2·s–1, and if we increase the ionic radius to 5.2 × 10⁻¹⁰ m which is observable for complex ions like [Bi6Cl20]2– related to other systems, we obtain D = 5.3 × 10⁻⁶ cm2·s–1. Only a few obtained values enter this range, which raises the question of whether much larger ions should be considered or further analysis of the cathode process mechanism must be carried out.

4. Conclusions

The results obtained in this study evidence that:
  • The aluminum reduction in the LiF–AlF3 melts is a diffusion-controlled two-step process;
  • Both the one-electron and the two-electron steps occur simultaneously at close potentials, which affects the cyclic voltammograms where only one clear cathodic peak may be observed;
  • In most cases, the diffusion coefficients of electroactive species for the one-electron process were (2.20–6.50) × 10–6 cm2·s–1, and for the two-electron process, they were (0.15–2.20)–6 cm2·s–1;
  • In most cases, the averaged diffusion coefficients obtained by the chronoamperometry were (0.17–2.70)–6 cm2·s–1;
  • The numbers of electrons used for calculations in chronoamperometry were in the range from 1.06 to 1.90 and connected to the partial current densities of two parallel processes;
  • The 64LiF–36AlF3 melt with about 2.5 wt.% of the spent catalysts seems a better electrolyte for the catalyst treatment in terms of cathodic process and alumina solubility, while the range of temperatures from 780 to 800 °C is applicable.
The mechanism of aluminum reduction seems very complicated and deserves further study to find the optimal process parameters for aluminum reduction during the spent catalyst treatment and the primary metal production as well.

Author Contributions

Conceptualization, A.Y. and P.P.; funding acquisition, P.P.; investigation, S.K.P., D.V. and A.Y.; methodology, A.Y. and D.F.; supervision, P.P. and B.F.; writing—original draft, A.Y., S.K.P. and S.S. All authors have read and agreed to the published version of the manuscript.

Funding

The reported study was funded by RFBR according to the research project No. 18-29-24122.

Institutional Review Board Statement

Not applicable.

Informed Consent Statement

Not applicable.

Data Availability Statement

The data presented in this study are available on request from the corresponding author.

Conflicts of Interest

The authors declare no conflict of interest.

References

  1. Sie, S.T. Past Present and Future Role of Microporous Catalysts in the Petroleum Industry. Stud. Surf. Sci. Catal. 1994, 85, 587–631. [Google Scholar]
  2. Che Lah, N.A. Late transition metal nanocomplexes: Applications for renewable energy conversion and storage. Renew. Sustain. Energy Rev. 2021, 145, 111103. [Google Scholar] [CrossRef]
  3. Karakovskaya, K.I.; Dorovskikh, S.I.; Vikulova, E.S.; Ilyin, I.Y.; Zherikova, K.V.; Basova, T.V.; Morozova, N.B. Volatile iridium and platinum mocvd precursors: Chemistry, thermal properties, materials and prospects for their application in medicine. Coatings 2021, 11, 78. [Google Scholar] [CrossRef]
  4. Haghlesan, A.; Alizadeh, R. Reactivation of an industrial spent catalyst as an environmental waste by ultrasound assisted technique for using in styrene production. Chem. Eng. Process. 2016, 110, 64–72. [Google Scholar] [CrossRef]
  5. Loreti, M.A.P.; Reis, M.T.A.; Ismael, M.R.C.; Staszak, K.; Wieszczycka, K. Effective Pd(II) carriers for classical extraction and pseudo-emulsion system. Sep. Purif. Technol. 2021, 265, 118509. [Google Scholar] [CrossRef]
  6. Thanh, L.H.V.; Liu, J.-C. Ion flotation of palladium by using cationic surfactants–Effects of chloride ions. Colloids Surf. A 2021, 616, 126326. [Google Scholar] [CrossRef]
  7. Monroy-Barreto, M.; Bautista-Flores, A.N.; Munguia Acevedo, N.M.; De San Miguel, E.R.; Gyves, J.D. Selective palladium(ii) recovery using a polymer inclusion membrane with tris(2-ethylhexyl) phosphate (TEHP). experimental and theoretical study. Ind. Eng. Chem. Res. 2021, 60, 3385–3396. [Google Scholar] [CrossRef]
  8. Cwudziński, A.; Gajda, B. Particle image velocimetry method for prediction hydrodynamic conditions during leaching process on the basis of Sn–NaOH system. Materials 2021, 14, 633. [Google Scholar] [CrossRef] [PubMed]
  9. Ding, Y.; Zheng, H.; Li, J.; Zhang, S.; Liu, B.; Ekberg, C.; Jian, Z. Recovery of Platinum from Spent Petroleum Catalysts: Optimization Using Response Surface Methodology. Metals 2019, 9, 354. [Google Scholar] [CrossRef] [Green Version]
  10. Padamata, S.K.; Yasinskiy, A.S.; Polyakov, P.V. The cathodic behavior of aluminum from Pt/Al2O3 catalysts in molten LiF-AlF3-CaF2 and implications for metal recovery from spent catalysts. J. Electrochem. Soc. 2021, 168, 013505. [Google Scholar] [CrossRef]
  11. Xolo, L.; Moleko-Boyce, P.; Makelane, H.; Faleni, N.; Tshentu, Z.R. Status of recovery of strategic metals from spent secondary products. Minerals 2021, 11, 673. [Google Scholar] [CrossRef]
  12. Dong, H.; Wu, Y.; Li, Y.; Zhao, J.; Wang, Y. Concentrating PGM from a PGM-Containing Ferroalloy by a Roast-Leach Process. Trans. Soc. Min. Metall. Explor. 2021, in press. [Google Scholar] [CrossRef]
  13. Viltres, H.; López, Y.C.; Leyva, C.; Gupta, N.K.; Naranjo, A.G.; Acevedo–Peña, P.; Sanchez-Diaz, A.; Bae, J.; Kim, K.S. Polyamidoamine dendrimer-based materials for environmental applications: A review. J. Mol. Liq. 2021, 334, 116017. [Google Scholar] [CrossRef]
  14. Lanaridi, O.; Sahoo, A.R.; Limbeck, A.; Naghdi, S.; Eder, D.; Eitenberger, E.; Csendes, Z.; Schnürch, M.; Bica-Schröder, K. Toward the Recovery of Platinum Group Metals from a Spent Automotive Catalyst with Supported Ionic Liquid Phases. ACS Sustain. Chem. Eng. 2021, 9, 375–386. [Google Scholar] [CrossRef]
  15. Nguyen, V.T.; Riaño, S.; Aktan, E.; Deferm, C.; Fransaer, J.; Binnemans, K. Solvometallurgical Recovery of Platinum Group Metals from Spent Automotive Catalysts. ACS Sustain. Chem. Eng. 2021, 9, 337–350. [Google Scholar] [CrossRef]
  16. Karim, S.; Ting, Y.-P. Recycling pathways for platinum group metals from spent automotive catalyst: A review on conventional approaches and bio-processes. Resour. Conserv. Recycl. 2021, 170, 105588. [Google Scholar] [CrossRef]
  17. Fajar, A.T.N.; Hanada, T.; Goto, M. Recovery of platinum group metals from a spent automotive catalyst using polymer inclusion membranes containing an ionic liquid carrier. J. Membr. Sci. 2021, 629, 119296. [Google Scholar] [CrossRef]
  18. Nicol, G.; Goosey, E.; Yildiz, D.S.; Loving, E.; Nguyen, V.T.; Riaño, S.; Yakoumis, I.; Martinez, A.M.; Siriwardana, A.; Unzurrunzaga, A.; et al. Platinum group metals recovery using secondary raw materials (platirus): Project overview with a focus on processing spent autocatalyst. Johns. Matthey Technol. Rev. 2021, 65, 127–147. [Google Scholar]
  19. Martinez, A.M.; Tang, K.; Sommerseth, C.; Osen, K.S. Extraction of Platinum Group Metals from Spent Catalyst Material by a Novel Pyro-Metallurgical Process. In Rare Metal Technology Minerals, Metals and Materials Series; TMS: Pittsburgh, PA, USA, 2021; pp. 101–113. [Google Scholar]
  20. Yasinskiy, A.; Polyakov, P.; Varyukhin, D.Y.; Padamata, S.K. Liquid Bipolar Electrode for Extraction of Aluminium and PGM Concentrate from Spent Catalysts. In 150th Annual Meeting & Exhibition Supplemental Proceedings; TMS: Orlando, FL, USA, 2021; p. 812. [Google Scholar]
  21. Yasinskiy, A.; Polyakov, P.; Moiseenko, I.; Padamata, S.K. Electrochemical Reduction and Dissolution of Aluminium in a Thin-Layer Refinery Process. In Light Metals; TMS: Orlando, FL, USA, 2021; p. 519. [Google Scholar]
  22. Granados-Fernández, R.; Montiel, M.A.; Díaz-Abad, S.; Rodrigo, M.A.; Lobato, J. Platinum Recovery Techniques for a Circular Economy. Catalysts 2021, 11, 937. [Google Scholar] [CrossRef]
  23. Dubrovskii, A.R.; Makarova, O.V.; Kuznetsov, S.A. Electrodeposition of tantalum coatings on nitinol stent and composition of intermetallic compounds forming during electrolysis. J. Electrochem. Soc. 2021, 168, 046518. [Google Scholar] [CrossRef]
  24. Nikolaev, A.Y.; Suzdaltsev, A.V.; Zaikov, Y.P. Cathode process in the KF–AlF3–Al2O3 melts. J. Electrochem. Soc. 2019, 166, D784–D791. [Google Scholar] [CrossRef]
  25. Suzdaltsev, A.V.; Nikolaev, A.Y.; Zaikov, Y.P. Towards the Stability of Low-Temperature Aluminum Electrolysis. J. Electrochem. Soc. 2021, 168, 046521. [Google Scholar] [CrossRef]
  26. Wei, Z.; Peng, J.; Wang, Y.; Liu, K.; Di, Y.; Sun, T. Cathodic process of aluminum deposition in NaF-AlF3-Al2O3 melts with low cryolite ratio. Ionics 2019, 25, 1735–1745. [Google Scholar] [CrossRef]
  27. Zhu, T.; Huang, W.; Gong, Y. Electrochemical separation of uranium from lanthanide (La, Eu, Gd) fluorides in molten LiCl-KCl. Sep. Purif. Technol. 2020, 235, 116227. [Google Scholar] [CrossRef]
  28. Li, J.; Ren, H.; Guo, F.; Lu, J.; Li, J.; Yang, Y. Research on the Electrochemical Behavior of Si(IV) on the Tungsten Electrode in CaCl2–CaF2–CaO Molten Melt. Russ. J. Non-Ferr. Met. 2018, 59, 486–492. [Google Scholar]
  29. Tao, S.; Peng, J.; Di, Y.; Liu, K.; Zhao, K.; Feng, N. Electrochemical Study of Potassium Fluoride in a Cryolite-Aluminum Oxide Molten Salt. Anal. Lett. 2015, 48, 371–381. [Google Scholar] [CrossRef]
  30. Li, D.; Yang, Z.; Li, W. Electrochemical Behavior of Graphite in KF–AlF3-Based Melt with Low Cryolite Ratio. J. Electrochem. Soc. 2010, 157, D417–D421. [Google Scholar] [CrossRef]
  31. Chen, Z.; She, C.; Zheng, H.; Huang, W.; Zhu, T.; Jiang, F.; Gong, Y.; Li, Q. Electrochemical deposition of neodymium in LiF-CaF2 from Nd2O3 assisted by AlF3. Electrochim. Acta 2018, 261, 289–295. [Google Scholar] [CrossRef]
  32. Li, B.; Li, S.; Kong, Y.; Chen, J.; Liu, K.; Han, Q. Dissolution Mechanism and Electrochemical Behavior of CeO2 in Molten CeF3-LiF-BaF2. Rare Met. Mater. Eng. 2020, 49, 749–754. [Google Scholar]
  33. Cvetković, V.S.; Vukićević, N.M.; Feldhaus, D.; Barudžija, T.S.; Stevanović, J.S.; Friedrich, B.; Jovićević, J.N. Study of Nd deposition onto W and Mo cathodes from molten oxide-fluoride electrolyte. Int. J. Electrochem. Sci. 2020, 15, 7039–7052. [Google Scholar] [CrossRef]
  34. Robert, E.; Olsen, J.E.; Danek, V.; Tixhon, E.; Østvold, T.; Gilbert, B. Structure and Thermodynamics of Alkali Fluoride-Aluminum Fluoride-Alumina Melts. Vapor Pressure, Solubility, and Raman Spectroscopic Studies. J. Phys. Chem. B 1997, 101, 9447–9457. [Google Scholar] [CrossRef]
  35. Peng, J.; Wei, Z.; Di, Y.; Wang, Y.; Sun, T. Alumina Solubility in NaF–KF–LiF–AlF3-Based Low-Temperature Melts. JOM 2020, 72, 239–246. [Google Scholar] [CrossRef]
  36. Rakhmatullin, A.; Michel, R.; Bessada, C. Structural characterization and chemistry of LiF–AlF3 melts with addition of MgO and MgF2. J. Fluor. Chem. 2021, 241, 109678. [Google Scholar] [CrossRef]
  37. Yasinskiy, A.; Padamata, S.K.; Stopic, S.; Feldhaus, D.; Friedrich, B.; Polyakov, P. Aluminium Recycling in Single- and Multiple-Capillary Laboratory Electrolysis Cells. Metals 2021, 11, 1053. [Google Scholar] [CrossRef]
  38. Yasinskiy, A.; Polyakov, P.; Yang, Y.; Wang, Z.; Suzdaltsev, A.; Moiseenko, I.; Padamata, S.K. Electrochemical reduction and dissolution of liquid aluminium in thin layers of molten halides. Electrochim. Acta. 2021, 366, 137436. [Google Scholar] [CrossRef]
  39. Machado, K.; Zanghi, D.; Salanne, M.; Stabrowski, V.; Bessada, C. Anionic Structure in Molten Cryolite-Alumina Systems. J. Phys. Chem. C 2018, 122, 21807–21816. [Google Scholar] [CrossRef]
  40. Bard, A.J.; Faulkner, R.L. Electrochemical Methods Fundamentals and Applications, 2nd ed.; John Wiley & Sons, Inc., Wiley Blackwell: Hoboken, NJ, USA, 2001; p. 864. [Google Scholar]
  41. Janz, G.J.; Gardner, G.L.; Krebs, U.; Tomkins, R.P.T. Molten Salts: Volume 4, Part 1, Fluorides and Mixtures Electrical Conductance, Density, Viscosity, and Surface Tension Data. J. Phys. Chem. Ref. Data 1974, 3, 1–115. [Google Scholar] [CrossRef]
  42. Simoes, M.C.; Hughes, K.J.; Ingham, D.B.; Ma, L.; Pourkashanian, M. Estimation of the Thermochemical Radii and Ionic Volumes of Complex Ions. Inorg. Chem. 2017, 56, 7566–7573. [Google Scholar] [CrossRef]
Figure 1. CVs recorded for tungsten in 85LiF–15AlF3 at 740 °C with different sweep rates and the dependencies of the cathodic peak current density vs. the square root of sweep rate (upper left) and the cathodic peak potential vs. the logarithm of sweep rate (bottom right) for different spent catalyst content: (a) 0 wt.%, (b) 2.5 wt.%, (c) 5 wt.%.
Metals 11 01431 g001
Figure 2. Chronoamperograms recorded for tungsten in 85LiF–15AlF3 at 740 °C at different applied potential and the dependencies of current density vs. time to the power −0.5 (bottom right) for different spent catalyst content: (a) 0 wt.%, (b) 2.5 wt.%, (c) 5 wt.%.
Metals 11 01431 g002
Figure 3. CVs recorded for tungsten in 85LiF–15AlF3 (with 5 wt.% of spent catalyst) with the dependencies of cathodic peak current density vs. square root of sweep rate (upper left) and cathodic peak potential vs. logarithm of sweep rate (bottom right) for different temperatures: (a) 760 °C, (b) 780 °C, (c) 800 °C.
Metals 11 01431 g003
Figure 4. Chronoamperograms recorded for tungsten in 85LiF–15AlF3 (with 5 wt.% of spent catalyst) at different applied potential and the dependencies of current density vs. time to the power −0.5 (bottom right) for different temperatures: (a) 760 °C, (b) 780 °C, (c) 800 °C.
Metals 11 01431 g004
Figure 5. CVs (ad) and chronoamperograms (eh) recorded for tungsten in 64LiF–36AlF3 (with 5 wt.% of spent catalyst) with the dependencies of cathodic peak current density vs. square root of sweep rate, cathodic peak potential vs. logarithm of sweep rate and current density vs. time to the power −0.5 for different temperatures: (a,e) 740 °C, (b,f) 760 °C, (c,g) 780 °C, (d,h) 800 °C.
Metals 11 01431 g005
Figure 6. Comparison of the CVs recorded for tungsten at a scan rate of 0.025 V·s−1: (a) in 85LiF–15AlF3 at 740 °C (with 0–5 wt.% of spent catalyst); (b) in 85LiF–15AlF3 at 740 and 780 °C with 5 wt.% of spent catalyst; (c) in 85LiF–15AlF3 and 64LiF–36AlF3 at 740 °C with 5 wt.% of spent catalyst.
Metals 11 01431 g006
Table 1. Composition and properties of studied systems (θ is the temperature, SC is the spent catalyst content, ρ is the density, CAlz+ is the concentration of Al ions).
Exp #Composition, mol.%θ, °CSC, wt.% ρ , g cm−3CAlz+, mol·cm−3
185LiF–15AlF37400.02.1150.00916
285LiF–15AlF37402.52.1150.00971
385LiF–15AlF37405.0 (sat.)2.1150.01077
485LiF–15AlF37605.0 (sat.)2.1020.01070
585LiF–15AlF37805.0 (sat.)2.0880.01064
685LiF–15AlF38005.0 (sat.)2.0750.01057
764LiF–36AlF37405.0 (sat.)2.1620.01790
864LiF–36AlF37605.0 (sat.)2.1410.01773
964LiF–36AlF37805.0 (sat.)2.1200.01756
1064LiF–36AlF38005.0 (sat.)2.1000.01739
Table 2. Kinetic parameters of Al reduction at W electrode in the 85LiF-15AlF3 melts with varying spent catalyst content at 740 °C.
ν, V·s–1ν0.5, (V·s−1)0.5ln (ν)icp, A·cm–2Ecp, V
Experiment 1 (0 wt.% of SC)
0.0100.10–4.60–0.379–0.20
0.0250.16–3.69–0.511–0.19
0.0350.19–3.35–0.571–0.19
0.0500.22–3.00–0.606–0.20
Experiment 2 (2.5 wt.% of SC)
0.0100.10–4.60–0.304–0.14
0.0250.16–3.69–0.547–0.14
0.0350.19–3.35–0.663–0.15
0.0500.22–3.00–1.091–0.16
Experiment 3 (5.0 wt.% of SC)
0.0100.10–4.60–0.287–0.10
0.0250.16–3.69–0.525–0.13
0.0350.19–3.35–0.558–0.14
0.0500.22–3.00–0.625–0.14
Table 3. Diffusion coefficients, number of electrons and concentration of Alz+ species calculated from the cyclic voltammetry and amperometry (AM) data.
Exp #D(z = 1)∙10–6, cm2·s–1D(z = 2)∙10–6, cm2·s–1D(AM)∙10–6, cm2·s–1z(AM)CAlz+ (AM), mol·cm–3
16.500.400.241.650.0035
22.501.500.181.600.0020
35.000.400.041.600.0020
43.200.180.281.870.0007
53.400.220.171.330.0009
6 *65.003.000.301.060.0010
72.800.220.361.600.0097
82.200.150.461.870.0055
93.500.261.901.900.0013
103.802.202.701.870.0010
* Data from CVs seem atypical.
Publisher’s Note: MDPI stays neutral with regard to jurisdictional claims in published maps and institutional affiliations.

