Article

Full Variation of Site Substitution in Ni-Mn-Ga by Ferromagnetic Transition Metals

1
Institute of Physics of the Czech Academy of Sciences, Na Slovance 1999/2, 182 21 Prague, Czech Republic
2
Faculty of Nuclear Sciences and Physical Engineering, Czech Technical University in Prague, Břehová 7, 115 19 Prague, Czech Republic
3
Faculty of Mathematics and Physics, Charles University, Ke Karlovu 5, 121 16 Prague 2, Czech Republic
*
Author to whom correspondence should be addressed.
Metals 2021, 11(6), 850; https://doi.org/10.3390/met11060850
Submission received: 14 April 2021 / Revised: 11 May 2021 / Accepted: 17 May 2021 / Published: 21 May 2021
(This article belongs to the Special Issue Recent Development in Magnetic Shape Memory Alloys)

Abstract

:
Systematic doping by transition elements Fe, Co and Ni on each site of Ni2MnGa alloy reveal that in bulk material the increase in martensitic transformation temperature is usually accompanied by the decrease in ferromagnetic Curie temperature, and vice versa. The highest martensitic transformation temperature (571 K) was found for Ni50.0Mn25.4(Ga20.3Ni4.3) with the result of a reduction in Curie temperature by 55 K. The highest Curie point (444 K) was found in alloy (Ni44.9Co5.1)Mn25.1Ga24.9; however, the transition temperature was reduced to 77 K. The dependence of transition temperature is better scaled with the Ne/a parameter (number of non-bonding electrons per atom) compared to usual e/a (valence electrons per atom). Ne/a dependence predicts a disappearance of martensitic transformation in (Ni45.3Fe5.3)Mn23.8Ga25.6, in agreement with our experiment. Although Curie temperature usually slightly decreases while the martensitic transition increases, there is no significant correlation of Curie temperature with e/a or Ne/a parameters. The doping effect of the same element is different for each compositional site. The cascade substitution is discussed and related to the experimental data.

1. Introduction

The magnetic shape memory (MSM) effect or magnetically induced reorientation (MIR) observed mostly in Ni-Mn-Ga Heusler alloys provides up to 12% deformation induced by moderate magnetic fields of less than 1 T [1,2]. To obtain this multiferroic behaviour, the material must be ferromagnetic and exhibit martensitic transformation to a ferroelastic state. Moreover, to obtain MIR, the twin boundaries formed upon transition have to be highly mobile [3,4,5,6,7].
Although the MSM phenomenon is extraordinary and unique among all known metallic alloys, there are important issues which hinder its transfer from basic research toward applications. One of the main issues is a temperature limit below which the effect can be utilized. There are two limiting temperatures, the martensitic transformation temperature (Tm) and the Curie temperature (TC), since the magnetically induced reorientation effect relies on a high magnetic anisotropy in the martensite ferromagnetic state. Thus, apart from increasing transformation temperatures, the high mobility of twin boundary and high magnetocrystalline anisotropy must be maintained.
Early studies of ternary Ni-Mn-Ga showed that Tm and TC are in competition with each other [8,9,10,11]. Increasing the concentration of Mn at the expense of Ga (Ni50Mn25+xGa25-x) increases Tm but decreases TC until the Curie temperature of the martensitic phase becomes smaller than Tm, at about 7 at. % extra Mn [12,13]. Similar behaviour was found for the Ni50+yMn25-yGa25 system [10]. One way or another, the MSM effect seems to be limited to 353 K at best for the strictly ternary Ni-Mn-Ga alloy [14], which is low, considering the operating condition required by many potential applications, e.g., in the automotive industry.
Since the transition temperatures cannot be increased enough by composition variation within the ternary alloy, a large effort is devoted to increase both temperatures by adding more elements into the alloy. Dopants are usually picked from the class of transition metals, e.g., Cr, Fe, Co and Cu [15,16,17,18,19] or the same group of elements, as Ga is often replaced by In [20] or Sn [21,22,23]. However, in such kind of substitution, the fulfilment of the conditions for the MSM effect is commonly ignored.
The majority of published papers have reported the substitution of just one of the elements in the parent alloy, i.e., Ni, Mn or Ga, and thus the full potential of the multiple dopants remains hidden. An exception is the work of Soto-Para et al. [15] in which they selectively substituted Fe or Co for each original element of Ni-Mn-Ga. However, the Fe-doped alloys were based on a parent composition of Ni53Mn22Ga25, and the Co-doped parent composition was Ni50Mn25Ga25 (at. %). Although the off-stoichiometry of Fe doped alloys was chosen in order to improve the already high transition temperatures, the effect of Fe itself on the alloy and the compositional doping site is difficult to compare with the doped stoichiometry alloys. Recently, Armstrong et al. used a systematic doping approach, by a few atomic percent of Cu and Fe doping on Ni and Mn sites, in an attempt to increase the transformation temperatures while retaining the 10 M modulated structure [24].
In summary, despite the broadness of the existing literature, there is no simple and systematic approach to transition metal doping or alloying. Moreover, due to different preparation methods, high sensitivity to the precise composition and often not well-defined chemical analyses, it is very difficult to compare results from different authors and to obtain reasonable extrapolations and estimations. In addition, there is an apparently non-monotonous dependence of transformation temperatures on doped element concentration. A strong sensitivity to various often not well-defined parameters, and a necessity to retain specific properties to achieve MSM effects, cause large difficulties for reliable ab-initio predictions [24,25,26].
In this work, we selected the stoichiometric Ni2MnGa as the initial composition to obtain a well-defined baseline and doped it with three ferromagnetic transition metals. We used the same doping amount of 5 at. %, which is a convenient amount for a direct comparison with calculations, laying between the substitution of one (3.125 at. %) and two atoms (6.25 at. %) of a 2 × 2 × 2 supercell commonly used in theoretical modelling. Each original element was substituted by X = Fe, Co, Ni, resulting in a series (Ni45X5)Mn25Ga25, Ni50(Mn20X5)Ga25, Ni50Mn25(Ga20X5) (at. %). In this way, we obtained a set of nine alloys, one of them stoichiometric Ni2MnGa.
In order to simplify the discussion on the effect of doping, we assume that the atom replacement is ideal. Although the doping changed the electronic concentration moderately, we found dramatic changes in martensitic temperatures, while the Curie point was affected much less. Moreover, the selective doping revealed a surprisingly strong site dependence. The complete data sets for all nine alloys can serve as a reference point for advanced ab-initio calculations.

2. Materials and Methods

All the investigated alloys were prepared by the same procedure. Elements with purity of at least 99.9% were arc-melted several times, to ensure good mixing, under an overpressure argon atmosphere using a MAM-1 furnace (Edmund Bühler GmbH, Bodelshausen, Germany). The weight loss upon melting was less than 0.8%, which approximately corresponds to the extra 3% of Mn weight we added in order to balance the Mn evaporation tendency, showing that the resulting composition should be close to nominal. The resulting pellet was cut into two parts, and the larger part was annealed in a sealed glass ampoule with a partial pressure of Ar atmosphere. The heat treatment was run in two steps: First, a high temperature macroscopic homogenization treatment at 1273 K for 24 h, followed by a lower temperature ordering-improvement step at 1073 K, close to the B2 → L21 structural transition, for 24 h. After that, the samples were quenched in a water bath at room temperature. Polycrystalline samples with dimensions of about 5 mm × 3 mm × 1 mm were cut from the annealed part by a spark erosion machine and roughly polished by SiC grinding paper up to the grid of 2400.
The composition of the samples, listed in Table 1, was evaluated using an energy dispersion X-ray microfluorescence (ED-microXRF) spectrometer Eagle-III μ Probe (Roentgenanalytik Systeme GmbH & Co., Taunusstein, Germany). The X-ray is emitted by a Rh tube and accelerating voltage 40 kV. The beam was focused to a spot size of about 50 μm (polycapillary focusing optics) and then detected in an 80 mm 2 Si(Li) liquid nitrogen cooled detector with a resolution of about 140 eV (at MnK α ). The concentrations of the elements were evaluated at 5 spots across the sample by a semiquantitative finite elements method with one standard correction, exhibiting an error of about 0.5 at. %, which is a typical error for the method [27,28,29].
The precise composition evaluation is a critical issue for MSM alloys. The transition temperatures, especially the martensitic transformation, are extremely sensitive to composition, and even a small deviation from the true composition can produce a misleading error. Hence, considerable caution is necessary when comparing transformation temperatures as a function of composition from various sources.
In our notation of composition, we separate the dopant and receiving sublattice from the rest, e.g., Ni49.9Mn24.6(Ga20.4Co5.1). For the sake of consistency, the Ni in the stoichiometry alloy (Ni45.0Ni5.4)Mn24.6Ga25.0 is separated, too. Throughout the paper, we mark the alloys as Ga20Co5 and Ni45Ni5, respectively. Markings of all alloys and their full compositions are shown in Table 1.
The XRD measurements were made using a PANalytical X’Pert PRO diffractometer (PANalytical, Almeo, Netherlands) equipped with a Co tube, in divergent and parallel beam geometry. Measured pole figures revealed the textured oligocrystalline nature of the samples. Therefore, divergent beam geometry with wide slits was used for the initial phase analysis measurements. For each sample, several scans were measured with different sample orientations suggested by the measured pole figures. This allowed us to collect a sufficient number of reflections for confident phase composition analysis.
Even though no other known phases common for Ni-Mn-Ga-based alloys than those listed in Table 2 were detected in the measured scans and pole figures, due to the measurement-complicating oligocrystalline nature of the samples and practical impossibility to cover the whole space of orientations, there might be a slight chance of the presence of lower amounts of undetected additional phases. This, however, seems to be clearly excluded by magnetic measurement. After the aforementioned measurements, selected reflections for single grains were measured in the parallel beam geometry for the precise determination of the lattice parameters which are listed in Table 2.
The magnetic measurements were performed using a physical property measurement system (PPMS) with a 9 T superconducting coil (Quantum Design, Inc., San Diego, CA, USA). We used a vibrating sample measurement regime for magnetization dependence on both the external magnetic field and temperature. Magnetisation vs. field measurements confirm that magnetic saturation is clearly complete by the application of a 2 T field, and so the temperature dependence of saturated magnetization was taken at the constant field of 2 T. The saturation magnetization Msat and coercive field HC were determined from the magnetization curves, as shown in Figure 1 for two alloys. Since the martensitic and austenitic phases strongly differ in their magnetic properties, the phases can be easily distinguished from the different shape of the magnetization curves, where the greater anisotropy of the martensite phase shows a harder ferromagnetic M/H response.
Owing to its high sensitivity, low-field thermomagnetic measurement ( μ 0 H = 10 mT) was used to determine all transition temperatures: Curie temperature TC, premartensitic transition Tpm, martensite start and finish temperatures (Ms, Mf) and austenite start and finish temperatures (As, Af), respectively. From the last four temperatures, the single value, equilibrium martensitic transition temperature (Tm) was calculated as T m = ( M s + M f + A s + A f ) / 4 . The transition temperatures were determined from the low-field thermomagnetic curves as the intersection of two extrapolated lines, one of the maximal slope and one of the minimal slope, as shown in Figure 2 and Figure 3. This method of transition temperature determination is common and straightforward [17,19,21,30]. The precision of the method is acceptable if the DC magnetic susceptibility or low-field magnetization measurement changes steeply in a narrow temperature range. The sharp change is common in high-quality Ni-Mn-Ga single crystals [31], and although we studied polycrystalline samples, the transition was still very steep.
On the other hand, the Curie temperature determination depends on the method used. For example, the TC of the Ni45Fe5 (full composition in Table 1) alloy determined by the tangent method, i.e., by slope extrapolation to zero magnetization, and by inflexion point (both of the low-field thermomagnetic curves) and by the Arrott plot [32,33] gives 399 K, 394 K and 403 K, respectively. In addition to these methods, we can determine the paramagnetic Curie temperature from a plot of reciprocal magnetization vs. T by extrapolation to zero, which gives 396 K. For consistency, we used the method of the tangents crossing for all data evaluation. Importantly, we corrected the thermomagnetic measurements for the temperature rate (4 K/min) in order to obtain the most precise transition temperatures possible. Detailed thermomagnetic curves for all samples can be found in the Supplementary Files.
The e/a parameter represents average number of valence electrons per atom in one formula unit. This parameter is commonly used in the field, as part of a broad common theme of valence electron counting in Heusler compounds [34]. Nevertheless, for the sake of completeness the exemplary enumeration is provided. The number of valence electrons for Ni, Mn, Ga, Fe, Co are 10, 7, 3, 8, 9, respectively, and the parameter e/a for the particular alloy with experimentally determined composition Ni49.9Mn24.6(Ga20.4Co5.1) is calculated as follows:
e / a = ( 10 × 49.9 + 7 × 24.6 + 3 × 20.4 + 9 × 5.1 ) / 100 = 7.78
Although the e/a ratio is widely used as a parameter to compare alloys of different composition, in the doped systems of Ni-Mn-Ga it becomes more complicated and anomalous behaviour appears as shown already by Ramudu et al. [35]. They introduced new parameter Ne/a and demonstrated its benefits over the e/a, e.g., the Ne/a provides the trend of Tm in the case of constant e/a for different compositions of Ni-Mn-Ga-In alloys. Another argument supporting the use the Ne/a is given later in this paper. The Ne/a parameter stands for an average number of non-bonding electrons per atom in one formula unit or so-called effective valence electrons [35]. The expression is given by the formula N e / a = E N WS , where E is number of valence electrons and NWS originates from the empirical model of Miedema et al. and is defined as the electron density at the boundary of the Wigner-Seitz cell [36,37]. The number NWS is derived from molar volume and bulk modulus of the particular element. For the elements discussed in this work, we use non-bonding electron counts, NWS, of 5.36, 4.17, 2.25, 5.55 and 5.36, for Ni, Mn, Ga, Fe and Co, respectively [35,36]. The Ne/a outcome is then enumerated similarly to e/a, for the same alloy Ni49.9Mn24.6(Ga20.4Co5.1):
N e / a = [ ( 10 5.36 ) × 49.9 + ( 7 4.17 ) × 24.6 + ( 3 2.25 ) × 20.4 + ( 9 5.36 ) × 5.1 ] / 100 = 3.40 ,
Both parameters e/a and Ne/a together with the experimentally determined compositions for all prepared alloys are listed in Table 1.

3. Results

It should initially be stated that all replacements mentioned in the text strictly refer to chemical composition replacement. Additionally, we assume that the atom replacement is ideal, i.e., the substitution occurs on the atomic position of the original atom. The case of possible sequential or cascade replacement, i.e., the atoms of one element push into another sublattice, is discussed in the last section.
All doping (alloying) and comparisons are related to the very-close-to stoichiometric (Ni45.0Ni5.4)Mn24.6Ga25.0 alloy, further on referred to as the stoichiometric alloy.
As an example, we present several figures of selected alloys in the following section to illustrate magnetic behaviour and data evaluation. The complete set of measured data and figures are provided in the Supplementary Files.

3.1. Transformation Temperatures and Magnetic Properties

In Figure 1, two examples of magnetization curves are displayed, Ni45Ni5 and Ga20Co5. For the stoichiometric sample, the magnetization curves clearly demonstrate the difference between magnetically soft austenite and high-anisotropy martensite. On the other hand, although the Ga20Co5 sample exhibits a martensitic phase at both temperatures, the magnetization curves strongly differ. The difference simply demonstrates how the magnetization curve is skewed close to the Curie point. In the austenite state and in the vicinity of the Curie point, the coercive force is negligible due to the vanishing magnetic anisotropy. From the comparison of the curves at 10 K, it follows that the Co-doped alloy exhibits a much lower saturation magnetization and also a lower magnetocrystalline anisotropy in the martensite state. The parameters determined from the magnetization curves for all prepared alloys are summarized in the Table 3.
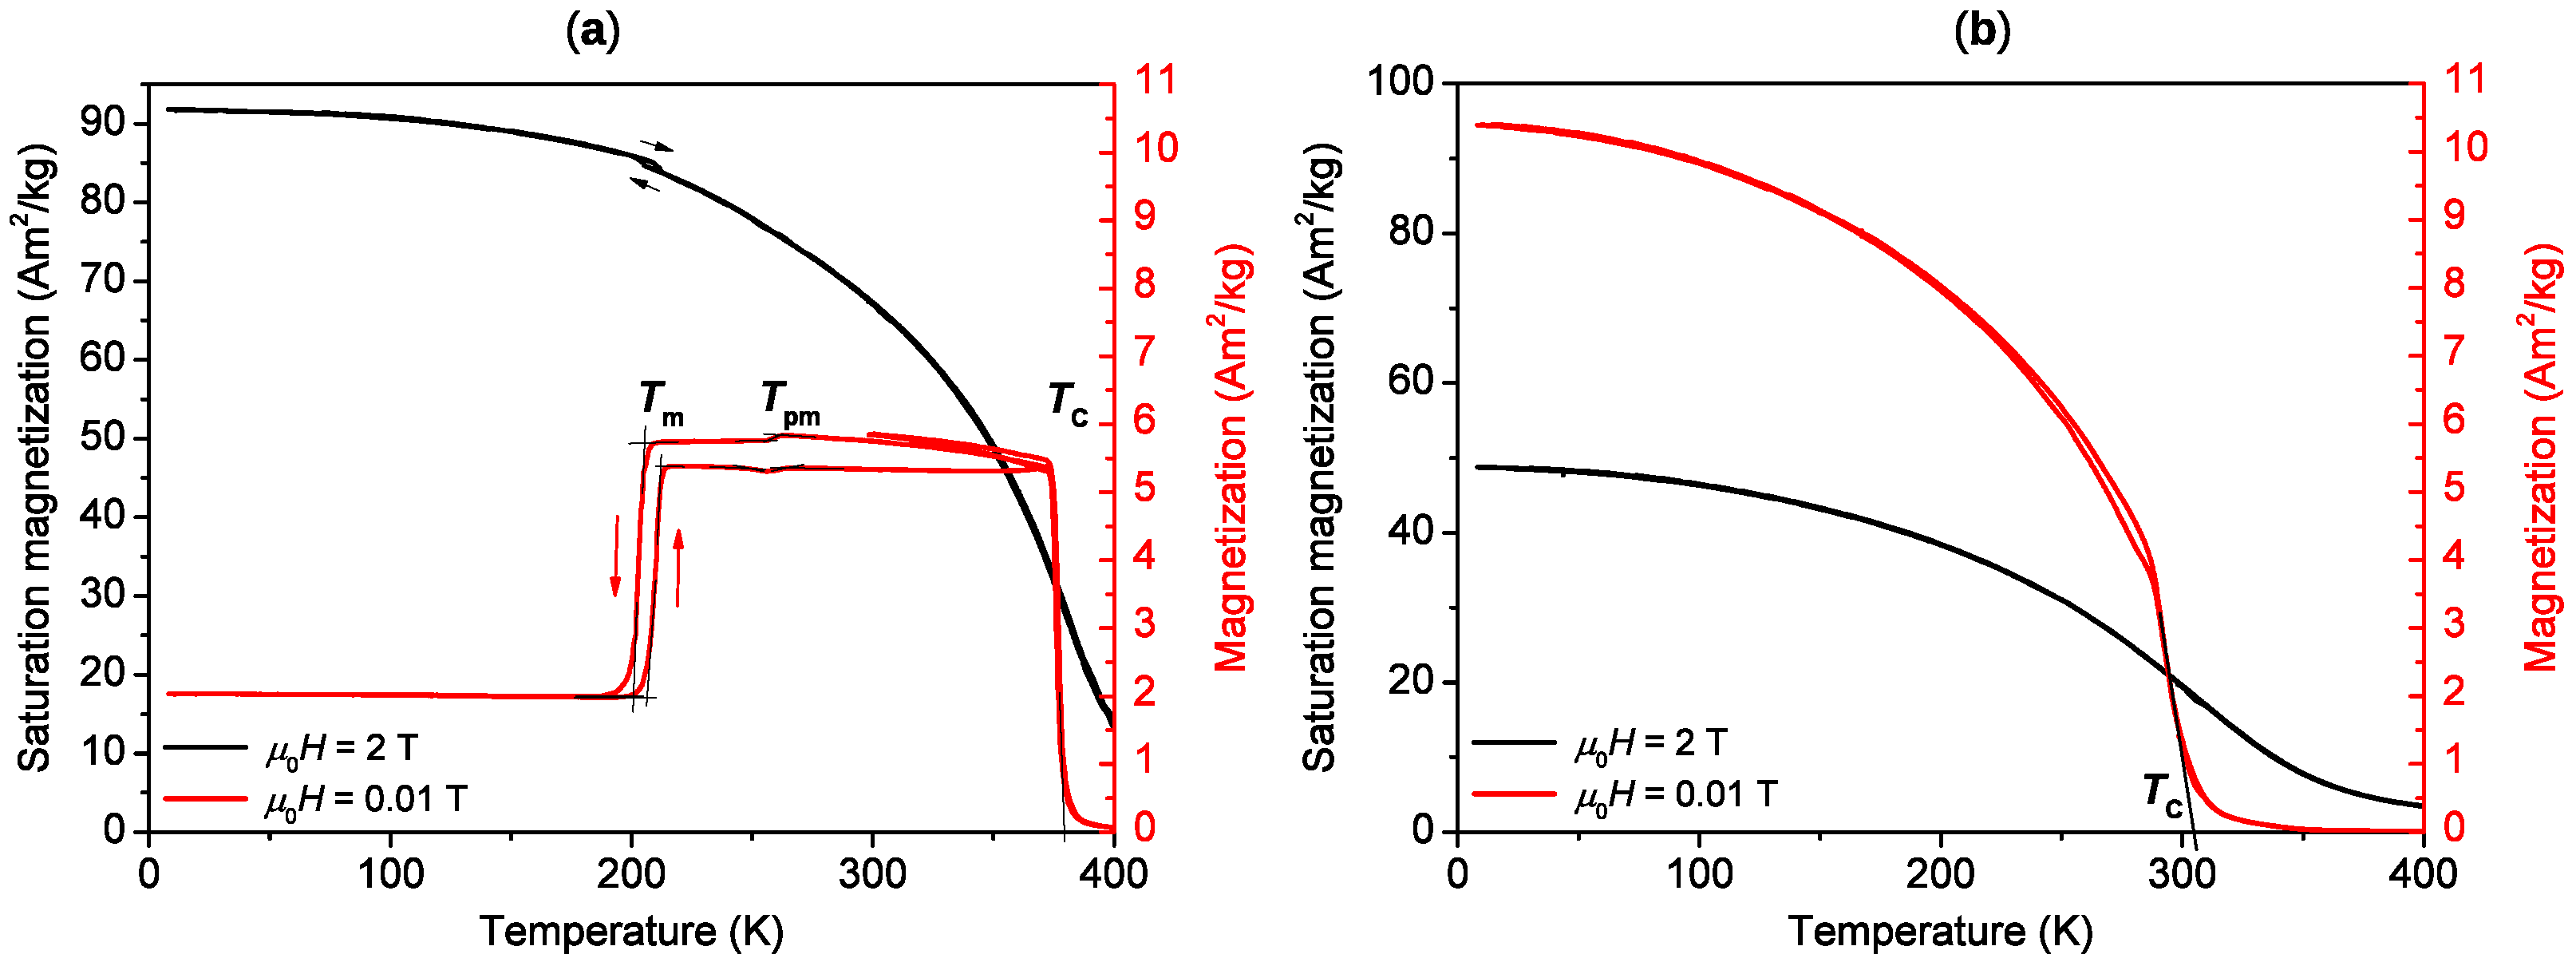
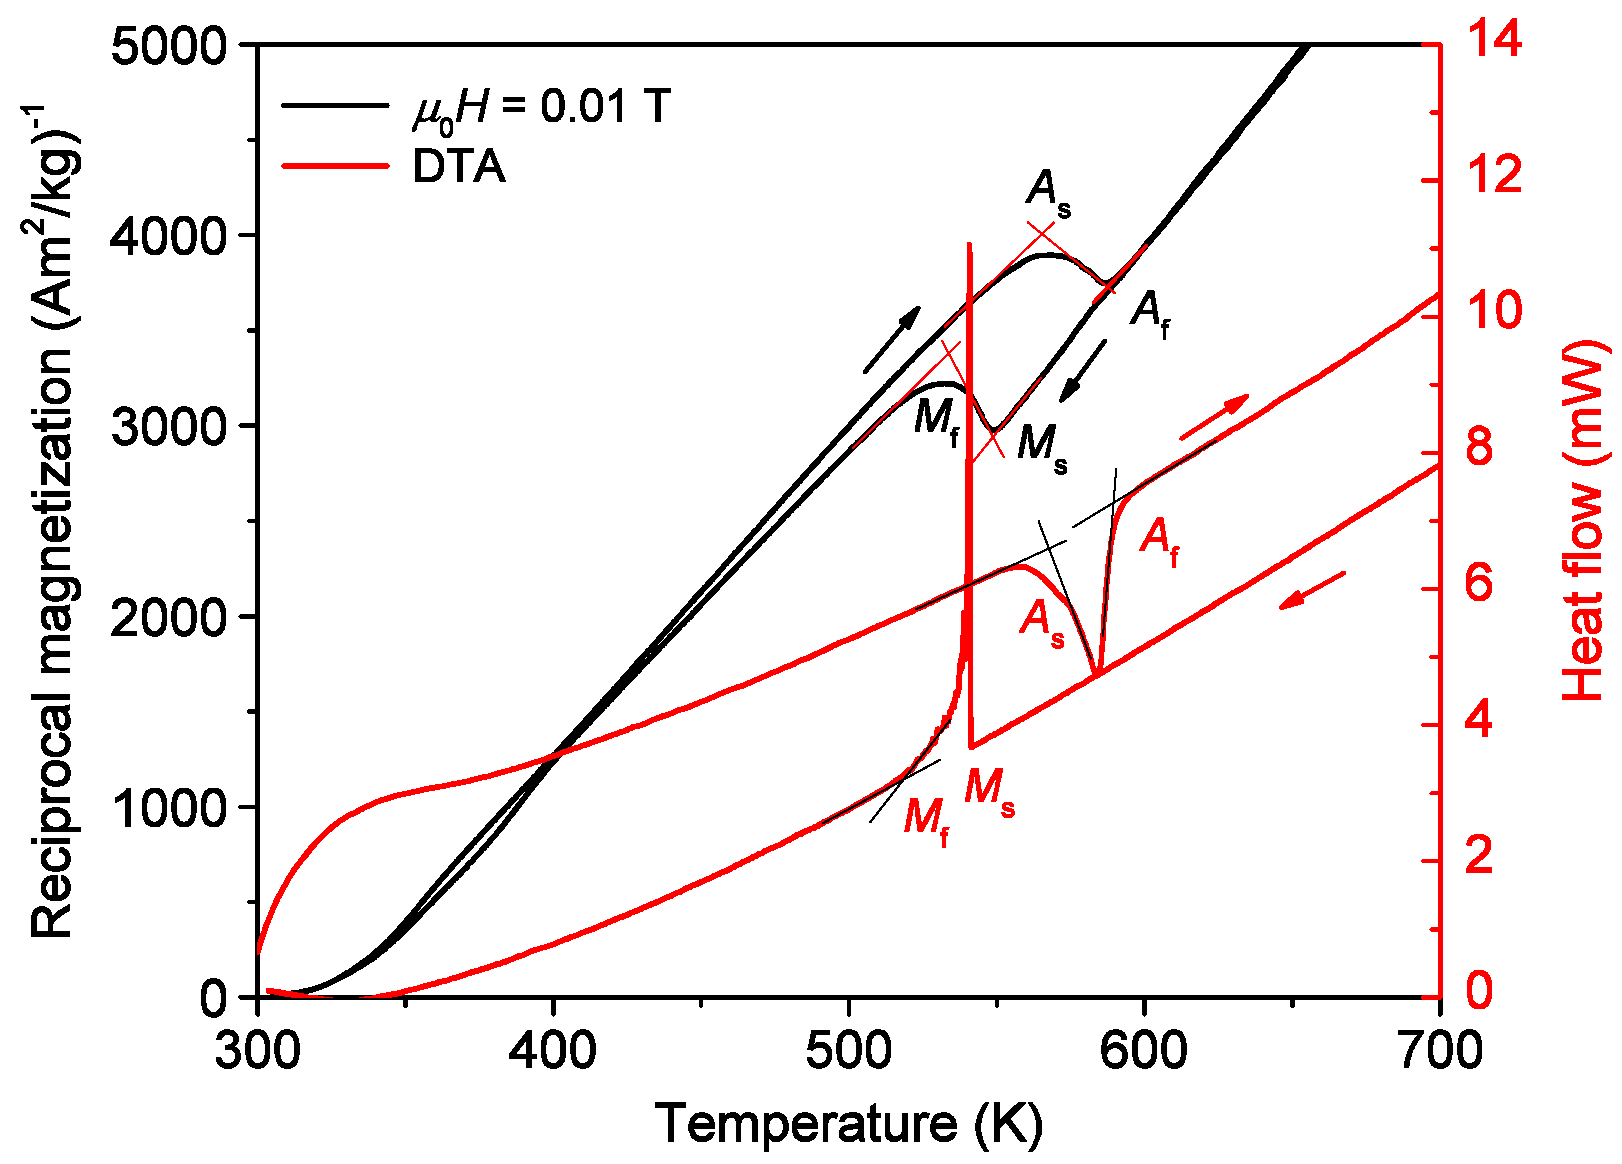
Transformation temperatures were determined from thermomagnetic measurements; see Table 4. The examples of the measurements for the above discussed alloys are shown in Figure 2. In addition, the detection of a martensitic structural transition above the Curie point from the magnetic measurement is demonstrated in Figure 3. To confirm the transformation indicated by thermomagnetic measurements, differential thermal analysis was also performed. A reciprocal magnetization determined from thermomagnetic measurement is depicted to demonstrate its ability to detect martensitic transition (MT) in the paramagnetic state, which broadens its use to a wider range of alloys, e.g., in paramagnetic NiTi [38] and even in diamagnetic Cu-Ni-Al [39]. The measured thermomagnetic and magnetization curves for all samples are provided as Supplementary Information.
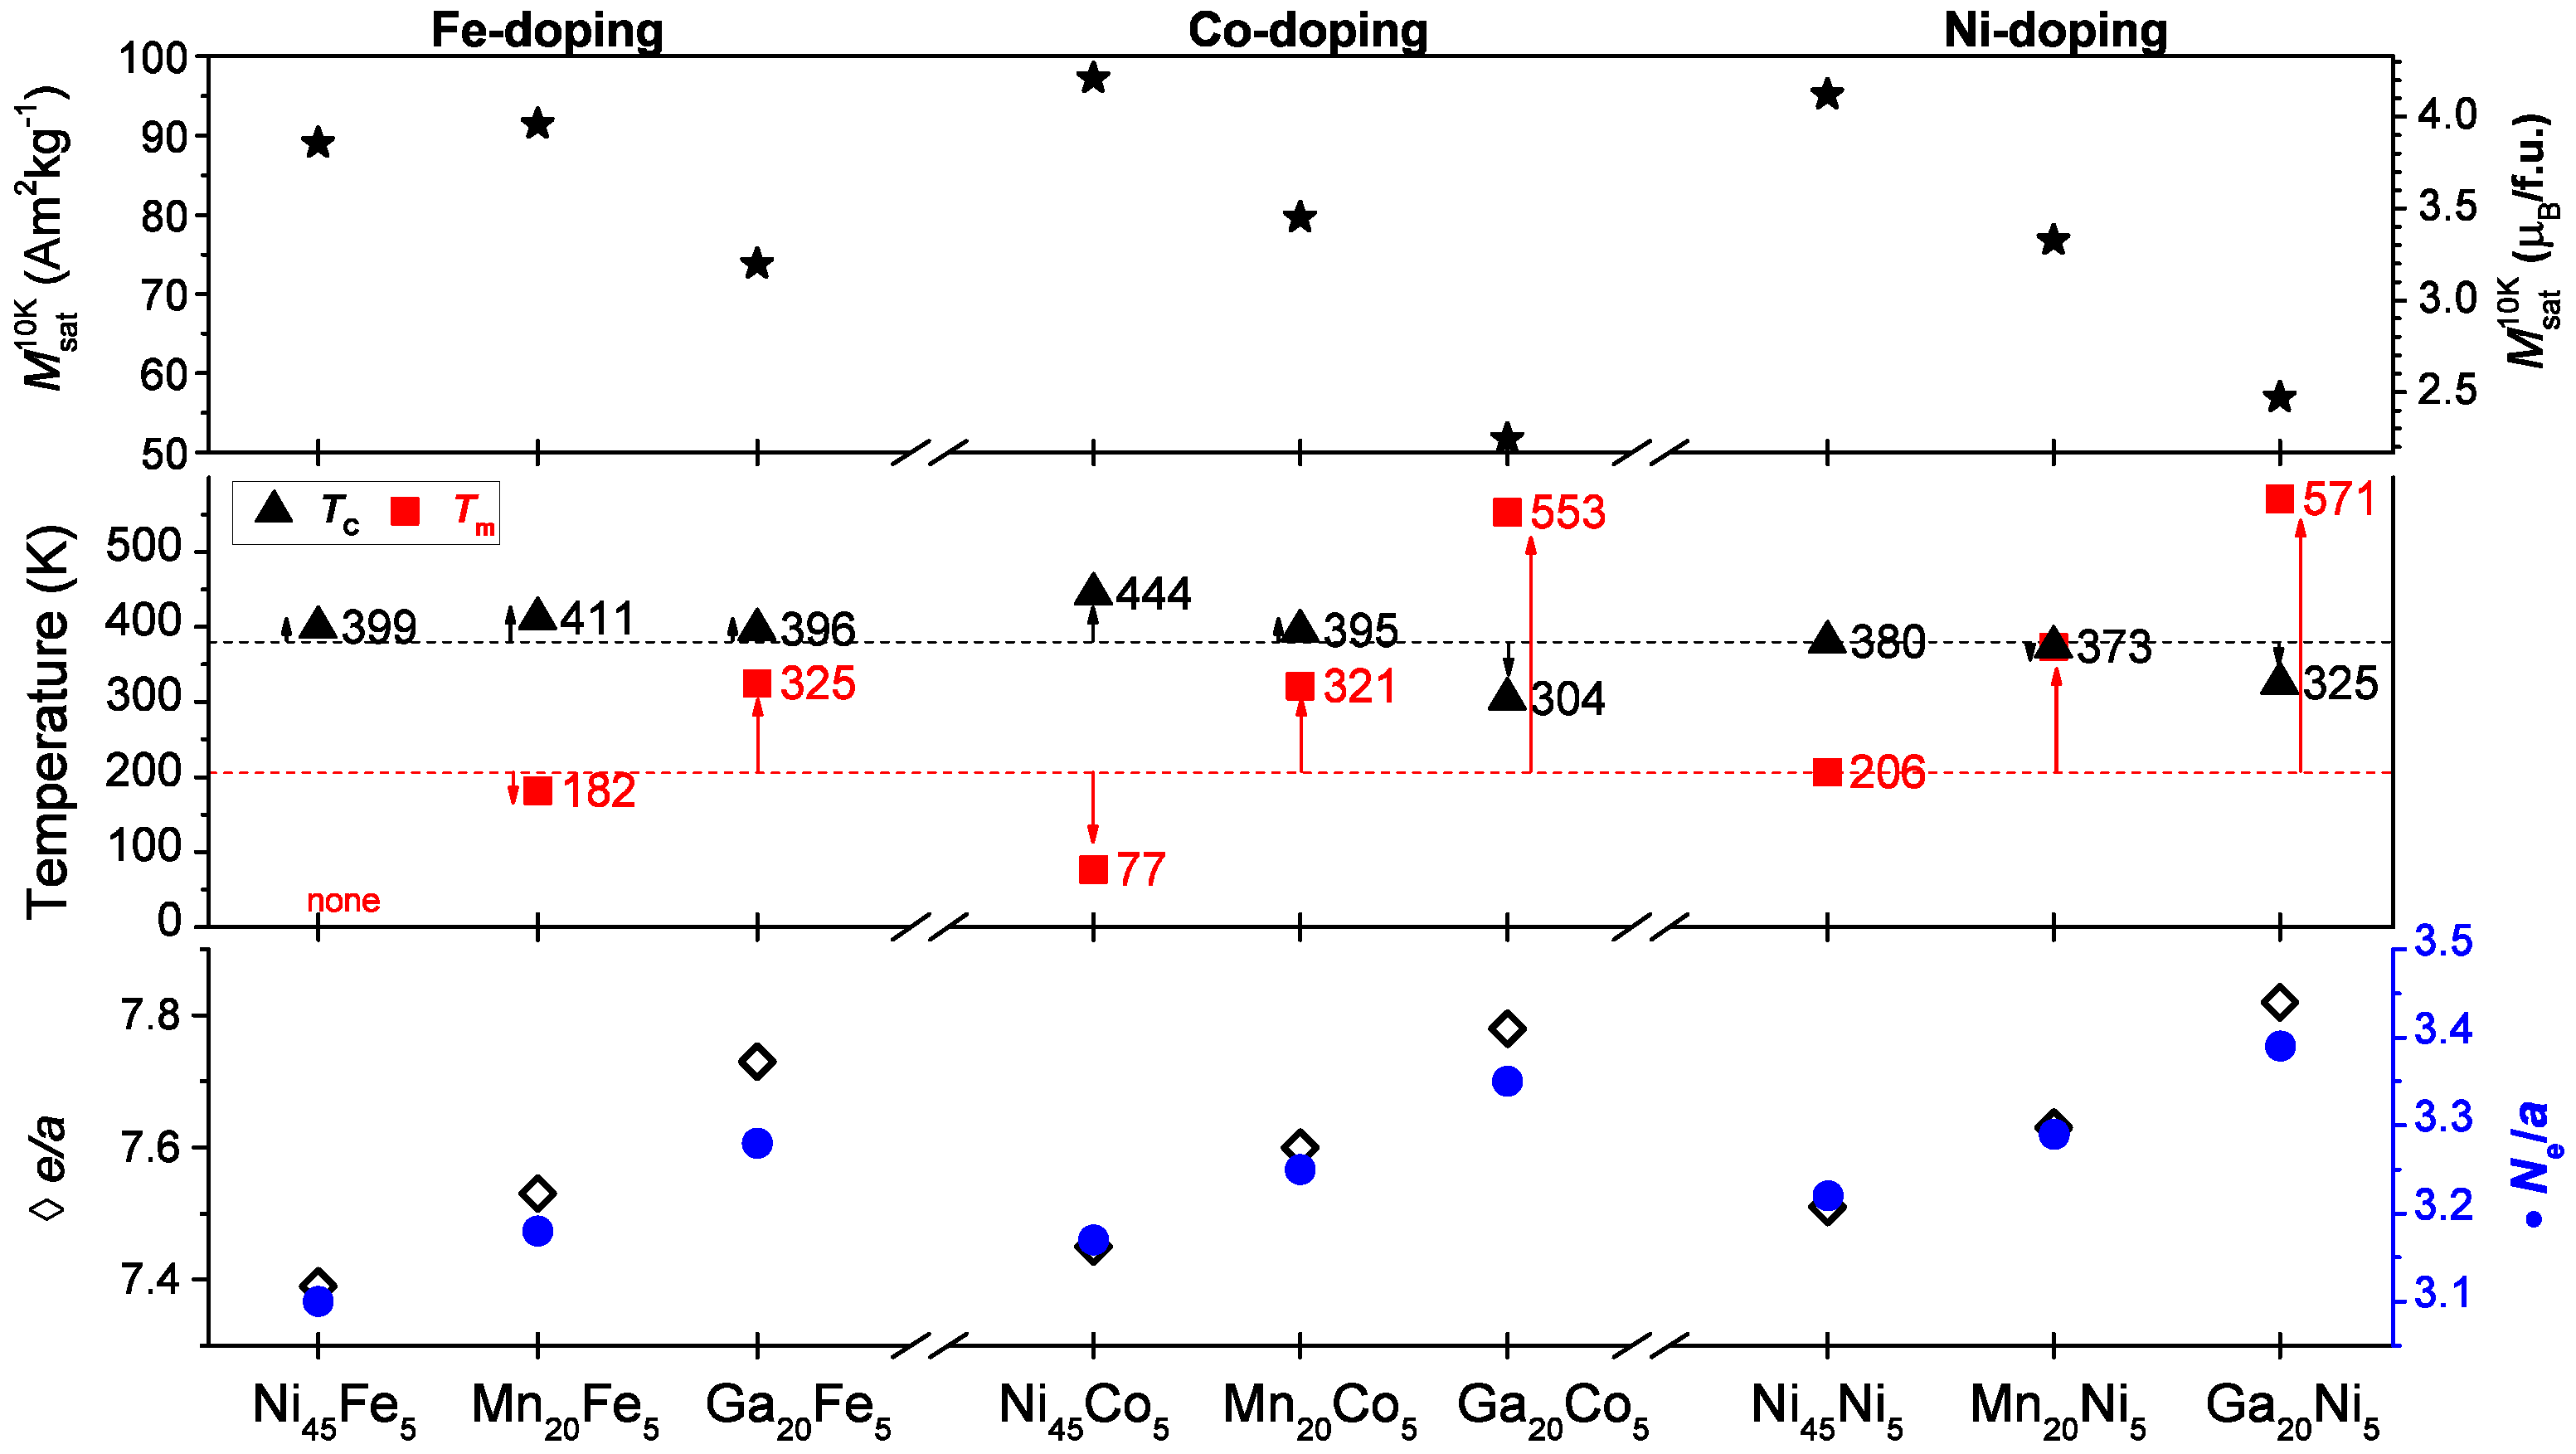
Saturation magnetization, Curie and martensitic transformation temperatures, and e/a and Ne/a parameters for all samples, are summarized in Figure 4. The three main columns are plotted with respect to the doping element, and within each column, the results relate to the original element. The valence electron per atom e/a criterion is usually used for the evaluating the effect of doping. It seems that this criterion is broadly valid but not precise as pointed out before. Therefore, we used the new criterion Ne/a, as described in the Experimental Section 2, considering the amount of non-bonding electrons per atom [35,36]. In general, the martensitic transformation temperature increases broadly with increasing e/a, but the rate of increase cannot be effectively predicted. Moreover, the Curie temperature has a non-monotonous dependence similar to saturation magnetization Msat. In the following, we briefly describe the differences of the magnetic behaviour affected by the substitution of individual elements Fe, Co, and Ni.

3.2. Fe Substitution

3.2.1. Ni45Fe5

The compositional replacement of Ni with Fe increased TC, compared to stoichiometric Ni45Ni5, but totally suppressed the martensitic transformation as the thermomagnetic measurement and magnetization curves down to 10 K provided no evidence of the transformation.
The austenitic structure was confirmed by X-ray diffraction at room temperature. The saturation magnetization of austenite M sat 300 K is smaller than that of the stoichiometric alloy. Coercive force H C 300 K (1.9 mT) is at the same level as all austenitic phases, except the stoichiometric alloy for which the H C 300 K is much lower (1 mT). The increase in hysteresis compared to the stoichiometric sample can be explained by a slight local deformation of the structure due to the new element and increasing disorder, which can subsequently result in a higher amount of pinning points for magnetic domain walls [40,41].

3.2.2. Mn20Fe5

The replacement of Mn with Fe decreases the Tm by 24 K to 182 K and increases TC by 31 K to 411 K, compared to the stoichiometric alloy, which has the second highest Curie temperature found in this set of alloys. The Mn20Fe5 is the only doped alloy which exhibits a doubtless premartensitic transition, indicated by the thermomagnetic curve. The premartensitic transition was detected at a lower temperature and much closer to the martensitic transition than in the stoichiometric alloy exhibiting such transformation.
The saturation magnetization at 10 K is slightly smaller compared to the stoichiometric alloy, but it is the highest out of all Mn-deficient alloys. The H C 10 K = 12.2 mT in the martensite phase is less than half of that of the stoichiometric alloy. The H C 300 K of austenite was already discussed for Ni45Fe5 above, and the same is valid here. Except for H C 10 K , the magnetic properties are very similar to Ni45Ni5.

3.2.3. Ga20Fe5

The substitution of Ga with Fe results in a major increase in Tm by 119 K to 325 K and moderate increase of TC by 16 K to 396 K. This alloy is one of only two alloys in the set which exhibits an increase in both Tm and TC at the same time. Additionally, the increase is the largest observed.
Saturation magnetization at 10 K ( M sat 10 K ), however, is the lowest compared to the Fe-doped alloys and moderate among all alloys. The 14 M phase was expected to be preserved to 10 K as no intermartensitic transformation was detected. The value of M sat 300 K is the highest among samples in a martensite state owing to the high TC but is still the lowest when compared to the austenites.
Overall, the Fe substitution causes an increase in TC for all three alloys. Apparently, the introduced Fe strengthens the ferromagnetic coupling and thus stabilizes the ferromagnetic order of austenite.

3.3. Co-Substitution

3.3.1. Ni45Co5

Replacing 5 at. % of Ni with Co results in a significant change in both transition temperatures. The Curie temperature increases by 64 K to 444 K. This value of TC is the highest of the set of alloys. Furthermore, the absolute increase in TC from the stoichiometric alloy is almost twice as large as the Mn20Fe5, which exhibits the second highest TC.
On the other hand, the martensitic transformation temperature Tm is very low, the lowest detected. It appears at 77 K which is 129 K below the Tm of the stoichiometric alloy. This can be compared with Ni45Fe5 in which the martensitic transformation vanished entirely.
The alloy exhibits the highest M sat 10 K and M sat 300 K of all alloys. The H C 10 K = 0.8 mT is extremely low compared to other samples in martensitic phases; it is even lower than all samples in an austenitic phase exhibited at 300 K.

3.3.2. Mn20Co5

The substitution of Mn with Co results in an increase in both transition temperatures, Tm strongly and TC slightly compared to the stoichiometric alloy. Such coupled behaviour is rare and appears only in the Ga20Fe5 alloy. The rest of the alloys exhibit opposing trends in transition temperature. Interestingly, the transformation temperatures for Ga20Fe5 are almost identical, but the alloys differ in e/a. This demonstrates the limited validity of the e/a comparison approach. On the other hand, their Ne/a parameters differ. Compared to Ni45Co5, the coercive force HC increased quite significantly, and it is comparable to that of Mn20Fe5.

3.3.3. Ga20Co5

Placing Co in the composition instead of Ga causes a significant increase in Tm by 347 K to 553 K, which is the second highest Tm in the set. However, the Curie temperature strongly decreases by 76 K to 304 K, and appears in the martensitic phase ( T C M ). The M sat 10 K is the lowest and nearly half that of Ni45Co5. The coercive force H C 10 K is at a maximum, while H C 300 K is very low for martensite, which is due to the vicinity of the Curie point.

3.4. Ni Substitution

3.4.1. Ni45Ni5

The substitution of Ni for Ni obviously results to the stoichiometric alloy Ni50.4Mn24.6Ga25.0, or in consistent marking (Ni45.0Ni5.4)Mn24.6Ga25.0 (at. %). The measured composition is very close to stoichiometry, and the transition temperatures are in agreement with the generally accepted Tm and TC [42,43]. Saturation magnetization at 10 K of this alloy is the second highest in the set as the stoichiometric alloy is purely ferromagnetic [44]. The coercive field of austenite at 300 K is almost half when compared to the doped alloys in the austenitic phase. Increased coercivity in some doped alloys suggests that the doping elements may locally deform the cubic lattice providing more pinning points which hinder the magnetic domain wall motion resulting in a higher coercive force than the dopant-free stoichiometric alloy.

3.4.2. Mn20Ni5

Placing additional Ni instead of Mn causes a significant increase in Tm by 167 K to 373 K, close to the Curie point. In this alloy, it is apparent that the Curie point and MT temperature coincide. The coalescence of Tm and TC has been found in various compositions of Ni-Mn-Ga [10] or Ni-Mn-In- and Ni-Mn-Sn-based alloys [45,46], often coined as a metamagnetic transition. Entel et al. ascribed the effect to large volume magnetostriction in the vicinity of magnetic phase transition [10]. From our perspective, the phenomenon is simple. If the Curie temperature of martensite T C M is above Tm and the Curie temperature of austenite TC lies below Tm [47], then during cooling, when crossing the martensitic transition, the paramagnetic austenite transforms directly to the ferromagnetic martensite, which has a higher Curie point. This causes the appearance of magnetic order simultaneously with the martensitic transition and apparent Curie point. During heating, the ferromagnetic martensite transforms upon MT directly to paramagnetic austenite, resulting in hysteresis of the Curie point. Thereby, the MT creates an apparent Curie temperature as the paramagnetic austenite undergoes the martensitic transformation to ferromagnetic martensite.

3.4.3. Ga20Ni5

The substitution of Ga with Ni increases Tm dramatically by 365 K up to 571 K, which is the highest martensitic transformation temperature detected in the set. The Curie temperature decreases again and is exhibited in martensite phase ( T C M ) at 325 K, which is 55 K below the T C stoi . This makes it the second lowest Curie point in the set. In comparison with the Ga20Co5 alloy, this alloy exhibits a similar temperature decrease, i.e., both Ni and Co exhibit similar effect when substituted for Ga. The M sat 10 K is the second lowest and almost half that of the highest value, which is Ni45Co5, and the stoichiometric alloy. The coercive force at 10 K is the highest and at 300 K the lowest of all alloys. The value at 300 K is so low due to the proximity of T C M and low easy plane anisotropy of NM martensite. On the contrary, H C 10 K = 48.5 mT is unusually high for NM martensite, and the closest one is Ga20Fe5, which is expected to be 14 M martensite at 10 K.

4. Discussion

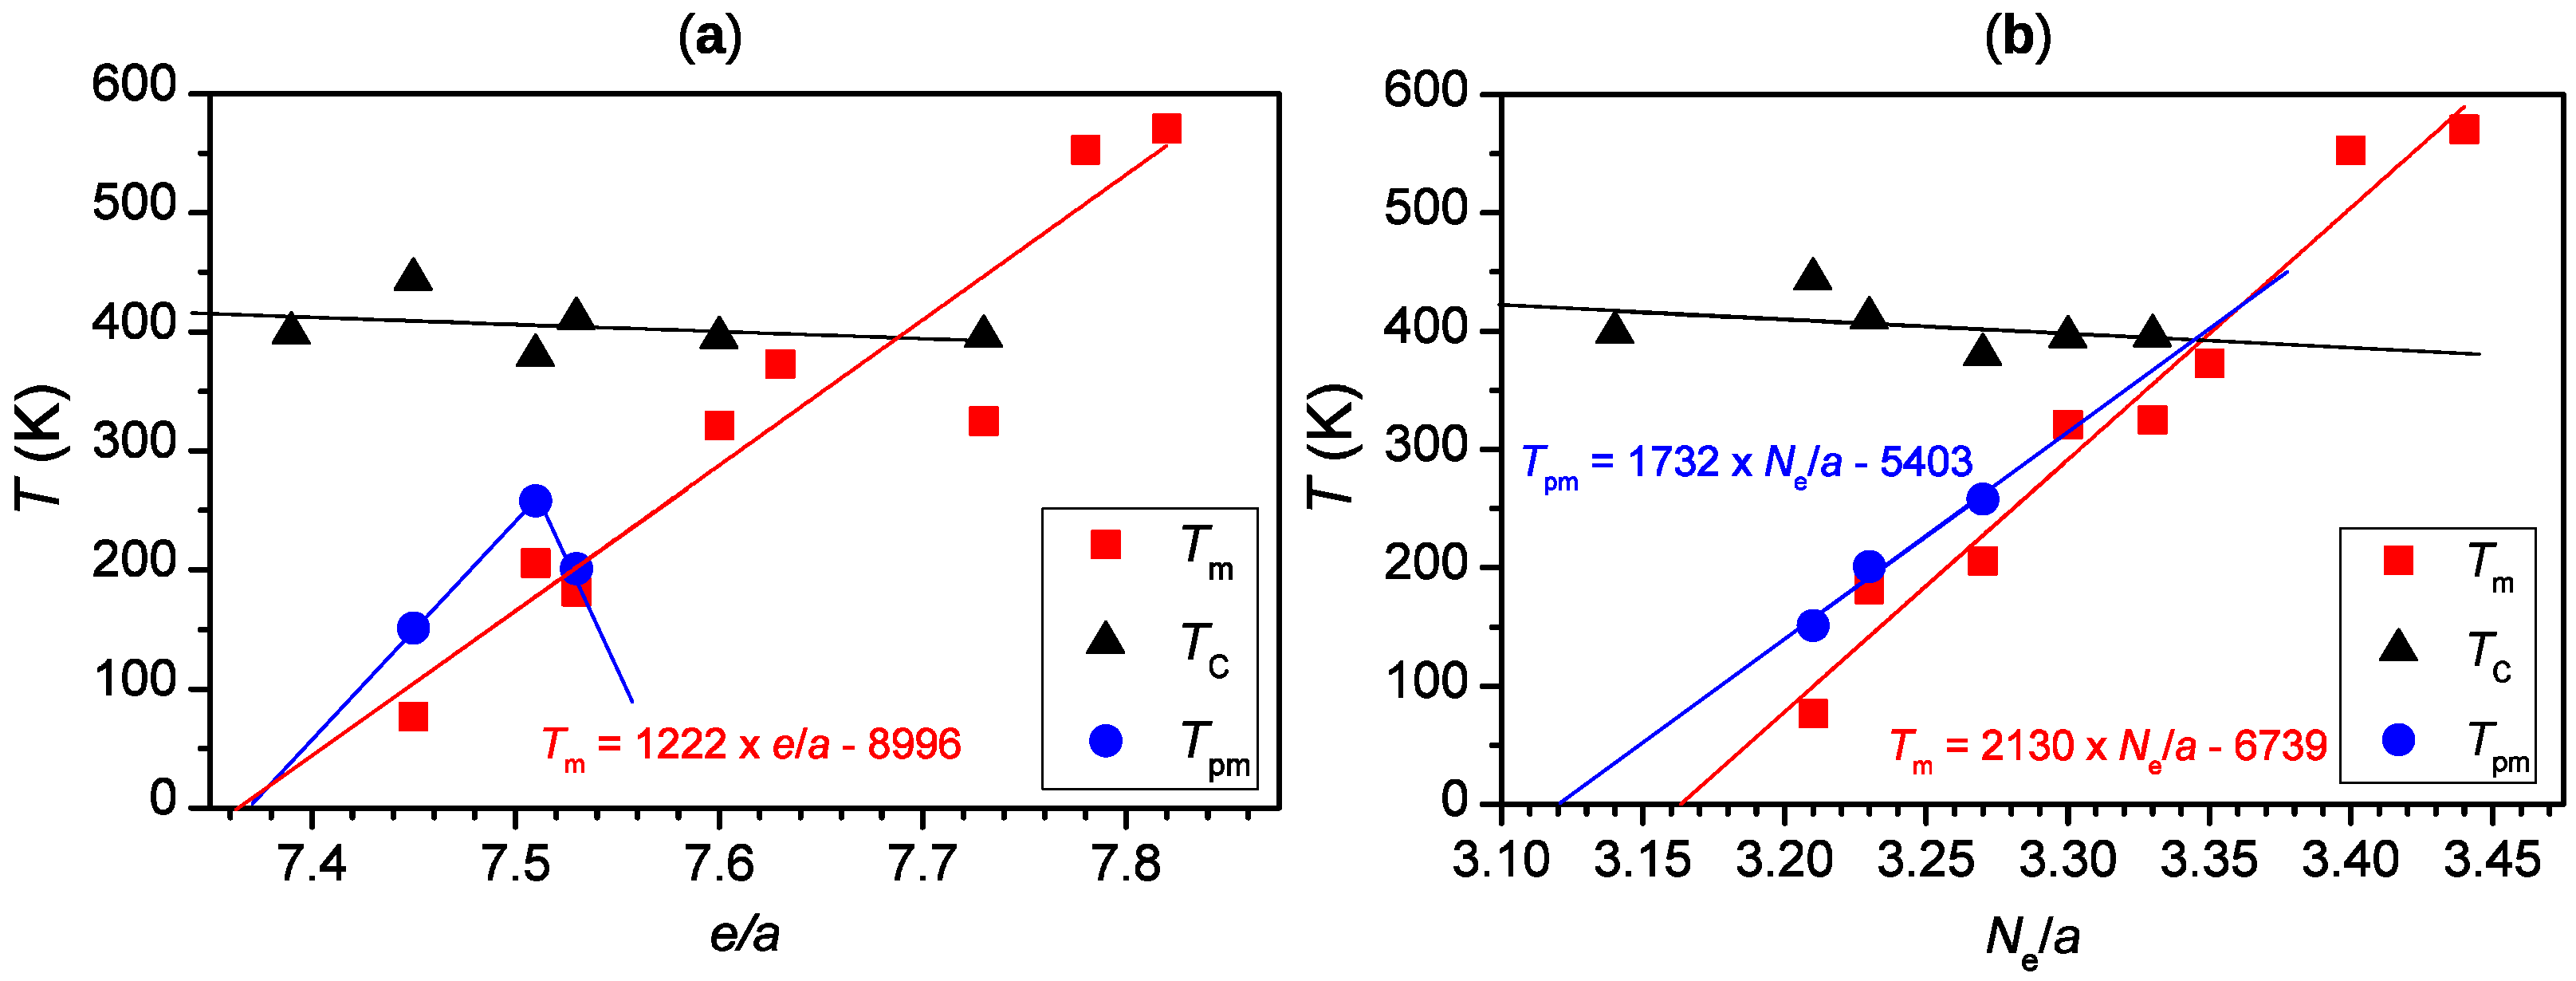
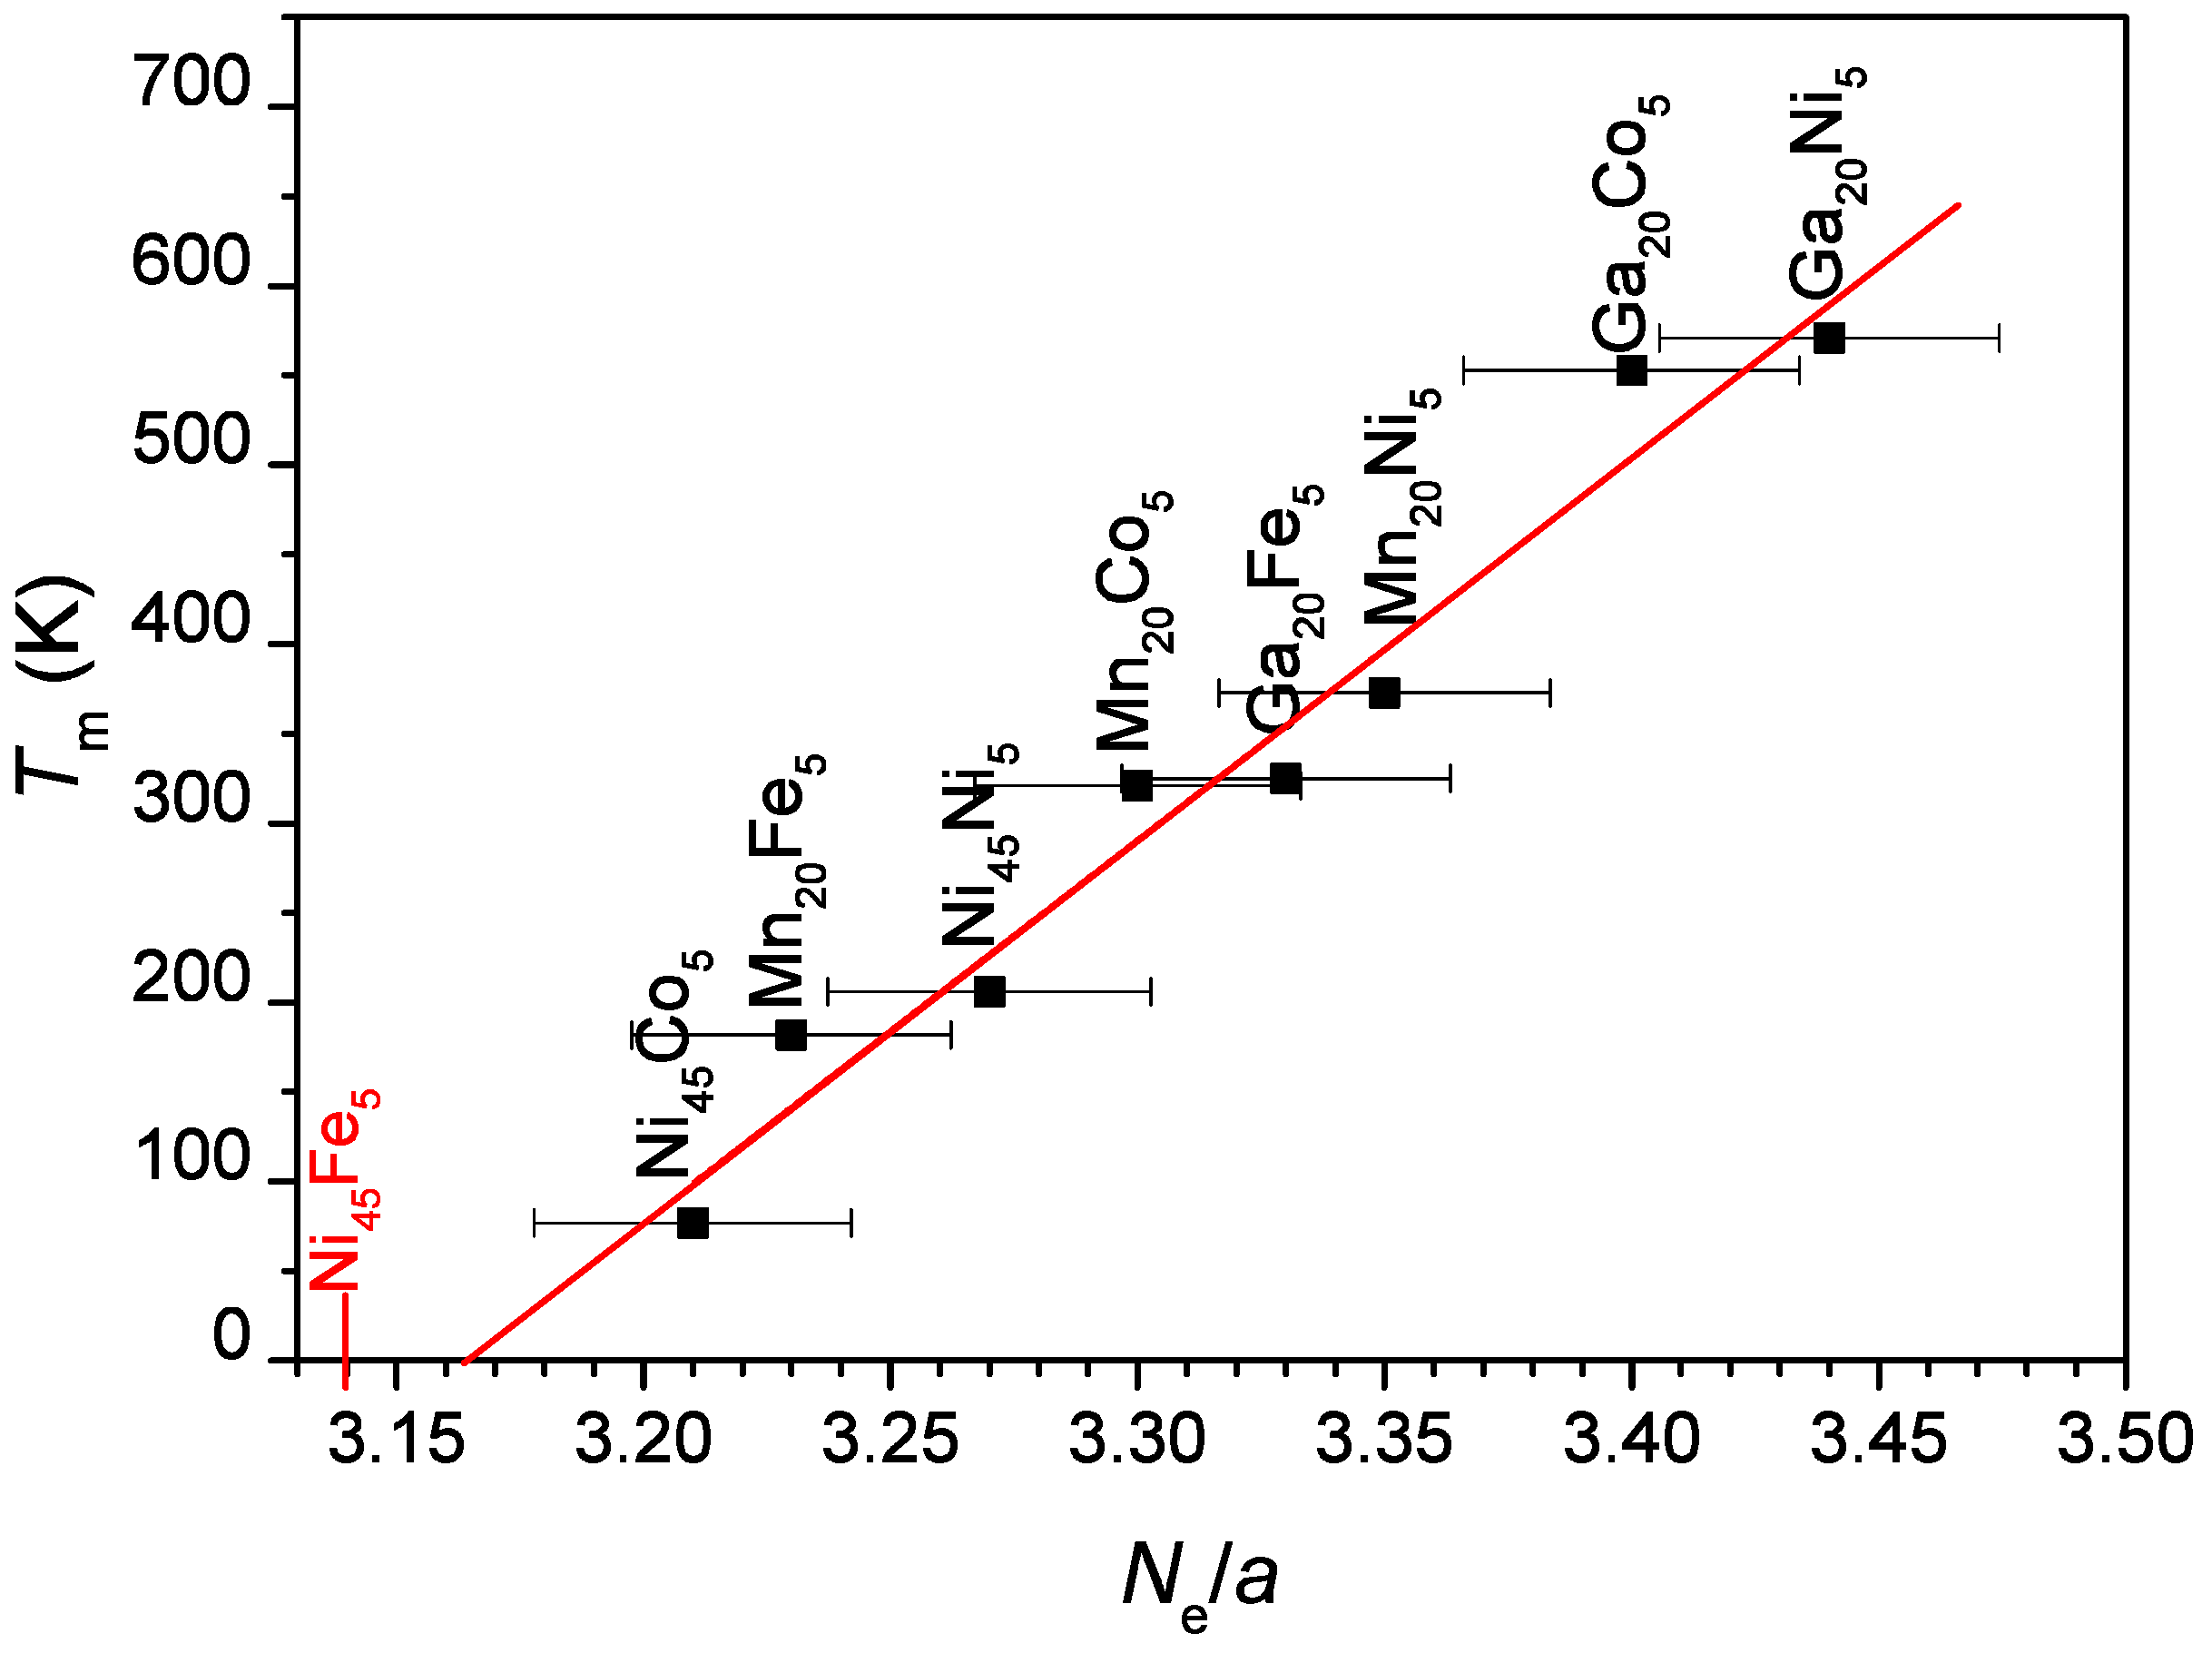
Thanks to consistent doping by transition elements in all positions, we can test the predictive power of the widely used e/a and recently introduced Ne/a criteria for transition temperatures. Figure 5 shows the absolute values of transition temperatures Tm, TC and Tpm with respect to (a) e/a and (b) Ne/a parameters. A better linear fit, i.e., statistically more significant, of Tm, is provided by the Ne/a dependency, and the premartensitic transformation temperature is also well correlated, although we have only three points. Despite the error in the chemical analysis, about 0.5 at. %, the martensitic transition temperatures of all alloys fall into a single line, T m = 2130 × N e / a 6739 , as shown in Figure 6. Moreover, a linear fit allows the estimation of the possible Tm of the (Ni45Fe5) alloy. The extrapolation based on the e/a parameter gives T m = 1222 × e / a 8996 = 31.5 K, while using the Ne/a parameter suggests that there is no martensitic transformation (Figure 6), in agreement with our experimental result. From this perspective, the Ne/a parameter has better predictive power than the e/a ratio. On the other hand, the TC is scattered and does not exhibit a clear correlation with either parameter.
Although one can expect that the saturation magnetization Msat depends mostly on Mn content, the experiment shows different results. Despite the complex behaviour depending on specific site doping, the general trend is that saturation magnetization decreases with increasing electronic concentration e/a, exhibiting an approximate maximum for stoichiometric alloy, i.e., in an ideal L21 ordered structure. The dependence is shown in the Supplementary Information. Moreover, the e/a parameter leads to a slightly better linear fit than Ne/a.
Most of the experimental studies of doped Ni-Mn-Ga have selectively substituted just one of the original elements, e.g., [16,19,48,49,50]. At first approximation, it is a valid approach to introduce a new element in order to study its effect on transition temperatures. However, as we have shown, it is not sufficient. The dopant placing in the composition is crucial and significantly affects the transition temperatures, which is discussed further in the text.
For Fe-doped alloys, Soto-Para et al. [15] prepared a similar full doping series substituting all original elements. However, the Fe-doped Ni-Mn-Ga series were based on the off-stoichiometric parent Ni53Mn22Ga25 alloy, with an Fe content from 0 to 5 at. %. Since the base alloy exhibits significantly different transition temperatures from the stoichiometric one, the direct comparison with this work is difficult; however, the general trends are consistent. In agreement with their reasoning [15], the effect of Fe doping is to enhance magnetic exchange coupling and thus increase TC. The doping by Fe, on the other hand, apparently caused a decrease in the free energy difference between the austenite and martensite phases, resulting in the stabilization of the austenitic parent phase, i.e., decreasing the Tm.
Similarly, the Co-doped series from the same paper [15] is based on the stoichiometric alloy as the reference system, which enables a direct comparison, and the trends again agree very well. Although the absolute values are not provided but estimated, the Curie temperatures TC seem to be in better agreement than the martensitic temperatures Tm. This may not be surprising as Tm is much more sensitive to composition. Moreover, Soto-Para et al. used the martensite start temperatures (Ms), while our approach utilized the equilibrium martensitic temperature Tm. When making similar comparisons using Ms (Supplementary Information), our trends are clearly comparable within, a discrepancy which can be confidently ascribed to composition variation between our alloys and the composition determination error.
Until now, we discussed how the new elements affect the transformation temperatures Tm and TC, as summarized in Figure 4. Additionally, we showed that if the dopant is placed into various compositional sites, the transition temperatures follow broadly the same trend, regardless of which new element is introduced. This can provide an alternative perspective related to the reduction in the original element contrasting the introduction of a new one.
Following this idea, we rearranged the obtained results with respect to the deficiency of the original elements; see Figure 7. This immediately shows that if Ni is deficient, Tm decreases strongly and TC increases significantly, irrespective of the substituting element. This trend was also observed in [16,48,51] for Co or in [52] for Fe.
On the other hand, if Ga is deficient, the effect is almost opposite and very steep, Tm increased and TC decreased, except for Ga20Fe5, where the TC also slightly increased. Such trends are not unique and can be found in other works [15,30,53,54]. Surprisingly, the substitution of Ga by ferromagnetic metals results in a strong decrease in magnetic moment, possibly due to antiferromagnetic coupling with the major magnetic moment on Mn atoms.
The Mn-deficient alloys do not exhibit a clear trend, two out of three alloys show an increase in TC and a different two show an increase in Tm. In ternary Ni-Mn-Ga, the deficiency of Mn leads to an opposite effectsdepending on whether the composition is Ni- or Ga-rich. The Mn20Fe5 exhibits a similar trend of transition shift to Ga-rich alloys [55,56] and Mn20Co5 and Mn20Ni5 to Ni-rich alloys [10,57]. Although the effect on Mn-deficient alloys is not monotonous and depends on the doping element, our data are in agreement with previous reports, e.g., Mn20Fe5 with [58], Mn20Co5 with [18,51,59] and Mn20Ni5 with [10,57]. It seems that the effects of the doping element is minor compared to the Mn-deficiency itself.
In reality, substitutions may not be ideal, as assumed, and the dopant may prefer another sublattice than the intentionally vacant one. Then, the dopant may push the original atoms from their own preferred lattice site into the vacant one, and this can start a cascade of substitutions between the particular sublattices. The cascade means that, e.g., Co is supposed to compositionally replace Ga written as a Ni50Mn25(Ga20Co5) alloy, but in fact, the Co atoms tend to occupy, for instance, the Mn sublattice, and the Mn atoms are pushed into the vacant Ga sublattice forming the Ni50(Mn20Co5)(Ga20Mn5) alloy. We call this type a cascade of a first order.
Of course, if we extend the idea one step further from the first-order cascade, it results into the second-order cascade. If in the previous example Co would prefer the Ni sublattice, the expelled Ni would prefer the Mn sites, and Mn must settle in the vacant Ga sublattice; the composition formula could be then written according to the preferential sites as (Ni45Co5)(Mn20Ni5)(Ga20Mn5).
It is difficult to determine preferential sites experimentally. The similarities in X-ray scattering factors result in very little contrast between these elements with such close electron numbers. Neutron diffraction can provide an enhanced contrast, but the possibility of refining the occupancy of three elements on a single site requires the careful use of either multiple data sets from different radiation types, or careful imposed constraints that must be reasonably justified.
Richard et al. studied four Ni-Mn-Ga compositions from which three were powdered single crystals and one was maintained for single crystal diffraction [60]. The best model fitting the neutron diffraction data suggested that excess Mn atoms tend to occupy Ni and Ga sites and no cascade occurs. On the other hand, for the Ni-rich alloy, the atoms expel the Mn into the Ga sites, i.e., the first-order cascade, resulting in enhanced ferromagnetic (FM) coupling on the Mn sites, and enhanced antiferromagnetic (AFM) coupling on the Ga sites.
For the doped Ni-Mn-Ga alloy, there are three neutron diffraction reports which deal with the site preference. In the report by Porro-Azpiazu et al., they studied the Ni51(Mn28-xYx)Ga21 (Y= Fe, Co) system but other than the available experimental report, the results have not been published as a peer reviewed article [61]. A more complicated system of (Ni45Co5)(Mn25-xFex)(Ga20Cu5) ( x = 0 , 1 , 2 , , 6  and  8 ) was studied by Lazpita et al. mostly on powder samples prepared from single crystals [62]. Although their intention was obviously to replace the original elements by the particular ones as marked, the dopants were found in different sites (for x = 1 ), resulting in complex situation: Cu in Mn sites, which expels Mn into Ga and Ni sites; Co in Ga sites; Fe in Ni and Mn sites. The following report from two single crystals of compositions x = 4  and  5 confirmed the aforementioned results [63]. However, these reports have also not yet been published, apparently due to the complex nature of the substitution, and the required complexity of the analysis. Although one can expect that different elements favour specific sublattices, firm evidence is still missing.
Since the site preference is difficult to study experimentally, and an insufficient amount of data has so far been provided, we resort to reported ab-initio calculations [64,65]. Li et al. [64] showed that on a system doped by 1.25 at. % of Fe, Co or Cu, the energetically preferable sites for Fe are Ni and Mn sublattices when they are vacant. Rather than to settle in a Ga vacant sublattice, Fe causes a cascade with Mn expelled into the Ga sublattice. However, the calculated energy of the cascade is only slightly more preferable than that of the cascade with Ni or the no cascade system. As the difference between calculated energies is not conclusive at all, it means one should be able to find Fe in Ga sites at least up to 1.25 at. %. This correlates with the neutron diffraction report by Perez-Checa et al. [63] in which they found 0.5 at. % of Fe in the Ga sublattice out of 5.25 at. % doping. It may be that only a small amount of Fe can be incorporated into the Ga sublattice, and the rest settle in Mn and Ni sites. However, their studied system, having three different dopants, is complex, and the reported settlement may be a product of this complexity or disorder.
The results presented here indicate the first-order cascade with Mn sites and the combined effect of both Fe and Mn on their doping sites. Fe in the Mn sublattice results in a minor decrease in Tm and a major increase in TC, as shown in Figure 4, and may substitute Mn adequately, as they have similar atomic radii. Expelled Mn in the Ga sublattice causes a steep increase in Tm and a slight decrease in TC, which is widely known from the Mn-rich Ni2MnGa. Both effects combined may result in transition temperatures found in the Ga20Fe5 alloy.
For the Co doped system, Li et al. [64] showed by ab-initio calculations that Co atoms tend to occupy the Ni sublattice in every scenario and push Ni atoms into the vacant sublattice. The second-order cascade, i.e., Co expelling Ni and Ni expelling Mn, is not energetically preferred as much as the first-order cascade, according to Li et al. This partially disagrees with the experimental data of Richard et al. [60] and calculations of Jie et al. [65], both conducted on a Ni-rich Ni-Mn-Ga alloy, showing that extra Ni prefers Mn sites. Therefore, the second-order cascade could appear in the Co-doped Ga-deficient alloys.
Moreover, a relatively simple quantitative model was proposed by Ayila et al. [66]. They studied the occupancy of Co and Fe in a Ga-deficient Ni-Mn-Ga alloy by the calculation of magnetic moment in several occupancy and magnetic order configurations. They showed that both Fe and Co prefer to settle in the filled Mn sublattice, and to align their magnetic moment parallel to the overall ferromagnetic moment of Mn and Ni atoms. The displaced Mn occupies the vacant Ga sites with AFM aligned magnetic moment. Both Fe and Co atoms begin the cascade substitution which is for Fe in agreement with ab-initio calculations [64] and neutron diffraction report [63] but in disagreement for Co. Although the proposed mechanism is in agreement with our experiment, i.e., the saturation magnetization of alloys doped on Ga sites are the lowest, it is inconclusive to ascribe the observed sharp decrease to only Mn antiferromagnetically ordered in Ga position.
When we apply the model of Ayila et al. [66] to our data, it suggests that at least the first-order cascade takes place for the Ga-deficient alloys. Doping the Ni-deficient alloys indicates that Fe and Co tend to settle on the Ni sites being FM coupled. The predicted values for Mn-deficient alloys differ for each case. Fe may settle directly in the Mn sublattice and couple FM, Ni may also settle directly on the Mn sites but couple AFM, which disagrees with the neutron diffraction experiment [60]. In the case of Co, the best correlation with experimental values gives the first-order cascade when Co (FM) pushes Ni into the Mn sublattice, coupled AFM again. This kind of modelling, though, is critical in tuning the parameters close to the experimental values. In order to receive a better fit for some alloys, the elements would need to be mixed much more, and some sort of collective moment should be added.

5. Conclusions

By consistent and selective doping using transition elements (5 at. %) to stoichiometric Ni2MnGa, the highest Curie temperature T C = 444 K was achieved in the (Ni44.9Co5.1)Mn25.1Ga24.9 alloy. This alloy, however, exhibited the lowest martensitic transition temperature T m = 77 K detected. Similarly, doping by Fe in the alloy (Ni45.3Fe5.3)Mn23.8Ga25.6 stabilized the austenitic phase down to 10 K.
The highest temperature of martensitic transformation T m = 571 K was achieved for the Ni50.0Mn25.4(Ga20.3Ni4.3) alloy. However, this doping also resulted in a significant reduction in Curie temperature to 325 K.
From the obtained experimental data, it is clear that to broaden the interval, where the MSM effect occurs, is impossible by single element doping within this substitutional range.
The well-established parameter e/a was compared to the Ne/a parameter. Martensitic transformation temperatures increase with increasing e/a and Ne/a parameters, with the latter providing a better linear fit and predicting the disappearance of martensitic transformation in the Fe-doped alloy.
The Curie temperature consistently increases in Fe-doped alloys and decreases in Ni-doped alloys. Co-doped alloys exhibit either an increase or a decrease in TC depending on the element that is substituted for. There is no significant correlation between Curie temperature and e/a or Ne/a parameters.
The doping effect is different for each compositional site; therefore, it is necessary to substitute for all three positions to reveal the full potential of the dopant. We suggest that the deficiency of the original element may affect the transition temperatures more strongly than the incorporation of a new element itself, at least up to 5 at. %. Although the site preference of the dopant is difficult to obtain experimentally, the cascade substitution is discussed and related to experimental data.
Apart from the valuable insight into doping by transitional elements, we expect that this experimental work can be treated as an incentive for ab-initio calculation explaining our observed trends.

Supplementary Materials

The following are available online at https://www.mdpi.com/article/10.3390/met11060850/s1; Figures S1–S9: magnetization and thermomagnetic curves of all alloys; Figures S10 and S11: Curie and martensitic transformation temperatures with respect to alloy composition; Figure S12: Martensite transformation start temperature with respect to e/a or Ne/a parameters; Figure S13: Saturation magnetization with respect to e/a or Ne/a parameters; Figure S14: Summary of X-ray diffraction patterns for all alloys.

Author Contributions

Conceptualization, V.K. and O.H.; validation, V.K. and O.H.; formal analysis, V.K. and P.V.; investigation, M.R., R.H.C. and P.V.; writing—original draft preparation, V.K.; writing—review and editing, V.K., O.H., R.H.C., P.V. and M.R.; supervision, O.H.; funding acquisition, O.H. All authors have read and agreed to the published version of the manuscript.

Funding

This work was supported by Czech Science Foundation, grant No. 19-09882S, and Czech OP VVV projects SOLID21-CZ.02.1.01/0.0/0.0/16_019/0000760 and MATFUN—CZ.02.1.01/0.0/0.0/15_ 003/0000487. Magnetic measurements were performed in MGML http://mgml.eu (accessed on 14 April 2021), which is supported within the program of Czech Research Infrastructures (project no. LM2018096). V.K. and P.V. would like to acknowledge financial support from the grant SGS19/190/OHK4/3T/14.

Institutional Review Board Statement

Not applicable.

Informed Consent Statement

Not applicable.

Data Availability Statement

The data presented in this study are available in the Supplementary Material.

Acknowledgments

Authors wish to thank Tomáš Kmječ for the XRF analysis.

Conflicts of Interest

The authors declare no conflict of interest. The funders had no role in the design of the study; in the collection, analyses, or interpretation of data; in the writing of the manuscript, or in the decision to publish the results.

Abbreviations

The following abbreviations are used in this manuscript:
MSMmagnetic shape memory
MTmartensitic transformation
FMferromagnetic
AFMantiferromagnetic

References

  1. Sozinov, A.; Lanska, N.; Soroka, A.; Zou, W. 12% magnetic field-induced strain in Ni-Mn-Ga-based non-modulated martensite. Appl. Phys. Lett. 2013, 102, 21902. [Google Scholar] [CrossRef]
  2. Heczko, O.; Sozinov, A.; Ullakko, K. Giant field-induced reversible strain in magnetic shape memory NiMnGa alloy. IEEE Trans. Magn. 2000, 36, 3266–3268. [Google Scholar] [CrossRef]
  3. Heczko, O.; Scheerbaum, N.; Gutfleisch, O. Magnetic shape memory phenomena. In Nanoscale Magnetic Materials and Applications; Liu, J.P., Fullerton, E., Gutfleisch, O., Sellmyer, D.J., Eds.; Springer: New York, NY, USA, 2009; Chapter 14; pp. 399–439. [Google Scholar] [CrossRef]
  4. Sozinov, A.; Lanska, N.; Soroka, A.; Straka, L. Highly mobile type II twin boundary in Ni-Mn-Ga five-layered martensite. Appl. Phys. Lett. 2011, 99, 124103. [Google Scholar] [CrossRef]
  5. Straka, L.; Soroka, A.; Seiner, H.; Hänninen, H.; Sozinov, A. Temperature dependence of twinning stress of Type I and Type II twins in 10 M modulated Ni-Mn-Ga martensite. Scr. Mater. 2012, 67, 25–28. [Google Scholar] [CrossRef]
  6. Straka, L.; Hänninen, H.; Soroka, A.; Sozinov, A. Ni-Mn-Ga single crystals with very low twinning stress. J. Phys. Conf. Ser. 2011, 303, 12079. [Google Scholar] [CrossRef]
  7. Kopecký, V.; Perevertov, O.; Straka, L.; Ševčík, M.; Heczko, O. Equivalence of mechanical and magnetic force in magnetic shape memory effect. Acta Phys. Pol. A 2015, 128, 754–757. [Google Scholar] [CrossRef]
  8. Lanska, N.; Söderberg, O.; Sozinov, A.; Ge, Y.; Ullakko, K.; Lindroos, V.K. Composition and temperature dependence of the crystal structure of Ni-Mn-Ga alloys. J. Appl. Phys. 2004, 95, 8074–8078. [Google Scholar] [CrossRef] [Green Version]
  9. Castán, T.; Vives, E.; Mañosa, L.; Planes, A.; Saxena, A. Disorder in Magnetic and Structural Transitions: Pretransitional Phenomena and Kinetics. In Magnetism and Structure in Functional Materials, 1st ed.; Planes, A., Mañosa, L., Saxena, A., Eds.; Springer: Berlin/Heidelberg, Germany, 2005; Volume 79, Chapter 3; pp. 27–48. ISBN 978-3-540-23672-6. [Google Scholar] [CrossRef]
  10. Entel, P.; Buchelnikov, V.D.; Khovailo, V.V.; Zayak, A.T.; Adeagbo, W.A.; Gruner, M.E.; Herper, H.C.; Wassermann, E.F. Modelling the phase diagram of magnetic shape memory Heusler alloys. J. Phys. D Appl. Phys. 2006, 39, 865. [Google Scholar] [CrossRef]
  11. Vasil’ev, A.N.; Buchel’nikov, V.D.; Takagi, T.; Khovailo, V.V.; Estrin, E.I. Shape memory ferromagnets. Phys-Usp+ 2003, 46, 559. [Google Scholar] [CrossRef] [Green Version]
  12. Xu, X.; Nagasako, M.; Ito, W.; Umetsu, R.Y.; Kanomata, T.; Kainuma, R. Magnetic properties and phase diagram of Ni50Mn50−xGax ferromagnetic shape memory alloys. Acta Mater. 2013, 61, 6712–6723. [Google Scholar] [CrossRef]
  13. Jin, X.; Marioni, M.; Bono, D.; Allen, S.C.; O’Handley, R.; Hsu, T.Y. Empirical Mapping of Ni-Mn-Ga Properties with Composition and Valence Electron Concentration. J. Appl. Phys. 2002, 91, 8222–8224. [Google Scholar] [CrossRef]
  14. Pagounis, E.; Chulist, R.; Szczerba, M.; Laufenberg, M. High-temperature magnetic shape memory actuation in a Ni–Mn–Ga single crystal. Scr. Mater. 2014, 83, 29–32. [Google Scholar] [CrossRef]
  15. Soto-Parra, D.; Moya, X.; Mañosa, L.; Planes, A.; Flores-Zúñiga, H.; Alvarado-Hernández, F.; Ochoa-Gamboa, R.; Matutes-Aquino, J.; Ríos-Jara, D. Fe and Co selective substitution in Ni2MnGa: Effect of magnetism on relative phase stability. Philos. Mag. 2010, 90, 2771–2792. [Google Scholar] [CrossRef] [Green Version]
  16. Kanomata, T.; Kitsunai, Y.; Sano, K.; Furutani, Y.; Nishihara, H.; Umetsu, R.Y.; Kainuma, R.; Miura, Y.; Shirai, M. Magnetic properties of quaternary Heusler alloys Ni2−xCoxMnGa. Phys. Rev. B 2009, 80, 214402. [Google Scholar] [CrossRef]
  17. Sakon, T.; Fujimoto, N.; Kanomata, T.; Adachi, Y. Magnetostriction of Ni2Mn1−xCrxGa Heusler Alloys. Metals 2017, 7, 410. [Google Scholar] [CrossRef] [Green Version]
  18. Gomes, A.M.; Khan, M.; Stadler, S.; Ali, N.; Dubenko, I.; Takeuchi, A.Y.; Guimarães, A.P. Magnetocaloric properties of the Ni2Mn1−x(Cu,Co)xGa Heusler alloys. J. Appl. Phys. 2006, 99, 08Q106. [Google Scholar] [CrossRef]
  19. Adachi, Y.; Kouta, R.; Fujio, M.; Kanomata, T.; Umetsu, R.Y.; Xu, X.; Kainuma, R. Magnetic Phase Diagram of Heusler Alloy System Ni2Mn1−xCrxGa. Phys. Proc. 2015, 75, 1187–1191. [Google Scholar] [CrossRef] [Green Version]
  20. Xu, X.; Yoshida, Y.; Omori, T.; Kanomata, T.; Kainuma, R. Magnetic Properties and Phase Diagram of Ni50Mn50−xGax/2Inx/2 Magnetic Shape Memory Alloys. Shape Mem. Superelasticity 2016, 2, 371–379. [Google Scholar] [CrossRef] [Green Version]
  21. Kanomata, T.; Shirakawa, K.; Kaneko, T. Effect of hydrostatic pressure on the Curie temperature of the Heusler alloys Ni2MnZ (Z = Al, Ga, In, Sn and Sb). J. Magn. Magn. Mater. 1987, 65, 76–82. [Google Scholar] [CrossRef]
  22. Chatterjee, S.; Giri, S.; De, S.; Majumdar, S. Giant magneto-caloric effect near room temperature in Ni–Mn–Sn–Ga alloys. J. Alloys Compd. 2010, 503, 273–276. [Google Scholar] [CrossRef] [Green Version]
  23. Chatterjee, S.; Giri, S.; Majumdar, S.; De, S.; Koledov, V. Effect of Sn doping on the martensitic and premartensitic transitions in Ni2MnGa. J. Magn. Magn. Mater. 2012, 324, 1891–1896. [Google Scholar] [CrossRef]
  24. Armstrong, A.; Nilsén, F.; Rameš, M.; Colman, R.H.; Veřtát, P.; Kmječ, T.; Straka, L.; Müllner, P.; Heczko, O. Systematic Trends of Transformation Temperatures and Crystal Structure of Ni-Mn-Ga-Fe-Cu Alloys. Shape Mem. Superelasticity 2020, 6, 97–106. [Google Scholar] [CrossRef]
  25. Kratochvílová, M.; Král, D.; Dušek, M.; Valenta, J.; Colman, R.; Heczko, O.; Veis, M. Fe2MnSn—Experimental quest for predicted Heusler alloy. J. Magn. Magn. Mater. 2020, 501, 166426. [Google Scholar] [CrossRef]
  26. Kratochvílová, M.; Klicpera, M.; Malý, F.; Valenta, J.; Veis, M.; Colman, R.; Heczko, O. Systematic experimental search for Fe2YZ Heusler compounds predicted by ab-initio calculation. Intermetallics 2021, 131, 107073. [Google Scholar] [CrossRef]
  27. Criss, J.W.; Birks, L.S. Calculation methods for fluorescent X-ray spectrometry. Empirical coefficients versus fundamental parameters. Anal. Chem. 1968, 40, 1080–1086. [Google Scholar] [CrossRef]
  28. Rousseau, R. How to Apply the Fundamental Parameters Method to the Quantitative X-ray Fluorescence Analysis of Geological Materials. J. Geosci. Geomat. 2013, 1, 1–7. [Google Scholar] [CrossRef]
  29. Haschke, M. Quantification. In Laboratory Micro-X-ray Fluorescence Spectroscopy; Springer International Publishing: Cham, Swizterland, 2014; Chapter 4; pp. 157–199. [Google Scholar] [CrossRef]
  30. Kanomata, T.; Nunoki, S.; Endo, K.; Kataoka, M.; Nishihara, H.; Khovaylo, V.V.; Umetsu, R.Y.; Shishido, T.; Nagasako, M.; Kainuma, R.; et al. Phase diagram of the ferromagnetic shape memory alloys Ni2MnGa1−xCox. Phys. Rev. B 2012, 85, 134421. [Google Scholar] [CrossRef]
  31. Straka, L.; Sozinov, A.; Drahokoupil, J.; Kopecký, V.; Hänninen, H.; Heczko, O. Effect of intermartensite transformation on twinning stress in Ni-Mn-Ga 10 M martensite. J. Appl. Phys. 2013, 114, 63504. [Google Scholar] [CrossRef]
  32. Arrott, A. Criterion for Ferromagnetism from Observations of Magnetic Isotherms. Phys. Rev. 1957, 108, 1394–1396. [Google Scholar] [CrossRef]
  33. Heczko, O.; Fähler, S.; Vasilchikova, T.M.; Voloshok, T.N.; Klimov, K.V.; Chumlyakov, Y.I.; Vasiliev, A.N. Thermodynamic, kinetic, and magnetic properties of a Ni54Fe19Ga27 magnetic shape-memory single crystal. Phys. Rev. B 2008, 77, 174402. [Google Scholar] [CrossRef]
  34. Graf, T.; Felser, C.; Parkin, S.S.P. Simple rules for the understanding of Heusler compounds. Prog. Solid. State Chem. 2011, 39, 1–50. [Google Scholar] [CrossRef]
  35. Ramudu, M.; Kumar, A.S.; Seshubai, V.; Rajasekharan, T. Correlation of martensitic transformation temperatures of Ni- Mn-Ga/Al-X alloys to non-bonding electron concentration. IOP Conf. Ser. Mater. Sci. Eng. 2015, 73, 012074. [Google Scholar] [CrossRef] [Green Version]
  36. Miedema, A.; de Châtel, P.; de Boer, F. Cohesion in alloys—Fundamentals of a semi-empirical model. Physic B 1980, 100, 1–28. [Google Scholar] [CrossRef]
  37. Miedema, A.R.; de Boer, F.R.; de Chatel, P.F. Empirical description of the role of electronegativity in alloy formation. J. Phys. F Met. Phys. 1973, 3, 1558–1576. [Google Scholar] [CrossRef]
  38. Nespoli, A.; Villa, E.; Passaretti, F.; Albertini, F.; Cabassi, R.; Pasquale, M.; Sasso, C.P.; Coïsson, M. Non-Conventional Techniques for the Study of Phase Transitions in NiTi-Based Alloys. J. Mater. Eng. Perform. 2014, 23, 2491–2497. [Google Scholar] [CrossRef]
  39. Heczko, O.; Vronka, M.; Veřtát, P.; Rameš, M.; Onderková, K.; Kopecký, V.; Krátká, P.; Ge, Y. Mechanical Stabilization of Martensite in Cu–Ni–Al Single Crystal and Unconventional Way to Detect It. Shape Mem. Superelasticity 2018, 4, 77–84. [Google Scholar] [CrossRef]
  40. O’Handley, R.C. Modern Magnetic Materials: Principles and Applications; John Wiley & Sons, Inc.: Hoboken, NJ, USA, 2000; ISBN 0-471-15566-7. [Google Scholar]
  41. Straka, L.; Fekete, L.; Rameš, M.; Belas, E.; Heczko, O. Magnetic coercivity control by heat treatment in Heusler Ni–Mn–Ga(–B) single crystals. Acta Mater. 2019, 169, 109–121. [Google Scholar] [CrossRef]
  42. Webster, P.J.; Ziebeck, K.R.A.; Town, S.L.; Peak, M.S. Magnetic order and phase transformation in Ni2MnGa. Phil. Mag. B 1984, 49, 295–310. [Google Scholar] [CrossRef]
  43. Vasil’ev, A.N.; Bozhko, A.D.; Khovailo, V.V.; Dikshtein, I.E.; Shavrov, V.G.; Buchelnikov, V.D.; Matsumoto, M.; Suzuki, S.; Takagi, T.; Tani, J. Structural and magnetic phase transitions in shape-memory alloys Ni2+xMn1−xGa. Phys. Rev. B 1999, 59, 1113–1120. [Google Scholar] [CrossRef]
  44. Enkovaara, J.; Heczko, O.; Ayuela, A.; Nieminen, R.M. Coexistence of ferromagnetic and antiferromagnetic order in Mn-doped Ni2MnGa. Phys. Rev. B 2003, 67, 212405. [Google Scholar] [CrossRef] [Green Version]
  45. Kainuma, R.; Imano, Y.; Ito, W.; Sutou, Y.; Morito, H.; Okamoto, S.; Kitakami, O.; Oikawa, K.; Fujita, A.; Kanomata, T.; et al. Magnetic-field-induced shape recovery by reverse phase transformation. Nature 2006, 439, 957–960. [Google Scholar] [CrossRef]
  46. Kainuma, R.; Oikawa, K.; Ito, W.; Sutou, Y.; Kanomata, T.; Ishida, K. Metamagnetic shape memory effect in NiMn-based Heusler-type alloys. J. Mater. Chem. 2008, 18, 1837–1842. [Google Scholar] [CrossRef]
  47. Rameš, M.; Heczko, O.; Sozinov, A.; Ullakko, K.; Straka, L. Magnetic properties of Ni-Mn-Ga-Co-Cu tetragonal martensites exhibiting magnetic shape memory effect. Scr. Mater. 2018, 142, 61–65. [Google Scholar] [CrossRef]
  48. Pushin, V.G.; Kourov, N.I.; Korolev, A.V.; Marchenkov, V.V.; Marchenkova, E.B.; Kazantsev, V.A.; Kuranova, N.N.; Popov, A.G. Effect of cobalt doping on thermoelastic martensitic transformations and physical properties of magnetic shape memory alloys Ni50−xCoxMn29Ga21. Phys. Solid State 2013, 55, 2413–2421. [Google Scholar] [CrossRef]
  49. Söderberg, O.; Koho, K.; Sammi, T.; Liu, X.; Sozinov, A.; Lanska, N.; Lindroos, V. Effect of the selected alloying on Ni-Mn-Ga alloys. Mater. Sci. Eng. A 2004, 378, 389–393. [Google Scholar] [CrossRef]
  50. Cherechukin, A.; Khovailo, V.; Koposov, R.; Krasnoperov, E.; Takagi, T.; Tani, J. Training of the Ni-Mn-Fe-Ga ferromagnetic shape-memory alloys due cycling in high magnetic field. J. Magn. Magn. Mater. 2003, 258–259, 523–525. [Google Scholar] [CrossRef] [Green Version]
  51. Kumar, A.S.; Ramudu, M.; Seshubai, V. Effect of selective substitution of Co for Ni or Mn on the superstructure and microstructural properties of Ni50Mn29Ga21. J. Alloys Compd. 2011, 509, 8215–8222. [Google Scholar] [CrossRef]
  52. Soto, D.; Hernández, F.A.; Flores-Zúñiga, H.; Moya, X.; Mañosa, L.; Planes, A.; Aksoy, S.; Acet, M.; Krenke, T. Phase diagram of Fe-doped Ni-Mn-Ga ferromagnetic shape-memory alloys. Phys. Rev. B 2008, 77, 184103. [Google Scholar] [CrossRef] [Green Version]
  53. Chen, X.Q.; Lu, X.; Wang, D.Y.; Qin, Z.X. The effect of Co-doping on martensitic transformation temperatures in Ni–Mn–Ga Heusler alloys. Smart Mater. Struct. 2008, 17, 065030. [Google Scholar] [CrossRef]
  54. Belosludtseva, E.S.; Kuranova, N.N.; Marchenkova, E.B.; Popov, A.G.; Pushin, V.G. Effect of gallium alloying on the structure, the phase composition, and the thermoelastic martensitic transformations in ternary Ni–Mn–Ga alloys. Tech. Phys. 2016, 61, 547–553. [Google Scholar] [CrossRef]
  55. Yang, S.; Wang, C.; Liu, X. Phase equilibria and composition dependence of martensitic transformation in Ni–Mn–Ga ternary system. Intermetallics 2012, 25, 101–108. [Google Scholar] [CrossRef]
  56. Ingale, B.; Gopalan, R.; Rajasekhar, M.; Ram, S. Studies on ordering temperature and martensite stabilization in Ni55Mn20−xGa25+x alloys. J. Alloys Compd. 2009, 475, 276–280. [Google Scholar] [CrossRef]
  57. Pushin, V.; Kuranova, N.; Marchenkova, E.; Pushin, A. Design and Development of Ti–Ni, Ni–Mn–Ga and Cu–Al–Ni-based Alloys with High and Low Temperature Shape Memory Effects. Materials 2019, 12, 2616. [Google Scholar] [CrossRef] [Green Version]
  58. Zhang, Y.; Li, Z.; He, X.; Huang, Y.; Xu, K.; Jing, C. Evolution of phase transformation and magnetic properties with Fe content in Ni55−xFexMn20Ga25 Heusler alloys. J. Phys. D Appl. Phys. 2018, 51, 075004. [Google Scholar] [CrossRef]
  59. Khan, M.; Dubenko, I.; Stadler, S.; Ali, N. The structural and magnetic properties of Ni2Mn1−xMxGa (M=Co, Cu). J. Appl. Phys. 2005, 97, 10M304. [Google Scholar] [CrossRef] [Green Version]
  60. Richard, M.L.; Feuchtwanger, J.; Allen, S.M.; O’handley, R.C.; Lázpita, P.; Barandiaran, J.M.; Gutierrez, J.; Ouladdiaf, B.; Mondelli, C.; Lograsso, T.; et al. Chemical order in off-stoichiometric Ni-Mn-Ga ferromagnetic shape-memory alloys studied with neutron diffraction. Philos. Mag. 2007, 87, 3437–3447. [Google Scholar] [CrossRef]
  61. Porro-Azpiazu, J.M.; Barandiaran, J.M.; Chernenko, V.; Feuchtwanger, J.; Lazpita, P.; Perez-checa, A.; Velamazan, R.; Alberto, J. Role of Fe and Co Addition in NiMnGa Shape Memory Alloys: Site Occupancy and Structural Stabilization of Crystallographic Phases; Technical Report; Institut Laue-Langevin (ILL): Grenoble, France, 2018. [Google Scholar] [CrossRef]
  62. Lazpita, P.; Barandiaran, J.M.; Chernenko, V.; Feuchtwanger, J.; Gutierrez, J.; Hansen, T.; Martinez, C.F.J.; Mondelli, C.; Perez-Checa, A.; Sozinov, A.; et al. Influence Fe Addition on Structural and Magnetic Properties of Ni45Co5Mn25−xFexGa20Cu5 (x = 0, 1, 2, 4, 5, 6 and 8) Heusler Alloys; Technical Report; Institut Laue-Langevin (ILL): Grenoble, France, 2018. [Google Scholar] [CrossRef]
  63. Perez-Checa, A.; Lazpita, P.; Porro-Azpiazu, J.M.; Feuchtwanger, J.; Velamazan, J.A.R. Site occupancy study of Fe doped Ni45Co5Mn25−xFexGa20Cu5 (x = 4 and 5) Heusler single crystals; Technical Report; Institut Laue-Langevin (ILL): Grenoble, France, 2018. [Google Scholar] [CrossRef]
  64. Li, C.M.; Luo, H.B.; Hu, Q.M.; Yang, R.; Johansson, B.; Vitos, L. Site preference and elastic properties of Fe-, Co-, and Cu-doped Ni2MnGa shape memory alloys from first principles. Phys. Rev. B 2011, 84, 024206. [Google Scholar] [CrossRef]
  65. Jie, C.; Yan, L.; Jia-Xiang, S.; Hui-Bin, X. Site Preference and Alloying Effect of Excess Ni in Ni-Mn-Ga Shape Memory Alloys. Chin. Phys. Lett. 2009, 26, 047101. [Google Scholar] [CrossRef]
  66. Ayila, S.K.; Machavarapu, R.; Vummethala, S. Site preference of magnetic atoms in Ni-Mn-Ga-M (M = Co, Fe) ferromagnetic shape memory alloys. Phys. Status Solidi B 2011, 249, 620–626. [Google Scholar] [CrossRef]
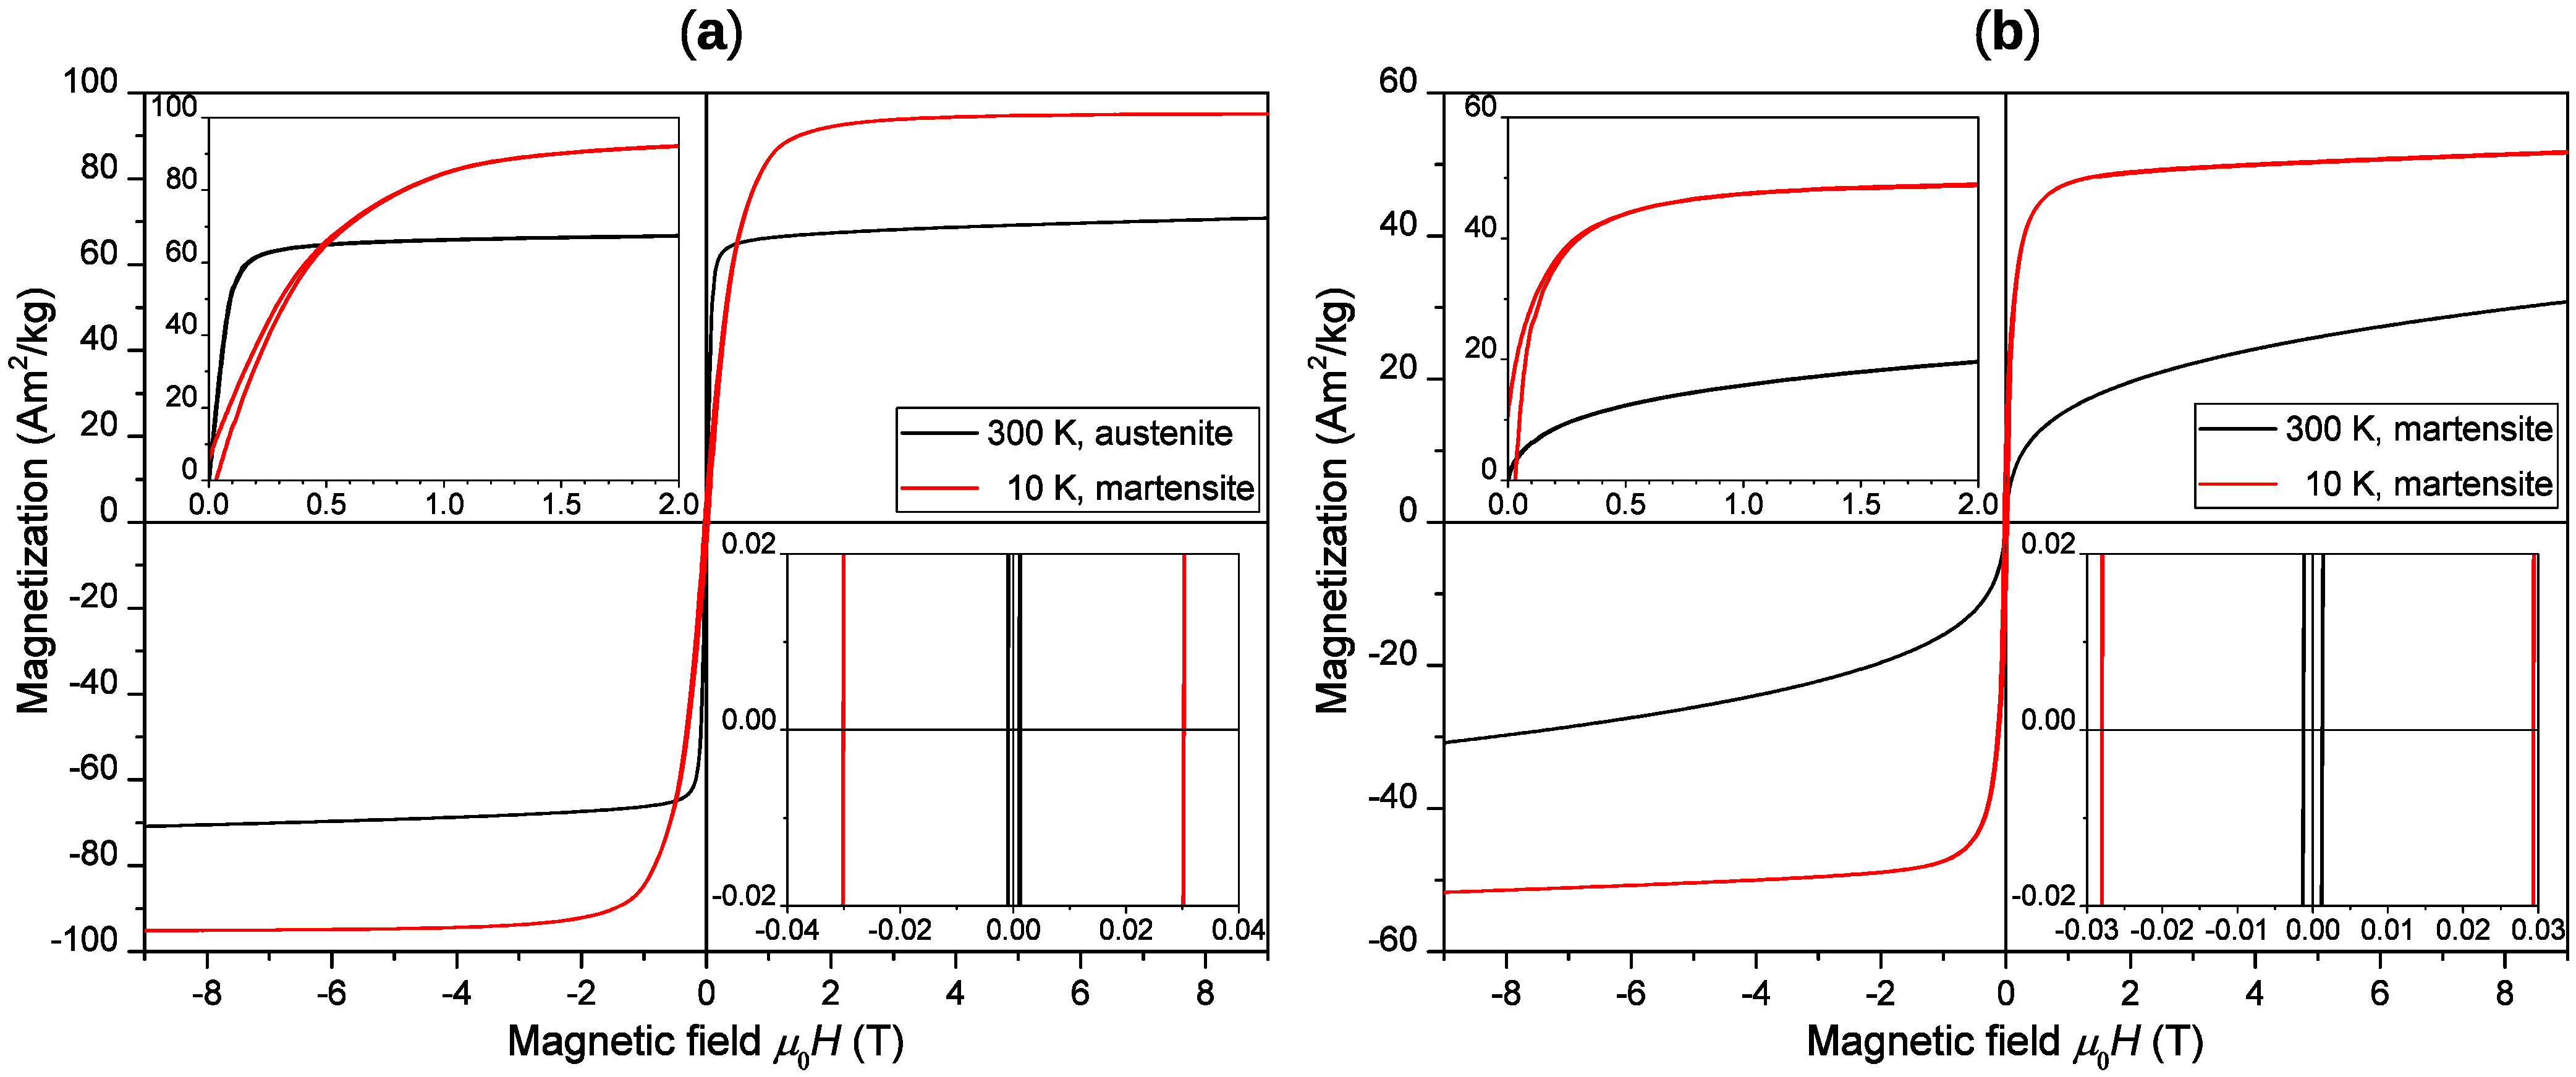
Figure 1. Isothermal magnetisation curves of (a) (Ni45.0Ni5.4)Mn24.6Ga25.0 and (b) Ni49.9Mn24.6(Ga20.4Co5.1).
Metals 11 00850 g001
Figure 2. Low-field and saturation magnetization, measured at constant magnetic field μ 0 H of 0.01 T and 2 T, respectively, as a function of temperature: (a) (Ni45.0Ni5.4)Mn24.6Ga25.0 exhibiting Curie temperature TC, premartensitic transition Tpm and martensitic transformation Tm marked in the figure; (b) Ni49.9Mn24.6(Ga20.4Co5.1) exhibiting a martensitic transformation above T C of martensite.
Metals 11 00850 g002
Figure 3. Reciprocal magnetization or susceptibility of Ni49.9Mn24.6(Ga20.4Co5.1) exhibiting martensitic transformation (MT) above Curie temperature of martensitic phase. Differential thermal analysis (DTA) measurement of the same sample confirming MT temperatures.
Metals 11 00850 g003
Figure 4. Transition temperatures dependence on composition. The full alloy compositions are shown in Table 1. The relative shift compared to stoichiometry alloy Ni45Ni5 is marked by arrows. The transformation temperatures of stoichiometry alloy are marked by dashed lines. In addition, saturation magnetization M sat 10 K , valence electrons per atom e/a and effective valence electrons per atom Ne/a parameters are shown for comparison.
Metals 11 00850 g004
Figure 5. Premartensitic (Tpm), martensitic (Tm) and Curie (TC) transition temperatures as (a) a function of number of valence electrons per atom (e/a) and (b) a function of number of non-bonding electrons per atom (Ne/a). Linear fit of Tm is well correlated to both e/a and Ne/a; TC does not exhibit a good linear fit.
Metals 11 00850 g005
Figure 6. Martensitic transformation temperatures as a function of non-bonding number of electrons per atom Ne/a. The marked vertical line corresponds to the (Ni45.3Fe5.3)Mn23.8Ga25.6 alloy exhibiting no martensitic transition with N e / a = 3.1 . Linear fit of the data provides a formula T m = 2130 × N e / a 6739 intersecting the value 3.1 below 0 K.
Metals 11 00850 g006
Figure 7. Transition temperatures dependences on composition rearranged according to a doping site. In addition, saturation magnetization M sat 10 K and e/a and Ne/a parameters are plotted for comparison. The dashed lines mark transition temperatures of the stoichiometric alloy, and the arrows emphasize a temperature deviation from them.
Metals 11 00850 g007
Table 1. Alloys with composition (atomic percent) given by XRF and their markings by unambiguous abbreviation; e/a stands for number of valence electrons per atom, and Ne/a counts non-bonding electrons per atom (evaluated from measured composition); structure is determined at room temperature, where A, NM and 14 M represent cubic austenite, tetragonal non-modulated and 14-layered monoclinic structures, respectively.
IdentifierComposition by XRFe/aNe/aStructure
Ni45Fe5(Ni45.3Fe5.3)Mn23.8Ga25.67.393.10A
Mn20Fe5Ni49.2(Mn20.5Fe5.3)Ga25.07.533.18A
Ga20Fe5Ni49.0Mn25.5(Ga20.0Fe5.5)7.733.2814 M
Ni45Co5(Ni44.9Co5.1)Mn25.1Ga24.97.453.17A
Mn20Co5Ni49.9(Mn20.1Co5.0)Ga25.07.603.25NM
Ga20Co5Ni49.9Mn24.6(Ga20.4Co5.1)7.783.35NM
Ni45Ni5(Ni45.0Ni5.4)Mn24.6Ga25.07.513.22A
Mn20Ni5Ni50.0(Mn20.5Ni4.4)Ga25.17.633.29NM
Ga20Ni5Ni50.0Mn25.4(Ga20.3Ni4.3)7.823.39NM
Table 2. Structure and lattice parameters (nm) were determined at room temperature by X-ray diffraction. XRD patterns for all compositions are shown in the Supplemental File.
Identifiera0abc γ c/aStructure
Ni45Fe50.5827(1)90A
Mn20Fe50.5814(1)90A
Ga20Fe50.6200(2)0.5764(2)0.5506(2)90.4(2)0.8914M
Ni45Co50.5822(1)90A
Mn20Co50.5535(2)0.6384(2)901.15NM
Ga20Co50.5424(2)0.6630(2)901.22NM
Ni45Ni50.5818(5)90A
Mn20Ni50.5469(4)0.6515(5)901.19NM
Ga20Ni50.5392(2)0.6701(1)901.24NM
Table 3. Parameters determined from magnetization curves: saturation magnetization Msat at 10 K and 300 K at 9 T; coercive force μ 0 H C at 10 K and 300 K. The values corresponding to austenitic phase are marked by upper-left corner symbol ⌜.
Identifier M sat 10 K M sat 10 K μ 0 H C 10 K M sat 300 K μ 0 H C 300 K
Am 2 /kg μ B /f.u.mTAm 2 /kgmT
Ni45Fe5 89.0 3.85 1.7 67.6 1.9
Mn20Fe591.43.9612.2 72.0 1.8
Ga20Fe573.83.1643.464.429.3
Ni45Co597.24.210.8 80.3 2.0
Mn20Co579.63.4610.963.47.3
Ga20Co551.72.2228.730.81.3
Ni45Ni595.14.1230.2 70.9 1.0
Mn20Ni576.73.3328.257.014.6
Ga20Ni556.92.4448.534.10.9
Table 4. Transition temperatures (K) determined from thermomagnetic measurement: martensite start and finish temperatures (Ms, Mf), and austenite start and finish temperatures (As, Af). From these four temperatures, the single value, equilibrium martensitic transition temperature (Tm) was calculated using formula T m = ( M s + M f + A s + A f ) / 4 ; Curie temperature TC of martensite is marked *; otherwise, it is austenitic TC, and an apparent Curie point is marked ** and discussed in Section 3.4.2; Tpm indicates premartensitic transition temperature.
IdentifierMsMfAsAfTmTCTpm
Ni45Fe5399
Mn20Fe5187170177195182411201
Ga20Fe5325318325333325396
Ni45Co5104100436177444151
Mn20Co5322309319330321395
Ga20Co5541520553597553304 *
Ni45Ni5205200206212206380258
Mn20Ni5382358366384373373 **
Ga20Ni5564497603621571325 *
Publisher’s Note: MDPI stays neutral with regard to jurisdictional claims in published maps and institutional affiliations.