Article

Effect of the γ→ε Phase Transition on Transformation-Induced Plasticity (TRIP) of Nickel-Free High Nitrogen Steel at Low Temperatures

Institute of Strength Physics and Materials Science, 634055 Tomsk, Russia
*
Author to whom correspondence should be addressed.
Metals 2021, 11(5), 710; https://doi.org/10.3390/met11050710
Submission received: 31 March 2021 / Revised: 14 April 2021 / Accepted: 20 April 2021 / Published: 26 April 2021
(This article belongs to the Special Issue Advances in Stainless Steel)

Abstract

:
The deformation behavior, mechanical properties, and microstructure of Fe-Cr-Mn-0.53%N austenitic stainless steel were studied at a temperature range of 77 up to 293 K. The dynamics of the steel elongation were non-monotonic with a maximum at 240–273 K, when peaks of both static atom displacements from their equilibrium positions in austenite and residual stresses in the tensile load direction were observed. The results of X-ray diffraction analysis confirmed that the only stress-induced γ→ε-martensite transformation occurred upon deformation (no traces of the γ→α′ one was found). In this case, the volume fraction of ε-martensite was about 2–3%. These transformation-induced plasticity (TRIP) patterns were discussed in terms of changes in the phase composition of steel as the root cause.

1. Introduction

In recent years, special attention has been paid to design steels that possess high strength and ductility at low climatic temperatures. Despite the higher cost, austenitic steels are preferable for operation under these conditions since they show improved mechanical properties and fracture toughness in contrast to bcc ones [1,2]. For example, both nickel-free and low-nickel steels have been designed for applications in the Arctic region [2,3,4]. In this case, the issue of replacing expensive nickel is solved by alloying with manganese and nitrogen [5,6]. As is known, nitrogen expands the austenite region, affects the stacking fault energy (SFE) values, and, as a consequence, also the deformation mechanism and the work hardening rate. Lee et al. [7] and Bazaleeva [8] have shown in their reviews that there is no unambiguous opinion on the nature of the effect of nitrogen on the SFE levels of Cr-Mn steels. In [7], the SFE vs. nitrogen content dependence for Cr-Mn-N steels has been characterized by high SFE values in the range of 10 to 28 mJ/m2 with the enhancement of the amount of nitrogen from 0.39 to 0.69 wt.%. In this case, austenite was unstable at 10 mJ/m2, but stable at 28 mJ/m2. Bazaleeva has reported [8] that the likelihood of stacking faults (SF) increases with the raising of the nitrogen content. Since the SF density is inversely proportional to the SFE values [9], enhancing the nitrogen content in Cr-Mn-N steels decreases their SFE levels. There is no controversy regarding the SFE vs. temperature dependence for austenitic steels [10,11,12]. It is known that the SFE level is reduced with decreasing temperatures, and the SFE vs. temperature dependence is more pronounced for nitrogen-doped steels than for carbon-containing ones with the same amount of other alloying elements [11]. Therefore, if austenite is stable during the deformation of the high-nitrogen steels at room temperature, then the transition from the stable state to the metastable one is possible with a decrease in the deformation temperature. In this case, the γ→ε or γ→ε→α′ transformation begins due to the low-temperature deformation [12]. The transition occurs sequentially through the γ→ε→α′ stages as the deformation degree increases to the same temperature [4,13,14,15]. Consequently, the deformation mechanisms, which determine the work hardening rate at various deformation stages, can be different for the same steel. For example, Martin et al. [12] have described the transformation stages with reductions in the deformation temperature as the dislocation glide→twinning→ε→α′ sequence.
It has been shown in [3,7,14,15,16,17] that 17Cr-10Mn, 18Cr-18Mn-2Mo, and 18Cr-16Mn-2Mo steels are characterized by the fcc lattice and twinning-dominant deformation stability if they have been alloyed with nitrogen in amounts above 0.5 wt.%. Moreover, ε-martensite (with the hcp lattice) has been formed in these steels instead of the α′ phase. The same effect has been observed for ones of similar composition (with 0.51–0.53%N and 0.03–0.07% C) if they have been deformed at room temperature above the ε true strain of 0.3. Moreover, the transformation is possible upon frictional processing [18] or ultrasonic forging [19] of their surfaces.
The present paper is devoted to the study of the γ→ε transformation-induced plasticity (TRIP) and the strength properties of Cr-Mn-N steel under tensile loads at low temperatures.

2. Materials and Methods

The chemical composition of the studied steel is presented in Table 1.
The steel was prepared in an induction furnace. Armco iron, ferromanganese, ferrochrome, and nitrided ferrochrome were used as feedstock. The steel ingots were homogenized at a temperature of 1523 K for 3 h, and then forged to fabricate sheets with a thickness of 12 mm. The sheets were solution-treated at a temperature of 1373 K for 1 h, and then quenched in water.
Tensile tests were performed using an INSTRON 5582 testing machine (Norwood, OG, USA) at temperatures of 77 to 293 K and a nominal deformation rate of 1.87 × 10⁻⁴ s–1. Three samples were tested at each temperature. The σuts, σ0.2, and δ values were determined as the arithmetic means of all three measured ones. The samples were cut by electrical discharge machining, mechanically ground, and polished with diamond pastes. The lengths of their thinned parts were 15 mm and their cross-sections were 1.0 mm × 2.5 mm. Before the tests, the samples were electropolished in H3PO4 (430 mL) + CrO3 (50 g) electrolyte.
For transmission electron microscopy (TEM), thin foils were cut from uniformly deformed regions of the samples after the tensile tests. They were prepared in a twin-jet electropolisher using the same electrolyte and examined by a Tecnai 20 G2 TWIN TEM (FEI Company, Hillsboro, OR, USA) at an accelerating voltage of 200 kV.
The surface morphology of the fractured samples was studied using a LEO EVO 50 scanning electron microscope (SEM; Zeiss, Oberkochen, Germany).
After the tests, the microstructure of the samples was investigated by both the TEM and X-ray diffraction (XRD) methods. Phase fractions were assessed using an XRD-7000 diffractometer (Shimadzu, Kyoto, Japan) with Cukα radiation (the samples were not rotated). The parameters of the fcc and hcp lattices were measured, and the root mean square (RMS) atom displacements <Ū2> in the austenite lattice were investigated in Bragg–Brentano geometry from the ratio of the integrated intensities of the (111)γ and (222)γ diffraction peaks, as denoted by the following equations [20]:
U ¯ 2 = C ln [ I ( θ 2 ) / I ( θ 1 ) ]
where I(θ1) and I(θ2) are the (111)γ and (222)γ integral intensities of the austenite reflexes.
С = 3 λ 2 16 π 2 ( sin 2 θ 1 sin 2 θ 2 ) × ln [ | F 1 | 2 | F 2 | 2 × Φ 1 Φ 2 × P 1 P 2 ]
λCu = 1.54 Ǻ is the X-ray beam wavelength; θ1 and θ2 are diffraction angles; |F1|2 and |F2|2 are the structural factors of intensity of the (111)γ and (222)γ austenite reflections, respectively; |Fi|2 = 16 f(θi) [21]; f(θi) is the material scattering factor, calculated from the sin(θi)/λ value for each of the (111)γ and (222)γ austenite reflexes; P1/P2 = 1 is the ratio of the repeatability factors for the {111} planes in the fcc lattice.
Φ i = P i L i G i = 1 + cos 2 2 θ i sin 2 θ i × cos θ i ,
where Pi is the polarization factor; Li is the Lorentz factor; Gi is the geometric multiplier of the survey conditions.
It was shown in [20,21,22] that the magnitude of the displacement, namely the U ¯ 2 square root of the total RMS displacement, is proportional to the number of atoms per Bravais cell. There are four atoms per Bravais cell in the fcc lattice. Consequently, the U ¯ 2 value had to be divided by 4.
The austenite and martensite volume fractions were determined using the following relation [23]:
V i = Σ j = 1 n I i j f i j ( θ i j ) Σ j = 1 n I γ j f γ j + Σ j = 1 n I ε j f ε j + Σ j = 1 n I α j f α j ,
where γ, ε, or α’ are the phases, and n is the number of the examined diffraction maxima; Iγ, Iε, and Iα are integrated intensities for the γ, ε, or α′ phases; j represents the plane index.
Figure 1 shows the sample orientation during the study of residual oriented deformations in the fcc austenite lattice.
The investigations were carried out in the asymmetric (not Bragg–Brentano) geometry by the XRD sin2ψ method [24] at the ψhkl angles from 0 to 50°, where ψhkl is the angle between the normal to the hkl planes and the normal to the sample surface. After the tensile tests at low temperatures, the sign (positive or negative) of the fcc lattice strains and associated residual stresses were determined from the change in the austenite lattice parameter calculated for all hkl planes, depending on their orientation.
The SF density was calculated from the (111)γ–(200)γ multidirectional shear reflections of austenite [25].

3. Results

3.1. Tensile Properties

Figure 2 shows the deformation behavior of Cr-Mn-N steel as a function of the test temperature.
The dynamics of true stresses with increasing true strains were the same for all tensile test temperatures (Figure 2a). On the work hardening rate vs. true strain curves, there were sections with both constant and volatile work hardening rates (Figure 2b). At the test temperatures of 208 and 253 K, plastic deformations of the samples were developed non-uniformly since there were several sections with constant work hardening rates. In these cases, the total lengths of these sections were approximately the same for each of the test temperatures. As it was shown in [15], similar curves were observed for specimens with multiple localized deformations. The numbers of necks and the sections of both types were about the same. The localization feature of deformation characteristics is the most important feature of Cr-Mn-N steels [26]. Multiple localized deformations were possible if hardening in the first formed neck had promoted the predominant deformation of another macro-volume of the sample, in which the linear hardening stage continued until the formation of the second neck, and so forth. It was also reported in [15] that the microstructure in such zones was characterized by greater numbers of defects, and ε-martensite was presented in the steel after deformations at all studied temperatures. Consequently, the multiple localized deformations and the decrease in the work hardening rates (at the appropriate stages) were associated with the γ→ε phase transformation. The ε1, ε2, and ε3 true strains are indicated in Figure 2b (for the test temperatures of 293, 253, and 208 K, respectively), for which the γ→ε transformation occurred at the first deformation stage. They decreased with reducing test temperatures since ε3 < ε2 < ε1. At the same time, corresponding true stresses were approximately the same (1040 ± 50 MPa, according to Figure 2a) and did not depend on the test temperature.
Asgary et al. showed [27] that twinning was the main deformation mechanism at the constant work hardening rate stage. Nevertheless, it was not the only one that influenced the process throughout its entire duration. By increasing the deformation degree and/or reducing the test temperature, the γ→ε transformation began to affect the process in conjunction with twinning [15,17]. Changes in work hardening rates after the linear deformation stage were reported in steels and alloys with low SFE levels because of the material reaction to the involvement of phase transformation stresses in the relaxation process [15,27].
Another deformation behavior was observed in the tensile test at 77 K (Figure 2b). Firstly, there were no constant work hardening rate stages. In addition, a stage of a short-term increase in the work hardening rate was presented after its monotonic reduction from the very beginning of the deformation process. Similar temperature dependence of the deformation behavior is characteristic of metastable steels [12,13,28]. In this case, stress-induced α′-martensite was found in the microstructure. As it was shown in our previous paper [15], α′-martensite was formed only in the regions of localized deformations upon the tensile tests at a temperature of 77 K, but it was absent in the uniformly deformed ones.
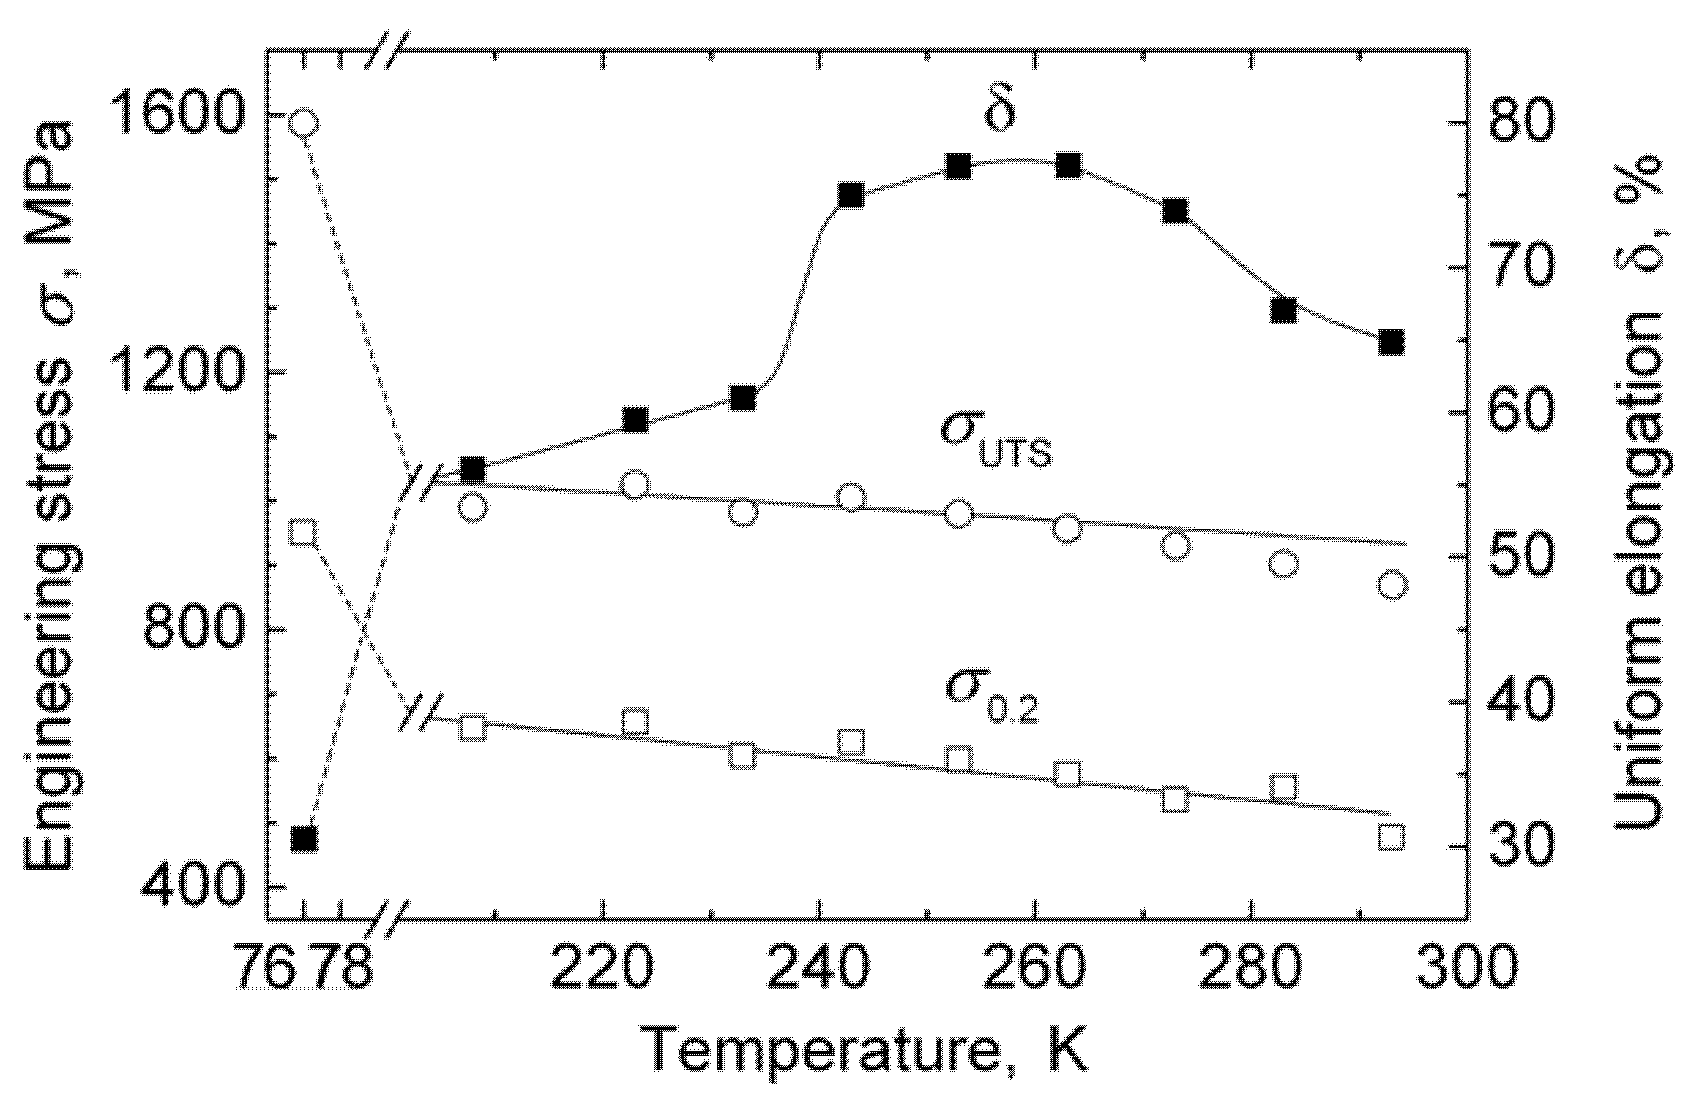
The temperature dependences of the ultimate tensile strength (σUTS), yield strength (σ0,2), and elongation (δ) are shown in Figure 3.
The strength properties increased linearly with reductions in the test temperature. An increase in both ultimate tensile strength and yield strength was about 20 MPa for every 10 K of test temperature reduction. The elongation values changed non-monotonically with a maximum in the temperature range of 240 to 273 K. At the same time, the work hardening rate did not increase (as follows from Figure 2b), which is typical for metastable steels [12,13,14]. The change in the elongation level (Figure 3) was similar to that reported in [12]. In that case, Cr-Mn-Ni steel (SFE = 17 mJ/m2 at room temperature) showed an increase in plasticity with decreases in the test temperature (the maximum values were at 313–373 K). The authors of [12] assumed that twinning was the main contributor to the increases in the elongation values, while their reductions were due to the beginning of the γ→ε→α′ phase transformations.

3.2. The Microstructural Studies of the Deformed Samples

3.2.1. The Phase Composition

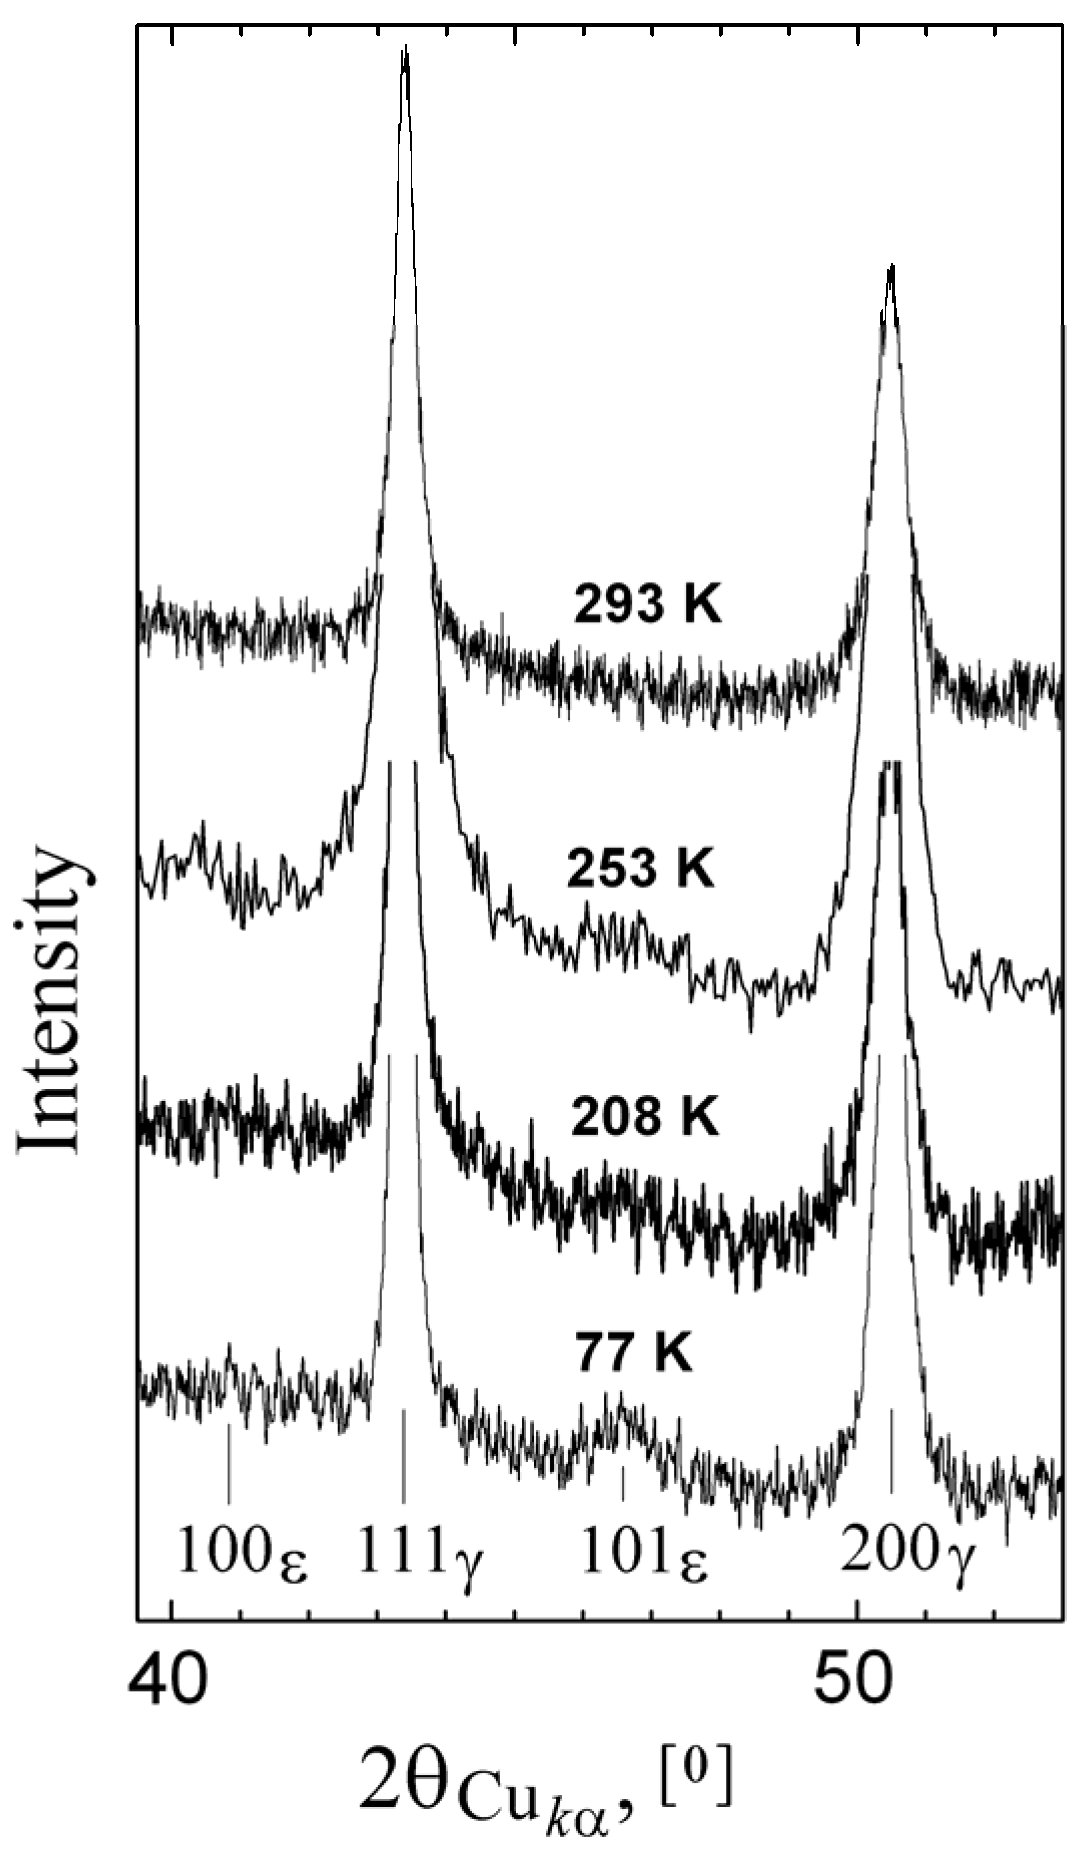
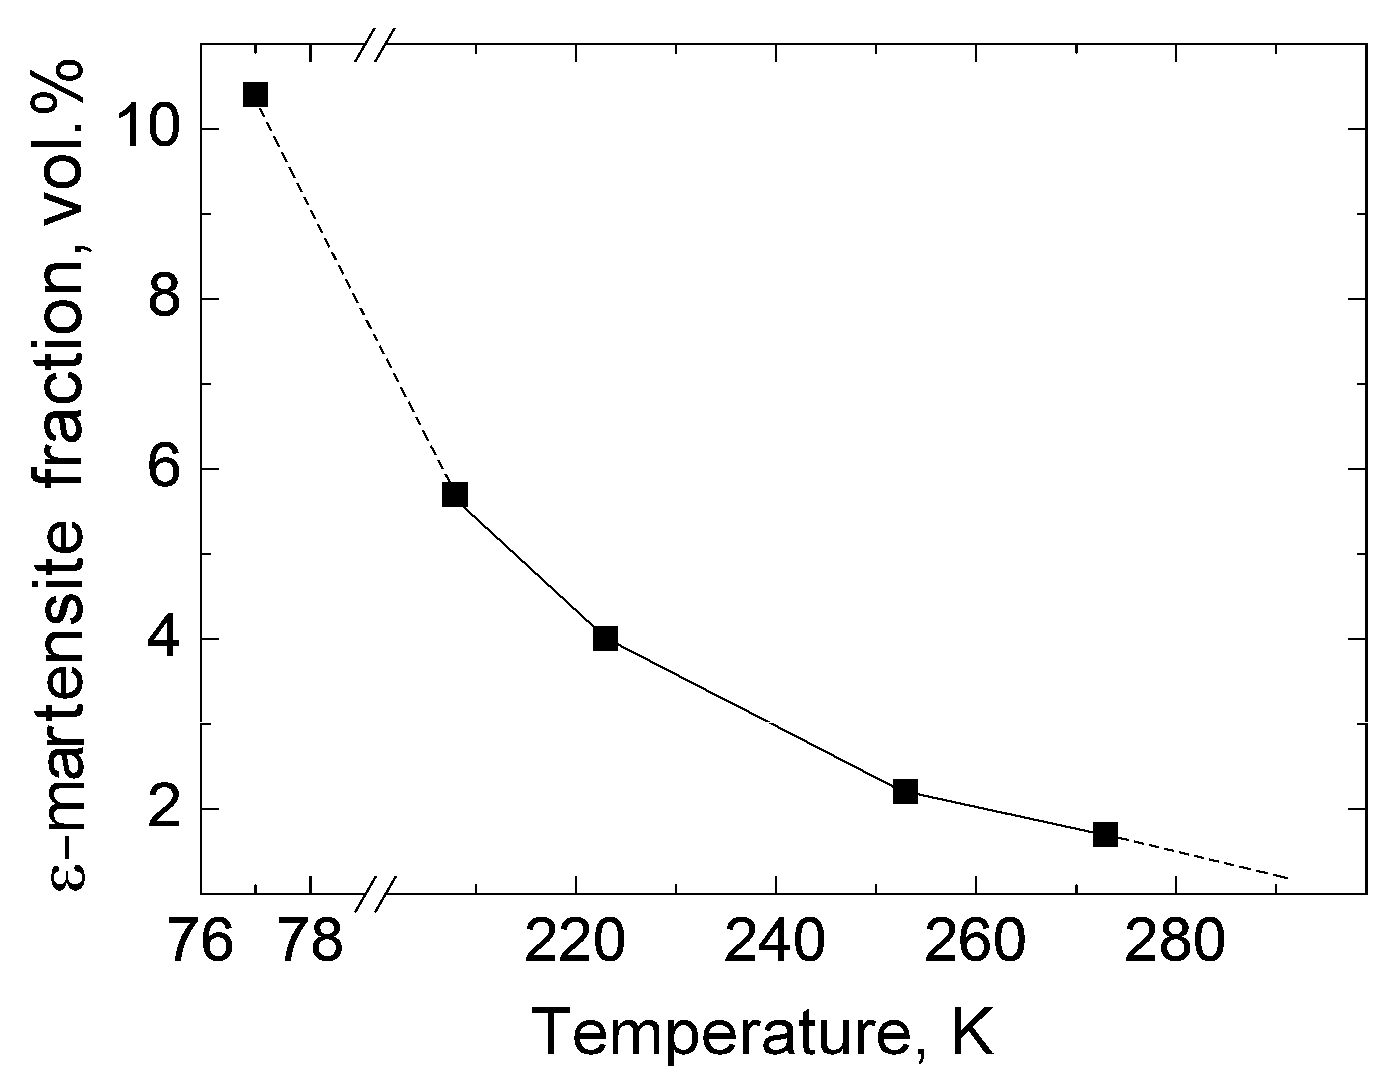
Figure 4 shows fragments of the diffraction patterns of the steel after the tensile tests. In this case, the range of the 2θ angle was from 40 to 53°. Consequently, the following reflections could be found: (111)γ and (200)γ of austenite, (100)ε and (101)ε of ε-martensite, as well as (110)α of α′-martensite. After the tensile tests at room temperature, only reflexes from austenite were observed. After lowering the test temperature, the hcp ε-martensite peaks were clearly visible in the absence of the bcc α′-martensite ones. Since Iα = 0, it was enough to determine one of them when assessing the Vγ and Vε volume fractions. In this case, the Vγ = 1 − Vε relation was fulfilled. The intensity of the ε-martensite diffraction peaks increased with reductions in the test temperature down to 77 K. The increase in the volume fraction of ε-martensite ranged from 1.7% at 273 K to 10.4% at 77 K (Figure 5). Its formation was a factor that contributed to the relaxation of external stresses. Due to this factor, the plasticity of the steel was higher at the temperature range of 240 to 273 K than that at room temperature.
After the tensile tests, the ε-martensite lattice parameters were determined from the d(100)ε d(101)ε interplanar distances (Figure 4): a = 0.2527 nm, c = 0.4277 nm (c/a = 1.69) at 223 K; a = 0.2530 nm, c = 0.4264 nm (c/a = 1.69) at 208 K, as well as a = 0.2530 nm, c = 0.4248 nm (c/a = 1.68) at 77 K. It should be noted that these parameters were a = 0.2548 nm, c = 0.4108 nm (c/a = 1.61) in the similar 18.3%Cr-9.7%Mn-0.61%N-0.02%C steel after the tensile test at 273 K [17]. In this case, the data were determined by Rietveld refinement on neutron profiles, which differed significantly from the values obtained in [17] due to residual micro-stresses. Crystals of ε-martensite, formed during low-temperature deformation, facilitated the relaxation of external stresses and, thereby, prolonged the plastic deformation of the steel. Moreover, they prevented the elastic relaxation of the fcc austenite lattice after the sample fracture. In this case, ε-martensite was in the elastic compression state along the σ1 load direction according to Figure 1, but its lattice was deformed along the σ2 one. This caused the increased c/a ratio, which promoted easy plastic deformation of the hcp ε-martensite lattice by sliding along the (001)ε <110 > ε basal planes.

3.2.2. RMS Atom Displacements in the Fcc Lattice

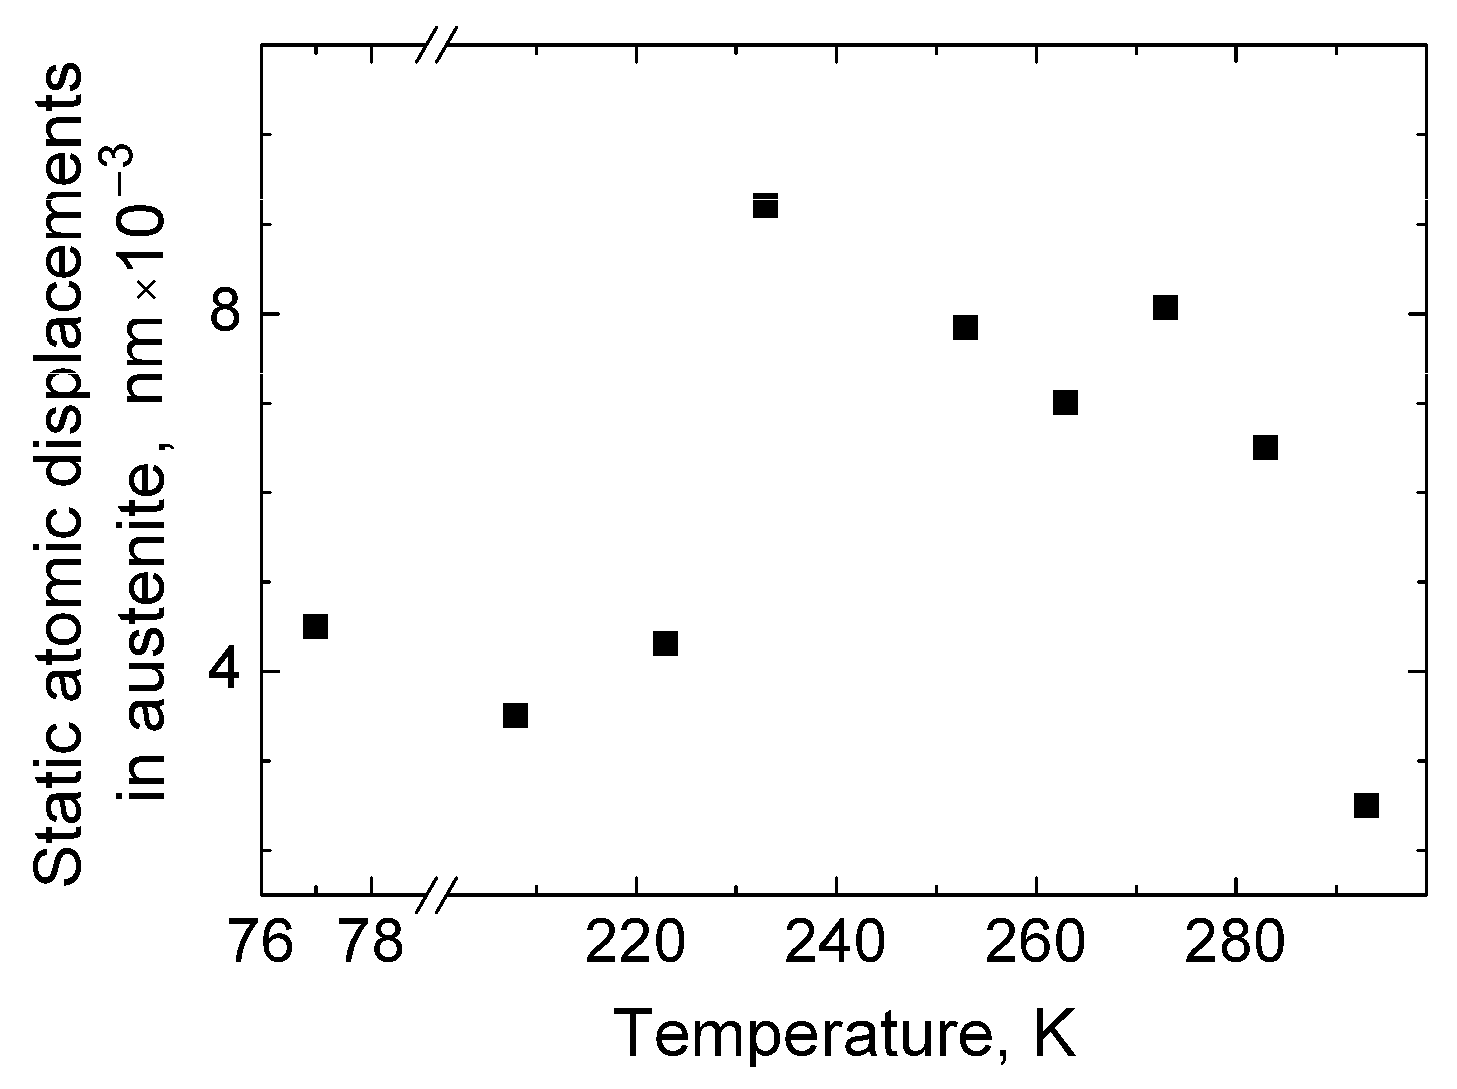
One of the important parameters, characterized by the instability of the austenite crystal lattice prior to its transformation into ε-martensite, was the RMS atom displacements from their equilibrium positions in the fcc lattice. After the tensile test at room temperature, the U ¯ 2 = U ¯ s t 2 + U ¯ d i n 2 relation was fulfilled [20], where the U ¯ d i n 2 addendum is considered to be the thermal vibrations of the atoms. At lower temperatures, thermal vibrations of the atoms in the fcc lattice could be neglected and, respectively, this parameter consisted mainly of the U ¯ 2 U ¯ s t 2 static displacements. Figure 6 shows the 1 4 U ¯ 2 vs. temperature dependence.
The dynamics of the changes in atom displacements were similar to the uniform elongation vs. temperature curve (Figure 3). With reductions in the test temperature, the displacement distances firstly increased (reaching 0.009 nm at 230 K) and then decreased to 0.004 nm. It should be noted that peaks of steel plasticity and atom displacements were observed at the same temperature. This gives reason to believe the following: (i) the U ¯ d i n 2 addendum, considered to be the thermal vibrations of atoms, did not make a significant contribution to their total displacements upon deformation at room temperature; (ii) static displacements were of a deformation nature.
Thus, TRIP occurred due to the γ→ε transformation with reductions in the test temperature from 293 to 230 K simultaneously, with enhancements of the non-equilibrium level (phase instability) of the fcc lattice. In addition, the experiment showed that static atom displacements were 0.01 nm at a test temperature of 208 K and an ε strain of 0.1. In this case, the main deformation mechanism was mechanical twinning. Nevertheless, displacements were 0.002 nm just before the sample fracture at an ε strain of 0.4. In other words, the high instability of the fcc lattice characterized its ability for phase transformation. The formation of ε-martensite crystals reduced static atom displacements and, consequently, this instability. After the tensile tests at 77–230 K, the values of static atom displacements were two times less than those at 230–273 K (Figure 6). This indicates that enhancing the volume fraction of ε-martensite while reducing the test temperature is consistent with the data presented in Figure 5.

3.2.3. Residual Stresses

The reason for residual stresses in the deformed polycrystals was the difference in the Young’s modulus values of grains with various orientations, as was shown by M. Ojima et al. in the example of high-nitrogen single-phase austenitic steels [29]. The elastic deformation of grains with [200] rigid orientation was significantly higher than that of ones with other orientations, since the E200 Young’s modulus was lower than the Ehkl level of alternative crystallographic directions. According to [30], E200 was less than E111 by 40%, and less than E220 by 25%. With reductions in the test temperature, both Young’s modulus and G shear modulus increased for austenitic steels [31]. For the γ/ε dual-phase steels, Young’s modulus for ε-martensite (formed due to plastic deformation) was greater than that for austenite [32]. Under the tensile load, local gradients were enhanced in both the fcc and hcp lattices. As a result, residual stresses depended on the mutual influence of the coexisted phases after the sample fracture.
Figure 7 qualitatively characterizes the stress state of the fcc austenite lattice after the tensile tests at the temperatures of 293, 253, and 77 K. The aγ lattice parameter increased with the increase in the ψ angle from 0 to extrapolated values of 90°.
Pearson’s correlation coefficient (r) was 0.403, 0.59, and 0.47 for test temperatures of 293, 252, and 77 K, respectively. This means there was a moderate degree of linear correlation between the change in the lattice parameter of austenite depending on the orientation of the crystallographic planes or the ψ angle. The interpolation lines had a weaker slope for the temperatures of 293 and 77 K than that for 253 K. If the main reason for residual stresses was the presence ε-martensite, then its participation was insignificant after the sample fracture at 293 K due to its small volume fraction (Figure 5). At 77 K, the γ→ε transformation started from the very beginning of plastic deformation (Figure 2 and [15]). In this case, the volume fraction of the ε-martensite reached 10.4%, as the samples were evenly elongated (Figure 5). Respectively, low residual stresses in austenite were observed after the sample fracture due to plastic deformation of the hcp ε-martensite lattice. This could also explain the reduced elongation values in the test temperature range of 77–230 K.
The interpolation line obtained after the tensile test at 253 K had a greater slope (Figure 7b) compared to those previously discussed. Consequently, the austenite crystal lattice was more deformed after the sample fracture. As a result, the level of residual oriented stresses (caused by this elastic deformation in the σ1 tensile direction) was also higher than after the tests at temperatures of 293 and 77 K.
For each of the sin2ψ values, the aγ levels were dispersed due to both Young’s modulus anisotropy for different crystallographic directions and the SF formation. The multidirectional shift of the (111)γ and (200)γ austenite reflections (Figure 8) indicated an increase in the SF density.
The austenite lattice parameter had the highest value for the (200)γ plane, since its reflection shifted towards lower 2θ angles during the SF formation. The austenite lattice parameter calculated for the (111)γ planes was the lowest since the reflection shifted in the opposite direction. It should be noted that the shifts were observed only for the samples after the tensile tests at 293 and 253 K, but not at 77 K. With reductions in the test temperature, the SF density (α) increased from 0.0064 at 293 K up to 0.0152 at 253 K. After the test at 77 K, α was 0.0008, which was significantly less than those at other temperatures. Consequently, the deformed SF was transformed into ε-martensite with the same hcp lattice due to their interaction.

3.2.4. TEM Investigations

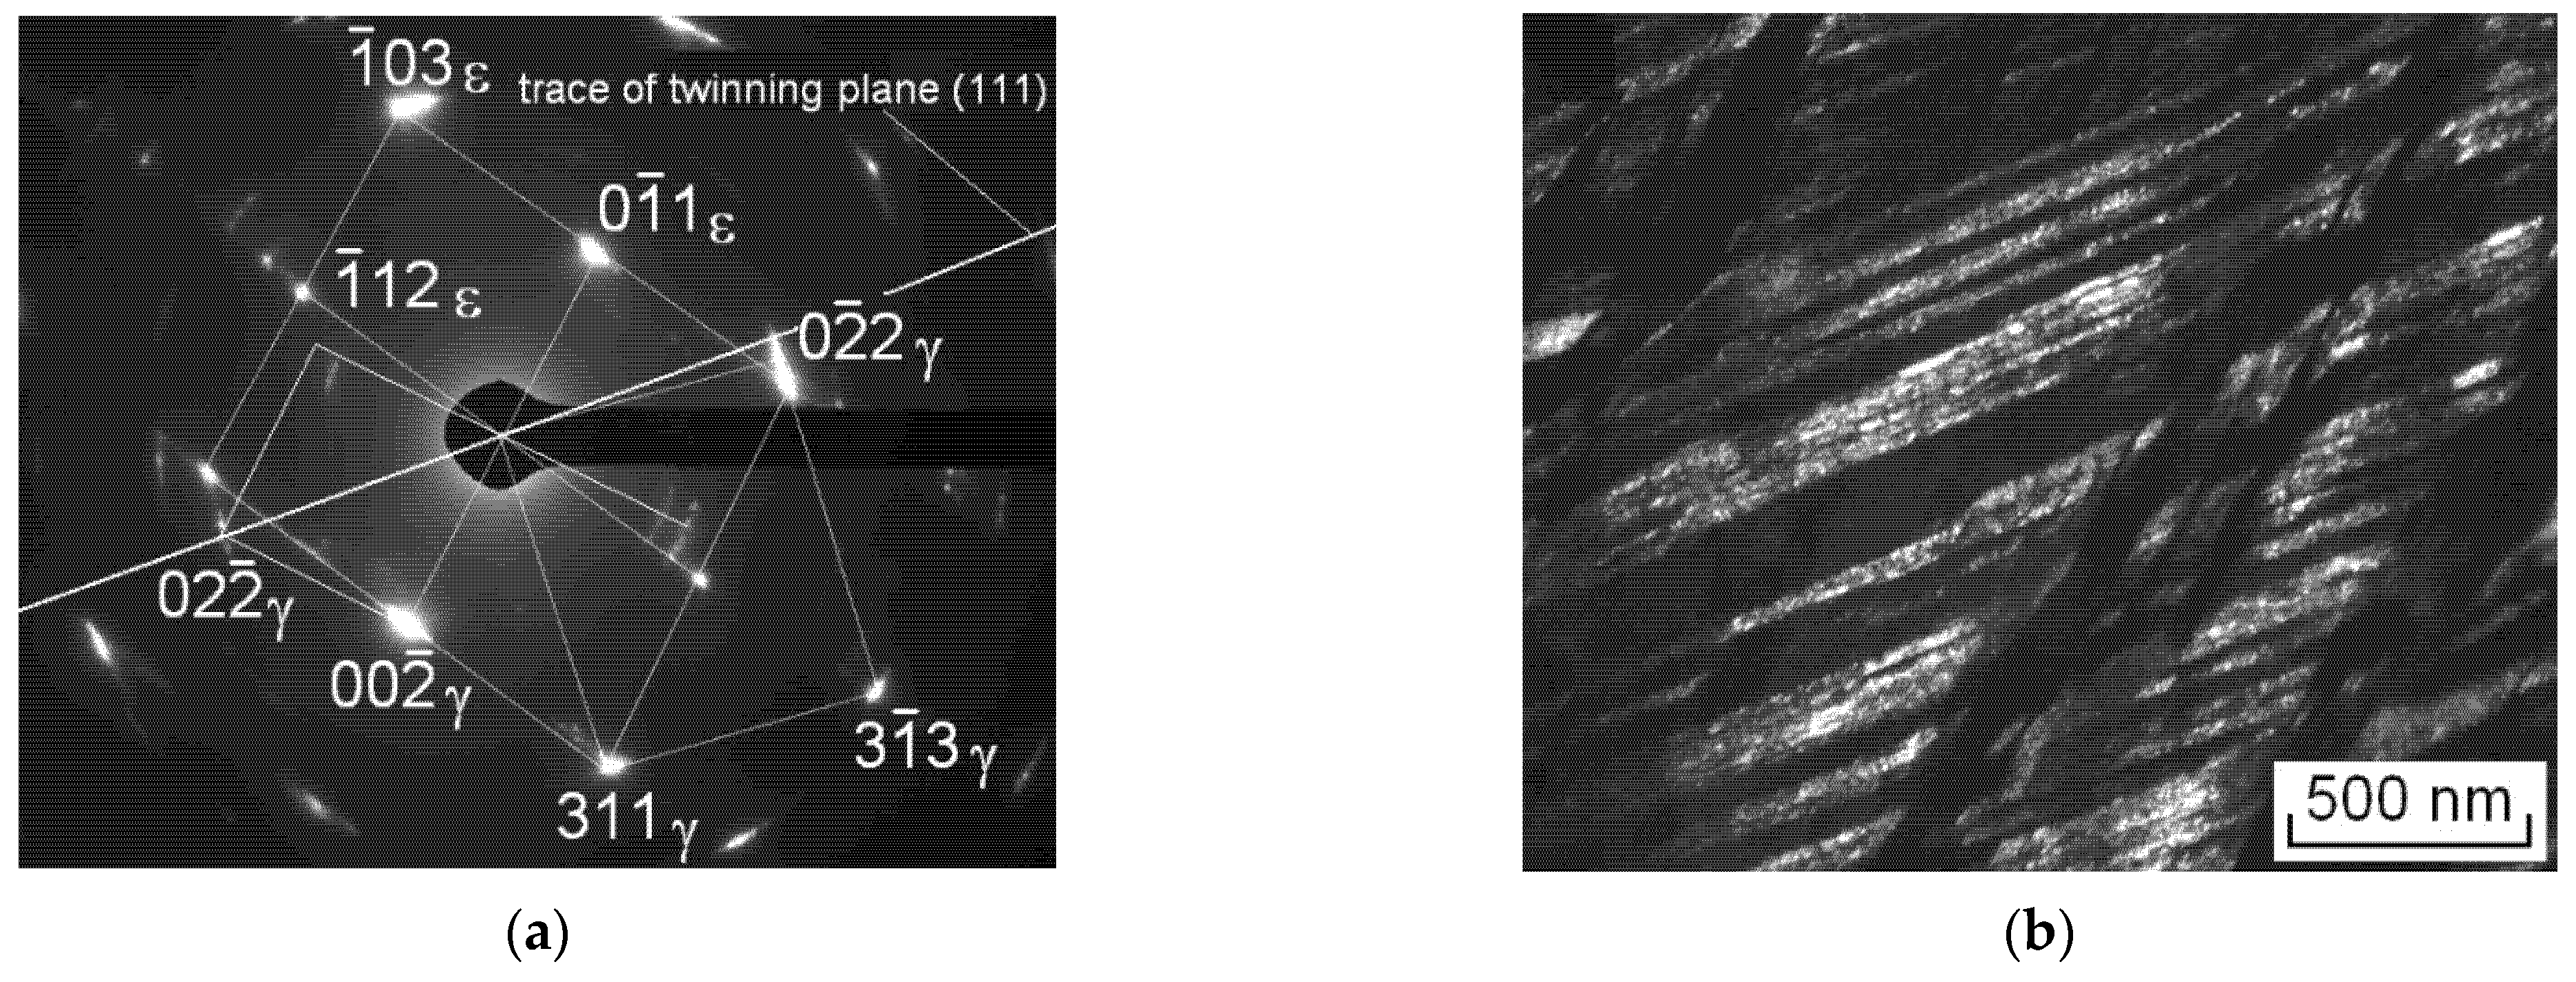
Figure 9 shows the electron diffraction pattern and the microstructure of the sample after the tensile test at 253 K (which exhibited the highest level of plasticity).
Reflexes of austenite and ε-martensite were found in the microdiffraction pattern. Some of the reflections (for example, (311)γ, (10 3 ¯ )ε, (002)γ, and (0 1 ¯ 1)ε) belonged simultaneously to both phases. In addition, they were characterized by close interplanar distances and small misorientations of about 6°. Therefore, they were blurred in the radial and azimuthal directions. Crystals of ε-martensite (1–5 nm in size) were located in bands oriented as austenite twins with the (111)γ twinning plane. Since twinning and the γ→ε transformation had followed one after another with increasing strains, the most probable areas of the ε-martensite nucleation were the SF and the regions adjacent to the boundaries of austenite twins. The γ→ε transformation caused the formation of nano-sized ε-martensite crystals. This was an alternative mechanism for twinning under conditions when strains by dislocation slip or twinning were hindered due to high static atom displacements in the fcc lattice. Austenitic interlayers were also found in the ε-martensite bands. After the sample fracture, the formed ε-martensite crystals prevented elastic recovery of the fcc lattice, which caused its deformation along in the tensile direction. This was the reason for the highly stressed state of the steel microstructure after the test at 253 K.
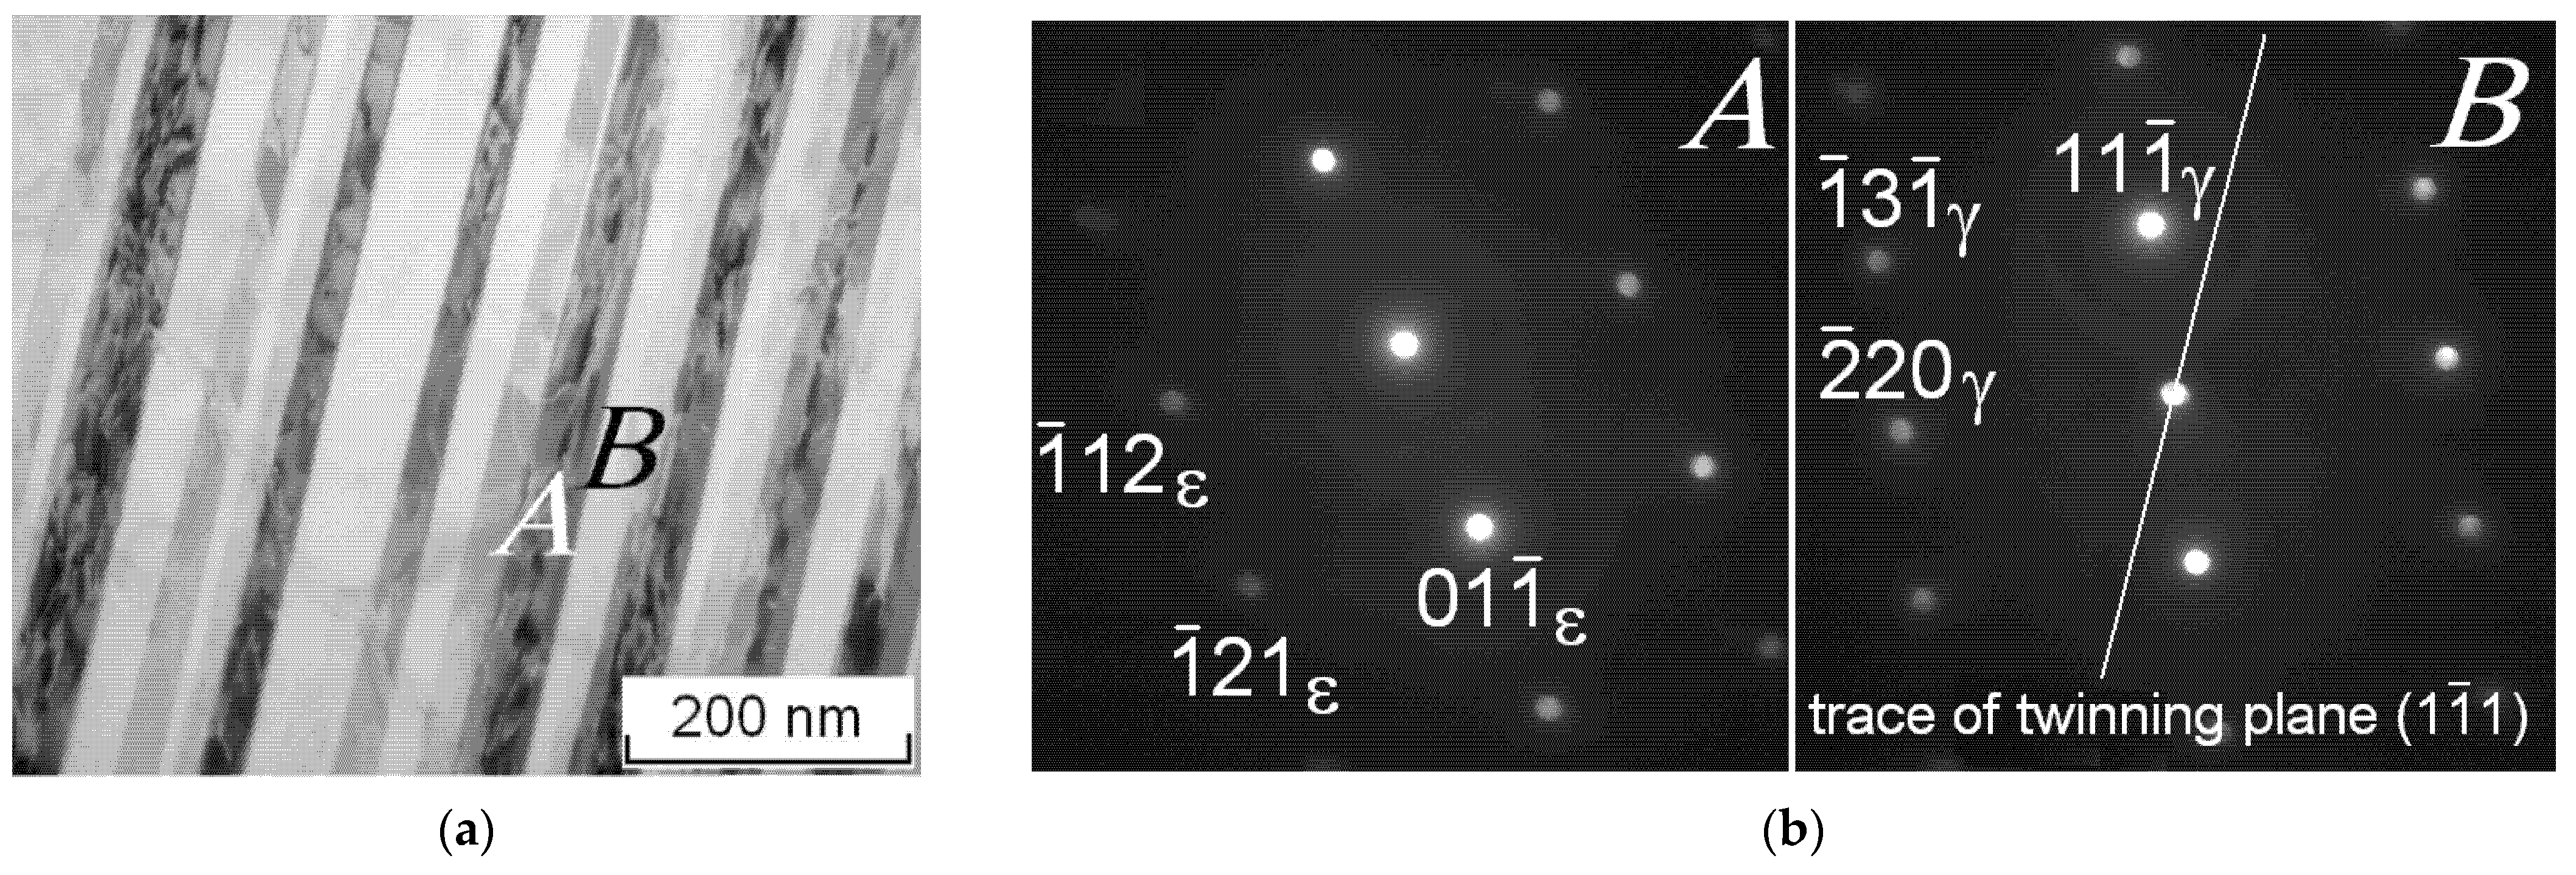
Figure 10a shows a bright-field image of the steel microstructure after the tensile test at 77 K. The alternating A and B plates belonged to different phases. The A plate was hcp ε-martensite and the B one was fcc austenite (Figure 10b). The ε-martensite plates were 20–50 nm in size, which was significantly larger than those after the test at 253 K. Inside them, dislocation substructures were found, which indicated plastic deformations. The Shoji–Nishiyama orientation relationship was characterized by the parallelism of close-packed planes of the fcc and hcp crystal microstructures {111}γ||{001}ε [14] Consequently, plastic deformation of ε-martensite with the increased c/a ratio was easily carried out by shifting along the planes of the hcp lattice basis (parallel to the (1 1 ¯ 1) twinning plane of the fcc lattice). A trace of this shift is shown in Figure 10b.
It should be noted that no constant work hardening stage was observed for the sample after the tensile test at 77 K (Figure 2). Respectively, twinning and the formation of ε-martensite was simultaneous and not sequential, as in the case of the tests at 293 and 253 K (Figure 2b). With enhancing strains, crystals of ε-martensite coalesced in bands, the boundaries of which also belonged to deformed austenite twins. Subsequently, the deformation of both phases was simultaneous during the test, and both of them contributed to the elongation of the sample.

4. Discussion

Separately assessing the contribution of deformation twinning as well as stress-induced γ → ε or ε → α′ transformations to the hardening TRIP steels and steels with twinning induce plasticity (TWIP) and their ability to relax external stresses without fracture is a difficult (practically impossible) task. The addition of the mechanisms of the crystal lattice transformation to twinning occurred gradually with increasing deformation degrees.
The dynamics of the true stress vs. true strain and work hardening vs. true strain curves enabled us to judge the effect of deformation on the stress-induced transformations in the fcc lattice. The sigmoidal type of the first curve and the sinusoidal character of the second one were typical for the metastable steel upon the γ→ε→α′ sequential transformation [3,12,13,14,28,34]. In this case, ε-martensite was considered an intermediate phase that had preceded the formation of α′-martensite [12,14]. Typically, the TRIP steels showed parabolic true stress vs. true strain curves with constant work hardening stages, in which mechanical twinning prevailed upon deformation [3,14,15,33,34]. The γ→ε transformation following twinning was manifested by the decrease in the work hardening rate [15]. Cooperative mechanisms associated with the crystal lattice transformation depended on the SFE value, which reduced with decreasing temperatures [7,10,11,12,17,34,35,36]. In particular, ε-martensite was formed at SFE < 16 mJ/m2, but the austenitic microstructure was stable and the steel was deformed by twinning at SFE > 25 mJ/m2 [34]. According to [35], the γ→ε transformation occurred at SFE < 18 mJ/m2, while deformation by twinning dominated in the SFE range of 12 to 35 mJ/m2. In this case, both processes had followed one after another (the former favored the latter). The formation of ε-martensite in high-nitrogen steels was investigated by Lee et al. [7,14,17]. The authors showed that the carbon-to-nitrogen ratio affected the γ→ε transformation: the amount of ε-martensite increased with a decrease in the C/N ratio from 0.94 to 0.03. At room temperature, the strain-induced γ→ε transformation was observed at high stress levels only. This result was consistent with the data obtained in this research and [15]’s: a long down-slope stage of the work hardening rate was observed from the ε strain of 0.3 to 0.44 (when the sample fractured).
Another factor, related to the SFE value and affecting the transformation behavior, was the SF formation probability. In austenite, it increased with reductions in the test temperature [10,11,12]. The ε-martensite was formed by the SF overlapping [14]. The crystallographic orientation of the ε-martensite crystals was related to the matrix by the known relationship, in which the {111}γ austenite twinning planes were parallel to the {001}ε ε-martensite basal planes. The γ→ε transformation could be regarded as a homogeneous half-twinning shear on the {111}γ basal shear plane, on which a shuffle of every second basal plane was superimposed [37], or as an SF regular arrangement on every second {111}γ plane [12].
With increasing deformation, the SF formation probability enhanced and caused atom displacements from their equilibrium positions in the fcc lattice. The instability of this lattice was an additional important factor that influenced the transformation behavior of the steel. Due to atom displacements, local curvatures of the fcc lattice crystallographic planes occurred [27]. In such a lattice, both slip and twinning dislocation mechanisms were hindered. Therefore, local internal stresses rose and relaxed due to the γ→ε transformation, which contributed to increasing elongation. The level of deformations, at which the γ→ε transformation took place, decreased with reductions in the test temperature. At the same time, the stress-induced γ→ε transformation did not depend on the test temperature and was constant for the studied steel.
If the γ→ε transformation started from the very beginning of the steel plastic deformation (for example, at 77 K), then both the fcc austenite and hcp ε-martensite lattices were deformed. This was facilitated by the increased c/a ratio of 1.68:1.69.
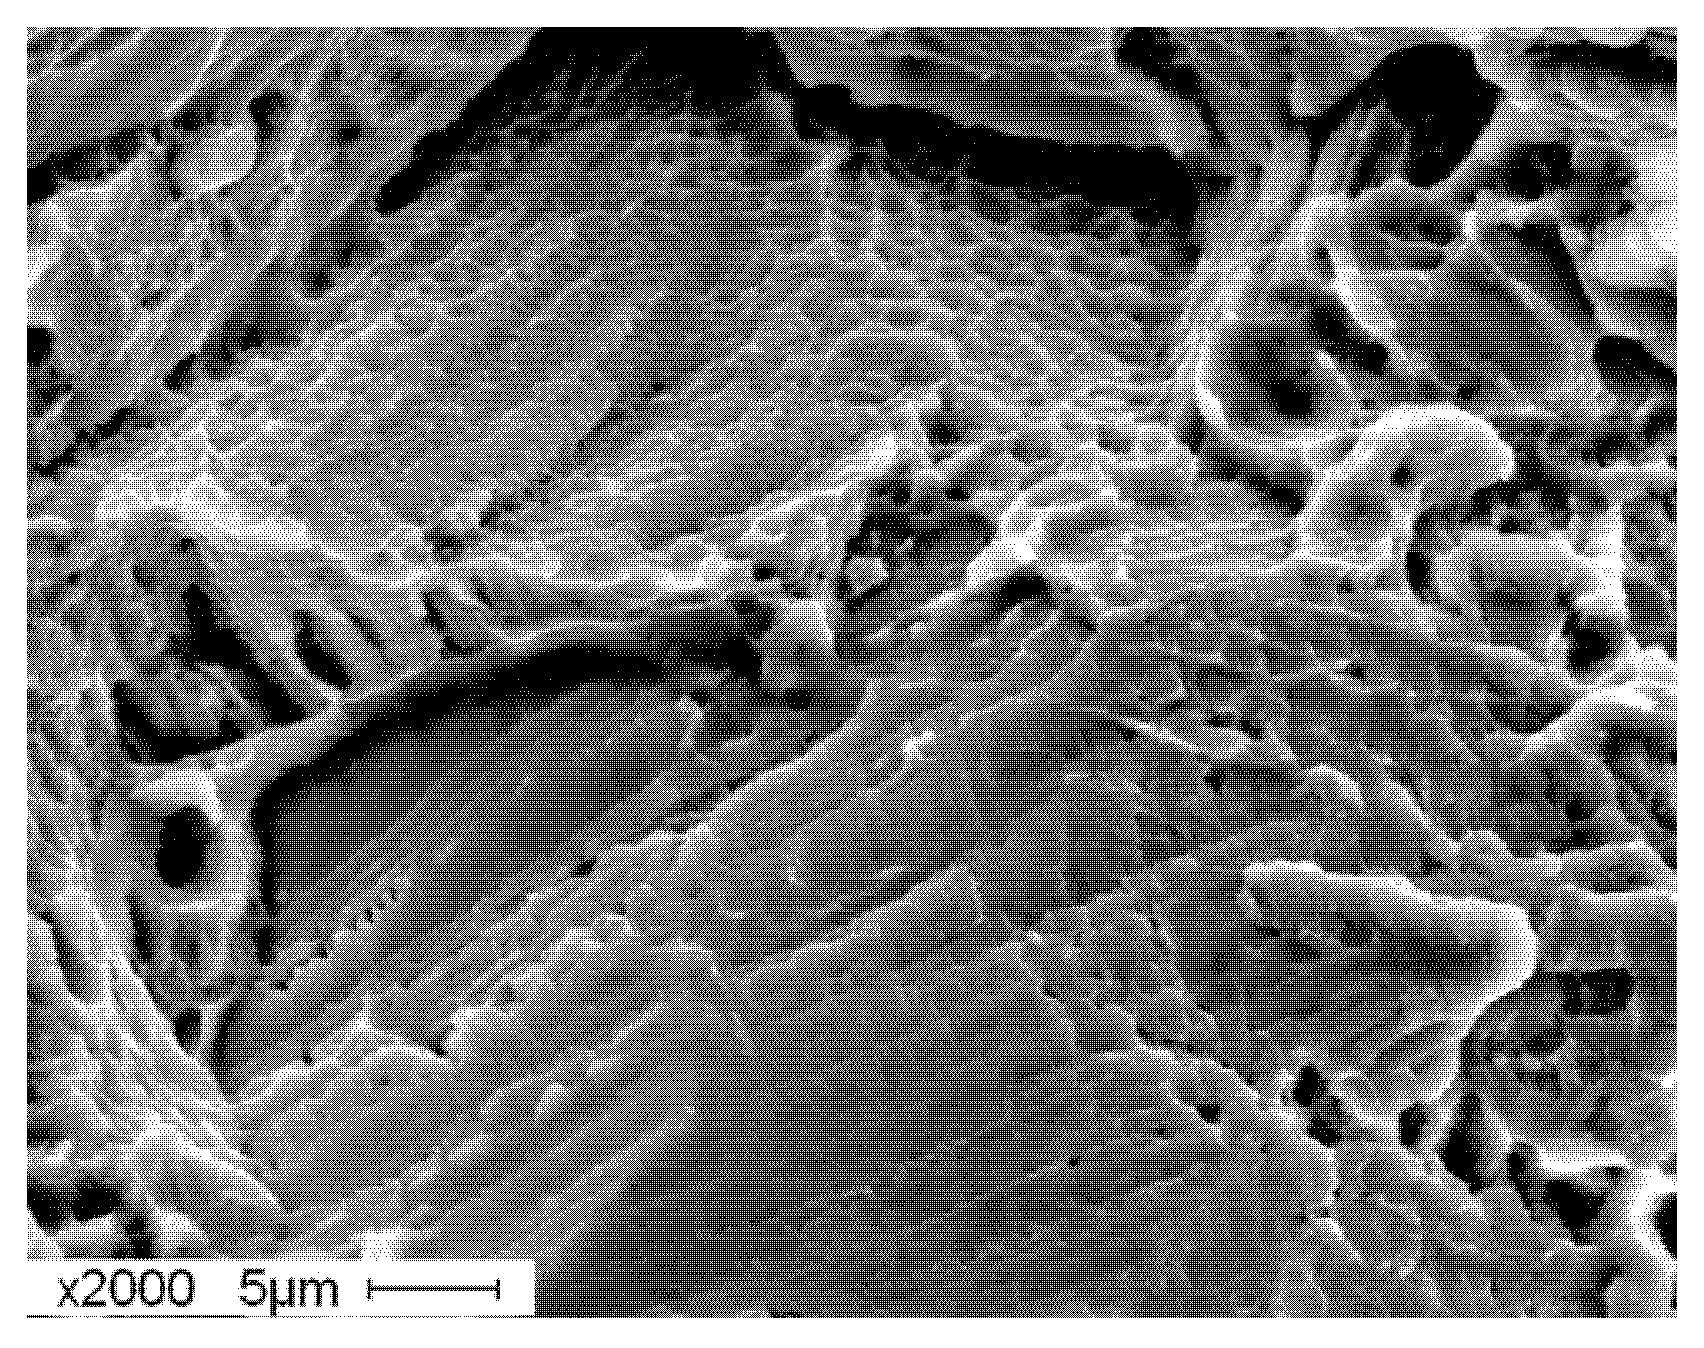
Figure 11 shows the steel fracture surface after the tensile test at 77 K.
Brittle fracture fragments were observed along with ductile pits. A feature of the fracture surface was the layered structure of the brittle area, the size of which was commensurate with the grain sizes of 20–30 μm. The γ/ε layered microstructure is shown in the TEM micrograph (Figure 10a). The layered fracture surface was formed as a result of the hcp lattice deformation by sliding along the (001)ε <110 > ε basal planes and the subsequent shear fracture.
Hence, the decrease in elongation with reductions in the test temperature below 240 K (Figure 2) was caused by the beginning of the plastic deformation of the hcp lattice. Thus, it was possible to differentiate three temperature ranges, in which the effect of ε-martensite on the microstructure, mechanical behavior, and properties of the steel varied. (1) In the temperature range of 293 down to 273 K, the stress-induced γ→ε martensite transformation occurred and contributed to increasing elongation. At this stage, the number of RMS static atom displacements increased in the fcc lattice, and residual oriented micro-strains increased. (2) At temperatures below 240 K, the γ→ε transformation started from the early deformation stages. With increases in the deformation level, the volume fraction of ε-martensite crystals increased, and their coalescence and plastic deformation occurred. This reduced the elongation of the steel. Due to the increase in the volume fraction of ε-martensite, both RMS static atom displacements in the fcc lattice and the SF density decreased. Plastic deformation of the hcp ε-martensite lattice reduced residual stresses in the fcc austenite one. (3) In the intermediate temperature range of 273 down to 240 K, the formation of ε-martensite crystals and their predominantly elastic deformation occurred. At these test temperatures, the steel was characterized by the maximum elongation. The maximum values of RMS static atom displacements in the fcc lattice, the SF formation probability, and the deformation of the fcc lattice were observed, which were responsible for the formation of residual oriented stresses.

5. Conclusions

The main conclusions of the present studies are as follows.
  • Upon tensile testing of Fe-Cr-Mn-0.53%N steel at low temperatures, the γ→ε martensitic transformation was initiated. It started at the true stress level of about 1040 ± 50 MPa.
  • Elongation increased with the decrease in the tensile test temperature from 293 down to 260 K and remained at a high level down to 240 K due to the stress-induced γ→ε transformation, which ensured prolonged plastic deformation of the steel. With reductions in the tensile test temperature below 240 K, elongation reduced from the maximum values due to the plastic deformation of the hcp ε-martensite lattice.
  • Mechanical twinning and the increase in the SF density during low-temperature deformation enhanced static atom displacements from their equilibrium positions in the fcc lattice, destabilized it, and promoted the formation of stress-induced ε-martensite. However, this effect was reduced by the increase in the volume fraction of ε-martensite.
  • Stress-induced ε-martensite formed residual stresses in austenite. Their level was maximal at the stage of the ε-martensite formation and its elastic deformation but decreased with the beginning of the hcp lattice plastic deformation.

Author Contributions

N.N.: carried out the tensile tests, TEM investigations, and analyses, and wrote the paper; Y.D.: conceptualization, validation, and formal analysis; Y.M.: carried out X-ray investigations. All authors have read and agreed to the published version of the manuscript.

Funding

The work was performed according to the government research assignment for ISPMS SB RAS, project No. FWRW-2021.

Acknowledgments

The authors would like to thank Perevalova, O.B. and Lotkov, A.I. for the helpful discussion of the experimental results.

Conflicts of Interest

The authors declare no conflict of interest.

References

  1. Defilippi, J.D.; Brickner, K.G.; Gilbert, E.M. Ductile-to-brittle transition in austenitic chromium-manganese-nitrogen stainless steels. Trans. Metall. Soc. AIME 1969, 245, 2141–2148. [Google Scholar]
  2. Milititsky, M.; Matlock, D.; Regully, A.; de Wispelaere, N.; Penning, J.; Hдnninen, H. Impact toughness properties of nickel-free austenitic stainless steels. Mater. Sci. Eng. A 2008, 496, 189–199. [Google Scholar] [CrossRef]
  3. Wang, S.; Yang, K.; Shan, Y.; Li, L. Plastic deformation and fracture behaviors of nitrogen-alloyed austenitic stainless steels. Mater. Sci. Eng. A 2008, 490, 95–104. [Google Scholar] [CrossRef]
  4. Byun, T.; Hashimoto, N.; Farrell, K. Temperature dependence of strain hardening and plastic instability behaviors in austenitic stainless steels. Acta Mater. 2004, 52, 3889–3899. [Google Scholar] [CrossRef]
  5. Balachandran, G. High Nitrogen Steels and Stainless Steels—Manufacturing Properties and Applications; Alpha Science International: Pangbourne, UK, 2004; pp. 40–93. [Google Scholar]
  6. Berns, H.; Gavriljuk, V.; Riedner, S.; Tyshchenko, A. High Strength Stainless Austenitic CrMnCN Steels—Part I: Alloy Design and Properties. Steel Res. Int. 2007, 78, 714–719. [Google Scholar] [CrossRef]
  7. Lee, T.-H.; Shin, E.; Oh, C.-S.; Ha, H.-Y.; Kim, S.-J. Correlation between stacking fault energy and deformation microstructure in high-interstitial-alloyed austenitic steels. Acta Mater. 2010, 58, 3173–3186. [Google Scholar] [CrossRef]
  8. Bazaleeva, K.O. Mechanisms of the Influence of Nitrogen on the Structure and Properties of Steels (A Review). Met. Sci. Heat Treat. 2005, 47, 455–461. [Google Scholar] [CrossRef]
  9. Lenel, U.R.; Knott, B.R. Microstructure-composition relationships and Ms temperatures in Fe-Cr-Mn-N alloys. Met. Mater. Trans. A 1987, 18, 767–775. [Google Scholar] [CrossRef]
  10. Dai, Q.-X.; Wang, A.-D.; Cheng, X.-N.; Luo, X.-M. Stacking fault energy of cryogenic austenitic steels. Chin. Phys. 2002, 11, 596–600. [Google Scholar] [CrossRef]
  11. Gavriljuk, V.; Sozinov, A.; Foct, J.; Petrov, J.; Polushkin, Y. Effect of nitrogen on the temperature dependence of the yield strength of austenitic steels. Acta Mater. 1998, 46, 1157–1163. [Google Scholar] [CrossRef]
  12. Martin, S.; Wolf, S.; Martin, U.; Krьger, L.; Rafaja, D. Deformation Mechanisms in Austenitic TRIP/TWIP Steel as a Function of Temperature. Met. Mater. Trans. A 2016, 47, 49–58. [Google Scholar] [CrossRef] [Green Version]
  13. Zhao, Y.; Zhang, W.; Liu, X.; Liu, Z.; Wang, G. Development of TRIP-Aided Lean Duplex Stainless Steel by Twin-Roll Strip Casting and Its Deformation Mechanism. Met. Mater. Trans. A 2016, 47, 6292–6303. [Google Scholar] [CrossRef]
  14. Lee, T.-H.; Oh, C.-S.; Kim, S.-J. Effects of nitrogen on deformation-induced martensitic transformation in metastable austenitic Fe–18Cr–10Mn–N steels. Scr. Mater. 2008, 58, 110–113. [Google Scholar] [CrossRef]
  15. Narkevich, N.A.; Surikova, N.S. Deformation Behavior and Structural Evolution of Stainless Cr–Mn–N Steel during Low-Temperature Tension. Phys. Met. Met. 2020, 121, 1175–1181. [Google Scholar] [CrossRef]
  16. Lee, T.-H.; Oh, C.-S.; Kim, S.-J.; Takaki, S. Deformation twinning in high-nitrogen austenitic stainless steel. Acta Mater. 2007, 55, 3649–3662. [Google Scholar] [CrossRef]
  17. Lee, T.-H.; Ha, H.-Y.; Hwang, B.; Kim, S.-J.; Shin, E. Effect of Carbon Fraction on Stacking Fault Energy of Austenitic Stainless Steels. Met. Mater. Trans. A 2012, 43, 4455–4459. [Google Scholar] [CrossRef]
  18. Narkevich, N.A.; Shulepov, I.A.; Mironov, Y.P. Structure, mechanical, and tribotechnical properties of an austenitic nitrogen steel after frictional treatment. Phys. Met. Met. 2017, 118, 399–406. [Google Scholar] [CrossRef]
  19. Narkevich, N.A.; Tolmachev, A.I.; Vlasov, I.V.; Surikova, N.S. Structure and Mechanical Properties of Nitrogen Austenitic Steel after Ultrasonic Forging. Phys. Met. Met. 2016, 117, 288–294. [Google Scholar] [CrossRef]
  20. Perevalova, O.B.; Konovalova, E.V.; Koneva, N.A.; Kozlov, E.V. Influence of Atomic Ordering on Grain-Boundary Ensembles of Fcc solid Solutions; NTL: Tomsk, Russia, 2014; pp. 43–57. [Google Scholar]
  21. Drozdov, A.N.; Vus, A.S.; Pukha, V.E.; Pugachev, A.T. Specific features of the formation of diffraction patterns of metallofullerene crystals. Phys. Solid State 2010, 52, 1999–2004. [Google Scholar] [CrossRef]
  22. Sangal, S.K.; Sharma, P.K. Mean square displacements of atoms in cubic metals at melting point. Czechoslov. J. Phys. 1968, 18, 1413–1415. [Google Scholar] [CrossRef]
  23. Nagy, E.; Mertinger, V.; Tranta, F.; Sylyom, J. Deformation induced martensitic transformation in stainless steels. Mater. Sci. Eng. A 2004, 378, 308–313. [Google Scholar] [CrossRef]
  24. Karthik, D.; Kalainathan, S.; Swaroop, S.; Dhandapani, K. Surface modification of 17-4 PH stainless steel by laser peening without protective coating process. Surf. Coat. Technol. 2015, 278, 138–145. [Google Scholar] [CrossRef]
  25. Warren, B. X-ray studies of deformed metals. Prog. Met. Phys. 1959, 8, 147–202. [Google Scholar] [CrossRef]
  26. Guler, S.; Fischer, A. Fatigue Behavior of Cold-Worked High-Interstitial Steels. Metals 2018, 8, 442. [Google Scholar] [CrossRef] [Green Version]
  27. Asgari, S.; El-Danaf, E.; Kalidindi, S.R.; Doherty, R.D. Strain hardening regimes and microstructural evolution during large strain compression of low stacking fault energy fcc alloys that form deformation twins. Met. Mater. Trans. A 1997, 28, 1781–1795. [Google Scholar] [CrossRef]
  28. Rasouli, D.; Kermanpur, A.; Ghassemali, E.; Najafizadeh, A. On the Reversion and Recrystallization of Austenite in the Interstitially Alloyed Ni-Free Nano/Ultrafine Grained Austenitic Stainless Steels. Met. Mater. Int. 2019, 25, 846–859. [Google Scholar] [CrossRef]
  29. Ojima, M.; Adachi, Y.; Tomota, Y.; Ikeda, K.; Kamiyama, T.; Katada, Y. Work hardening mechanism in high nitrogen austenitic steel studied by in situ neutron diffraction and in situ electron backscattering diffraction. Mater. Sci. Eng. A 2009, 527, 16–24. [Google Scholar] [CrossRef]
  30. Clausen, B.; Lorentzen, T.; Leffers, T. Self-consistent modelling of the plastic deformation of f.c.c. polycrystals and its implications for diffraction measurements of internal stresses. Acta Mater. 1998, 46, 3087–3098. [Google Scholar] [CrossRef]
  31. Byrnes, M.; Grujicic, M.; Owen, W. Nitrogen strengthening of a stable austenitic stainless steel. Acta Met. 1987, 35, 1853–1862. [Google Scholar] [CrossRef]
  32. Volynova, T.F. High Manganese Steels and Alloys; Metallurgia: Moscow, Russia, 1988; pp. 876–892. [Google Scholar]
  33. Astafurova, E.G.; Moskvina, V.A.; Maier, G.G.; Gordienko, A.I.; Burlachenko, A.G.; Smirnov, A.I.; Bataev, V.A.; Galchenko, N.K.; Astafurov, S.V. Low-temperature tensile ductility by V-alloying of high-nitrogen CrMn and CrNiMn steels: Characterization of deformation microstructure and fracture micromechanisms. Mater. Sci. Eng. A 2019, 745, 265–278. [Google Scholar] [CrossRef]
  34. Frommeyer, G.; Brьx, U.; Neumann, P. Supra-Ductile and High-Strength Manganese-TRIP/TWIP Steels for High Energy Absorption Purposes. ISIJ Int. 2003, 43, 438–446. [Google Scholar] [CrossRef] [Green Version]
  35. Allain, S.; Chateau, J.-P.; Bouaziz, O.; Migot, S.; Guelton, N. Correlations between the calculated stacking fault energy and the plasticity mechanisms in Fe–Mn–C alloys. Mater. Sci. Eng. A 2004, 387–389, 158–162. [Google Scholar] [CrossRef]
  36. Talonen, J.; Taulavuori, T.; Hanninen, H. Effect of temperature on tensile behaviour and microstructural evolution of nitrogen alloyed austenitic stainless steel. In Proceedings of the International Conference on High Nitrogen Steels, Espoo, Finland, 24–26 May 2006; Dong, H., Speidel, M.O., Eds.; Metallurgical Industry Press: Beijing, China, 2006; pp. 52–58. [Google Scholar]
  37. Yang, J.; Wayman, C. On secondary variants formed at intersections of ϵ martensite variants. Acta Met. Mater. 1992, 40, 2011–2023. [Google Scholar] [CrossRef]
Figure 1. The scheme of the sample orientation during the study of residual oriented deformations in the fcc austenite lattice by the XRD sin2ψ method: α is the X-ray incidence angle; Iψ = 0 and Iψ ≠ 0 are the directions of the X-ray reflection in the Bragg–Brentano and asymmetric geometries, respectively; σ1 and σ2 are the directions of residual stresses associated with the oriented micro-deformations; hkl are crystallographic planes in the Bragg–Brentano (light gray) and asymmetric (dark blue) geometries.
Metals 11 00710 g001
Figure 2. The deformation behavior of Cr-Mn-N steel during the tensile tests at low temperatures: (a) true stress–strain curves, (b) the θ = dσ/dε work hardening rate.
Metals 11 00710 g002
Figure 3. The mechanical properties of Cr-Mn-N steel at low temperatures.
Metals 11 00710 g003
Figure 4. Fragments of the XRD diffraction patterns of the Cr-Mn-N steel after the tensile tests at various temperatures.
Metals 11 00710 g004
Figure 5. Stress-induced ε-martensite volume fractions vs. test temperatures.
Metals 11 00710 g005
Figure 6. The RMS atom displacements vs. temperature dependence for the fcc lattice of the Cr-Mn-N steel after the tensile tests.
Metals 11 00710 g006
Figure 7. The aγ austenite lattice parameter vs. the sin2ψ angle after the tensile tests: (a) at 293 K, (b) at 253 K, and (c) 77 K.
Metals 11 00710 g007
Figure 8. The austenite lattice parameters for the hkl planes at ψ = 0 (in the Bragg–Brentano geometry) in the Cr-Mn-N steel after the tensile tests at 293, 253, and 77 K.
Metals 11 00710 g008
Figure 9. The microstructure in the uniform strain region of the Cr-Mn-N steel fractured sample after the tensile test at 253 K: (a) the reflex grid electron diffraction pattern of the γ-phase (z = [100]γ and z = [ 2 ¯ 33]γ) as well as ε-martensite z = [311]ε; (b) the dark-field image of ε-martensite in the ( 1 ¯ 12 )ε reflex.
Metals 11 00710 g009
Figure 10. The microstructure in the uniformly deformed region of the sample after the tensile test at 77 K: (a) the bright-field image of ε-martensite plates and strain twins; (b) the reflex grid electron diffraction pattern of ε-martensite (z = [311]ε) from the A microstructure area, and austenite (z = [112]γ) from the B microstructure area; the line shows the trace of the (1 1 ¯ 1)γ twinning plane.
Metals 11 00710 g010
Figure 11. The SEM micrograph of the Cr-Mn-N steel fracture surface after the tensile test at 77 K.
Metals 11 00710 g011
Table 1. Chemical composition of the studied steel.
ElementCrMnCNSiFe
Content, wt.%16.518.80.070.530.52balance
Publisher’s Note: MDPI stays neutral with regard to jurisdictional claims in published maps and institutional affiliations.