Article

Effect of Alloying Additives and Microadditives on Hardenability Increase Caused by Action of Boron

by
Beata Białobrzeska
Department of Vehicle Engineering, Faculty of Mechanical Engineering, Wrocław University of Science and Technology, Wybrzeże Wyspiańskiego 27, 50-370 Wrocław, Poland
Metals 2021, 11(4), 589; https://doi.org/10.3390/met11040589
Submission received: 26 February 2021 / Revised: 31 March 2021 / Accepted: 1 April 2021 / Published: 4 April 2021
(This article belongs to the Special Issue Heat Treatment and Mechanical Properties of Metals and Alloys)

Abstract

:
The presented work was aimed at evaluating influence of boron on hardenability of steel quantitatively and evaluating this effect during complex use of boron with other alloying additives like chromium, vanadium and titanium. For this purpose, eight melts with variable chemical compositions were prepared. From the ingots, cylindrical specimens with normalized dimensions according to EN ISO 642:1999 were cut out and subjected to full annealing at 1200 °C and to normalizing at 900 °C. Such specimens were subjected to the hardenability Jominy test. In order to distinguish the influence of boron on hardenability of a given melt and thus to eliminate the differences resulting from its chemical composition, grain size and austenitizing temperature, the obtained ideal critical diameter was corrected and the boron effectiveness factor was determined. The performed examinations and analyses showed that inadequate quantities of microadditives result in losing the benefits coming from introduction of boron as the hardenability-improving element and can even result in a reduction of hardenability of the boron-containing steel.

1. Introduction

In Europe, low-alloy steels with additions of boron were produced for the first time in 1970 by the Swedish metallurgical concern SSAB Oxelösund [1] as steels with higher abrasive-wear resistance. Metallurgy in Sweden has the centuries-old tradition. As early as in the 17th century, Sweden delivered about a half of total European production of steel. That resulted from both deposits of especially pure iron ore and availability of timber from that charcoal for iron smelting was obtained. In turn, the boron steel 22MnB5, which is characterized by a simple chemical composition and basically only manganese in alloy content in addition to boron, is also successfully used in the automotive industry [2,3,4,5]. The present-day micro- and low-alloy steels containing boron, produced by advanced manufacturing technologies, have very good mechanical properties at moderate prices and their properties are decided by their structures obtained after a specific heat- or thermo-plastic treatment. Based on advertising information for boron steels, it can generally be concluded that a significant proportion of commercially offered steels have tensile strengths in excess of 1500 MPa but in many cases, the strength of 2000 MPa is also exceeded [6].
However, the history of using boron as an alloying additive to steel began much earlier. It was found as early as the 1930s that an additive of boron significantly increased hardenability of low- and medium-carbon steels. As a result, a group of weldable bainitic steels was obtained, with their tensile strength ranging from 530–1200 MPa. In the subsequent years, this element was more and more widely applied to replace other expensive alloying elements like nickel, molybdenum and chromium, when wars significantly restricted their availability [7]. Increase of steel hardenability is obtained by small contents of boron, trace amounts for other elements. Influence of boron on hardenability of steel was analyzed in [8,9,10,11,12]. Maximum increase of hardenability is already observed after adding as little as 10–30 wt. ppm. of boron but majority of reviews recommend boron contents in a range between 5–20 wt. ppm. [12]. A hardenability increase was found by boron additions of only 5 wt. ppm in low-alloyed Cr steels that could be used as a substitute for the costlier CrNiMo-steels for high-strength automotive parts [9]. The amount of boron higher than the solubility limit of 6 wt. ppm of B in austenite does not further improve hardenability. When the soluble boron is fully effective, maximum toughness can also be observed. Soluble boron contents less than 4 wt. ppm lead to an inhomogeneous hardenability along the cross section and, as a result, to stronger distortion [13]. This can explained by the fact that at higher boron contents, the solubility of B is exceeded and coarse borocarbides such as M23(B,C)6 or coarse BN form along GBs which promote the ferrite nucleation [10,11,14,15]. If added in too large amount, boron also creates with iron the compound Fe2B whose particles become nuclei, facilitating the diffusive transformation and, as a result, hardenability decreases. Moreover, effectivity of boron in steel depends on its form and thus it is strictly related to chemical composition and metallurgical purity of steel, especially with contents of carbon and nitrogen [16]. Boron shows high affinity for oxygen and nitrogen and this is why the alloying elements like titanium and aluminum are introduced to steel. Boron acts effectively when is dissolved in solid solution, but thanks to its high diffusion rate it is accumulated on grain boundaries reducing their energy and on all defects that facilitate nucleation. This impedes nucleation and the transition start lines are shifted towards longer times [17]. Moreover, the effect of boron is observed up to a carbon concentration of 0.53% only, so boron as the hardenability improving element is applied in low- and medium-carbon steels only. In steels containing 0.4% C, boron additions can double the hardenability compared with the base composition without boron [12]. Boron is mostly used in low-alloy steels, but some reports can be found in literature saying that an addition of boron also increases hardenability of carbon steels. For example, Llewellyn and Cook [9] observed an increase in hardenability caused by the addition of boron in carbon steels up to a carbon content of 0.53%.
The issue concerning influence of boron on hardenability of steel is a complex one. This is evidenced even by the way the ideal critical diameter is determined according to ASTM A 255-20a. In the case of steels containing microadditives of boron, the BF factor (boron factor) is determined first:
B F = D I J D I
where: DIJ = ideal diameter read-out from the tables for the distance from the Jominy specimen end face corresponding to 50% of martensite in steel with the given carbon content; DI = ideal diameter calculated from the equation (2).
D I = D I C · f i
where: DIC = ideal critical diameter for the Fe-C alloy with carbon concentration of 0.7% and primary austenite grain size N = 7 acc. to ASTM read-out from the tables; fi = hardenability factors of individual alloying elements with the values depending on their concentrations.
Next, the alloy factor AF is calculated for the steel:
A F = D I f C
where: fC = carbon hardenability factor for the given concentration of carbon in the steel.
Ideal critical diameter for the boron-containing steel DIB is calculated from the formula:
D I B = D I · f B
where: fB = boron hardenability factor read-out from the tables for the calculated value AF (3) and the given carbon concentration.
An increase of hardness can also be obtained by connecting the additive of boron with additives of other elements like chromium, molybdenum, manganese and niobium. In literature [8], the information can be found that vanadium even to 0.085% does not influence effectiveness of boron. This is especially interesting, since vanadium, beside titanium and niobium, is one of the microadditives introduced together with boron to micro- and low-alloy low-carbon steels [18]. In general, there are little data in the literature concerning influence of microadditives on hardenability increase related to an addition of boron, or such data are incomplete [8,19,20,21,22,23,24,25,26]. In particular, a lot of research work has been devoted to analyzing the effect of complexly added molybdenum and boron on hardenability. The effectiveness of molybdenum in increasing the hardenability increases with the presence of boron. In the absence of boron, molybdenum is only half as effective in improving steel hardenability [19]. The introduction of 0.002% B into molybdenum steel causes an inhibition of the austenite-ferrite transformation [20], and at a content of 0.58% molybdenum and 0.005% titanium an increase in boron microadditivity from 0.002–0.007% can double hardenability [21]. Another beneficial effect of boron microadditive with the addition of 0.016% Mo was also the lowering of the start temperature of the bainitic transformation for 1021B steel, as this reduces the share of upper bainite, which will have a further beneficial effect on the mechanical properties of the steel [22]. In turn, elements such as niobium, vanadium [8] and titanium [23] can increase the hardenability of austenitized steel, especially at higher temperatures. What is more, in the research of Briedis and Cuddy [24], where the effect of simultaneous addition of boron, titanium and vanadium on the hardenability of steels containing 0.4% C, 1% Mn and 0.7% Cr was studied, the authors specifically indicated what percentage of the individual components most enhances the effect of boron on hardenability. The highest hardenability among the group of analyzed melts was obtained with a complex containing 0.047% Ti, 0.053% V and 0.008% B. Also in the presence of manganese, an element found in steels for hot-stamping, an increase in hardenability caused by boron addition, was observed [25], while Grande [26] demonstrated that even phosphorous operates via a similar mechanism of segregating to austenite GBs together with boron inhibits the nucleation of hypoeutectoid ferrite. Therefore, quantitative evaluation of influence of boron on hardenability of steel, and in particular analysis of influences of other alloying additives on the effect of boron, is extremely important. The purpose of this work is to evaluate the effect of boron on hardenability of steel quantitatively and to assess this effect in the case when boron is applied together with other alloying elements like chromium, vanadium and titanium.

2. Materials and Methods

The material for the research consisted of 8 melts with various chemical compositions, prepared in the Foundry Research Institute in Krakow, Poland. Molds were made of bentonite molding compound using wooden patterns of the agreed shape. The melts with determined chemical compositions were prepared in an induction medium frequency furnace Radyne 100 kW with capacity 120 kg (Radyne Corporation, Milwaukee, WI, USA), equipped with neutral lining. Each time, mass of charge was ca. 110 kg. Over the crucible, a kind of hood was installed, where argon gas was blown-in to maintain the assumed chemical composition. A charge consisted of ARMCO iron, scrap of low-carbon steel, alloying additives FeMn 80, FeCr 60, Mn, and a carbonizer. Depending on the selected chemical composition, the following materials were also added: FeB 8, FeTi 25, FeV 70, Al, and Ti. When the charge was molten and the melt reached the set temperature, a sample was taken for chemical analysis. If necessary, chemical composition was corrected and the components that could burn-out were added just before casting. The molten metal was poured to a preheated ladle, temperature was measured and a sample was taken for final chemical analysis. The temperature of pouring the molds was 1540 °C. After cooling-down and cleaning, sprues were removed from the ingots. Ultrasound inspections made with use of a defectoscope CUD 9900 No. 04002 (Ultra, Wrocław, Poland) showed no disqualifying defects in the examined ingots.
Chemical composition of the ingots was analyzed with a spark-trigger optical emission spectrometer ARL NA (Thermo Fisher Scientific, Waltham, MA, USA), except concentration of boron and other minimum-quantity elements that were determined with an atomic absorption spectrometer Solaar M6 Thermo (Thermo Fisher Scientific, Waltham, MA, USA) or with a glow discharge spectrometer GDS-500 A Leco (Leco Corporation, St. Joseph, MI, USA). The melts used in the research differed in concentrations of boron, chromium, vanadium and titanium, which made it possible to examine effectiveness of individual or complex microadditives for boron-related hardenability. Concentrations higher than the limit alloying values were as follows: boron in melts 1, 3, 5 and 7, chromium in melts 3, 4, 5, 6, 7 and 8; vanadium in melts 5 and 6; titanium in melt 8 (see Table 1).
Cylindrical specimens with standardized dimensions acc. to EN ISO 642:1999 were taken from the ingots, subjected to full annealing at 1200 °C and next normalized at 900 °C for 1 h. Then, the specimens were austenitized for 30 min at the temperatures specified in Table 2. Austenitization temperatures were selected after dilatometric examinations with use of a dilatometer Linseis L78 R.I.T.A (Linseis Messgeräte GmbH, Selb, Germany), where the Ac3 temperatures were determined. The austenitization temperature was 50 °C higher than the Ac3 temperature.
The described heat treatment was carried-out under a protective atmosphere of argon in a conventional furnace FCF 12 SHM/R (Czylok, Jastrzębie-Zdrój, Poland) with a gas-tight retort. Next, the specimens were subjected to end quenching on a device according to EN ISO 642:1999. After the end-quench test was performed on each specimen, two material layers parallel to the specimen axis were milled to the depth of 0.4 mm. On the prepared surfaces, Rockwell hardness was measured and average hardness values at the same distances from the specimen face were calculated. The distances from the specimen face were according to the instructions for the Jominy test (EN ISO 642:1999). Then, hardness curves were plotted to show relationships between hardness and distance from the specimen end face. On the hardenability curve HRC = f (l), hardness of the semi-martensitic zone was marked, so that the distance J between this zone and the specimen end face could be determined. Hardness of the semi-martensitic zone for a specific carbon concentration was read-out from the empirical curves published by Hodge and Orechoski [27]. On the grounds of the found J values, the ideal critical diameter DIJ were determined using the Grossman nomograph [28] and ASTM A 255-02 Standard.
In order to distinguish the effect of boron on hardenability of the given melt and thus to eliminate the differences resulting from chemical composition, grain size and austenitizing temperature, the obtained ideal critical diameter had to be corrected [29,30,31]. This correction was carried-out in the following steps:
Using the Jackson’s and Christenson’s data [32], the J value obtained for the given austenitization temperature was corrected to the value corresponding to the austenitization temperature of the basic melt. The relation between the correction factor fcorr and the austenitization temperature T is given by the formula:
f c o r r = 6.4217 + 3.78 · 10 3 T 0.2964 T 2
The corrected distance Jc between the semi-martensitic zone and the specimen end face is calculated from the formula:
J c = J · f c o r r ( T b ) f c o r r ( T )
where: Tb = austenitization temperature of the basic melt in °C, T = austenitization temperature of the analyzed melt in °C. On the ground of the corrected location of the semi-martensitic zone Jc, the corrected ideal critical diameter DIJcorr was determined from the Grossman nomograph and ASTM A 255-02 Standard.
Using the Grossmann’s analytical method, influence of differences in concentrations of conventional alloying elements and influence of grain size were corrected. The ideal critical diameter DIJc was corrected according to the formula:
D I J c o r r = D I J c · D I C b · f M n b · f S i b · f M o b · f C r b · f N i b D I C · f M n · f S i · f M o · f C r · f N i
where: DIC, DICb = basic ideal critical diameter dependent on grain size and carbon concentrations in the basic melt and the analyzed melt:
D I C = k C
where: k = constant dependent on grain size number acc. to Moser and Legat [33], C = carbon concentration in wt%, fi and fib = hardenability factors for individual alloying elements except carbon in the basic melt and the analyzed melt, calculated from the formula:
f i = B i % M i
where: Bi = characteristic coefficient for a given alloying element according to Table 3, Mi = exponent equal to percent concentration of this element.
The effect of boron on hardenability was evaluated using the factor f2, calculated as follows:
f 2 = D I J c o r r D I J b
This effect was evaluated by comparing the melts in pairs, while the basic melt was that free of boron: Melts 1 and 2 (basic melt 2), melts 3 and 4 (basic melt 4), melts 5 and 6 (basic melt 6), melts 7 and 8 (basic melt 8).
In addition, microstructure examinations were carried-out after normalizing and after quench hardening, as well as grain size analysis after hardening. Microscopic observations were performed using a light microscope Nikon ECLIPSE MA200 (Nikon Corporation, Tokyo, Japan). Microstructures after normalizing and after quench hardening were revealed by etching with the reagent 74 (5% HNO3 solution in alcohol) acc. to ASTM E407. To reveal boundaries of former austenite grains, the prepared metallographic sections were etched with the reagent 81 (2 g of picric acid, 1 g of sodium tridecylbeznzene sulfonate and 100 mL H2O) acc. to ASTM E407, at ca. 55 °C. Former austenite grain size in representative areas was determined quantitatively with use of the program ImageJ (version 1.52a, National Institute of Mental Health, Bethesda, MD, USA). To that end, cross-section areas (a) of 100 randomly selected grains were determined by the planimetric method and then diameter (d) of a plain grain was determined as a . The results were analyzed with the program Statistica (version 13.1, StatSoft, Tulsa, OK, USA) to obtain distributions of grain diameters, for the constant number of 12 classes. The obtained empirical distributions were analyzed for conformity with the theoretical distributions: log-normal, exponential and gamma distribution. Conformity of the experimental and theoretical distributions was determined using the χ 2 Pearson’s test.
ASTM grain size numbers GS were determined by the formula [31]:
G S = 16.54 2.88 · ln ( d ¯ )
Moreover, Brinell hardness of the specimens after normalizing was measured according to EN ISO 6506-1:2014-12 with a hardness tester Zwick/Roell ZHU (Zwick Roell Gruppe, Ulm, Germany), using the ball dia. 2.5 mm under the load of 187.5 kg for 15 s.

3. Results and Discussion

3.1. Structures after Normalizing

After normalizing, melt 1 showed ferritic-pearlitic structure (Figure 1a), typical for hypoeutectoid cast steels. Due to relatively fast air-cooling, the structure was not equilibrium and showed larger portion of laminar pearlite, or rather quasi-pearlite, than it would result from concentration of carbon in the cast steel. Hardness of the material was 177 HB (Figure 2).
The microstructure of melt 2 was composed of ferrite and degenerate quasi-pearlite, in that cementite showed both laminar and coagulated build (Figure 1b). The pearlite portion was larger than would result from concentration of carbon in the cast steel and hardness of this melt was 153 HB, lower than that of the melt 1.
Melts 3 and 4, containing chromium that significantly increases hardenability, showed quite different structures. During air cooling being a part of normalization, the melts were subjected to partial hardening (Figure 1c,d). Their structure was composed of pearlite and acicular ferrite. A range of hardening structures could be also seen, like martensite, troostite and hardening sorbite. The hardening structures occupied a considering volume of melt 3, which resulted in its increased hardness of 421 HB, much higher than that of melt 4, equal to 298 HB (Figure 2).
Melts 5 and 6 were also subjected to partial hardening (Figure 1e,f) and their hardness values were similar, equal to 391 and 392 HB (Figure 2). In addition to martensite and hardening troostite, their structures included degenerate pearlite and ferrite showing acicular and granular build.
Structures of melts 7 and 8 were not typical for normalization (Figure 1g,h). The structures were composed of martensite and quench troostite, degenerate pearlite and ferrite showing acicular and granular build. Moreover, regular, yellowish precipitates of titanium nitrides were also visible. Hardness of melt 7 equal to 423 HB was similar to that of melt 3 and hardness of melt 8 was 360 HB (Figure 2).

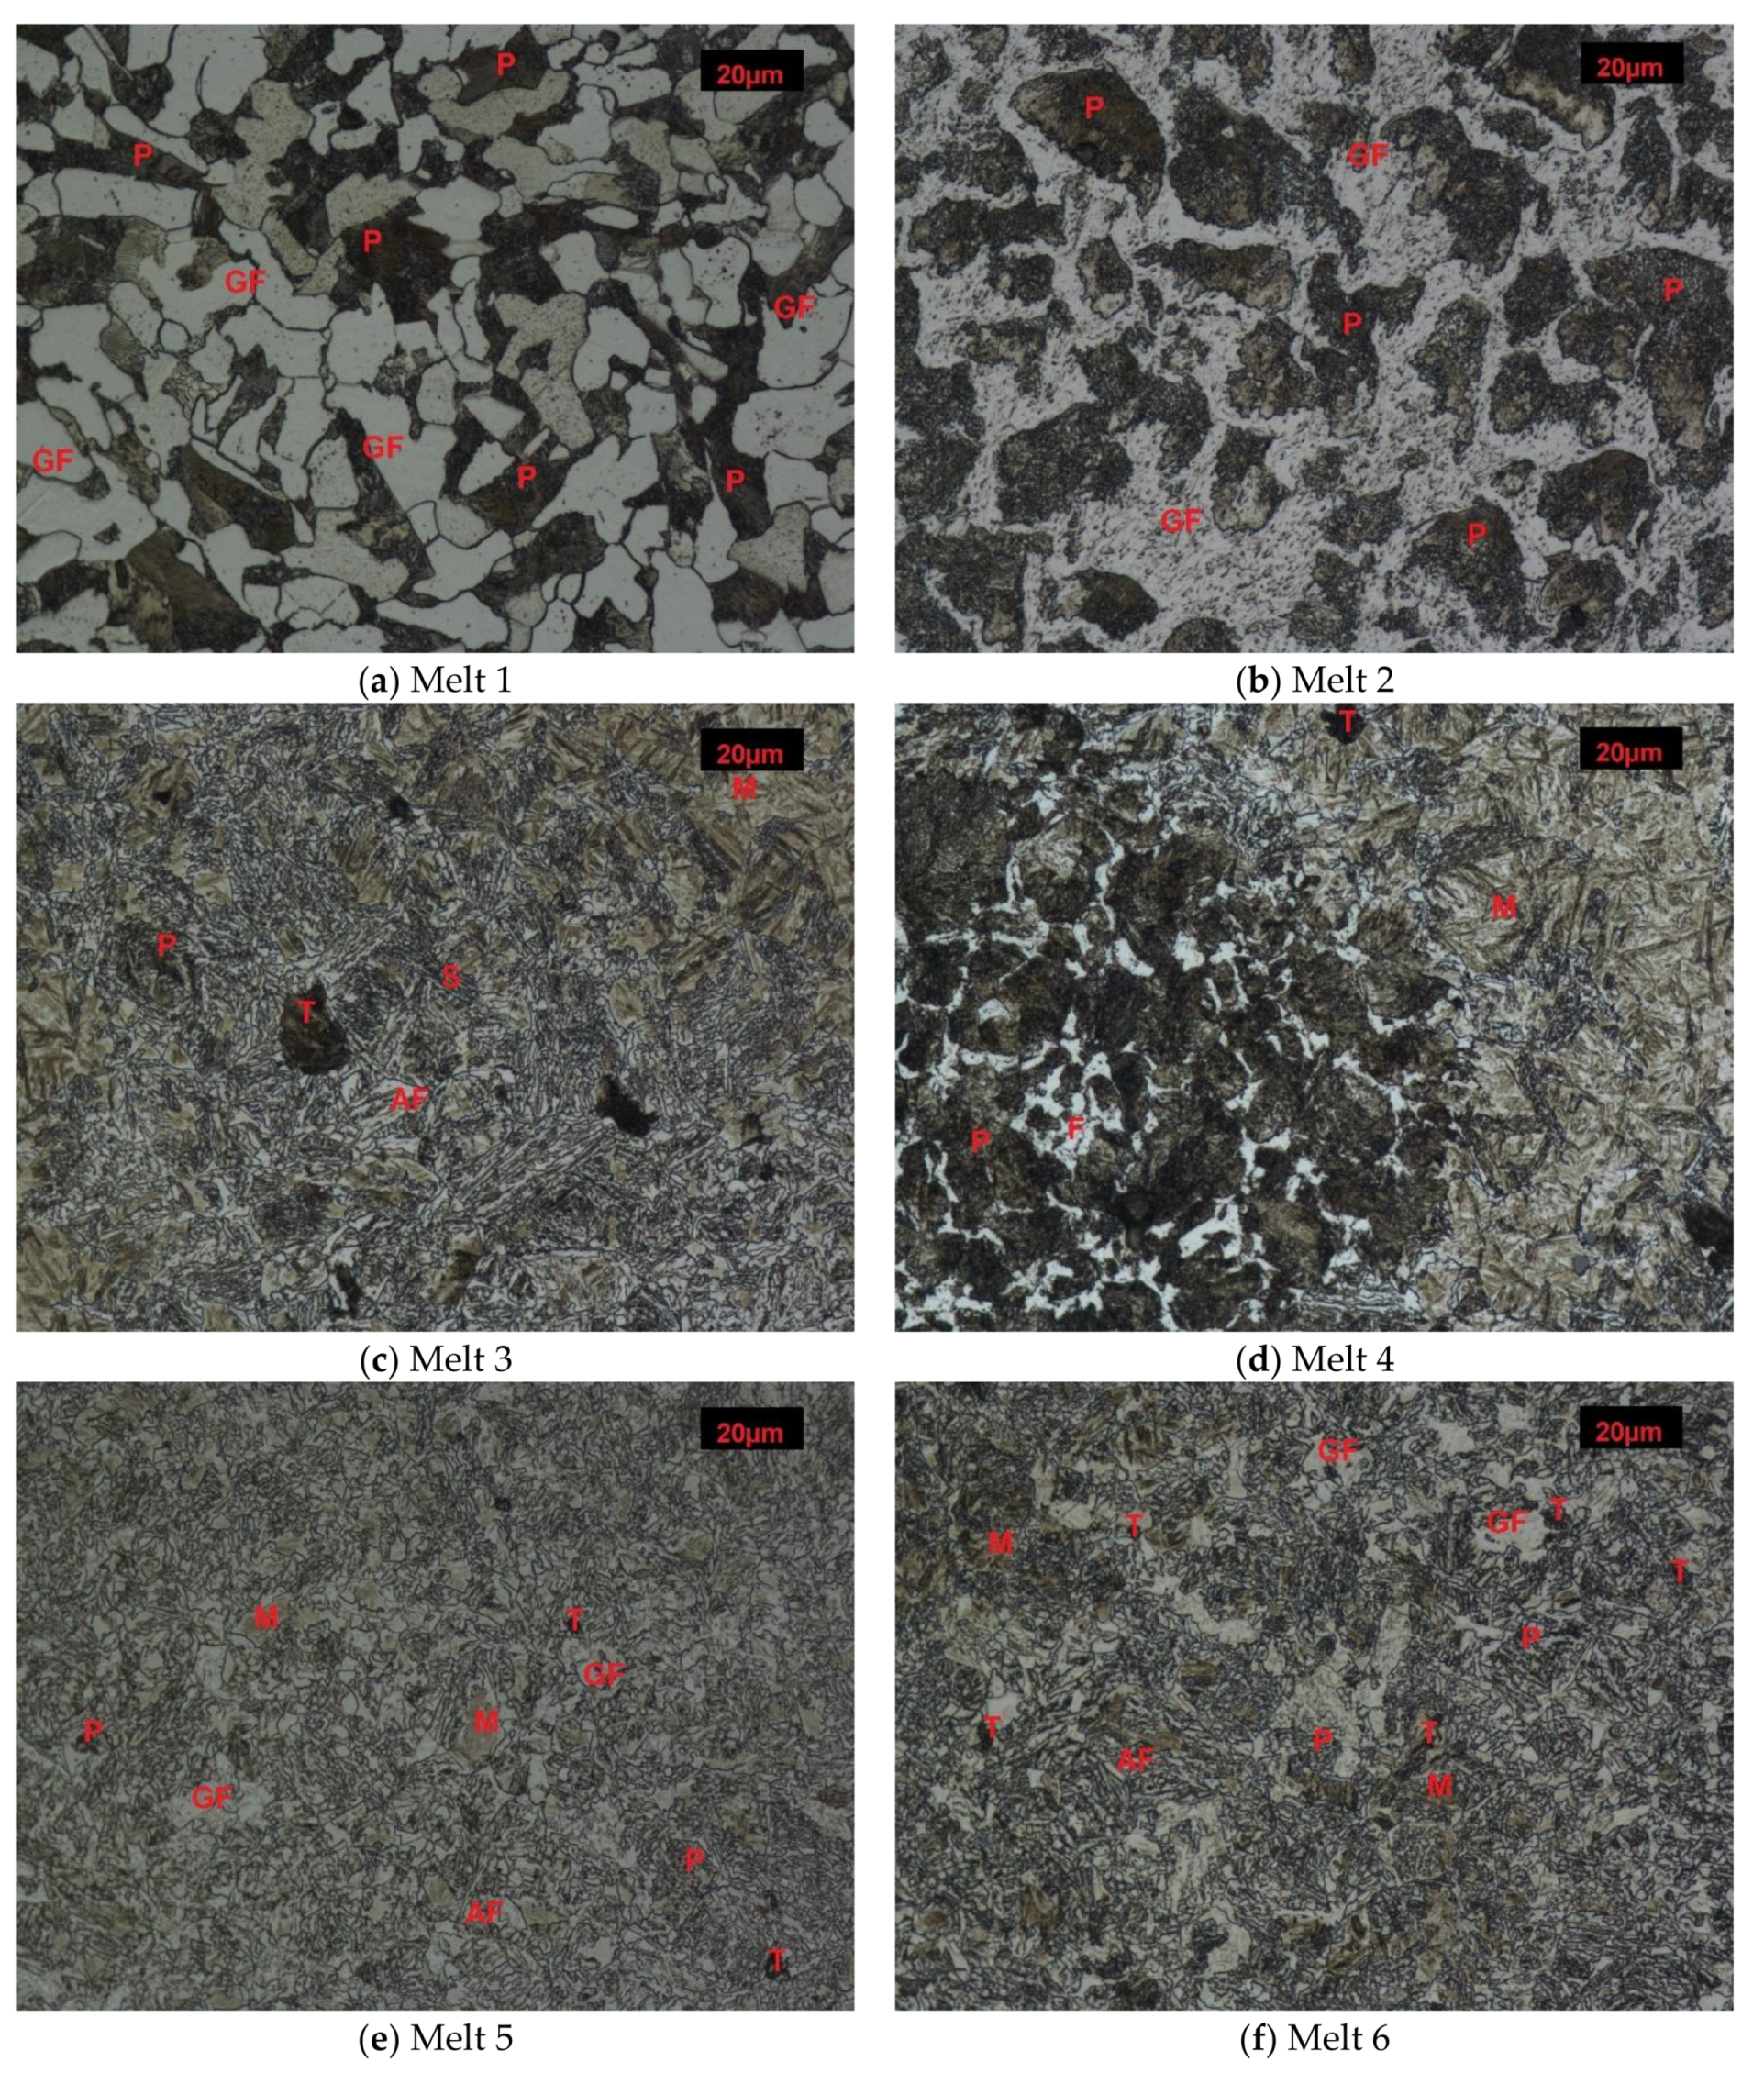
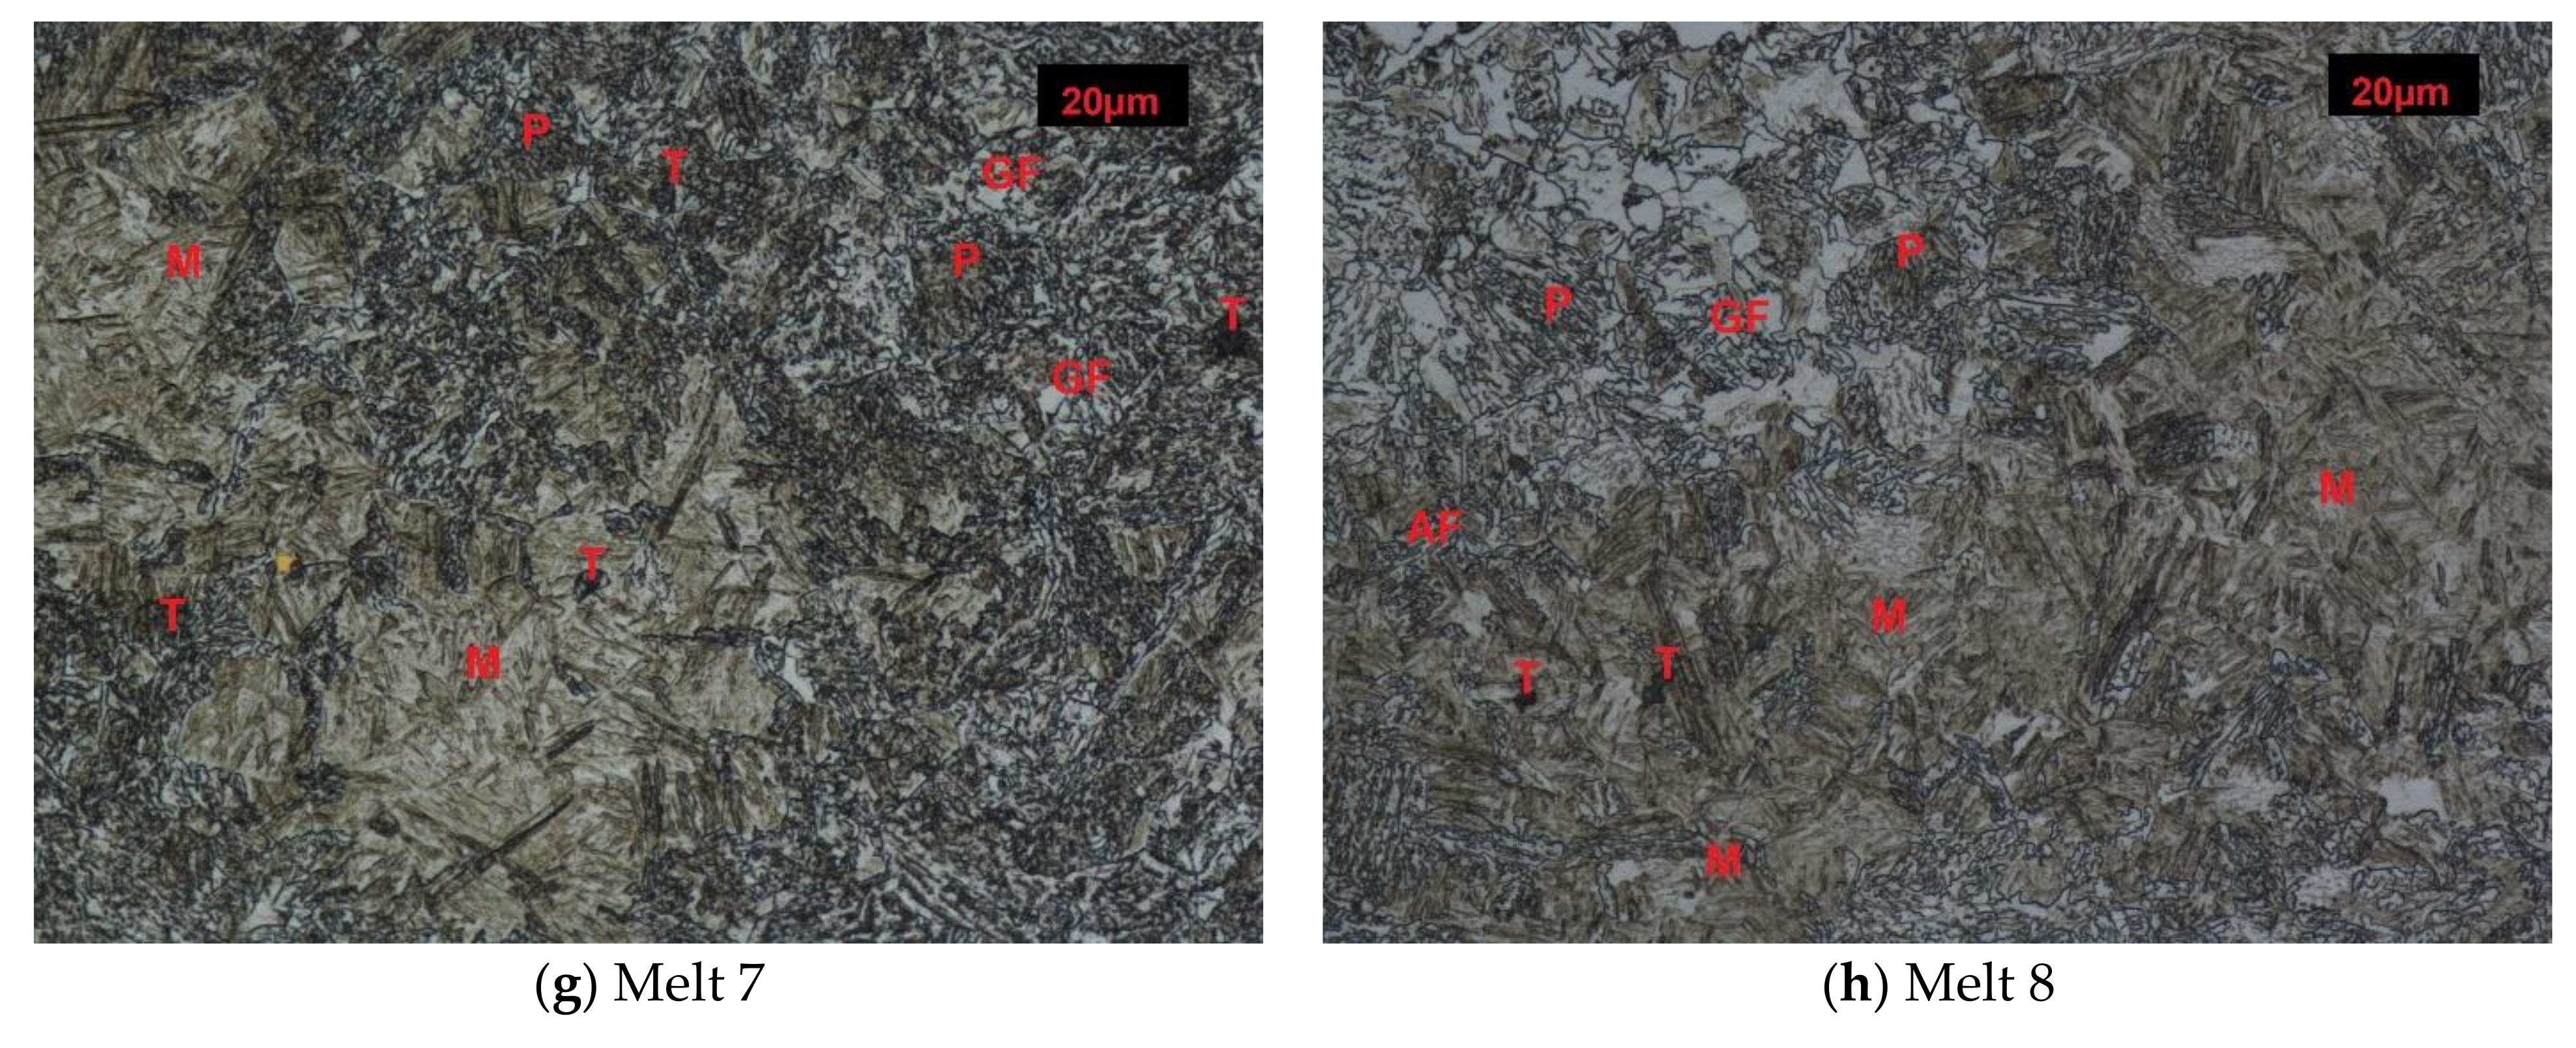
3.2. Structures after Quench-Hardening

Melt 1 was characterized by large abnormal grains (Figure 3a). After quench-hardening, in their place, a large quantity of residual austenite was visible against a background of acicular martensite. Precipitates of acicular upper bainite could be seen on grain boundaries of former austenite. Martensite in melt 2 was more fine-grained (Figure 3b). Against its background, acicular ferrite were visible. Microstructures of melts 3, 4, 5 and 6 were similar (Figure 3c–f), built of fine-lath quench-hardening martensite. Moreover, regular, yellowish precipitates of titanium nitrides could be seen in melts 3 and 5. The microstructure of melt 7 was composed of medium-lath martensite (Figure 3g). Quench-hardening martensite visible in the microstructure of melt 8 was more fine-grained (Figure 3h) and was similar to martensite in melt 5.

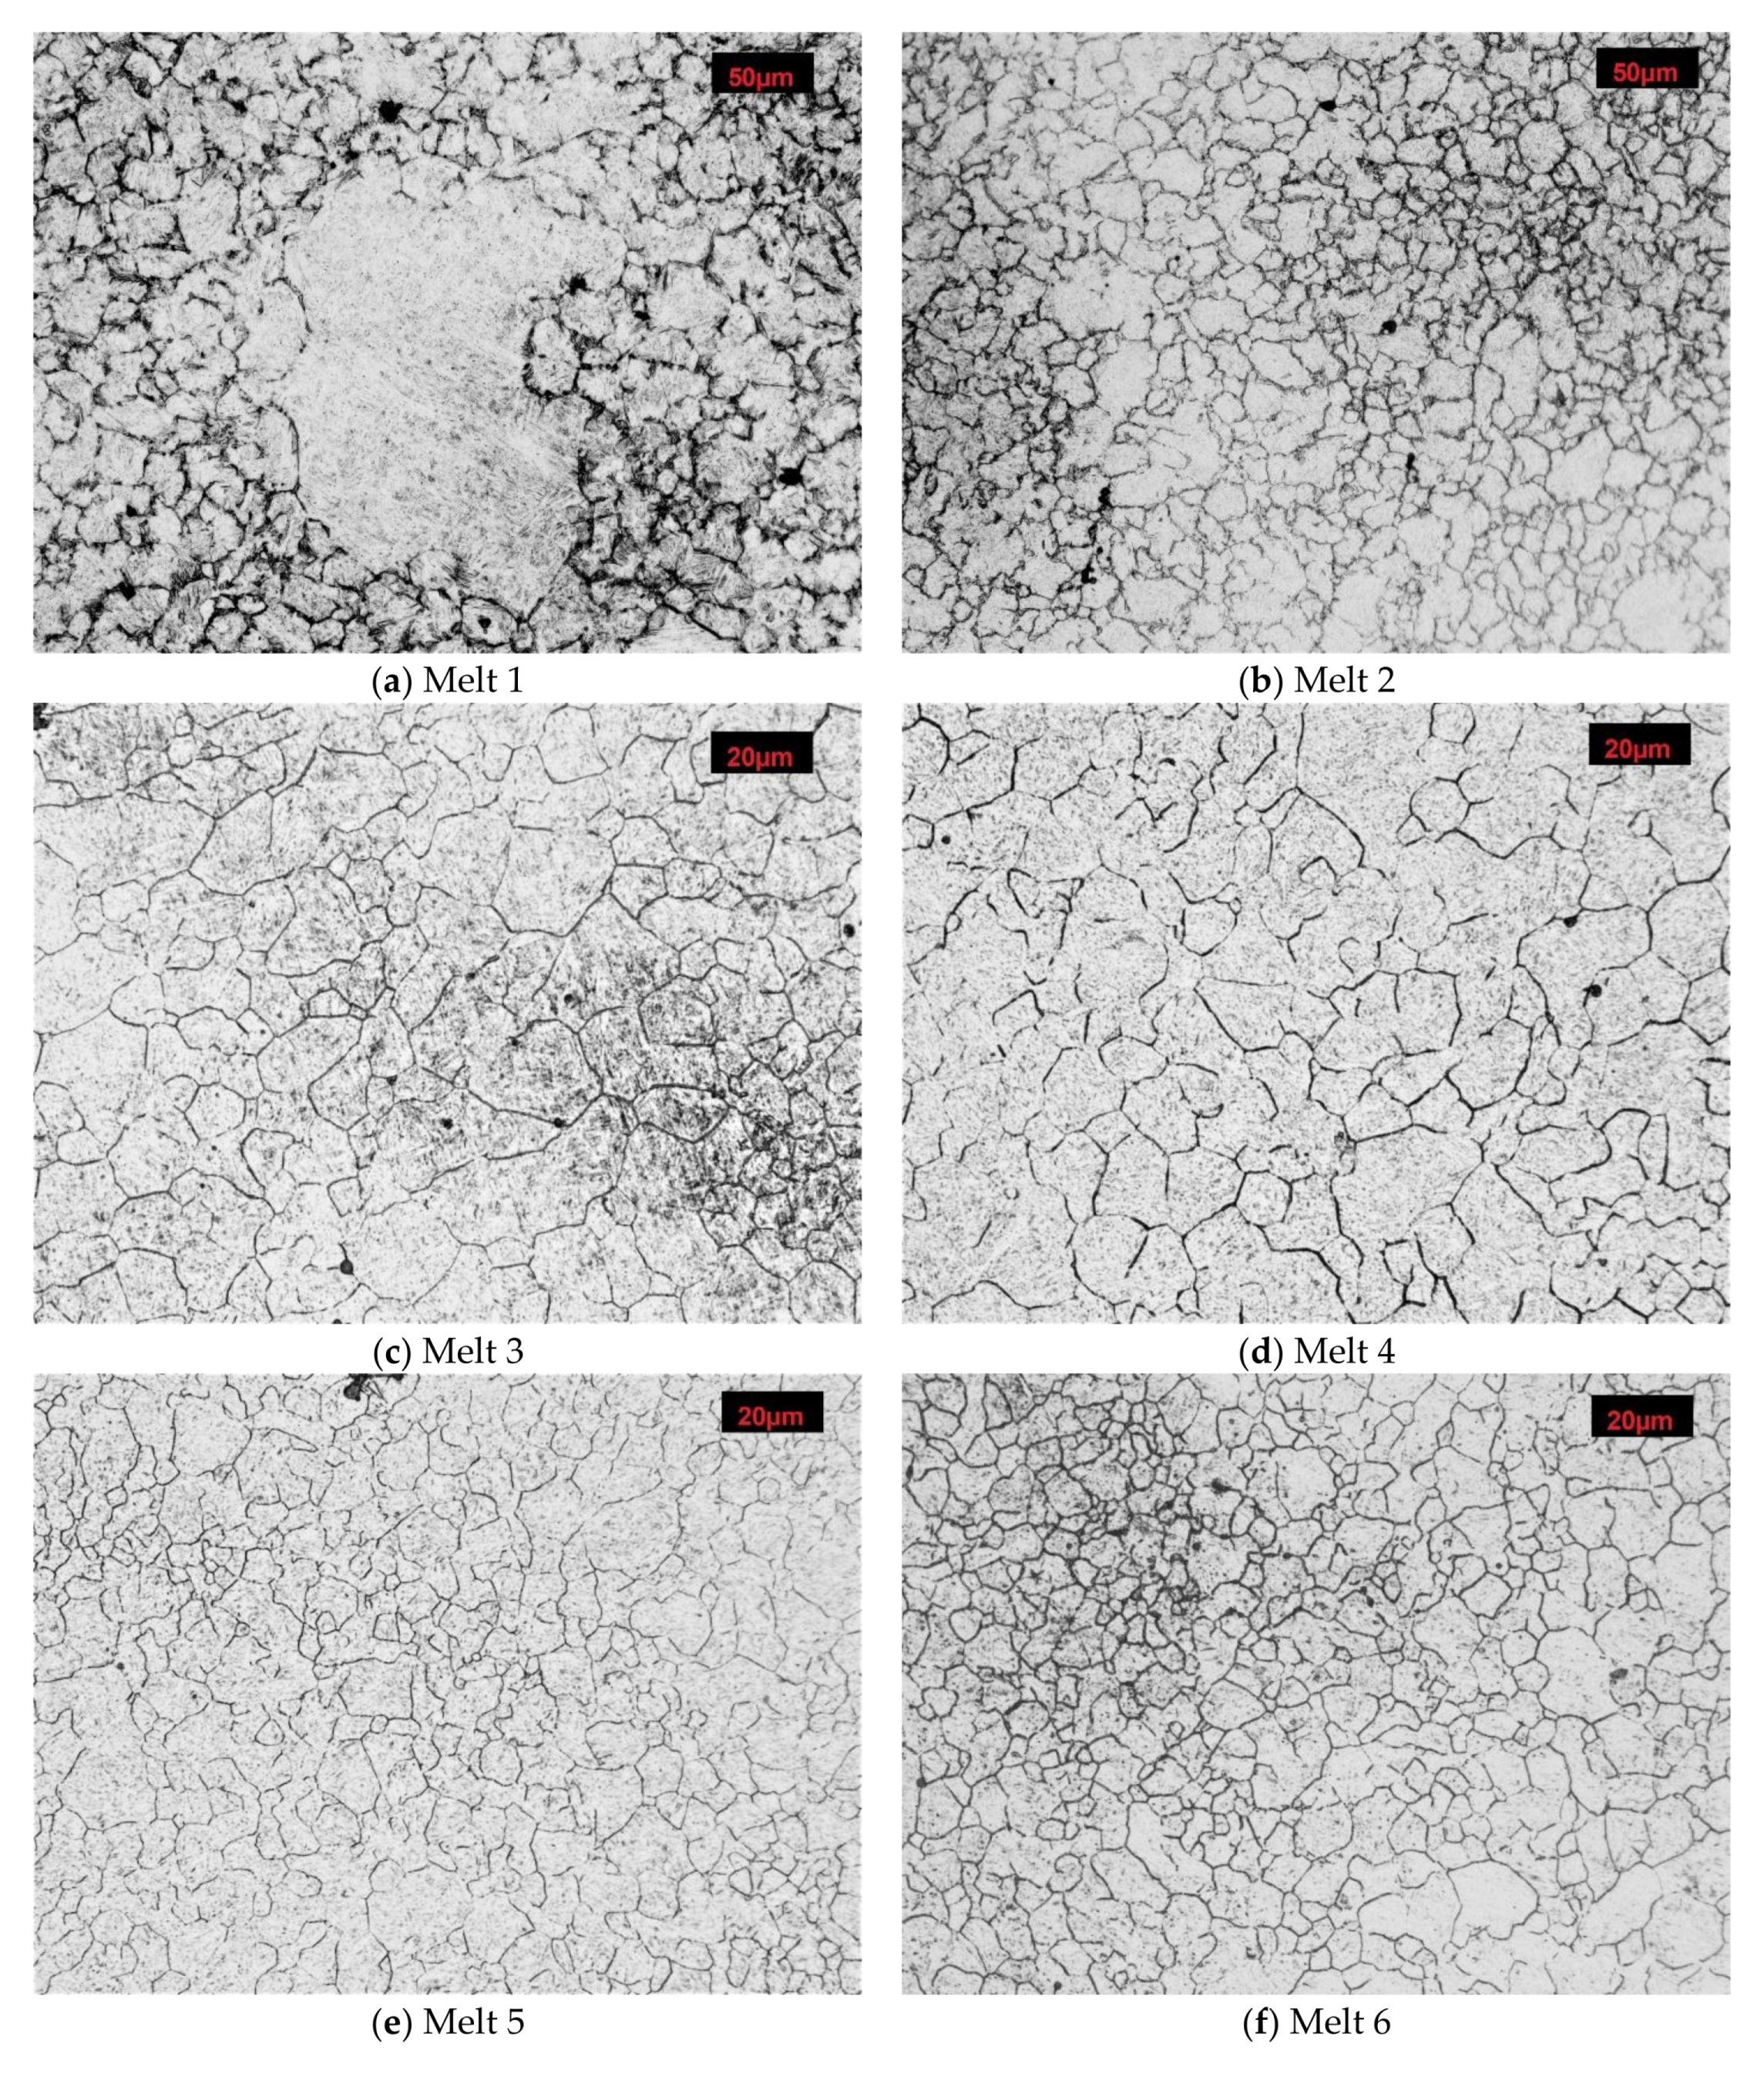
3.3. Grain Size of Former Austenite

After austenitizing at 890 °C, numerous abnormally large grains surrounded with colonies of fine grains were observed in microstructure of the melt 1 (Figure 4a). Average diameter of former austenite grains was 20.65 µm and minimum and maximum values were 4.15 and 165.34 µm, respectively, see Table 4. Irrespective of the abnormal grains, the smallest grains accounted for ca. 40% of all the grains (Figure 5a). The obtained results could not be approximated by any theoretical distribution.
In comparison to melt 1, melt 2 did not include boron in its chemical composition, see Table 1. After austenitizing, microstructure of the melt was more homogeneous, with generally smaller grains and the occurring abnormal grains smaller and not so numerous (Figure 4b). Average austenite grain diameter and ASTM grain size GS were respectively 13.07 µm and 9.14. The obtained grain size distribution after austenitizing at 870 °C could be approximated by the log-normal distribution (Figure 5b).
In the microstructure of melt 3, no abnormal grains were observed (Figure 4c). Even if the sizes of the grains were variable, the difference between the largest and the smallest measured diameter was ca. 35 µm (see Table 4) and the average diameters of former austenite grains and the ASTM GS value were 11.78 μm and 9.44, respectively. From the results from the obtained grain size distribution that could be approximated by the log-normal distribution, the grains smaller than 7.50 µm accounted for 40% of all grains.
After austenitizing at 840 °C, no significant structural qualitative differences were found in melt 4 in comparison to the boron-containing melt 3, see Figure 4d and Table 4. No abnormal grains were found, although the structure was composed of different-size grains, whose diameters ranged from 1.77 µm to over 25 µm. Grain size GS was 10.42. The obtained grain size distribution could not be approximated by the log-normal distribution.
In comparison to melt 3 which, was austenitized at a temperature only 10 °C higher, melt 5 showed smaller and more uniform grains (Figure 4e). Minimum diameter of former austenite grains was 2.29 µm, maximum diameter reached 18.43 µm and the ASTM GS value was 10.95 (Table 4).
Average grain diameter and the ASTM GS value of melt 6 after austenitizing at 870 °C were 5.89 μm and 11.43, respectively, see Table 4. The grains were fine and uniform (Figure 4f), with the difference between minimum and maximum grain diameters amounted to about 15 µm.
After austenitizing at 810 °C, melt 7 was characterized by quite large, irregular grains (Figure 4g), even though, apart from boron, it contained 0.019% of titanium, see Table 4. The structure included abnormal grains surrounded with colonies of smaller grains. Very fine grains with diameters below 5 µm accounted for ca. 5% only (Figure 5g). ASTM grain size GS was equal to 9.67.
In melt 8, grains were generally fine and more uniform and its structure was similar to that obtained in melt 4, austenitized at a temperature 50 °C lower. No abnormal grains were found (Figure 4h). ASTM grain size GS was 10.38, average grain diameter 8.50 µm, median was close to the average value and minimum and maximum diameters were 1.77 µm and 20.59 µm, respectively (Table 4).
The obtained distributions of the melts 3, 5, 6, 7 and 8 could be approximated by the log-normal distribution.

3.4. Jominy of Hardenability Test

Figure 6 and Figure 7 show hardenability curves of the analyzed melts. In the collective chart (Figure 6), clear differences of hardenability are visible between the melts 1 and 2 and the other melts. The first pair of melts was characterized by low hardenability (Figure 7a) and the measured hardness values dropped very rapidly with the distance from the specimen end face. Basically, there were no differences of hardenability between the melt containing boron and the melt free of boron, and the distances of semi-martensitic zones from the specimen end faces were 1.7 and 2.0 mm, respectively. Additives of chromium in melts 3 and 4 improved their hardenability and their hardenability curves did not show a big drop of hardness measured deeper into the specimens (Figure 7b). Like in the previously analyzed melts, no significant differences of hardenability were noticed between them. The distances of semi-martensitic zones from the specimen end faces were 27.5 and 25.0 mm. Differences in hardenability curves could be seen between melts 5 and 6 only (Figure 7c). The obtained curves could basically be considered parallel, but the curve for melt 6 was shifted towards lower hardness values. The distance of the semi-martensitic zone from the specimen end face was 35.0 mm for melt 5 and 23.5 mm for melt 6. Between the melts 7 and 8, there was the biggest difference in carbon concentration among all the analyzed melts. At the beginning, the hardness values were similar, but started differing significantly at a distance of 10 mm from the specimen end face (Figure 7d) and the curve for the melt 7 was moved towards lower hardness values. The read-out distances of semi-martensitic zones from the specimen face ends for melts 7 and 8 were 20.0 and 45.0 mm, respectively.
The way of calculation of boron hardenability factors is shown in Table 5, Table 6, Table 7 and Table 8.
The examined melts were characterized by significant differences of hardenability, see Table 9, Table 10, Table 11 and Table 12. The values of ideal critical diameters DIJ determined on the grounds of hardenability curves ranged between 13.5–154.1 mm, while the lowest diameters were found for the melts 1 and 2 (Table 9) and the highest diameters-for the melts 5 and 8, see Table 11 and Table 12. The ideal critical diameters DIJc of melts 1, 3, 5 and 7, corrected by the temperature factor, ranged within 12.8–141.9 mm, while the lowest value was found for melt 1 and the highest value for melt 5. After introducing an additional correction, apart from those related to chemical composition and grain size, the following range of ideal critical diameters were obtained for the boron-containing melts: 16.3–141.6 mm. As regards to the critical diameters DI calculated by the Grossmann’s method, only the diameter read-out from the hardenability curve for melt 8 was consistent with the empirical value, see Table 12. The values of boron hardenability factors ranged between 0.73–1.26. For melts 1 and 2, this factor was equal to 1.04 (Table 9), so it can be seen that, in the case of the steel free of microadditives, influence of boron on improvement of hardenability is negligible. This can result more from austenite grain growth and to a lesser extent from the action of boron that is mostly bound in nitrides and its smaller quantity only is dissolved. It was similar when chromium was added to the melt, see Table 10. An addition of chromium significantly improves hardenability, but the mechanism of its action is different than that of boron. The boron hardenability factor for melt 3 was 0.91. Therefore, with no other microadditives in steel, the benefits resulting from boron as the intensifier of hardenability are lost. It is only an addition of 0.26% of vanadium, accompanied by 0.99% of chromium, that significantly improved effectiveness of 0.003% of boron to the f2 value of 1.26 (Table 11), even if titanium content was below its alloying concentration. The effect of vanadium can result from the fact that it bonds a part of nitrogen, thus increasing the amount of boron dissolved in austenite. However, it should be taken into consideration that vanadium shows weaker affinity for nitrogen than boron. Therefore, when vanadium is introduced individually, its concentration must be higher than 0.2% to increase effectiveness of boron, since its sufficient quantity only is able to bond nitrogen. Concentrations of vanadium in melts 5 and 6 were similar, with the value even higher in melt 6, so the observed hardenability increase of the melt 5 was strictly related to the boron content. Thus, it can be said that an addition of 0.26% of vanadium effectively protected boron against nitrogen, ensuring the amount of boron in austenite is sufficient to inhibit its decomposition effectively.
However, the situation is interesting in melts 7 and 8, see Table 12. Melt 7 contained less titanium than its alloying concentration, because such quantities of titanium are commonly added to one of the most popular micro-alloy steels. Hardenability of melt 7 was lower than that of melt 8 and its factor f2 was equal to 0.73. This is an interesting observation, since content of titanium, as the element with high affinity for nitrogen, clearly influences quantity of boron dissolved in austenite and, in this case, only boron would improve hardenability. Nakasato and Takahashi [34] showed that the addition of titanium at the level of min. 0.02% allows free nitrogen to be bound by forming TiN and enables boron to remain in solution. In the absence of titanium, it is important to maintain the low nitrogen content of only 30–40 ppm and a sufficiently high amount of aluminum (350–500 ppm). In melt 7, the titanium content at the level of 0.019% was found to be insufficient for effective present nitrogen binding, probably mainly due to a higher nitrogen content than recommended by Nakasato and Takahashi. Therefore, insufficient quantity of nitride-forming elements will result in losing the favorable effect of boron as the hardenability improving element or will even reduce hardenability.

4. Conclusions

The purpose of this work was to evaluate the effect of boron on hardenability of steel quantitatively and to assess this effect in the case when boron is applied together with other alloying elements like chromium, vanadium and titanium. During the analysis, the ideal critical diameter was made independent of austenitization temperature, grain size and chemical composition, so it was possible to investigate the effect of boron as the hardenability intensifier. On the basis of the research carried out, it can be concluded that the effect of boron on hardenability of the non-alloyed steel was negligible. For melt 1 the factor f2 was equal to 1.04. Introduction of ca. 1% of chromium and ca. 1.30% of manganese did not cause any hardenability increase resulting from action of boron. For melt 3 the factor f2 was equal to 0.91. It is only a complex introduction of manganese, chromium and vanadium that improved the effect of boron as the hardenability intensifier. For melt 5 the factor f2 was equal to 1.26 so the presence of microadditivites such as vanadium and boron can even increase hardenability by about 26%. Insufficient quantity of other microadditives resulted in a loss of advantages caused by the action of boron as the element improving hardenability and could even result in a decrease of hardenability of the boron-containing steel. This is particularly evident in melt 7, where the titanium content was insufficient to counteract the binding of boron in boron nitrides, which lost the positive effect of boron on hardenability.
The author’s interest also lied in the complex analysis of the influence of chromium, vanadium and titanium in the presence of boron on the structure morphology and grain size of analyzed low-alloy cast steels. The smallest grain size was obtained for melt 6 after austenitizing at 870 °C and the largest grain size for melt 1, after austenitizing at 890 °C. In melt 1, large abnormal grains appeared just after austenitizing at 890 °C. After normalizing, the melts containing chromium, vanadium and titanium underwent partial quenching, revealing the whole spectrum of hardening structures, such as martensite, troostite and sorbite. After quenching, the martensitic structures of the melts containing chromium, vanadium and titanium were similar to one another. Melt 1 was characterized by a thick needle-shaped martensite structure with precipitates at grain boundaries in upper bainite. In melt 2 martensite was finer, however, it was still possible to observe acicular ferrite against its background. Simultaneously, the melts containing boron gained higher hardness than the melts with similar chemical composition but without boron.
Due to the fact that the summary effect of alloy additions may be hard to predict or calculate and data usually presents the influence of individual elements on the position of the critical temperatures of phase changes and points in the iron-cementite diagram, future research will focus on the influence of boron in the presence of other elements like chromium, molybdenum, manganese and niobium on the transformations occurring during continuous cooling, on the morphology of carbide and nitride phase precipitates. What is more, the mechanism of toughness improvement or degradation by boron addition in heat-treatable steels remains to be unambiguously identified so the influence of boron to the resistance to dynamic loads, together with the influence on the morphology of the obtained fractures will be analyzed. However, since most boron steels are intended for machine working elements exposed to abrasive wear, an analysis of the effects on abrasive wear resistance and wear mechanisms will be carried out. Therefore, the scientific considerations indicated in the study seem to be most justified. In addition, the author is of the opinion that it is not possible to carry out extended research on the influence of boron, for example, in the field of fracture mechanics, without determining the actual structural-strength characteristics obtained in the course of basic research and fractographic analysis. The planned research, together with the effect of boron on hardenability in the presence of other alloying and micro-alloying elements presented in the manuscript, will allow a comprehensive assessment of the influence of this element on a number of structural and mechanical properties of steels, which will make it possible to rationally approach the use of the potential of this element in the design of new structural steels, and a rational approach to structural and material solutions for selected machine elements, based on actual research results, which may significantly extend the service life or even extend the operational capabilities of the entire work object in which such materials will be used. Examples of such planned and well-executed research experiments, the results of which have significantly influenced the optimization of technological processes and material properties, resulting in the durability of the entire structure, can be found in such works as [35,36,37].

Funding

This study was funded by grand number 0402/0075/18.

Institutional Review Board Statement

Not applicable.

Informed Consent Statement

Not applicable.

Data Availability Statement

Not applicable.

Conflicts of Interest

The author declares no conflict of interest.

References

  1. SSAB-Oxelösund. Hardox—Das Verschleiβblech der Vielen Möglichkeiten; Information Materials of Ironworks SSAB-Oxelösund; SSAB: Oxelösund, Sweden, 2002. [Google Scholar]
  2. Bin Khiyon, M.R.; Salleh, S.M. Effect of heat-treatment on the hardness and mechanical properties of boron alloyed steel. MATEC Web Conf. 2017, 90, 12. [Google Scholar] [CrossRef] [Green Version]
  3. Geiger, M.; Duflou, J.; Kals, H.J.J.; Shirvani, B.; Singh, U.P. Basic investigations on the hot stamping steel 22MnB5. Adv. Mater. Res. 2005, 6, 795–804. [Google Scholar] [CrossRef]
  4. Güler Özgül, H.; Ertan, R.; Ozcan, R. Influence of heat treatment parameters on the microstructure and mechanical properties of boron-alloyed steels. Mater. Test. 2012, 54, 1–6. [Google Scholar] [CrossRef]
  5. Venturatoa, G.; Novellaa, M.; Bruschia, S.; Ghiottia, A.; Shivpuri, R. Effects of phase transformation in hot stamping of 22MnB5 high strength steel. Procedia Eng. 2017, 183, 316–321. [Google Scholar] [CrossRef]
  6. Białobrzeska, B.; Jasiński, R.; Konat, Ł.; Szczepański, Ł. Analysis of the properties of hardox extreme steel and possibilities of its applications in machinery. Metals 2021, 11, 162. [Google Scholar] [CrossRef]
  7. Yoon-Suk, C.; Sung-Joon, K.; Ik-Min, P.; Kwang-Woo, K.; In-Suk, Y. Boron distribution in a low-alloy steel. Met. Mater. 1997, 3, 118–124. [Google Scholar]
  8. Maitrepierre, P.; Thivellier, D.; Rofes-Vernis, J.; Rousseau, D.; Tricot, R. Hardenability Concepts with Applications to Steel; Doane, D.V., Kirkaldy, J.S., Eds.; AIME: Englewood, CO, USA, 1978; pp. 421–447. [Google Scholar]
  9. Llewellyn, W.T.; Cook, W.T. Heat treatment distortion in case carburising steels. Met. Technol. 1977, 4, 265–278. [Google Scholar] [CrossRef]
  10. Kapadia, B.M.; Brown, R.M.; Murphy, W.J. The influence of nitrogen, titanium and zirconium on the boron hardenability effect in constructional steels. Trans. Met. Soc. AIME 1968, 242, 1689–1694. [Google Scholar]
  11. Melloy, G.F.; Slimmon, P.R.; Podgursky, P. Segregation and the strength of grain boundaries. Met. Transit. 1973, 4, 2279–2289. [Google Scholar] [CrossRef]
  12. Sharma, M.; Ortlepp, I.; Bleck, W. Boron in heat-treatable steels: A review. Steel Res. Int. 2019, 90, 1–28. [Google Scholar] [CrossRef]
  13. Grimm, W. Technischer Bericht; Edelstahlwerke Buderus AG: Wetzlar, Germany, 1980. [Google Scholar]
  14. Yamanaka, K.; Ohmori, Y. Effect of boron on transformation of low-carbon low-al loy steels. Tetsu-to-Hagane 1976, 62, 895–904. [Google Scholar] [CrossRef] [Green Version]
  15. Asahi, H. Effects of mo addition and austenitizing temperature on hardenability of low alloy b-added steels. ISIJ Int. 2002, 42, 1150–1155. [Google Scholar] [CrossRef]
  16. Opiela, M. Structure and mechanical properties of forged microalloyed steel products manufactured with the thermo-mechanical treatment. Hutnik 2013, 80, 579–583. [Google Scholar]
  17. Taylor, K.A. Grain-boundary segregation and precipitation of boron in 0.2 percent carbon steels. Metall. Mater. Trans. A 1992, 23, 107–119. [Google Scholar] [CrossRef]
  18. Dobrzański, L.A. Basics of Materials and Metals Science; WNT Scientific and Technical Publishing House: Warsaw, Poland, 2013. (In Polish) [Google Scholar]
  19. Ueno, M.; Itoh, K. New empirical formula for estimation of hardenability from chemical compositions. ISIJ Int. 1988, 74, 1073–1080. [Google Scholar]
  20. Pickering, F.B. Physical Metallurgy and the Design of Steels; Applied Science Publishers Ltd: London, UK, 1978. [Google Scholar]
  21. Titova, T.I.; Shulgan, N.A.; Malykhina, I.Y. Effect of boron microalloying on the structure and hardenability of building steel. Met. Sci. Heat Treat. 2007, 49, 39–44. [Google Scholar] [CrossRef]
  22. Kupczyk, J.; Lis, A.K. Influence of boron on kinetics of phase transformations in steel 1021. In Proceedings of the 12th International Scientific Conference Achievements in Mechanical and Materials Engineering, Gliwice, Poland, 7–10 December 2003; pp. 547–550. (In Polish). [Google Scholar]
  23. Totten, G.E. Steel Heat Treatment: Metallurgy and Technologies Handbook; Portland State University: Portland, OR, USA, 2007. [Google Scholar]
  24. Briedis, J.B.; Cuddy, L.J. Enhanced hardenability in microalloyed steels. Key Eng. Mater. 1993, 84, 157–192. [Google Scholar] [CrossRef]
  25. Naderi, M.; Ketabchi, M.; Abbasi, M.; Bleck, W. Analysis of microstructure and mechanical properties of different boron and non-boron alloyed steel after being hot stamped. Procedia Eng. 2011, 10, 460–465. [Google Scholar] [CrossRef] [Green Version]
  26. Grange, R.A.; Mitchell, J.B. On the hardenability effect of boron in steel. Trans. Am. Soc. Met. 1961, 53, 157–185. [Google Scholar]
  27. Hodge, J.H.; Orehoski, M.A. Relationship between hardenability and percentage of martensite in some alloy steels. Trans. Am. Soc. Met. 1946, 167, 627–642. [Google Scholar]
  28. Grossmann, H.A. Elements of Hardenability; ASM: Metals Park, OH, USA, 1952. [Google Scholar]
  29. Garbarz, B.; Pickering, F.B. Effect of vanadium and austenitising temperature on hardenability of (0.2–0.3)C−1,6Mn steels with and without addition of titanium, aluminium and molybdenum. Mater. Sci. Technol. 1988, 4, 114–126. [Google Scholar] [CrossRef]
  30. Adrian, H. A Mechanism for effect of vanadium on hardenability of medium carbon manganese steel. Mater. Sci. Technol. 1999, 15, 366–378. [Google Scholar] [CrossRef]
  31. Pelczar, M. The Influence of Micro-Additives on the Hardenability of Steel with Boron. Ph.D. Thesis, University of Science and Technology, Krakow, Poland, 2010. (In Polish). [Google Scholar]
  32. Jackson, C.E.; Christenson, A.L. The effect of quenching temperature on the results of the end-quench hardenability test. Trans. Am. Soc. Met. 1944, 158, 125–137. [Google Scholar]
  33. Moser, A.; Legat, A. Die berechnung der härtbarkeit aus der chemischen zusammensetzung. Härt. Tech. Mitt. 1969, 24, 100–105. [Google Scholar]
  34. Nakasato, F.; Takahashi, M. Effects of boron, titanium, and nitrogen on the hardenability of boron-treated steels for heavy machinery. Met. Technol. 1979, 6, 102–105. [Google Scholar] [CrossRef]
  35. Erdakova, N.; Tkachevb, V.M.; Novokreshchenova, V.V. Increase of wear resistance of steel plates for crushing stations. J. Frict. Wear 2014, 35, 514–519. [Google Scholar] [CrossRef]
  36. Juez-Gil, M.; Nikolaevich Erdakov, I.; Bustillo, A.; Yurievich Pimenov, D. A regression-tree multilayer-perceptron hybrid strategy for the prediction of ore crushing-plate lifetimes. J. Adv. Res. 2019, 18, 173–184. [Google Scholar] [CrossRef]
  37. Fernández, B.; González, B.; Artola, G.; López de Lacalle, N.; Angulo, C. A quick cycle time sensitivity analysis of boron steel hot stamping. Metals 2019, 9, 235. [Google Scholar] [CrossRef] [Green Version]
Figure 1. Microstructures of analyzed melts after normalizing. (GF)-granular ferrite, (AF)-acicular ferrite, (P)-pearlite, (S)-sorbite, (T)-troostite, (M)-martensite. Etched, light microscopy. (a) Melt 1, (b) Melt 2, (c) Melt 3, (d) Melt 4, (e) Melt 5, (f) Melt 6, (g) Melt 7, (h) Melt 8.
Metals 11 00589 g001aMetals 11 00589 g001b
Figure 2. Hardness of analyzed melts after normalizing.
Metals 11 00589 g002
Figure 3. Microstructures of analyzed melts after quench-hardening. (M)-martensite, (UP)-upper bainite. (AF)-acicular ferrite. Etched, light microscopy. (a) Melt 1, (b) Melt 2, (c) Melt 3, (d) Melt 4, (e) Melt 5, (f) Melt 6, (g) Melt 7, (h) Melt 8.
Metals 11 00589 g003aMetals 11 00589 g003b
Figure 4. Microstructures of analyzed melts with revealed former austenite grain. Etched, light microscopy. (a) Melt 1, (b) Melt 2, (c) Melt 3, (d) Melt 4, (e) Melt 5, (f) Melt 6, (g) Melt 7, (h) Melt 8.
Metals 11 00589 g004aMetals 11 00589 g004b
Figure 5. Distributions of austenite grain diameters of the analyzed melts. (a) Melt 1, (b) Melt 2, (c) Melt 3, (d) Melt 4, (e) Melt 5, (f) Melt 6, (g) Melt 7, (h) Melt 8.
Metals 11 00589 g005aMetals 11 00589 g005b
Figure 6. Hardenability curves for the analyzed melts.
Metals 11 00589 g006
Figure 7. Hardenability curves for the analyzed melts together with hardness values of semi-martensitic zones. (a) Melts 1 and 2, (b) Melts 3 and 4, (c) Melts 5 and 6, (d) Melts 7 and 8.
Metals 11 00589 g007
Table 1. Chemical composition of analyzed melts.
Melt No.C (wt%)Si (wt%)Mn (wt%)P (wt%)S (wt%)Cr (wt%)Ni (wt%)
10.310.340.300.0180.0100.0270.044
20.340.370.590.0160.0100.0300.060
30.410.431.320.0230.0110.9000.091
40.360.381.340.0180.0110.8500.070
50.380.471.370.0180.0110.9900.060
60.370.451.400.0170.0090.9700.075
70.380.411.400.0180.0100.9000.100
80.300.411.450.0170.01010000.112
Melt No.Mo (wt%)Cu (wt%)V (wt%)Ti (wt%)Al (wt%)B (wt%)N (ppm)
10.0150.0470.0020.0020.0250.002121
20.0130.0730.0060.0020.022115
30.0240.1000.0100.0050.0240.003192
40.0200.0700.0090.0040.02662
50.0170.0430.2600.0060.0230.003184
60.0200.0600.2750.0130.02262
70.0300.1100.0100.0190.0220.003165
80.0290.1100.0130.0590.039161
Table 2. Austenitizing temperatures of individual melts.
TA (°C)Melt 1Melt 2Melt 3Melt 4Melt 5Melt 6Melt 7Melt 8
890870830840840870810890
Table 3. Coefficient B values determining influence of main alloying elements on hardenability according to Moser and Legat.
Alloying ElementCoefficient B
Mo3275
Mn2210
Cr2130
Si1400
Ni1470
Table 4. Descriptive statistics of grain diameter distributions and ASTM grain size GS obtained for the analyzed melts.
TA (°C)Average Diameter (μm)Median (μm)Minimum (μm)Maximum (μm)ASTM Grain Size
890Melt 1
20.6517.694.15165.347.82
870Melt 2
13.0710.533.4243.089.14
830Melt 3
11.789.113.0838.299.44
840Melt 4
8.366.321.7725.0410.42
840Melt 5
6.976.202.2918.4310.95
870Melt 6
5.894.971.4516.7811.43
810Melt 7
10.889.672.0150.719.67
890Melt 8
8.508.071.7720.5910.38
Table 5. Calculation procedure of boron hardenability factors for the melts 1 and 2.
ASTM Grain size GS of the melt 1:
G S = 16.54 2.88 × ln ( 20.65 )
G S = 7.82
ASTM Grain size GS of the melt 2:
G S = 16.54 2.88 × ln ( 13.07 )
G S = 9.14
Ideal critical diameter DIJ of the melt 1:
D I J = 13.5   mm
Ideal critical diameter DIJ of the melt 2:
D I J = 15.7   mm
Correction factor fcorr for the melt 1:
f c o r r = 6.4217 + 3.78 × 10 3 × 890 0.2964 × 890 2
f c o r r = 234769
Correction factor fcorr for the melt 2:
f c o r r = 6.4217 + 3.78 × 10 3 · 870 0.2964 × 870 2
f c o r r = 224335
Corrected distance of semi-martensitic zone Jc for the melt 1:
J c = 1.7 × 234769 224335
J c = 1.6   mm
Corrected critical diameter DIJc of the melt 1:
D I J c = 12.8   mm
Corrected critical diameter DIJccorr of the melt 1:
D I J c o r r = 12.8 × 12.828094 × 1.596583 × 1.132576 × 1.015542 × 1.022943 × 1.023385 12.861536 × 1.268579 × 1.121201 × 1.017954 × 1.020625 × 1.017096
D I J c o r r = 16.3 mm
Factor f2:
f 2 = 16.3 15.7
f 2 = 1.04
Table 6. Calculation procedure of boron hardenability factors for the melts 3 and 4.
ASTM Grain size GS of the melt 3:
G S = 16.54 2.88 × ln ( 11.78 )
G S = 9.44
ASTM Grain size GS of the melt 4:
G S = 16.54 2.88 × ln ( 8.36 )
G S = 10.42
Ideal critical diameter DIJ of the melt 3:
D I J = 122.4   mm
Ideal critical diameter DIJ of the melt 4:
D I J = 114.9   mm
Correction factor fcorr for the melt 3:
f c o r r = 6.4217 + 3.78 × 10 3 × 830 0.2964 × 830 2
f c o r r = 204180
Correction factor fcorr for the melt 4:
f c o r r = 6.4217 + 3.78 × 10 3 × 840 0.2964 × 840 2
f c o r r = 209130
Corrected distance of semi-martensitic zone Jc for the melt 3:
J c = 27.5 × 204180 209130
J c = 28.2   mm
Corrected critical diameter DIJc of the melt 3:
D I J c = 122.9   mm
Corrected critical diameter DIJccorr of the melt 3:
D I J c o r r = 122.9 × 12.600000 × 2.893914 × 1.136393 × 1.02401 × 1.901615 × 1.027335 14.086873 × 2.848379 × 1.155673 × 1.02401 × 1.974884 × 1.035681
D I J c o r r = 104.4   mm
Factor f2:
f 2 = 104.4 114.9
f 2 = 0.91
Table 7. Calculation procedure of boron hardenability factors for the melts 5 and 6.
ASTM Grain size GS of the melt 5:
G S = 16.54 2.88 × ln ( 6.97 )
G S = 10.95
ASTM Grain size GS of the melt 6:
G S = 16.54 2.88 × ln ( 5.89 )
G S = 11.43
Ideal critical diameter DIJ of the melt 5:
D I J = 137.1   mm
Ideal critical diameter DIJ of the melt 6:
D i I = 112.1   mm
Correction factor fcorr for the melt 5:
f c o r r = 6.4217 + 3.78 × 10 3 × 840 0.2964 × 840 2
f k o r = 209130
Correction factor fcorr for the melt 6:
f c o r r = 6.4217 + 3.78 × 10 3 × 870 0.2964 × 870 2
f c o r r = 224335
Corrected distance of semi-martensitic zone Jc for the melt 5:
J c = 35.0 × 224335 209130
J c = 37.5   mm
Corrected critical diameter DIJc of the melt 5:
D I J c = 141.9   mm
Corrected critical diameter DIJccorr of the melt 5:
D I J c o r r = 141.9 × 12.773801 × 3.034934 × 1.163477 × 1.02401 × 2.082228 × 1.029316 12.945269 × 2.963585 × 1.171322 × 1.020372 × 2.113955 × 1.023385
D I J c o r r = 141.6   mm
Factor f2:
f 2 = 141.6 112.1
f 2 = 1.26
Table 8. Calculation procedure of boron hardenability factors for the melts 7 and 8.
ASTM Grain size GS of the melt 7:
G S = 16.54 2.88 × ln ( 10.88 )
G S = 9.67
ASTM Grain size GS of the melt 8:
G S = 16.54 2.88 × ln ( 8.50 )
G S = 10.38
Ideal critical diameter DIJ of the melt 7:
D I J = 100.6   mm
Ideal critical diameter DIJ of the melt 8:
D I J = 154.1   mm
Correction factor fcorr for the melt 7:
f c o r r = 6.4217 + 3.78 × 10 3 × 810 0.2964 × 810 2
f c o r r = 194459
Correction factor fcorr for the melt 8:
f c o r r = 6.4217 + 3.78 × 10 3 × 890 0.2964 × 890 2
f c o r r = 234769
Corrected distance of semi-martensitic zone Jc for the melt 7:
J c = 20.0 × 234769 194459
J c = 24.2   mm
Corrected critical diameter DIJc of the melt 7:
D I J c = 112.7   mm
Corrected critical diameter DIJccorr of the melt 7:
D I J c o r r = 112.7 × 11.502169 × 3.157685 × 1.147922 × 1.035002 × 2.130000 × 1.044094 12.945274 · × 3.034934 × 1.147922 × 1.036230 × 1.974884 × 1.039278
D I J c o r r = 112.8 mm
Factor f2:
f 2 = 112.8 154.1
f 2 = 0.73
Table 9. Hardenability parameters of the melts 1 and 2.
No. of MeltHRC50J (mm)DIJ (mm)Jc (mm)DIJc (mm)DIJcorr (mm)DI (Calculated by the Grossmann’s Method) (mm)f2 (Basic Melt 2)
Melt 138.01.713.51.612.816.319.31.04
Melt 240.02.015.724.7
Table 10. Hardenability parameters of the melts 3 and 4.
No. of MeltHRC50J (mm)DIJ (mm)Jc (mm)DIJc (mm)DIJcorr (mm)DI (Calculated by the Brossmann’s Method) (mm)f2 (Basic Melt 4)
Melt 343.027.5122.428.2122.9104.493.20.91
Melt 441.025.0114.982.9
Table 11. Hardenability parameters of the melts 5 and 6.
No. of MeltHRC50J (mm)DIJ (mm)Jc (mm)DIJc (mm)DIJcorr (mm)DI (Calculated by the Grossmann’s Method) (mm)f2 (Basic Melt 6)
Melt 542.035.0137.137.5141.9141.694.51.26
Melt 641.023.5112.194.3
Table 12. Hardenability parameters of the melts 7 and 8.
No. of MeltHRC50J (mm)DIJ (mm)Jc (mm)DIJc (mm)DIjcorr (mm)DI (Calculated by the Grossmann’s Method) (mm)f2 (Basic Melt 8)
Melt 742.020.0100.624.2112.7112.8108.30.73
Melt 837.045.0154.1156.3
Publisher’s Note: MDPI stays neutral with regard to jurisdictional claims in published maps and institutional affiliations.

