Article

Numerical Study and Experimental Validation of Deformation of <111> FCC CuAl Single Crystal Obtained by Additive Manufacturing

by
Anton Y. Nikonov
1,2,
Andrey I. Dmitriev
1,2,*,
Dmitry V. Lychagin
1,2,
Lilia L. Lychagina
3,4,
Artem A. Bibko
1,2 and
Olga S. Novitskaya
1,2
1
Institute of Strength Physics and Material Science SB RAS, Akademicheskii Pr. 2/4, 634055 Tomsk, Russia
2
Department of Metal Physics, Department of Mineralogy and Geochemistry, Tomsk State University, Lenin Ave. 36, 634050 Tomsk, Russia
3
Department of Management, Tomsk State University of Architecture and Building, Solyanaya Sq. 2, 634003 Tomsk, Russia
4
Department of Management, Tomsk State University of Control Systems and Radioelectronics, Lenin Ave. 40, 634050 Tomsk, Russia
*
Author to whom correspondence should be addressed.
Metals 2021, 11(4), 582; https://doi.org/10.3390/met11040582
Submission received: 3 March 2021 / Revised: 27 March 2021 / Accepted: 31 March 2021 / Published: 2 April 2021

Abstract

:
The importance of taking into account directional solidification of grains formed during 3D printing is determined by a substantial influence of their crystallographic orientation on the mechanical properties of a loaded material. This issue is studied in the present study using molecular dynamics simulations. The compression of an FCC single crystal of aluminum bronze was performed along the <111> axis. A Ni single crystal, which is characterized by higher stacking fault energy (SFE) than aluminum bronze, was also considered. It was found that the first dislocations started to move earlier in the material with lower SFE, in which the slip of two Shockley partials was observed. In the case of the material with higher SFE, the slip of a full dislocation occurred via successive splitting of its segments into partial dislocations. Regardless of the SFE value, the deformation was primarily occurred by means of the formation of dislocation complexes involved stair-rod dislocations and partial dislocations on adjacent slip planes. Hardening and softening segments of the calculated stress–strain curve were shown to correspond to the periods of hindering of dislocations at dislocation pileups and dislocation movement between them. The simulation results well agree with the experimental findings.

1. Introduction

Progress in additive technologies has attracted even more attention to the role of classic substructural mechanisms of deformation and hardening of metal materials. This is concerned with the directional crystallization of grains and the formation of a so-called dendritic structure in the materials produced by additive manufacturing [1,2,3,4,5]. On one hand, large columnar grains deteriorate the mechanical properties of the materials. On the other hand, they become strongly anisotropic. Moreover, anisotropy of surface energy of metals results in the appearance of additional crystallographic peculiarities of structures formed during crystallization; in particular, it leads to the formation of primary, secondary, tertiary, and sometimes higher-order dendritic arms [6]. In view of the aforementioned aspects, it is important to take into account the effect of crystallographic orientation of grains on the behavior of materials under loading. In particular, Y. Tang et al. [7] analyzed deformation properties of individual structures composed of dendritic cores in nickel-based superalloy subjected to an industrially relevant process simulation and revealed the complex interplay between microstructural development and micromechanical behavior. To identify this pattern, they analyzed the deformation properties of individual structures formed by the cores of the dendrites. S. Nahata et al. [8] showed that cutting of a polycrystalline material subjected to ultraprecision machining (e.g., diamond turning) is substantially affected by the crystallographic orientation of grains of the machining area. Therefore, the authors analyzed crystallographic orientations of individual grains and activated slip and shear systems in order to estimate the cutting force, chip thickness, and the deformation depth of the surface layer. It should be noted that single crystals are most often considered independent objects. These studies are concerned with the investigation of the characteristic features of plastic deformation depending on the crystallographic orientation of a single crystal in relation to the loading direction [9,10,11,12].
Due to their high strength, excellent corrosion, and wear resistance, CuAl alloys have advantageous over other structural materials. Progress in powder 3D printing and the development of new technologies of wire-feed additive manufacturing [1,13,14] stimulate growing interest in this material. Moreover, the shape memory effect and thermomechanically induced structural transformations in CuAl based compounds make them new objects for the elaboration of a new class of adaptive structural materials [1,14].
CuAl alloys belong to FCC crystals. The earlier experiments performed with FCC single crystals showed that their form change depends on the orientation of the loading axis and the orientation of the lateral surface of the crystal [15]. In the case of deformation of several grains, their joint deformation and the influence of the free surface on deformation and hardening are possible. Crystallographic and geometrical factors are also important to consider. The main growth direction in FCC materials is the cubic direction. However, other crystallographic directions should be also considered to fully understand deformation processes. The <111> direction with reference to the axis of loading is of interest in view of the availability of six equiloaded shear systems with a high Schmid factor and high possibility of shear activation on adjacent slip planes. Deformation of FCC single crystals with this orientation can be considered in detail using computer simulation, in particular, with molecular dynamics (MD) simulation [16,17,18].
Computer simulation is one of the most effective methods to study the deformation behavior of a loaded material because it allows one to construct idealized models and separately study the role of each factor influencing the development of deformation relief. Recently, this method has been effectively used to solve a wide variety of tasks at the atomic level concerned with single crystals. These studies were most often related to the study of the evolution of plastic deformation in crystals subjected to torsion [19], tension–compression [20,21,22,23,24,25,26], different surface impacts such as nanoindentation [27], scratching [12,28,29,30], cutting [31,32,33], burnishing [34], etc. A. Dmitriev et al. [35] performed simulation of uniaxial compression of FCC metal single crystals along the <001> direction and showed that the evolution of deformation relief and dislocation structure in these crystals is determined by their energetic characteristics, in particular, by the stacking fault energy (SFE). Lower SFE decreases the contribution of cross slip and increases the contribution of twinning to the plastic deformation of FCC materials. This is accompanied by changes in their deformation behavior. Therefore, simulation of deformation behavior of materials with different SFEs provides a deeper insight into its mechanisms and characteristic features of dislocation interaction.
In view of the foregoing, the aim of the present study was to perform molecular dynamics simulation of uniaxial compression of FCC single crystals with high and low SFEs (Ni and CuAl) along the <111> direction and investigate the effect of SFE on the movement and hindering of dislocations.

2. Model and Experimental Conditions

Ni and aluminum bronze (Cu-13at.%Al) FCC single crystals with the <111> compression axis were studied. Under uniaxial loading, this orientation is characterized by deformation on six equiloaded slip systems (three planes with two directions in each plane). An aluminum bronze sample was grown on an AISI 321 steel substrate from a Cu-7.5wt.%Al wire using an electron beam wire-feed machine designed and built at the Institute of Strength Physics and Material Science of Siberian Branch of Russian Academy of Sciences (ISPMS SB RAS) [1]. Single crystals with a required crystallographic orientation were cut from the ingots. Compression tests of 3 mm × 3 mm × 6 mm ± 0.1 mm samples have been carried out using Instron ElectroPuls E10000 machine (Instron, UK) operated at a strain rate of 3 × 10⁻⁴ s−1 at ambient temperatures. The crystallographic orientation of the slip planes relative to the compression axis and lateral surfaces is shown in Figure 1b. A Ni single crystal was chosen because of its higher SFE value, compared with that of aluminum bronze. SFE values were preliminary calculated for both the materials by simulation of the crystals containing an intrinsic stacking fault. The calculated values are listed in Table 1 and compared with the experimentally determined values [36].
All MD calculations were implemented using the large-scale atomic/molecular massively parallel simulator (LAMMPS) molecular dynamics code [37]. The interaction between atoms of the single crystals was described by a multiparticle potential constructed using the embedded atom method (EAM) [38,39]. In the EAM formulation, the total energy E of a system of atoms is given by
E i =   F α   ( j i ρ β ( r i j ) ) + 1 2 j i   ϕ α β ( r i j ) ,
where F is the embedding energy, which is a function of the atomic electron density ρ, and ϕ is a pair potential interaction. The pair interaction is summed over all neighbors j of atom i within the cutoff distance. The multi-body nature of the EAM potential is a result of the embedding energy term. The initial configuration of the simulated sample is shown in Figure 1a. The model single crystal has the form of a parallelepiped with dimensions 30a × 60a × 30a along X, Y, and Z axes, where a is the lattice constant of the material. Loading was carried out by the movement of two atomic layers with a thickness of 3a and a length of 60a located above and under the sample in the X0Z planes with a constant speed of 2.5 m/s. Deformation was determined as dl/l0 * 100%, where l0 is the initial sample height, dl is the total distance traveled by the two loaded atomic layers.
The system was considered as an NVE ensemble that maintains the number of atoms N, the occupied volume V and the energy of the system E. The initial temperature of 300 K of the simulation was achieved by using the velocity rescaling method during the MD simulation process from the balance between kinetic and thermal energies. The equations of motion were integrated on the basis of the velocity–Verlet algorithm. The common neighbor analysis (CNA) and dislocation extraction algorithm (DXA), implemented in the open visualization tool OVITO [40], were used to visualize and analyze crystal structure. CNA [41] was adopted to identify the structural allocation of each atom and determine the type of crystal lattice (BCC, FCC, HCP). DXA [42] transformed the original atomistic representation of a dislocated crystal into a line-based representation of the dislocation network and determined the corresponding Burgers vectors. Calculations were performed in the ISPMS SB RAS computing cluster, while the duration of the calculation for each task was about 1700 CPU * h.

3. Results of Simulation and Comparison with Experiment

3.1. Beginning of Plastic Deformation

The investigations revealed that the beginning of the formation of dislocation structure is determined by the energetic characteristics of the material. The movement of the first dislocation in the CuAl single crystal was observed at a strain of 2.2%, while in the nickel sample, the first dislocation appeared at a strain of 7.3%. The nucleation of dislocations on one of the three equiloaded planes was caused by fluctuations in the temperature–force field, which were introduced in the simulation algorithm. This strain will be further considered corresponding to the transition from elastic to plastic deformation. In the CuAl sample, shears on second and third planes started to propagate almost immediately, with delays of roughly 7 and 10 ps, respectively. In the crystallographic pattern depicted in Figure 1b, the first, second, and third planes correspond to the ( 1 ¯ 1 1 ¯ ), ( 1 ¯ 1 ¯ 1 ) , and (111) planes, respectively. In the Ni single crystal, shears started to propagate on the (111) and ( 1 ¯ 1 ¯ 1 ) planes with a difference of 2 ps. This difference could not be registered under in situ experiments, and it should be considered that the shears start simultaneously. Therefore, it can be supposed that the slip starts nearly simultaneously on several equiloaded systems.
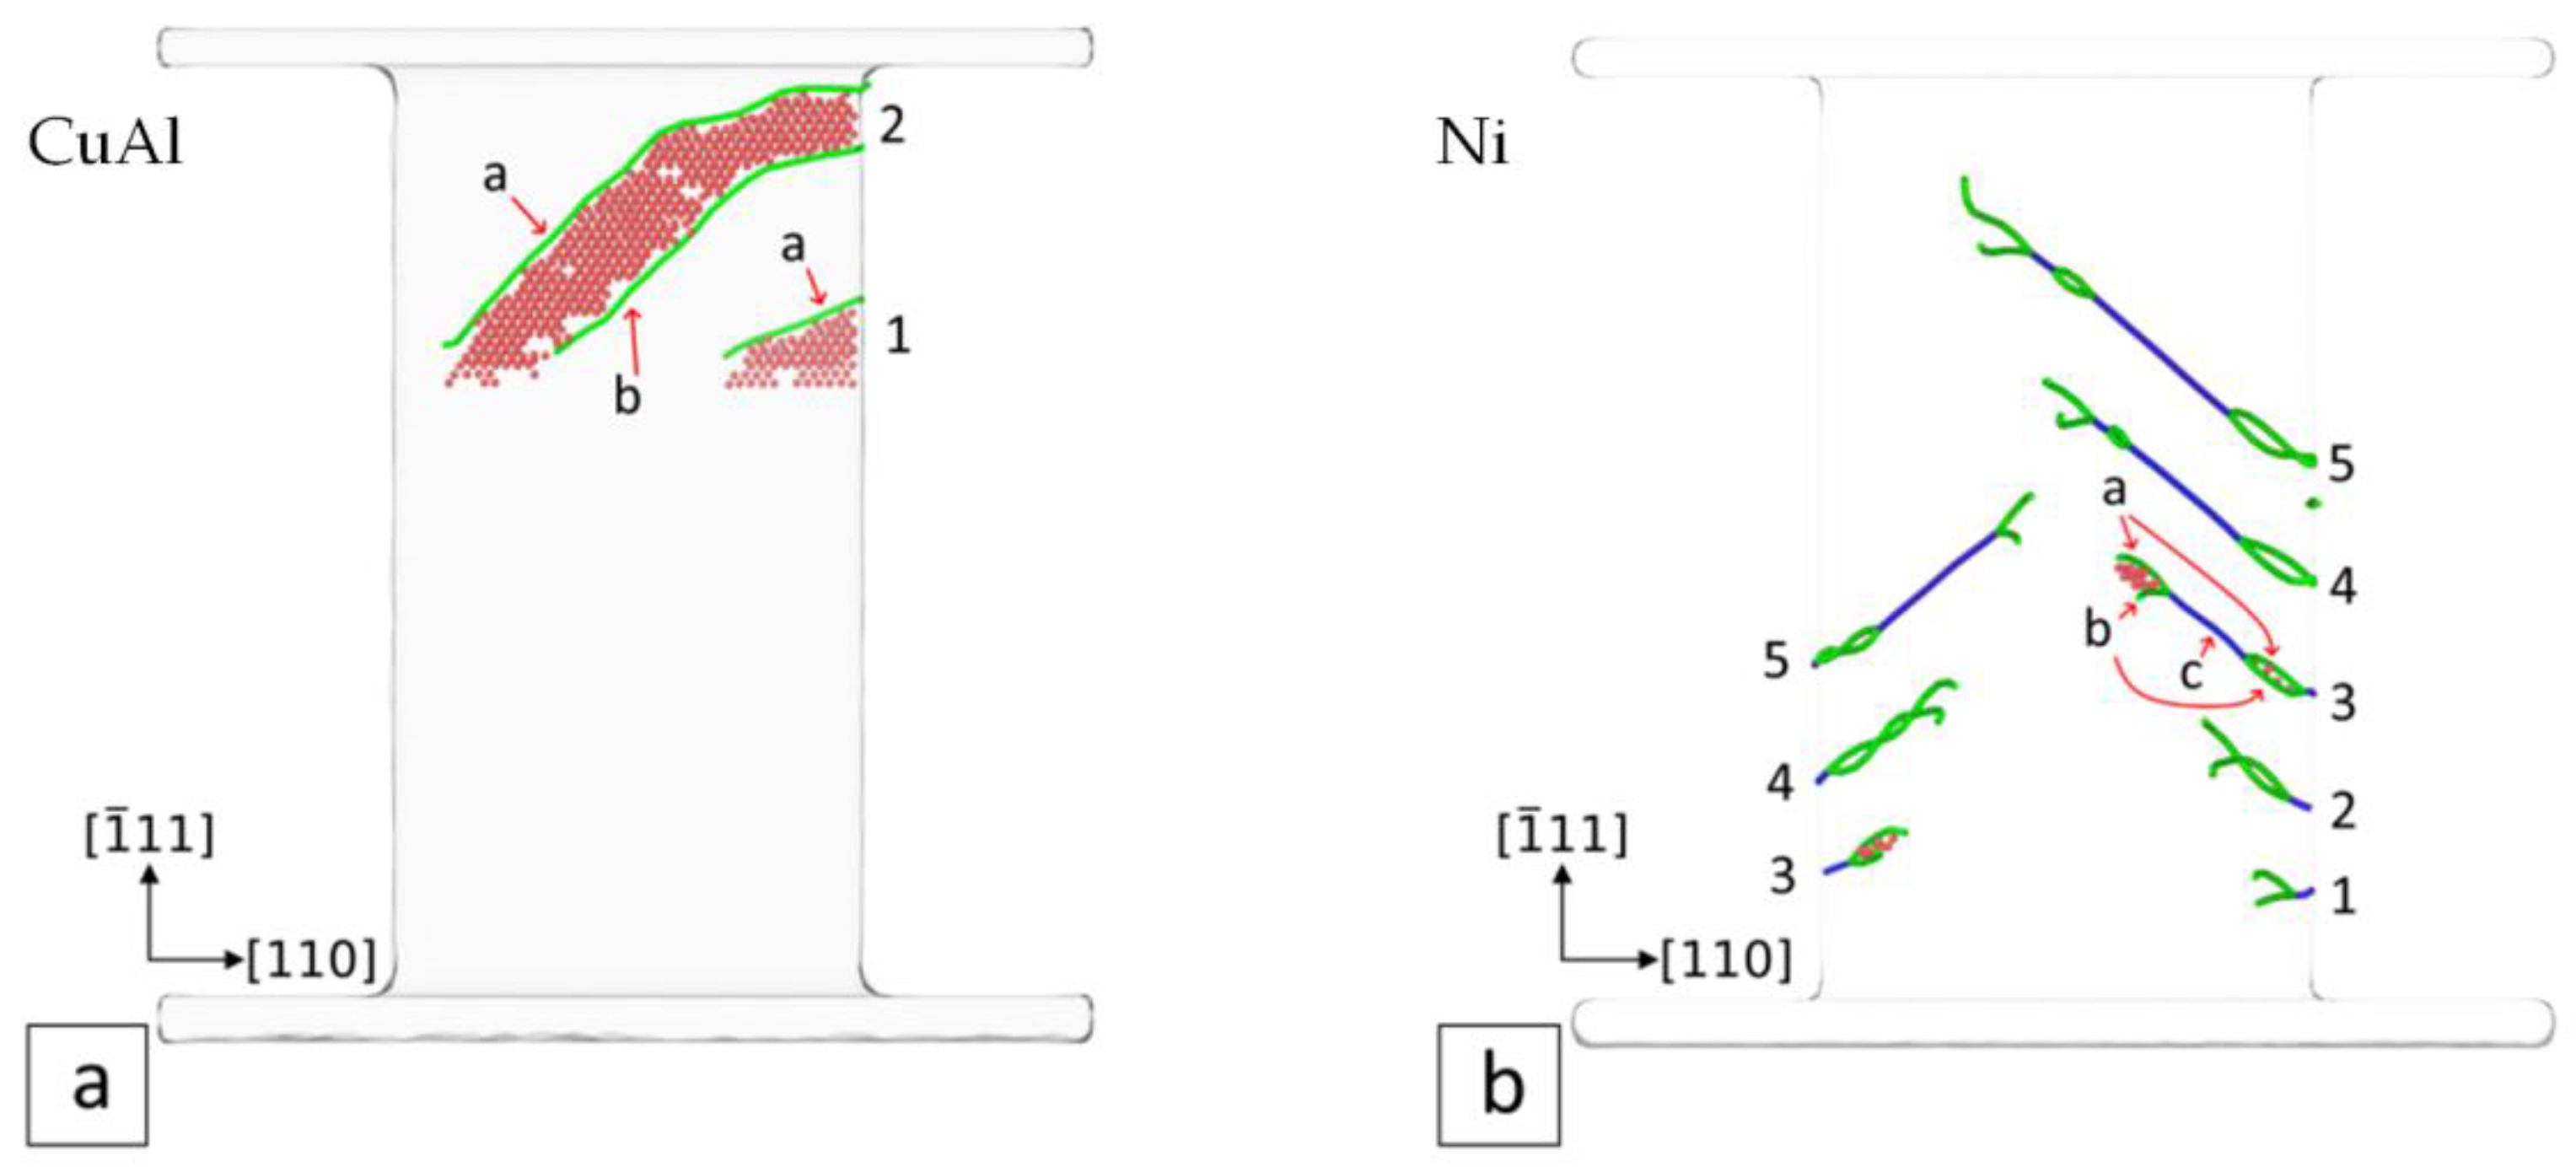
Let us consider the dislocation movement in an FCC crystal in detail. the CuAl sample is characterized by the formation of stacking faults with large spacing between a 6 112 Shockley partial dislocations. Figure 2a exhibits the sequence of dislocation movement on the ( 1 ¯ 1 1 ¯ ) plane. The slip consists of the successive formation of two Shockley partial dislocations (shown in green in Figure 2 and thereafter). The leading partial dislocation exhibits a predominant screw component, while the second dislocation features an edge component. An intrinsic stacking fault is formed between the split dislocations. Atoms located on the plane of the stacking fault are shown as red circles in Figure 2.
At high SFE values, the surface tension of the stacking fault tends to approach the partial dislocations. Figure 1b shows the movement of dislocations on two adjacent planes (111) and ( 1 ¯ 1 ¯ 1 ) of the Ni sample at different strains. In this case, the slip consists of the splitting of the perfect a 2 110 dislocation (shown in blue in Figure 2b and thereafter) into the a 6 112 Shockley partial dislocations, followed by their merging into the perfect dislocation. The dislocation reaction on the (111) slip plane can be written as follows:
a 2 [ 1 ¯ 01 ] a 6 [ 1 ¯ 1 ¯ 2 ] + a 6 [ 2 ¯ 11 ] a 2 [ 1 ¯ 01 ] .
The splitting of the perfect dislocation does not immediately occur along its entire length but takes place via successive splitting of its segments. As in the case of the CuAl crystal, the leading partial dislocation in each splitting perfect dislocation has a predominant screw component, and the second partial dislocation features an edge component. When the dislocation becomes longer, the number of its splitting segments increases. The intersections of the partial dislocations apparently serve as the sites of their merging into the perfect dislocation. A similar mechanism of slip evolution is observed for the dislocation moving on the second slip plane. Thus, the simulation results revealed the movement mechanism of a perfect dislocation via its splitting into partial dislocations. It should be noted that the width of the splitting area increases with the SFE of the material.

3.2. Deformation Relief

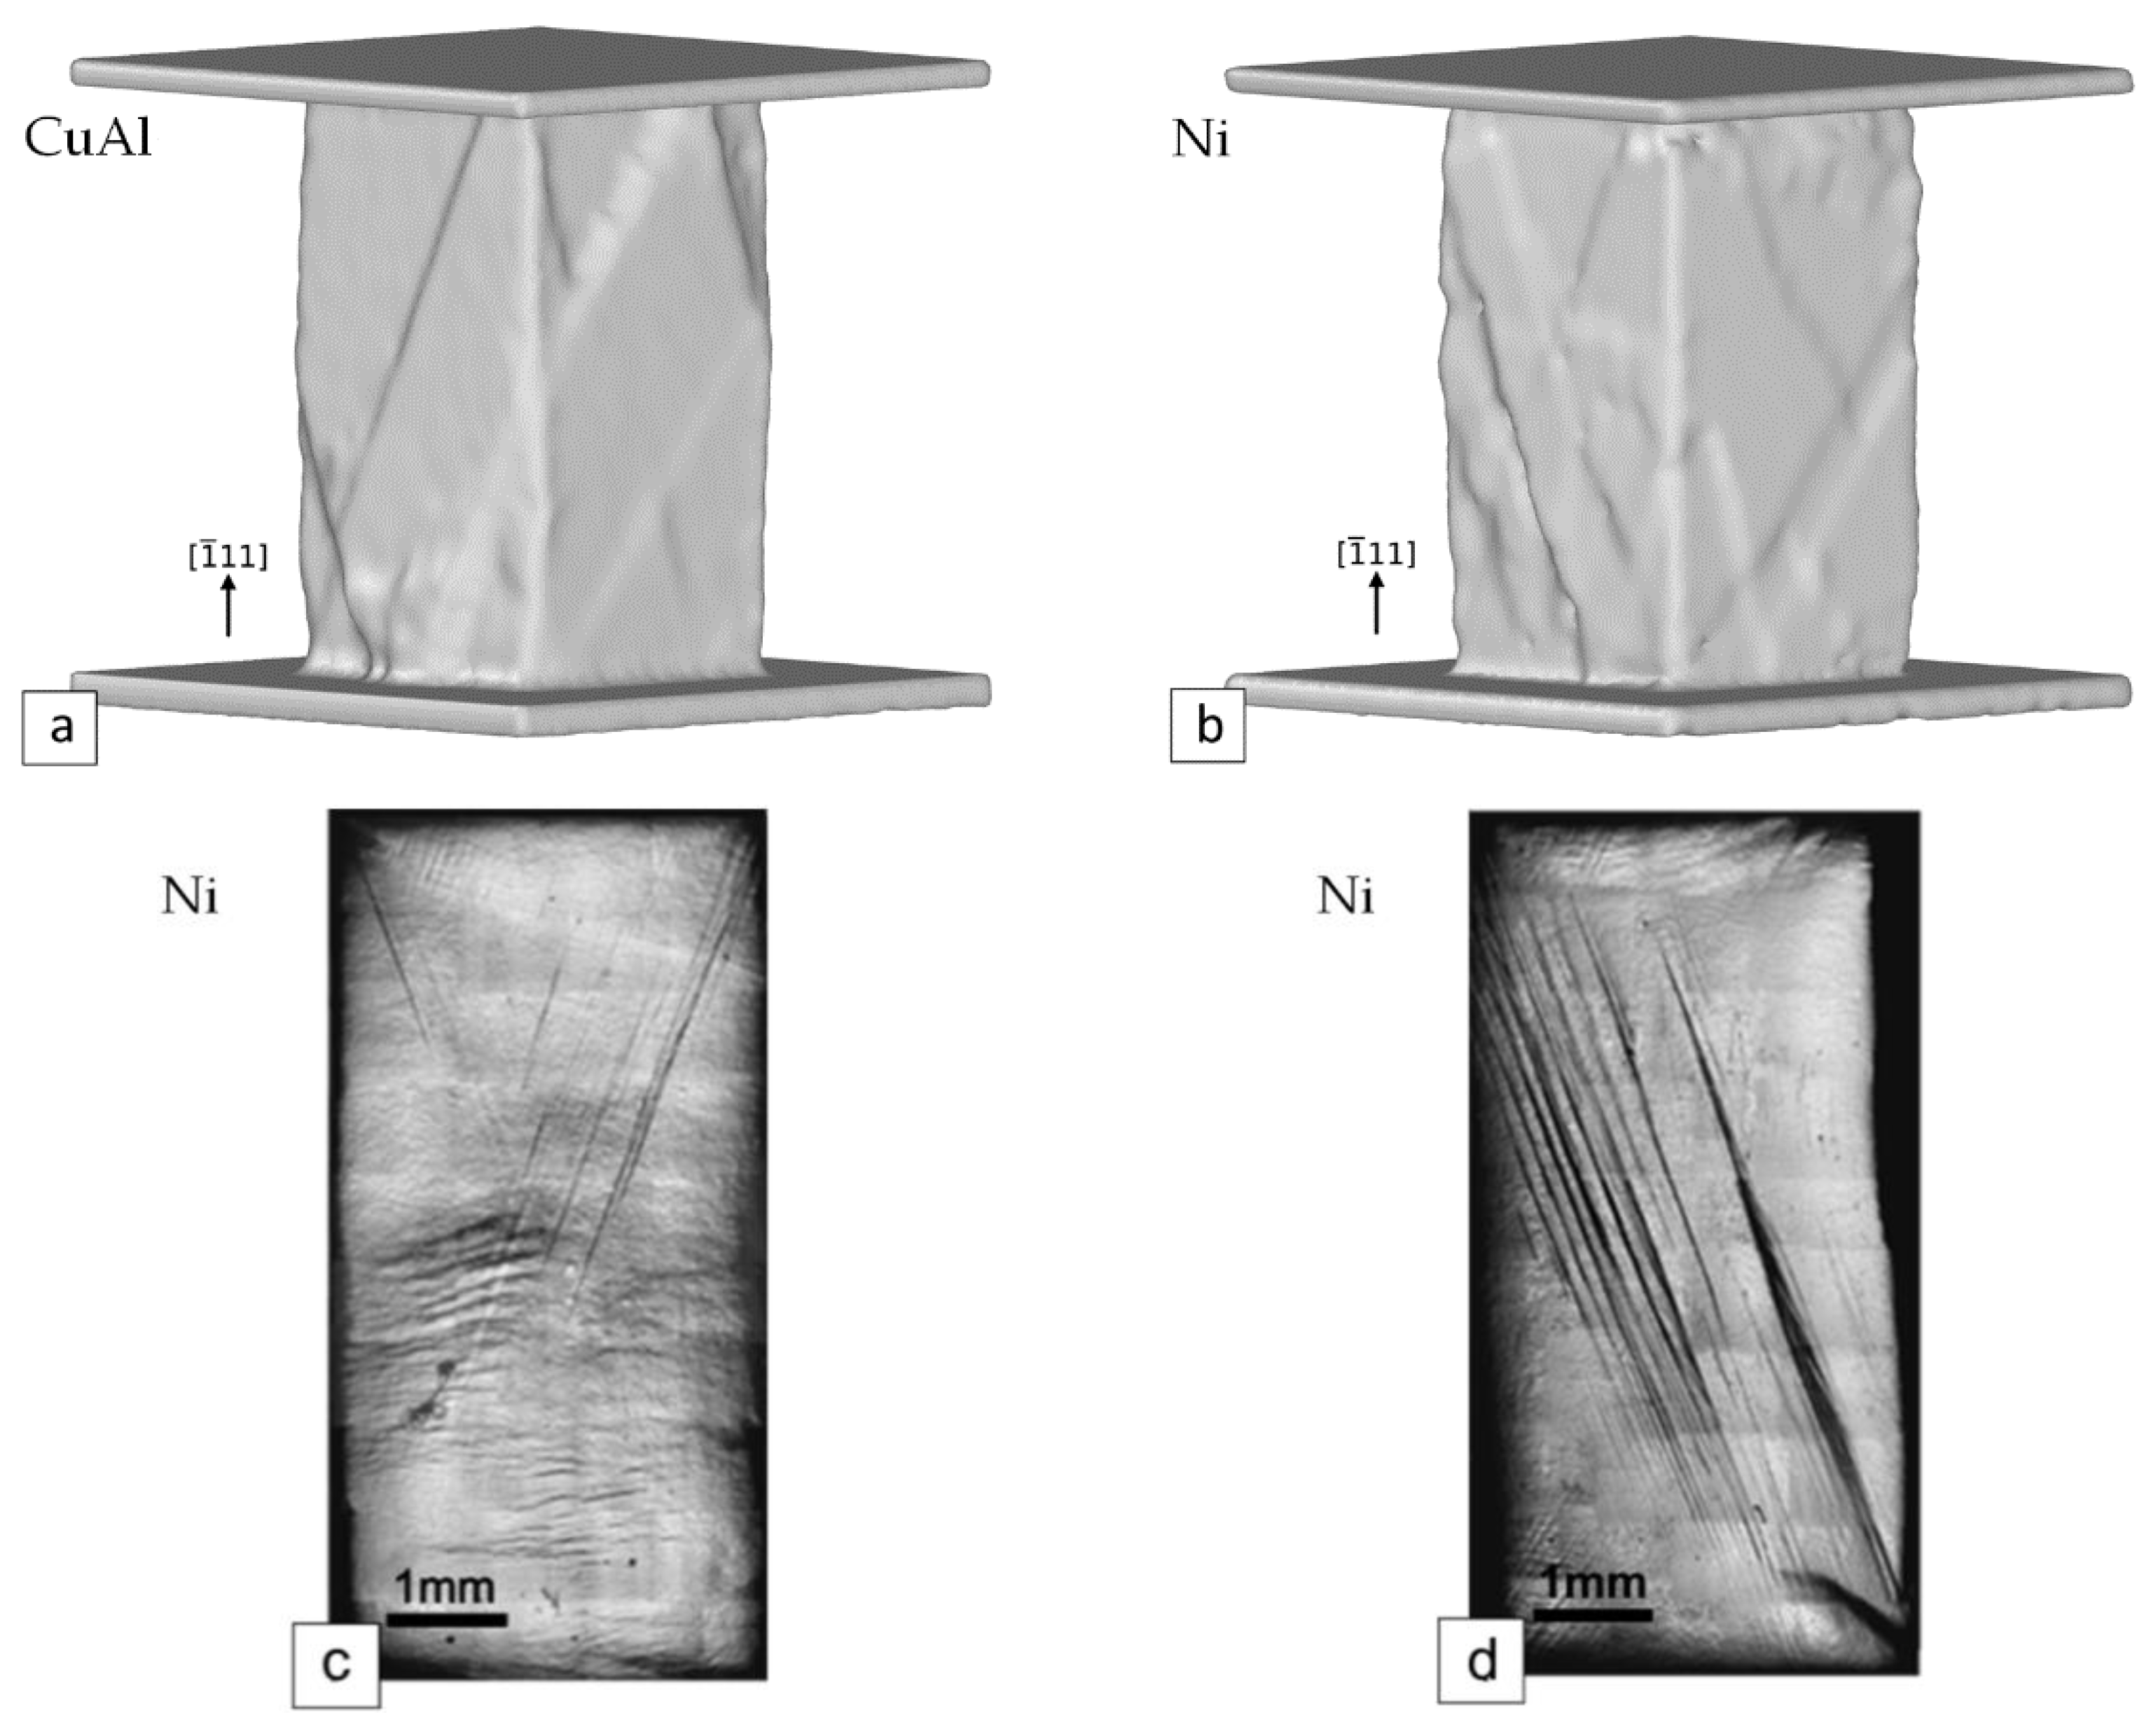
The dislocation movement is accompanied by the appearance of slip traces on the lateral surfaces of the single crystals. In the case of intensive shear propagation on a slip plane, the slip traces are visible on more than one lateral surface. This provides unambiguous identification of the activated slip plane by analyzing the deformation surface topography taking into account the geometry of the slip traces and crystallographic orientation of close-packed planes in a crystal (Figure 1b). Shears on (111) and ( 1 ¯ 1 ¯ 1 ) planes result in the appearance of inclined slip traces on ( 1 1 ¯ 2 ) and (110) surfaces. Shears on the ( 1 ¯ 0 1 ¯ )   plane leads to a system of inclined slip traces on the (110) surface and horizontal slip traces on the ( 1 1 ¯ 2 ) surface, with the inclined slip traces on the ( 1 1 ¯ 2 ) surface oriented symmetrically relative to the vertical plane. Figure 3 exhibits the simulated surface topography of the samples. In view of the individual features of every single crystal, good agreement is observed between the simulation results and the experimentally observed surface relief (Figure 3c,d). Some differences in the details of the surface topography for the Ni sample can be caused by the difference in homologous temperatures of deformation and the sequence of activation of the equiloaded slip planes. Earlier, we had performed similar analysis for FCC single crystals with the <001> compression axis, {100} and {110} lateral surfaces, and different height-to-width ratios [35]. In all the cases, the simulation results well agreed with the experiment.
Deformation surface topography manifests a characteristic feature of deformation in individual volumes of a single crystal. First of all, the most active shear systems were identified by analysis of slip traces. The activity of the systems depends on the stress tensor and shear conditions in the single crystal. Non-uniformity of the stress–strain state under compression is concerned with the action of the friction force between the sample and the punches of the testing machine, and with the influence of free lateral surfaces toward which the material shifts on decreasing the sample height. This leads to the decomposition of the single crystal volume into deformation domains. The difference in deformation of the domains determines the deformation non-uniformity of the sample [15,43,44,45].

3.3. Evolution of Dislocation Structure

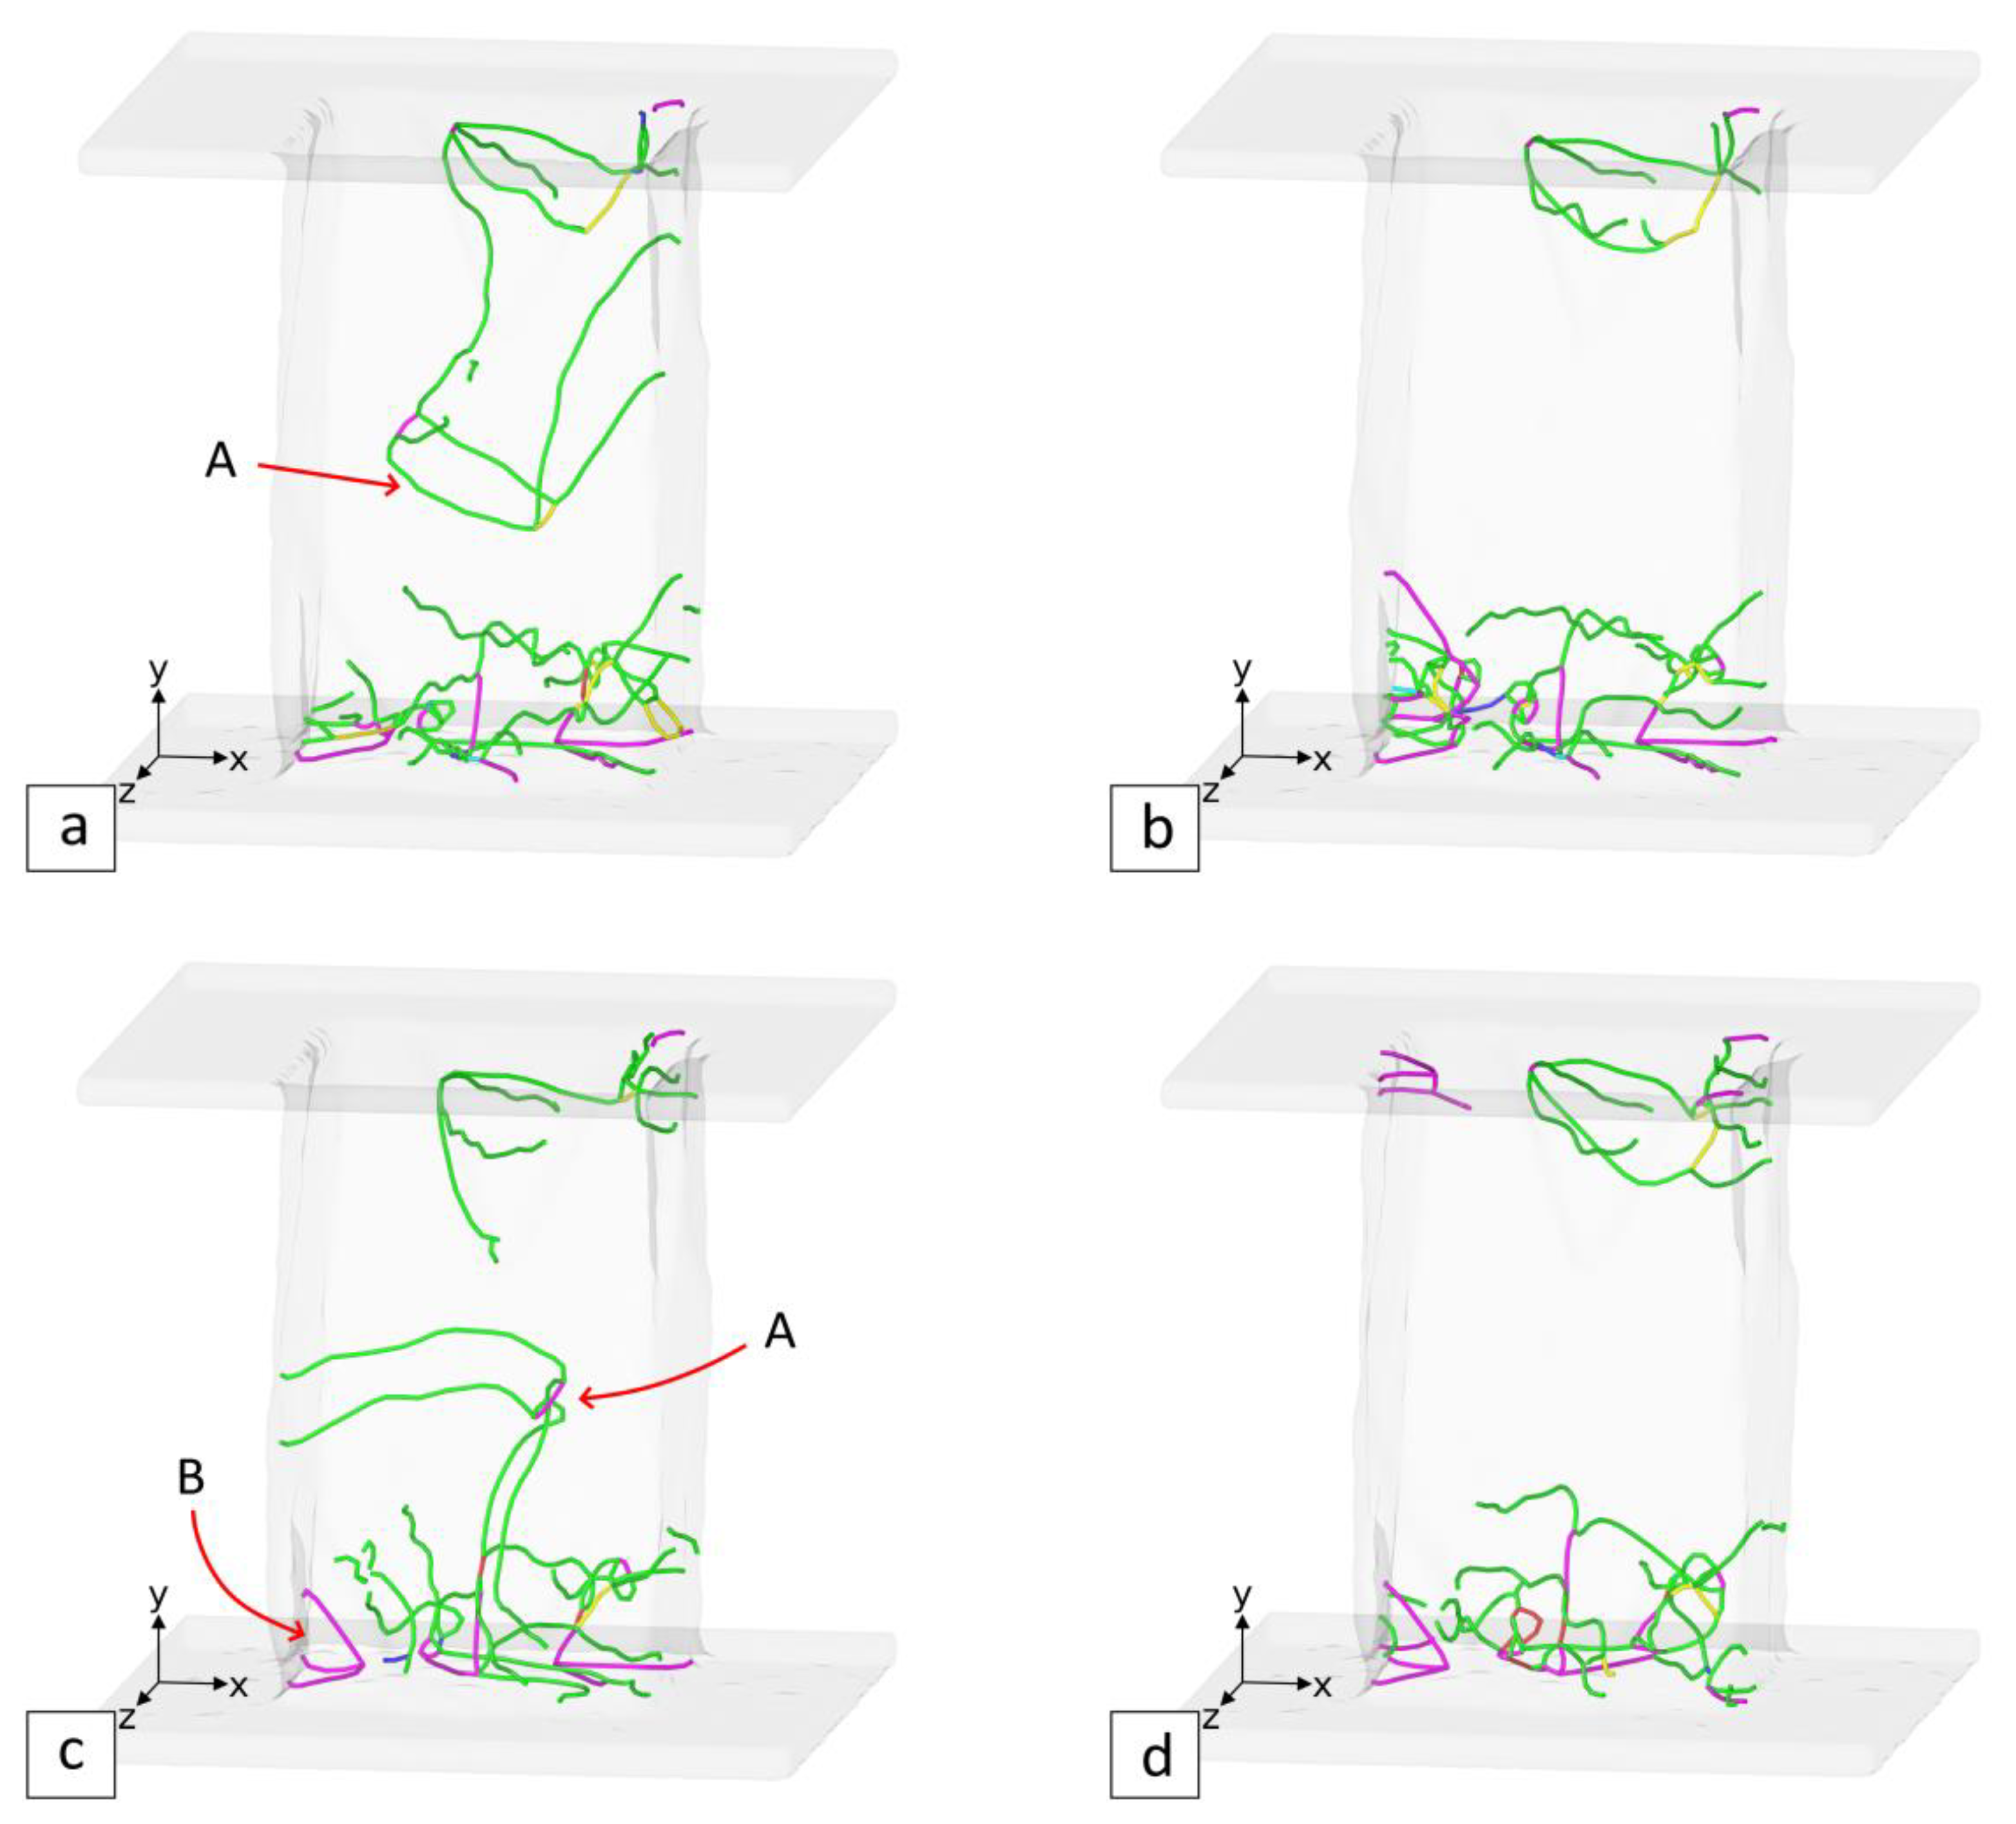
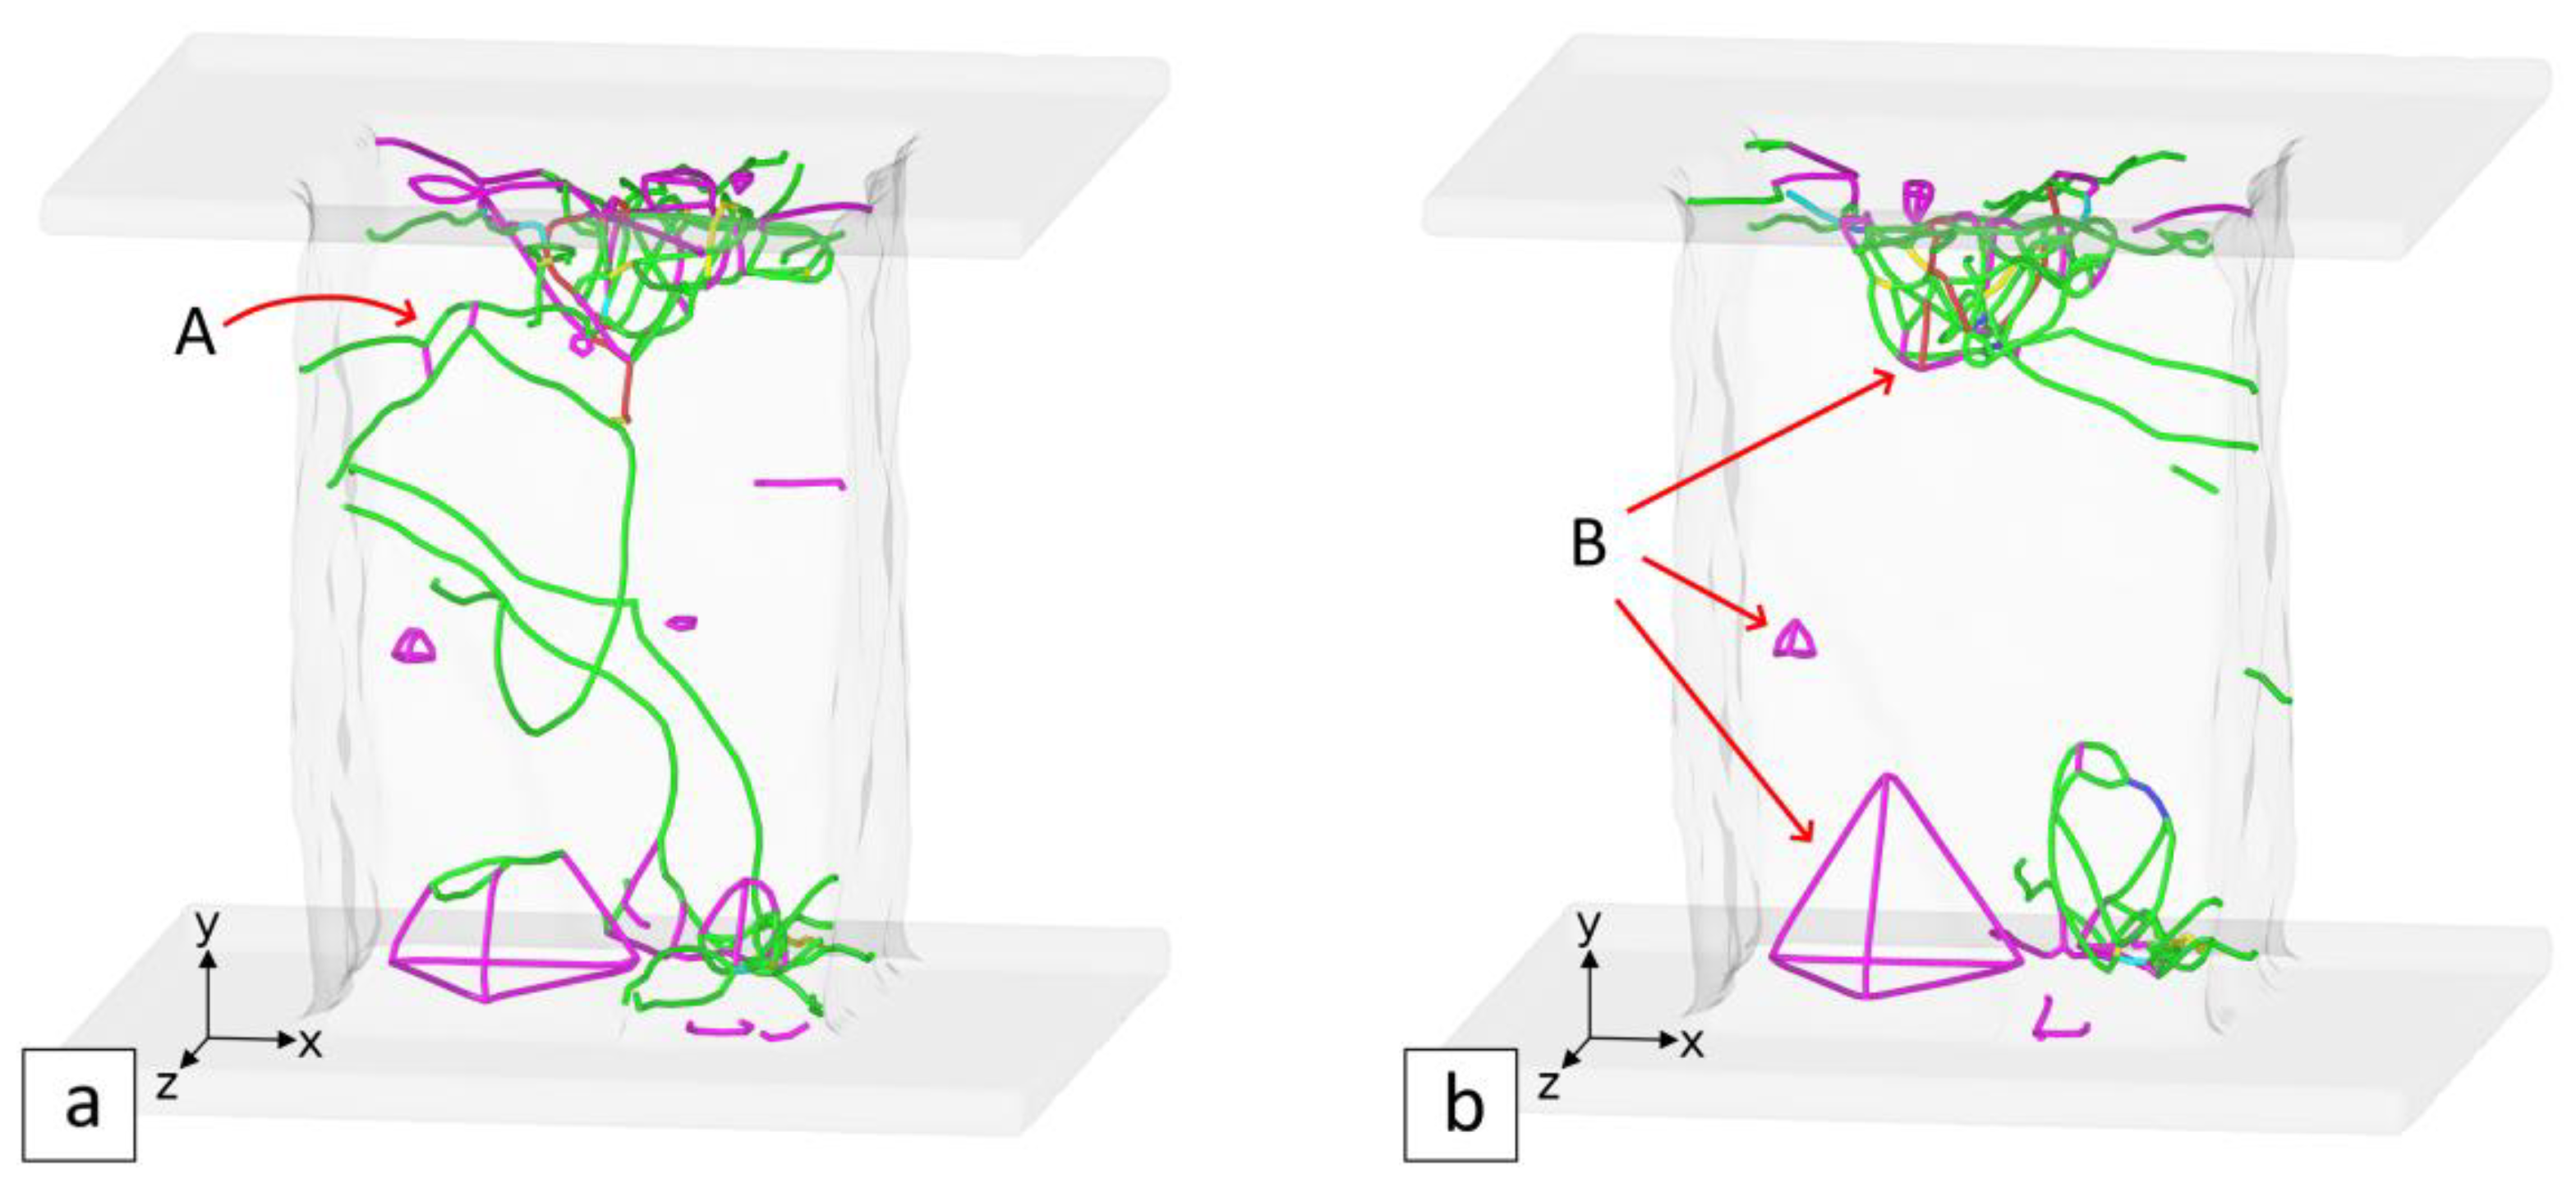
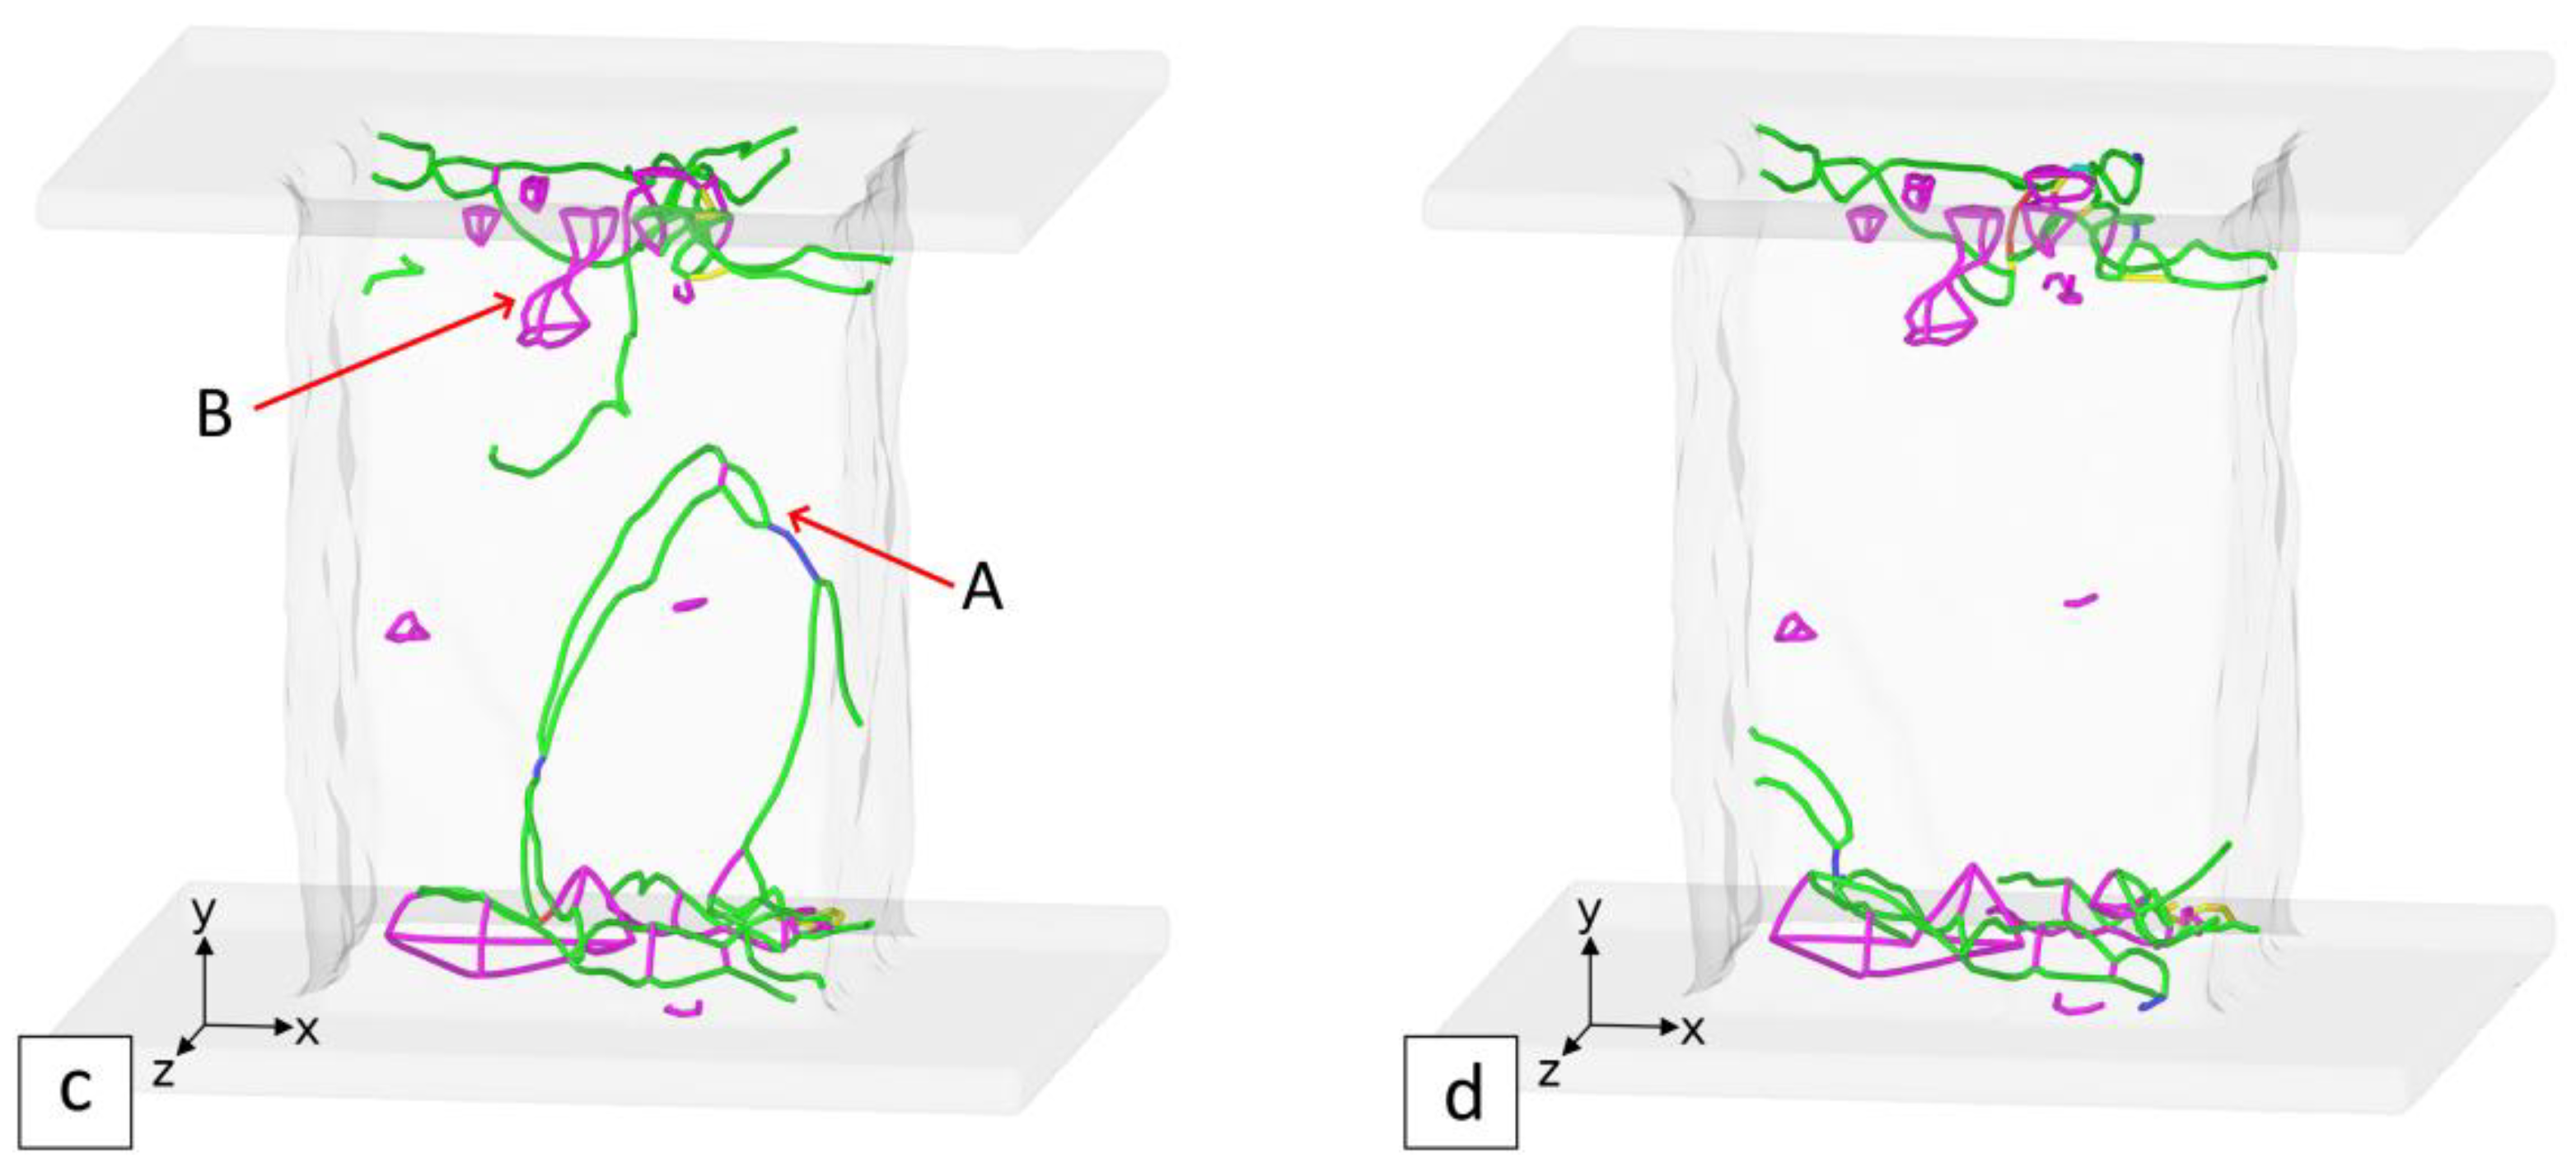
Deformation of the single crystals is accompanied by the evolution of their dislocation structure. Figure 4 depicts the model CuAl sample with semitransparent edges providing visibility of the dislocation structure at different strains. Similar snapshots for the Ni single crystal are displayed in Figure 5. It is observed that in both materials, the free movement of dislocations ends with their hindering in the top-loaded layer. The following evolution of the internal structure of the materials is determined by the movement of partial dislocations and the formation of stacking faults on the three equiloaded slip planes. Along with the perfect and partial dislocations, which are mainly responsible for the deformation of the crystals, other types of dislocations can be observed (see Figure 4 and Figure 5). There are a 6 110 stair-rod dislocations (shown magenta), a 3 001 Hirth dislocations (shown yellow), a 3 111 Frank partial dislocations (shown cyan), and some other dislocations (shown red), such as a 3 110 , a 3 112 , a 6 013 , a 6 114 , etc.
Numerical simulation makes it possible to consider the role of each type of dislocations in plastic deformation and hardening of the crystals with the determination of their fraction and locations during the deformation process. The fraction of dislocations of a certain type was determined as the ratio of the total length of these dislocations to the total length of all dislocations. In the case of the CuAl single crystal subjected to the strain 8.7%, the largest fraction (75.4%) belongs to a 6 112 Shockley partial dislocations. The fraction of a 2 110 perfect dislocations is only 1.2%. Transmission electron microscopy (TEM) studies of FCC materials usually do not reveal any significant number of partial dislocations. It can be supposed that partial dislocations either merge into perfect dislocations or come to the surface of a crystal after its unloading. The largest fraction of other dislocations belongs to a 6 110 stair-rod dislocations (18.1%). The fractions of Hirth and Frank dislocations are 1.5% and 0.4%, respectively. Other dislocation types make up 3.4% of the total dislocation length. In the Ni single crystal, the contributions of different types of dislocations are as follows: a 6 112 —74.5%, a 2 110 —2%, a 6 110 —17.4%, a 3 001 —4%, a 3 111 —0.9%, other—1.2%. Thus, it is evident that the SFE value is not a decisive factor, which determines the fractions of different types of dislocations.
The MD simulation revealed that the considered types of dislocations provide different contributions to the deformation and hardening of crystals. The most stable and widespread are a 6 110 stair-rod dislocations. Their total length is several times longer, compared with other types of dislocations. Hirth dislocations, Frank dislocations, and other types of dislocations are less stable. The stability of the observed dislocations corresponds to their energy distribution according to the b2 criterion [46,47,48].
In addition, the analysis of the dislocation structure in the simulated samples showed that along with considering single dislocations, it is important to study dislocation complexes. These complexes form different configurations of dislocations of the above-mentioned types. The dislocation complexes also participate in deformation along with partial and perfect dislocations (denoted as A in Figure 4 and Figure 5). The dislocation complexes can be distinguished by type, number, and location of the constituent dislocations. This determines their complexity and mobility under deformation. Therefore, dislocations and dislocation complexes can be divided into three groups—mobile, low-mobile, and stable. The latter complexes are represented by bundles and tetrahedrons formed of a 6 110 stair-rod dislocations (denoted as B in Figure 4 and Figure 5). These complexes are dislocation pileups.
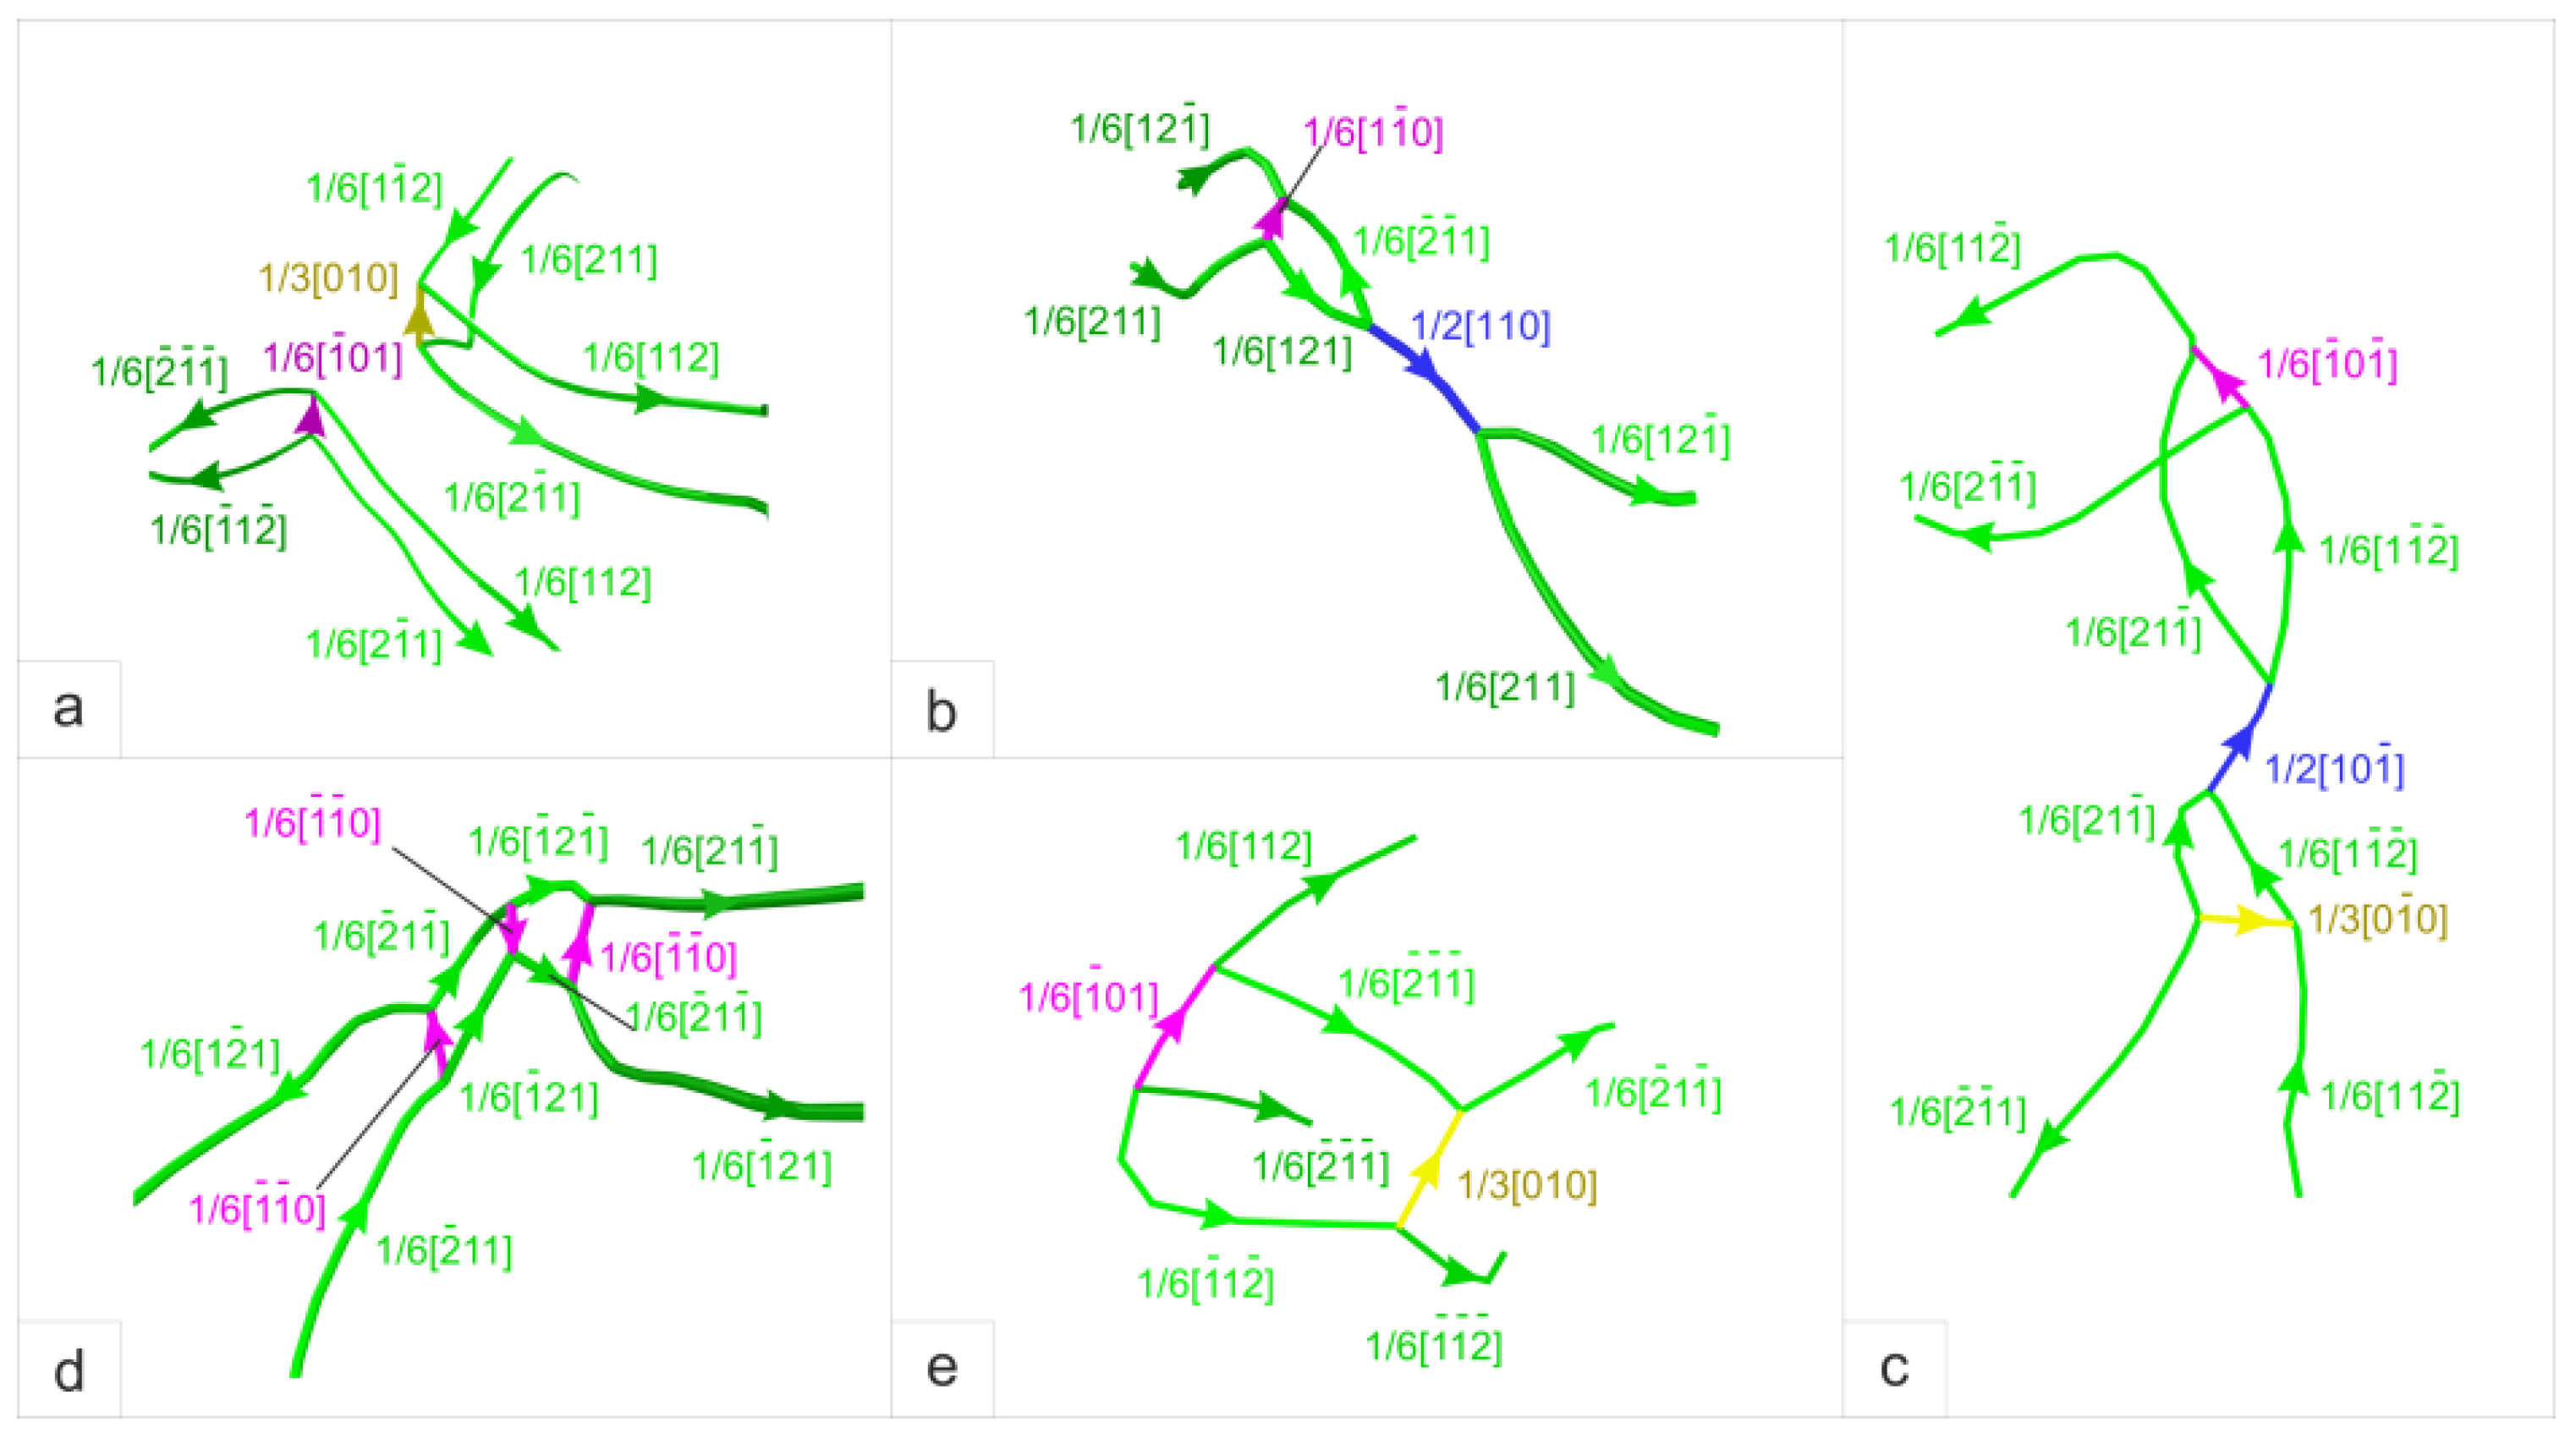
The most frequently observed dislocation complexes, which can be attributed to low-mobile, are shown in Figure 6. The structure of different types of dislocation complexes will be detailed in the sections below.

3.3.1. The Structure of Low-Mobility Dislocation Complexes

Figure 6 exhibits dislocation complexes in the order of complication of dislocation configurations. The simplest dislocation complexes are shown in Figure 6a. a 6 110 stair-rod dislocation is in the middle part of one complex and a 3 001 Hirth dislocation in the other. These dislocations have the lowest energy. Their connection with Shockley partial dislocations corresponds to the Thompson scheme [48,49]. The <111> orientation of the loading axis favors dislocation gliding on the six equiloaded planes directed along the edges of the Thompson tetrahedron. Therefore, there is a possibility of interaction of partial dislocations on adjacent slip planes, when splitting a perfect dislocation into partials. The interaction of partial dislocations on the ( 11 ¯ 1 ) and ( 1 11 ¯ ) planes results in the formation of a 6 [ 1 ¯ 01 ] and a 3 [ 010 ] stair-rod dislocations. The most likely is a 6 110 stair-rod dislocation, whereas a 3 001 Hirth dislocation is less likely. The Burgers vector of the a 6 110 stair-rod dislocation is perpendicular to the dislocation line and to the applied axial load. The dislocation is pure edge and has low energy. Although it is a sessile dislocation, it was found that it can move with increasing strain. A similar situation is observed in the case of the complex consisting of a Hirth dislocation and partial dislocations. The movement of a stair-rod dislocation with the formation of a perfect dislocation, which is more frequent in materials with high SFE, is shown in Figure 6b.   a 6 [ 21 ¯ 1 ] and a 6 [ 121 ] partial dislocations moving on the same ( 1 ¯ 1 1 ¯ ) plane and bounding a 6 [ 1 1 ¯ 0 ] stair-rod dislocation can interact resulting in the formation of a perfect dislocation. Figure 5c depicts the movement of such a complex (denoted as A in Figure 5) between two dislocation pileups. The following splitting is observed on the adjacent ( 1 1 ¯ 1 ¯ ) plane. The movement of the perfect dislocation occurs according to the kinematic scheme (Figure 2b). In the case of the material with a low SFE value, the Shockley partial dislocations are at a longer distance from one another and do not form a perfect dislocation. Therefore, the slip is happened on one plane according to the mechanism shown in Figure 2a. Moreover, a 3 001 Hirth dislocation (Figure 6c,e) or a 6 110 stair-rod dislocation (Figure 6d,e) can be the result of the interaction with partial dislocations moving on the adjacent plane. The type of stair-rod dislocation depends on the slip directions of partial dislocations on the adjacent plane.
The denoted dislocation complexes were attributed to low mobile because the investigations showed that they can decompose or move after some time of being in a stable position. Disappearing of a 6 110 and a 3 001 dislocations, followed by their repeat formation in the same dislocation complex, indicate the possibility of their splitting into partial dislocations.

3.3.2. Stable Dislocation Configuration—Stacking Fault Tetrahedron

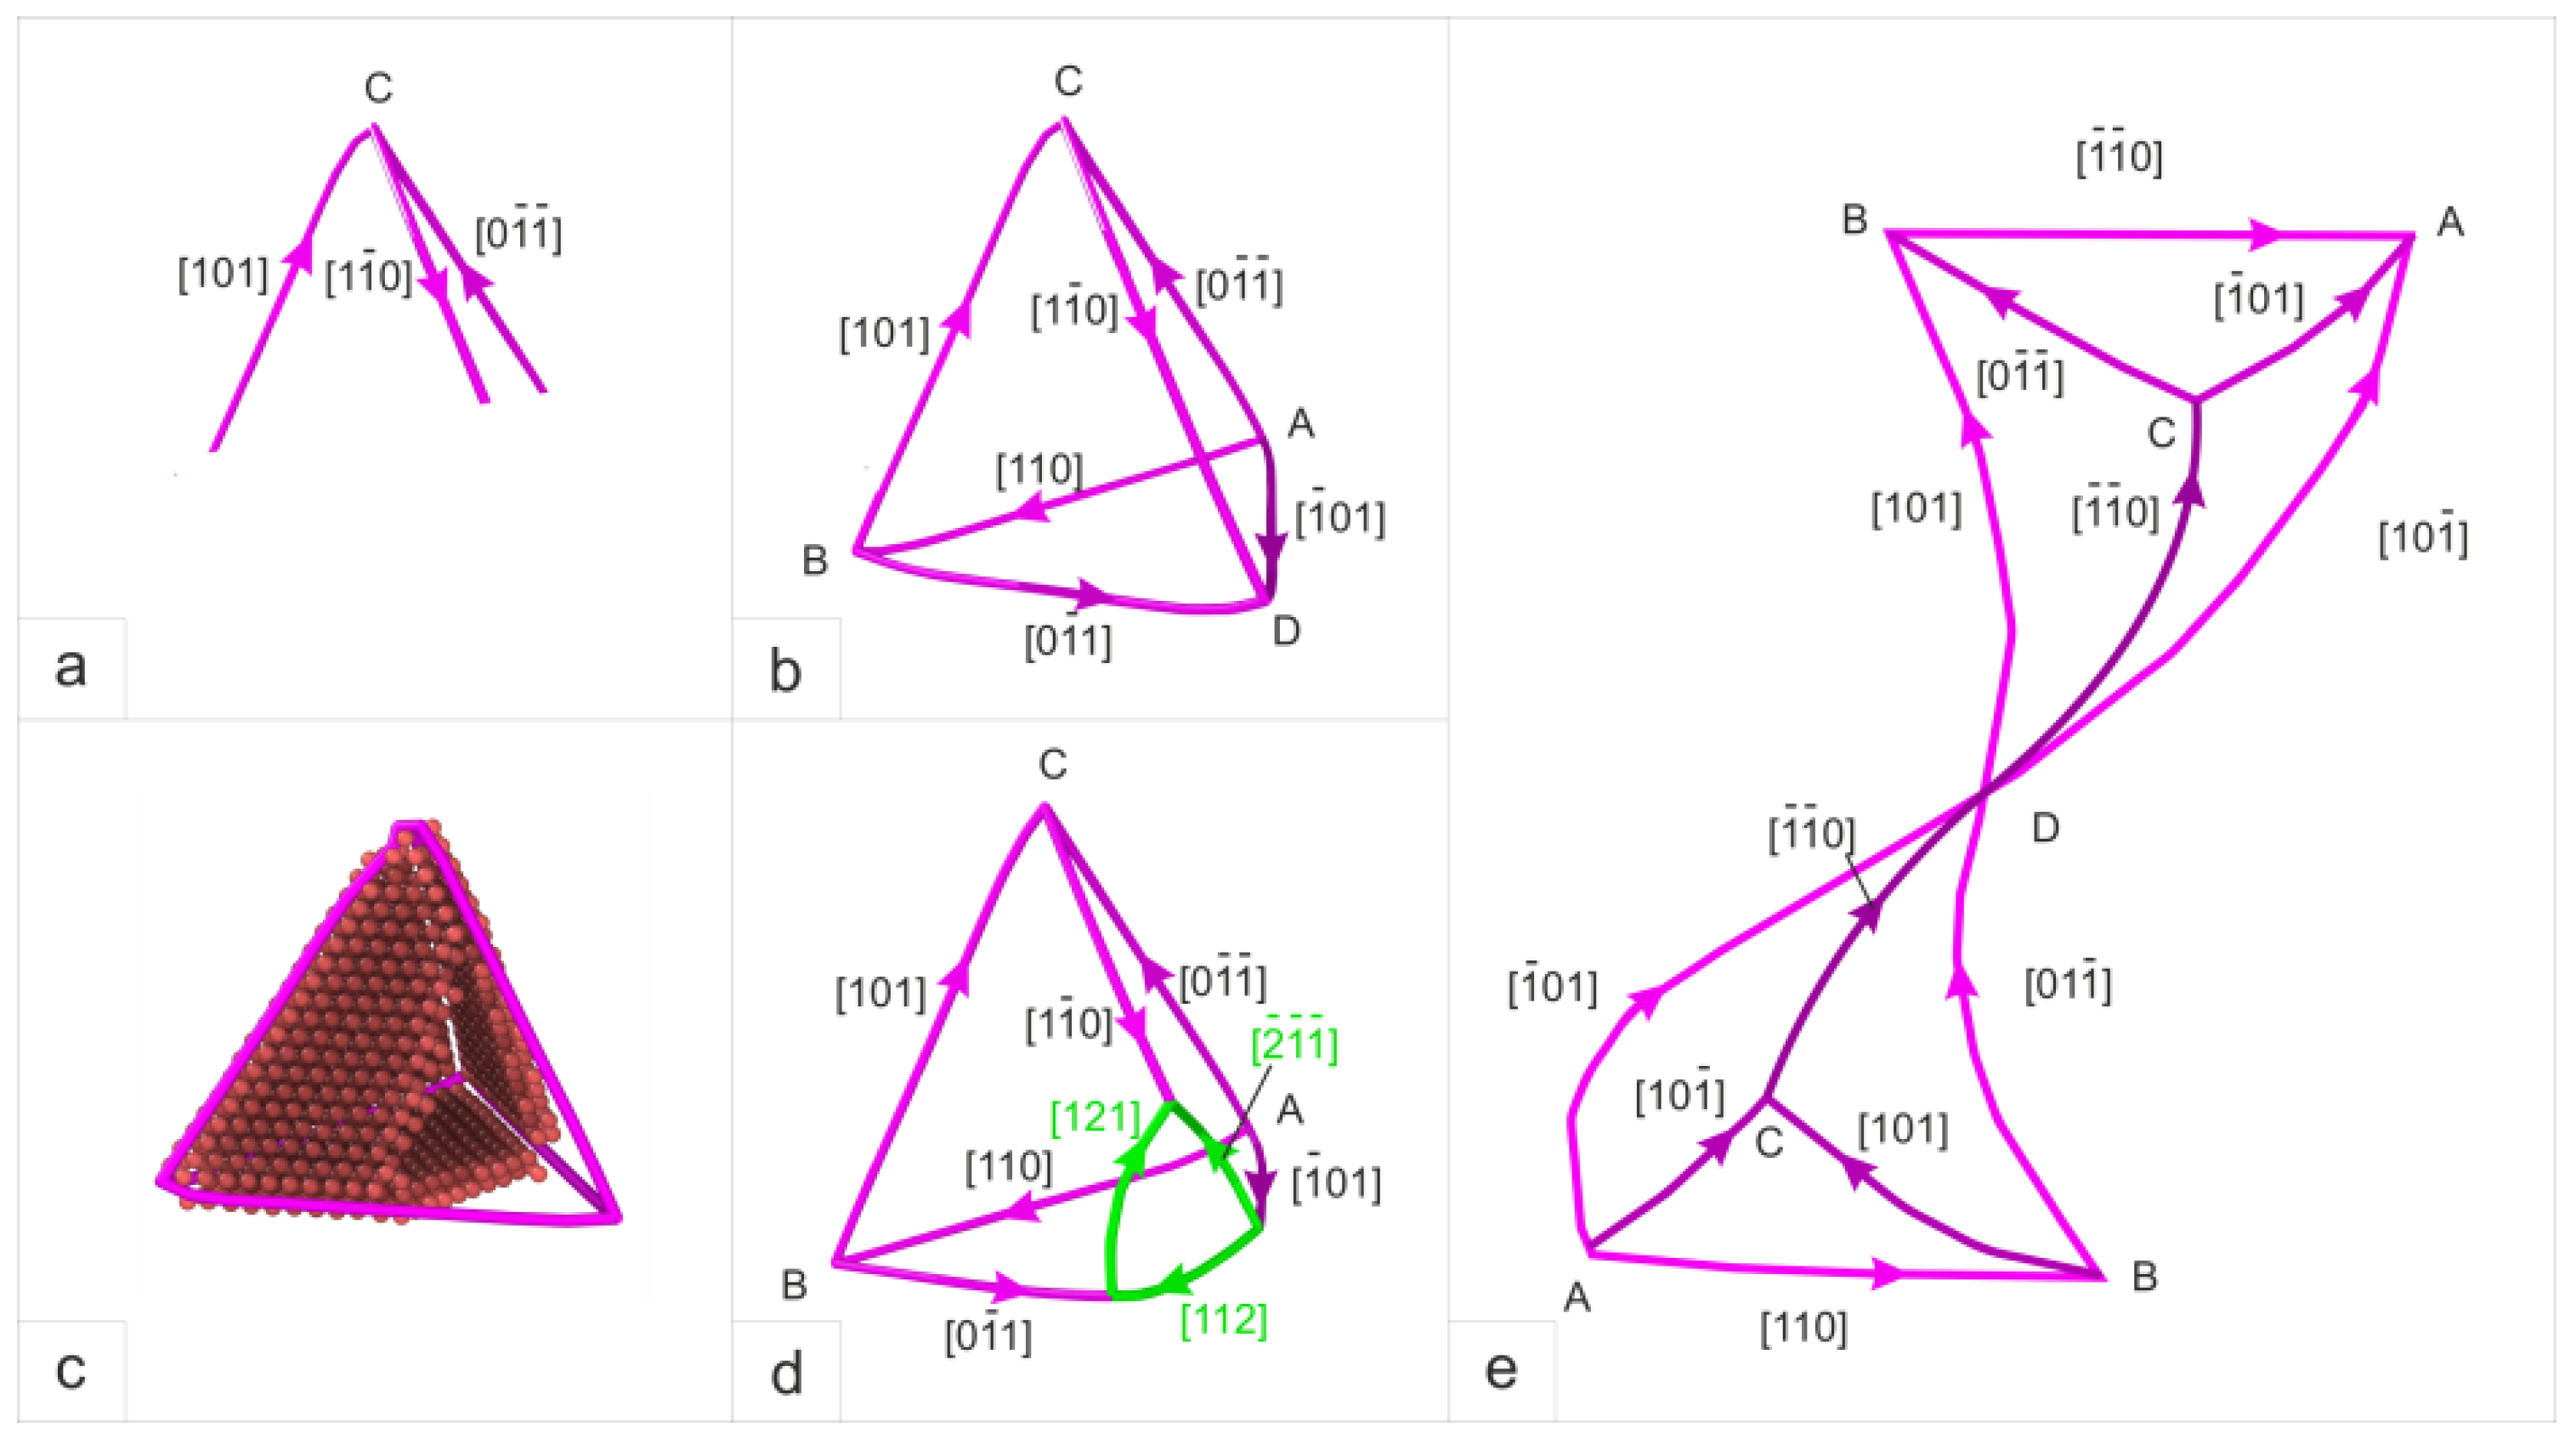
The Shockley partial dislocations form a 6 110   stair-rod dislocations. They meet at one point and form a junction of three dislocations (Figure 7a). Different orientations of a 6 110 junctions are observed (B on Figure 4 and Figure 5). Further, we observe six a 6 110 dislocations forming a tetrahedron (Figure 5b and Figure 7b). Moreover, a 6 110 dislocations and intrinsic stacking faults form a tetrahedron (Figure 7c). This type of structure is called stacking fault tetrahedron (SFT). SFT contains a defect-free structure of atoms located at the nodes of the FCC lattice (these atoms are not shown in Figure 7c). The tetrahedrons can differ in size by several times. The experimental observation of these tetrahedrons and the study of their formation mechanisms had been performed for the first time in [48]. The study mainly focused on the role of vacancies and related dislocation interactions. Later studies investigated the formation mechanisms of the stacking fault tetrahedrons by molecular dynamics simulation [50,51,52,53]. We also observed stacking fault tetrahedrons in MD simulations of FCC single crystals with four equiloaded octahedron planes [35].
The stacking fault tetrahedrons are frequently formed defects in both quenched and neutron-irradiated pure FCC metals, in particular, used in nuclear reactors. In the latter case, the mechanical properties of FCC materials depend on the interaction of SFT with moving dislocations. This interaction has been considered in detail elsewhere [54,55,56,57].
In our case, SFT is a typical element of dislocation structure. The nucleation sites of a 6 110 stair-rod dislocations and their complexes in the bulk of the model crystal are revealed in Figure 4 and Figure 5 (denoted as B). Most of them concentrate near the loaded layers and group into clusters consisting of a few of them. In addition, a 6 110 dislocation tetrahedron is a stable dislocation configuration. We observe a large number of mobile dislocations in the places of SFT formation. It should be noted that the CuAl crystal is characterized by a lower dislocation density in the pileups and by the later formation of SFTs.
The splitting of the complex into Shockley partials (see Figure 4, Figure 5 and Figure 6d near the bottom-loaded layer) was earlier considered as a stage of SFT formation. However, an analysis of the formation of these complexes revealed that there is a difference in the formation of small and large tetrahedrons. Partial dislocations explicitly contribute to the formation of the large tetrahedrons. It should be noted that splitting into partial dislocations at the complex vertex occurs after its formation; therefore, this process was not considered to contribute to the formation of the large tetrahedrons. The tetrahedrons serve as obstacles for dislocation movement. Intensive slip can result in decomposition or reduction of the tetrahedrons. The latter was observed experimentally in situ [57].
Thus, the mechanism of SFT formation is based on the interaction of Shockley partials on the adjacent slip planes, which results in the formation of a 6 110 stair-rod dislocations, followed by their arrangement into tetrahedron configurations. Cross slip is necessary to realize the tetrahedrons. This is justified by the results of simulation of the CuAl crystal evolution, which demonstrated that in circumstances of hindered cross slip, the tetrahedron formation in most cases terminates after the appearance of a junction of three dislocations.
Double SFTs are observed in addition to the single SFTs (Figure 4c and Figure 7e), which comprise of two tetrahedrons with a common vertex inverted each other. A model of the double SFT comprised of two single SFTs connected by an edge was considered in [51].
Along with the tetrahedral complexes consisted of a 6 110 stair-rod dislocations, there are observed other complexes in the CuAl single crystal formed by the same dislocations, which require separate consideration. However, there is no clear indication that complication of the configuration of a 6 110   stair-rod dislocations results in increasing its stability.
An analysis of nucleation and movement of dislocations in the samples studied revealed the SFE effect on the evolution of plastic deformation. Splitting of a perfect dislocation into partial dislocations on adjacent slip planes is more often in the crystal with higher SFE. Thus, more dislocations form on different slip planes and the total fraction of Shockley dislocations is comparable with that in the crystal with lower SFE. Interaction of these partial dislocations favors rapid emergence of different complexes formed by a 6 110   stair-rod dislocations and the following formation of SFTs.

4. Discussion of the Relationship between the Structural Changes and the Stress–Strain Curve Behavior

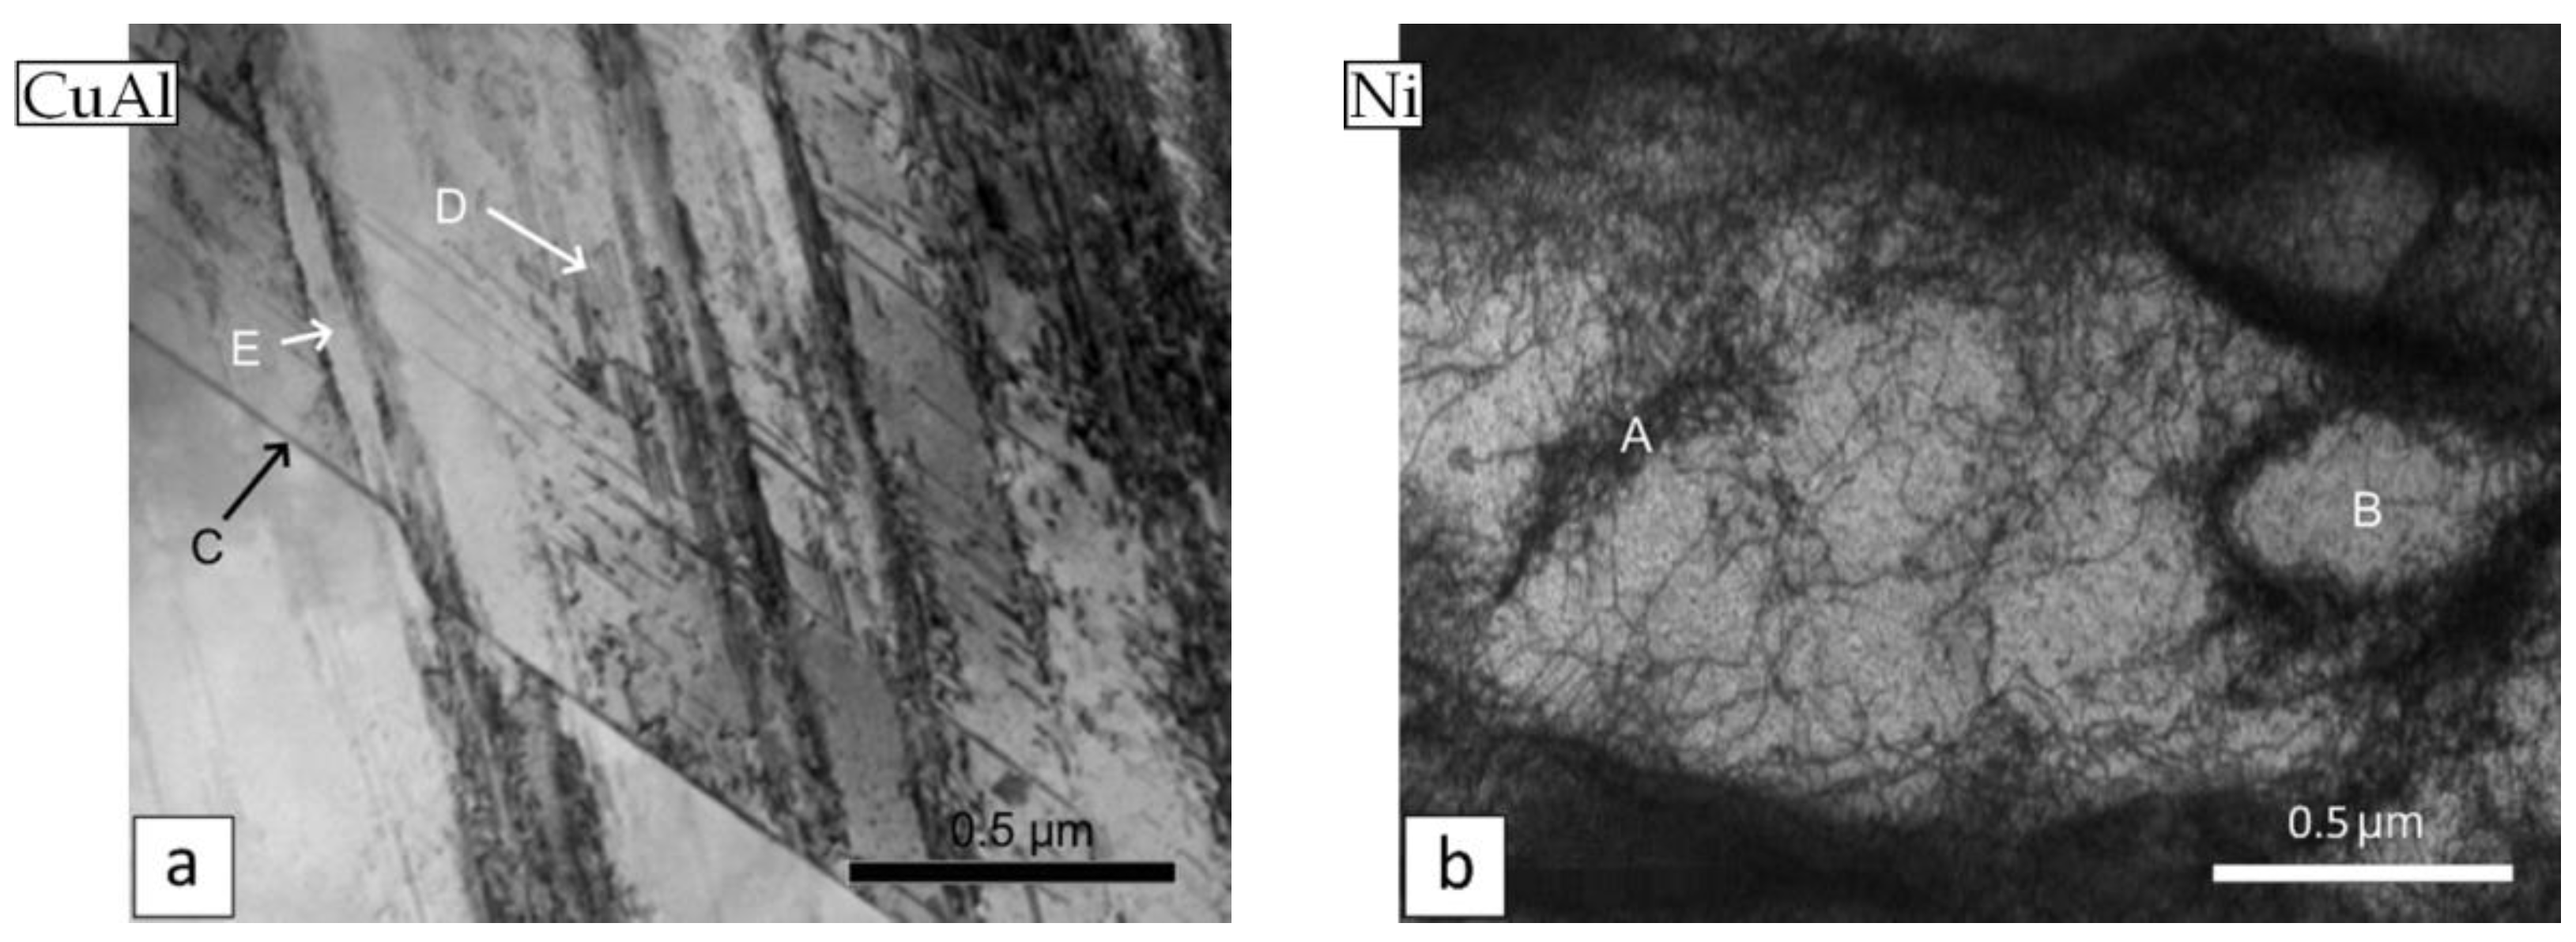
The MD simulations showed that the observed evolution of the dislocation structure is concerned with continuous variations of dislocation configurations with the active involvement of Shockley partials in their formation and movement. This is observed both at the early stage of deformation during the movement of a perfect dislocation (Figure 1b) and under the subsequent deformation. This underlies the classification of the dislocation complexes into mobile (Figure 6) and low mobile (Figure 7), and the consideration of changes in the dislocation structure during deformation (Figure 4 and Figure 5). It was experimentally observed that dislocations can be redistributed to form the regions with high and low dislocation densities (Figure 8b). These formations are thought of as dislocation cells and treated separately.
The study of the evolution of dislocation structure in a number of metals and alloys showed that at deformation temperatures less than 0.4 of the melting temperature, the formation of dislocation pileups becomes less likely with decreasing SFE [58]. As a result, higher strains are needed to form the dislocation pileups. The net-cell substructure is formed, which includes the formation of deformation microtwins, microbands, and stacking faults (Figure 8a).
Dislocation pileups are usually stable structures, which are positioned at the sites of the formation of stacking fault tetrahedrons with a high density of a 6 110   stair-rod dislocations (denoted as B in Figure 4 and Figure 5). Changes in the considered dislocation pileups are not related to the long-range movement of dislocations. In particular, there can be changes in the structure of the tetrahedron consisting of a 6 110   stair-rod dislocations when one of its vertexes decomposes into Shockley partials (Figure 5). The tetrahedron maintains its form until the movement of a dislocation inside the cell results in changes in this configuration or its annihilation.
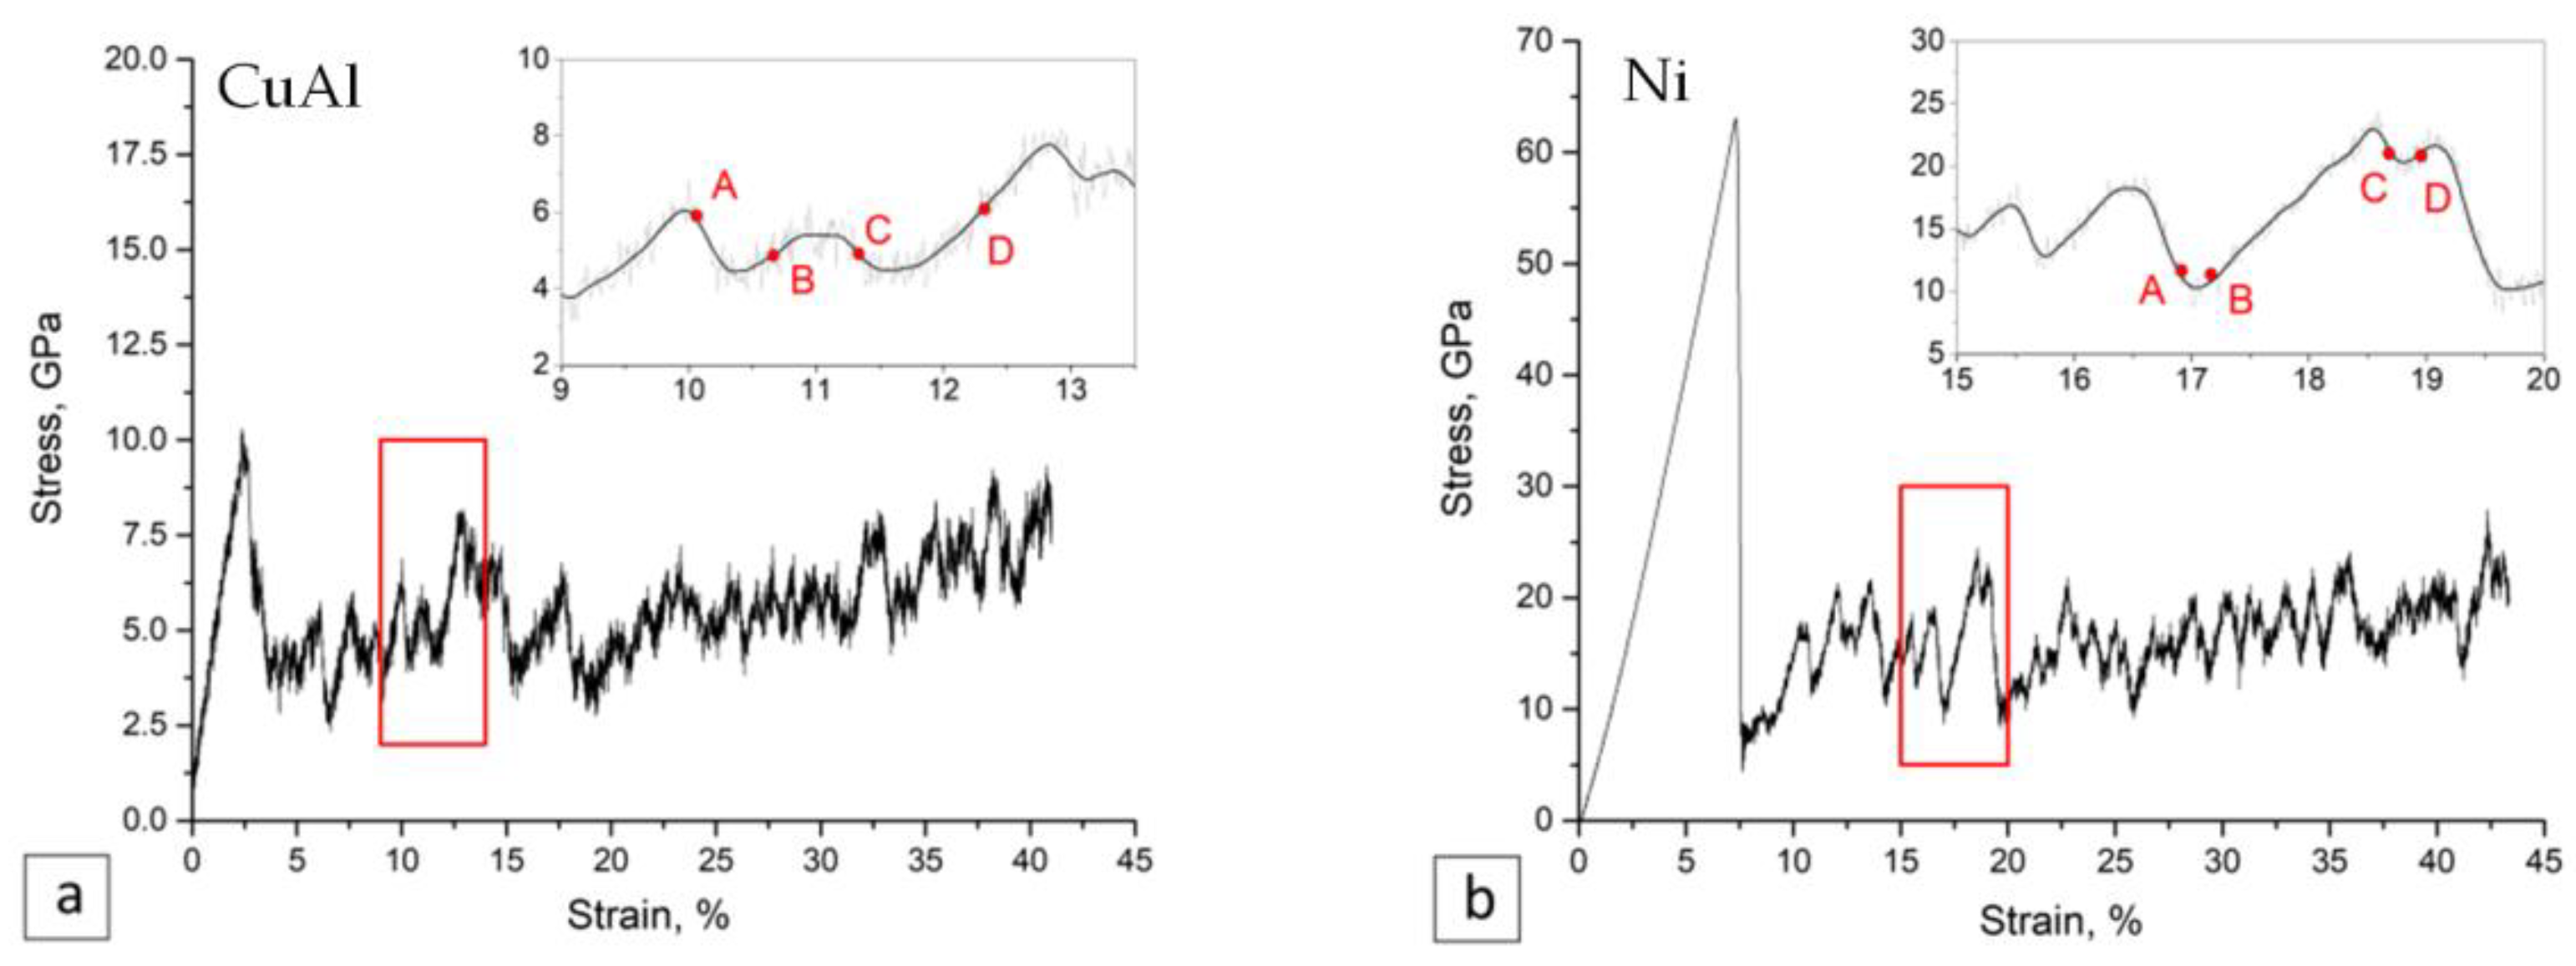
Regardless of SFE values, the stress–strain curves for both crystals at the microlevel are characterized by the segments of rising and falling stress with increasing strain (Figure 9). The reasons for this behavior can be revealed from the analysis of the selected area. The movement of a dislocation complex from one pileup to another coincides with the stress drop segment of the curve (see A and C in Figure 9 and A in Figure 4 and Figure 5a,c). In contrast, the dislocation movement is not observed during the periods corresponding to the rising segments of the stress–strain curve (B and D in Figure 9). In one of the cases shown in Figure 4, there is a movement of a dislocation complex comprised of a 6 110   stair-rod dislocations and a 3 001 Hirth dislocations (Figure 6e). The complex displayed in Figure 6a was observed at the stage corresponding to the dislocation structure shown in Figure 5c. The Ni single crystal is characterized by the movement of the complex presented in Figure 6d, in the first case (Figure 5a), and the one shown in Figure 6b, in the other case (Figure 5c). The moving dislocation complexes consist of two a 6 110   stair-rod dislocations, in the first case, and a 3 001 Hirth dislocation and a perfect dislocation, in the second case. Shockley partials take active participation in the formation of the dislocation complexes in all the cases.
Thus, the alternation of the segments of hardening and softening on the stress–strain curves are related to dynamics of changes in the dislocation structure under loading, in particular, the movement of dislocation complexes between dislocation pileups. In this case, an increase in stress can be attributed to a substructural hardening mechanism, which implies that the main contribution to hindering dislocation movement is inversely proportional to the distance between the pileups [59]. This hardening mechanism is characteristic for both materials studied; however, the barrier density is higher in Ni than in CuAl alloy. The latter results in three times higher stress in Ni, compared with CuAl. Low SFE furthers the formation of deformation twins in CuAl; however, the tendency to twinning also depends on the crystallographic orientation, temperature, and strain rate. In the case of the <111> compression axis, the main deformation mechanism is dislocation slip, as is observed in the simulations. Moreover, it is known that the calculated shear stress for slip is higher than for twinning. Twins can be observed in aluminum bronze subjected to compression; however, in this case, it should be taken into account the role of local reorientation and local internal stresses concerned with different structural elements.
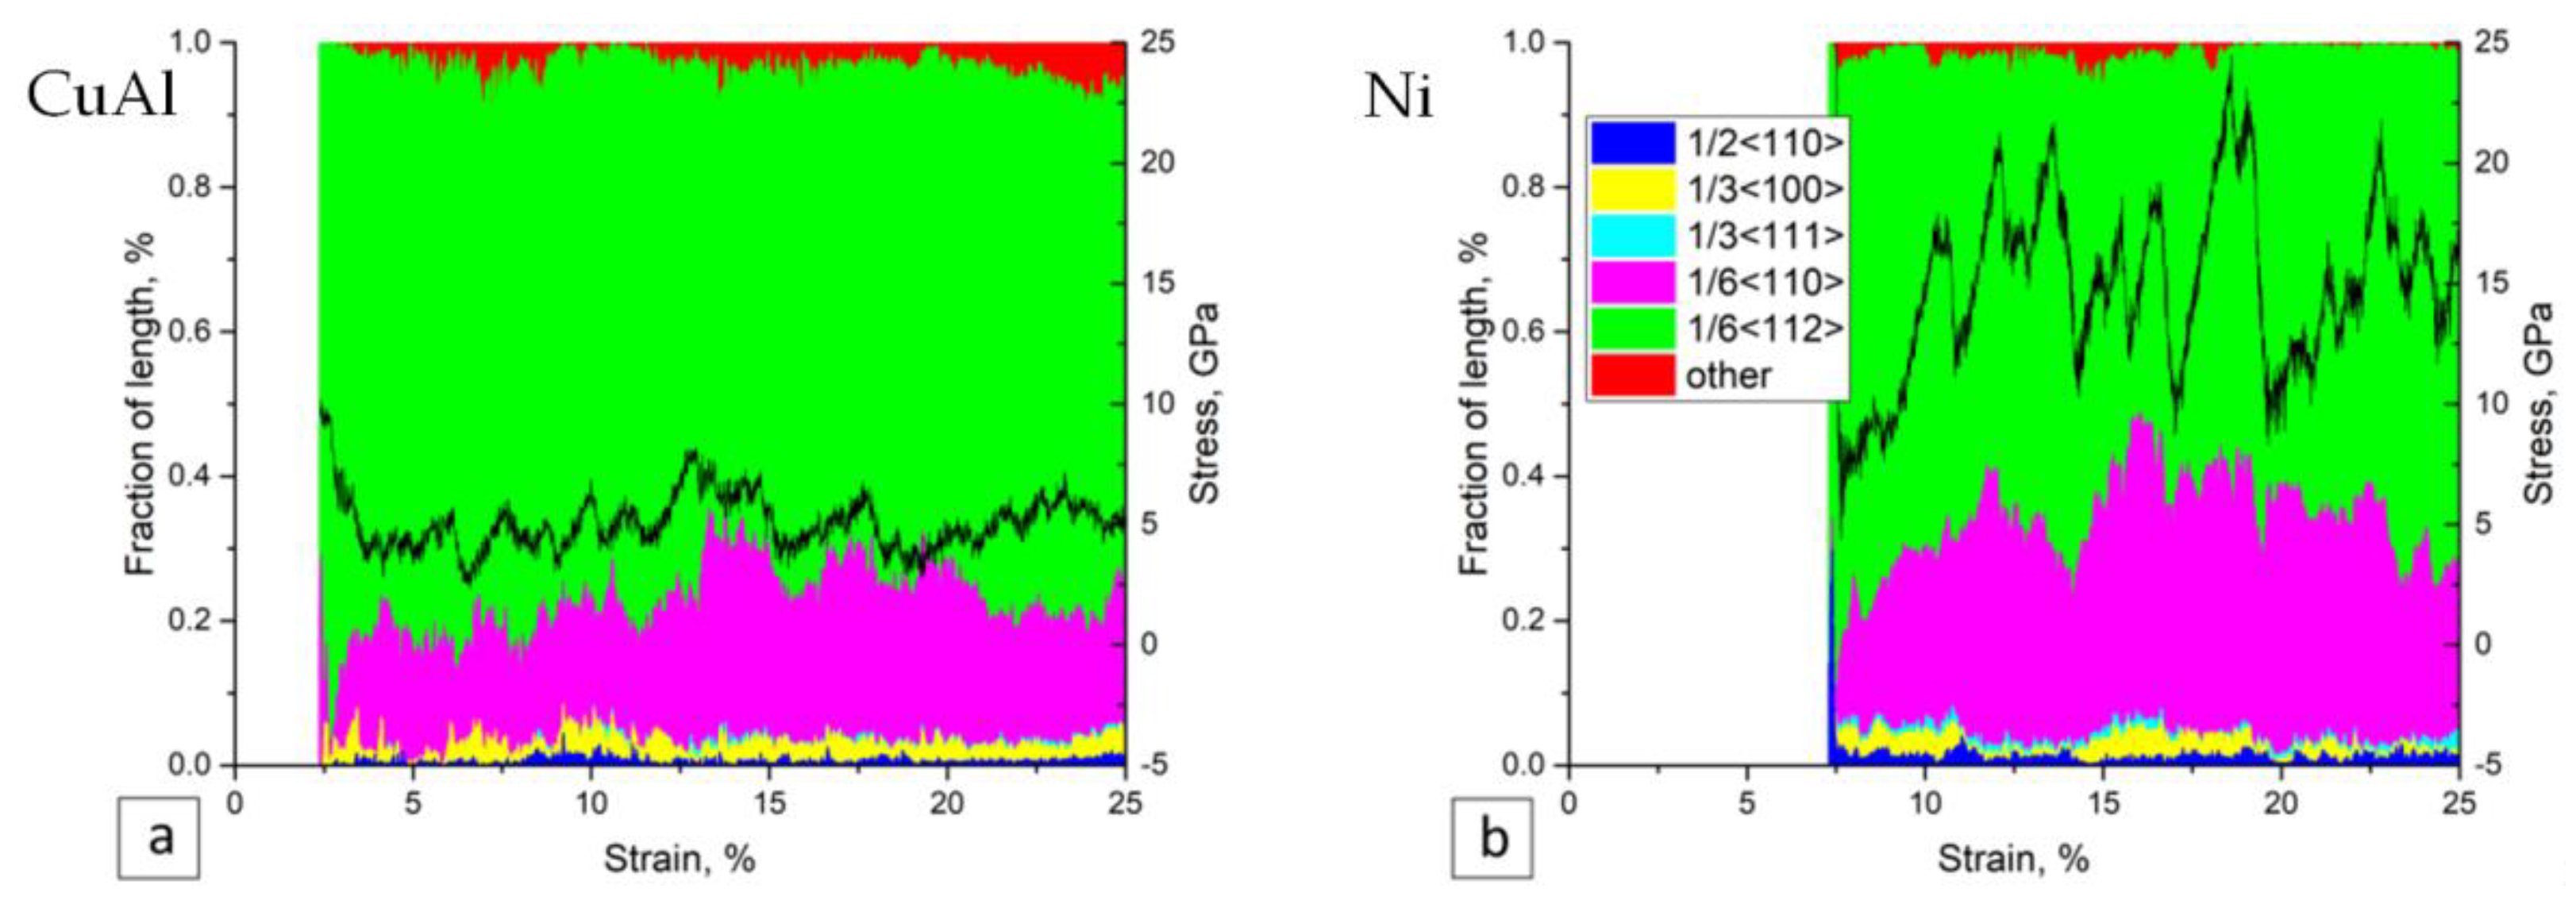
The limited volume of the simulated single crystals makes it difficult to analyze different types of dislocation structures and their interactions during plastic deformation. However, it offers unique opportunities to highlight the role of different dislocations in the hardening and deformation of analyzed structure elements. In the present case, the structural elements are dislocation pileups, and the dislocation slip between them is under consideration. This type of structure is basic in almost all metals and alloys, and therefore, it significantly contributes to their hardening. Large-scale determination of dislocation types is a difficult task in TEM investigations. Therefore, only single identifications were performed in the published studies. In contrast, molecular dynamics simulations enable us to analyze different types of dislocations and determine the relative length of each type in the simulated crystal. These relative lengths, as a function of strain, are presented for the studied materials in Figure 10 and compared with the corresponding stress–strain curves. It was already considered above the fraction of each observed type of dislocations at a certain strain. The plots shown in Figure 10 provide a clear picture of the fractions of moving and sessile dislocations and of the correlation of the fractions with the stress–strain behavior. The ratio of relative lengths of stair-rod dislocations to Shockley dislocations is 0.25 for CuAl and 0.67 in Ni. The ratio of proportionality factors for dislocations providing the main barrier contributions is 2.7 that well agrees with the above-mentioned stress ratio. An analysis of the changes in the fraction of stair-rod dislocations and the stress–strain behavior indicates an important role of these dislocations in resistance to deformation. Thus the analysis of the results presented in Figure 10 made it possible to reveal the decisive role of stair-rod dislocations, which fraction is larger in materials with higher SFE, in changing stresses and their values in the whole range of applied strains.

5. Conclusions

Interaction of dislocations and evolution of deformation surface topography in CuAl and Ni single crystals characterized by different SFEs were studied using MD simulations under compression along the <111> axis. The simulation results indicate active interaction of Shockley partial dislocations in adjacent planes of both the materials. This leads to a high probability of the formation of low-mobile a 6 110 stair-rod dislocations and stacking fault tetrahedrons consisted of these dislocations. It was found that the probability of their formation grows with increasing SFE. The low-mobile dislocations and dislocation complexes provide conditions for the formation of dislocation pileups. Their distribution in the bulk of the crystals is similar to the walls of dislocation cells. Slip between the “walls” occurs through the movement of the dislocation complexes composed of a different number of various stair-rod dislocations in combination with perfect and partial dislocations. The slip corresponds to a decrease in stress on the stress–strain curves. In general, the stress drop corresponds to dislocation slip, whereas the increasing stress is found when the slip is hindered. The correlation between the stress value and the total length of stair-rod dislocations is revealed.
The simulations showed that the <111> preferred grain orientation in 3D printed FCC materials operating under loading conditions close to uniaxial compression should ensure dislocation hardening due to the formation of stair-rod dislocations. However, a low-stress level in single-phase alloys with low SFE cannot provide high stresses in 3D printed components made of these alloys. Therefore, the use of such alloys as a structural and anti-friction material requires improvement of their strength that can be reached by the introduction of strengthening particles, grain refinement, and selection of optimal crystallographic texture.

Author Contributions

Conceptualization, D.V.L. and A.I.D.; modeling A.Y.N. and A.A.B.; experiment D.V.L. and O.S.N.; writing—original draft preparation D.V.L. and A.Y.N.; writing—review and editing, L.L.L. and A.I.D. All authors have read and agreed to the published version of the manuscript.

Funding

This research was funded by the Research Program 20-72-10184 of the Russian Science Foundation for 2020–2023.

Institutional Review Board Statement

Not applicable.

Informed Consent Statement

Not applicable.

Data Availability Statement

The data presented in this study are available on request from the corresponding author.

Conflicts of Interest

The authors declare no conflict of interest.

References

  1. Khoroshko, E.; Filippov, A.; Tarasov, S.; Shamarin, N.; Moskvichev, E.; Fortuna, S.; Lychagin, D.V.; Kolubaev, E. Strength and Ductility Improvement through Thermomechanical Treatment of Wire-Feed Electron Beam Additive Manufactured Low Stacking Fault Energy (SFE) Aluminum Bronze. Metals 2020, 10, 1568. [Google Scholar] [CrossRef]
  2. Zhang, J.; Liou, F.; Seufzer, W.; Taminger, K. A coupled finite element cellular automaton model to predict thermal history and grain morphology of Ti-6Al-4V during direct metal deposition (DMD). Addit. Manuf. 2016, 11, 32–39. [Google Scholar] [CrossRef]
  3. Dong, B.; Pan, Z.; Shen, C.; Ma, Y.; Li, H. Fabrication of Copper-Rich Cu-Al Alloy Using the Wire-Arc Additive Manufacturing Process. Metall. Mater. Trans. B Process Metall. Mater. Process. Sci. 2017, 48, 3143–3151. [Google Scholar] [CrossRef]
  4. Paul, S.; Liu, J.; Strayer, S.T.; Zhao, Y.; Sridar, S.; Klecka, M.A.; Xiong, W.; To, A.C. A Discrete Dendrite Dynamics Model for Epitaxial Columnar Grain Growth in Metal Additive Manufacturing with Application to Inconel. Addit. Manuf. 2020, 36, 101611. [Google Scholar] [CrossRef]
  5. Qi, P.; Li, B.; Wang, T.; Zhou, L.; Nie, Z. Evolution of microstructural homogeneity in novel Ti-6Zr-5Fe alloy fabricated by selective laser melting. Mater. Charact. 2021, 171, 110729. [Google Scholar] [CrossRef]
  6. Strickland, J.; Nenchev, B.; Dong, H. On Directional Dendritic Growth and Primary Spacing—A Review. Crystals 2020, 10, 627. [Google Scholar] [CrossRef]
  7. Tang, Y.T.; D’Souza, N.; Roebuck, B.; Karamched, P.; Panwisawas, C.; Collins, D.M. Ultra-high temperature deformation in a single crystal superalloy: Mesoscale process simulation and micromechanisms. Acta Mater. 2021, 203, 116468. [Google Scholar] [CrossRef]
  8. Nahata, S.; Moradi, M.; Picard, Y.N.; Kota, N.; Ozdoganlar, O.B. Micromachining imposed subsurface plastic deformation in single-crystal aluminum. Mater. Charact. 2021, 171, 110747. [Google Scholar] [CrossRef]
  9. Alfyorova, E.; Filippov, A. Self-organization processes during deformation of nickel single crystals. Mater. Charact. 2020, 159, 110007. [Google Scholar] [CrossRef]
  10. Paik, S.; Kumar, N.N.; Dutta, B.K.; Durgaprasad, P.V.; Tewari, R. Deformation of copper single crystals: Comparison of experimental results with crystal plasticity simulations. Mater. Today Commun. 2020, 24, 100997. [Google Scholar] [CrossRef]
  11. Xing, Z.; Fan, H.; Tang, J.; Wang, B.; Kang, G. Molecular dynamics simulation on the cyclic deformation of magnesium single crystals. Comput. Mater. Sci. 2021, 186, 110003. [Google Scholar] [CrossRef]
  12. Shugurov, A.; Panin, A.; Dmitriev, A.; Nikonov, A. The effect of crystallographic grain orientation of polycrystalline Ti on ploughing under scratch testing. Wear 2018, 408–409, 214–221. [Google Scholar] [CrossRef]
  13. Zhang, G.; Xiong, H.; Yu, H.; Qin, R.; Liu, W.; Yuan, H. Microstructure evolution and mechanical properties of wire-feed electron beam additive manufactured Ti-5Al-2Sn-2Zr-4Mo-4Cr alloy with different subtransus heat treatments. Mater. Des. 2020, 195, 109063. [Google Scholar] [CrossRef]
  14. Filippov, A.V.; Khoroshko, E.S.; Shamarin, N.N.; Savchenko, N.L.; Moskvichev, E.N.; Utyaganova, V.R.; Kolubaev, E.A.; Smolin, A.Y.; Tarasov, S.Y. Characterization of gradient CuAl–B4C composites additively manufactured using a combination of wire-feed and powder-bed electron beam deposition methods. J. Alloys Compd. 2021, 859, 157824. [Google Scholar] [CrossRef]
  15. Lychagin, D. Fragmentation of plastically deformed fcc metallic materials. Phys. Mesomech. 2006, 9, 95–105. [Google Scholar]
  16. Korchuganov, A.V.; Zolnikov, K.P.; Kryzhevich, D.S. Atomic mechanisms of stacking fault propagation in copper crystallite. Mater. Lett. 2019, 252, 194–197. [Google Scholar] [CrossRef]
  17. Zolnikov, K.P.; Kryzhevich, D.S.; Korchuganov, A.V. Structural Transformations in the Grain Boundary Region of Nanocrystalline Metals Under Mechanical Loading. Russ. Phys. J. 2019, 62, 1357–1362. [Google Scholar] [CrossRef]
  18. Zolnikov, K.P.; Kryzhevich, D.S.; Korchuganov, A.V. Nucleation of Plasticity in Alpha-Iron Nanowires. Russ. Phys. J. 2020, 63, 947–953. [Google Scholar] [CrossRef]
  19. Weinberger, C.R.; Cai, W. Plasticity of metal wires in torsion: Molecular dynamics and dislocation dynamics simulations. J. Mech. Phys. Solids 2010, 58, 1011–1025. [Google Scholar] [CrossRef]
  20. Zhang, L.; Lu, C.; Tieu, A.K. Nonlinear elastic response of single crystal Cu under uniaxial loading by molecular dynamics study. Mater. Lett. 2018, 227, 236–239. [Google Scholar] [CrossRef]
  21. Tschopp, M.A.; McDowell, D.L. Influence of single crystal orientation on homogeneous dislocation nucleation under uniaxial loading. J. Mech. Phys. Solids 2008, 56, 1806–1830. [Google Scholar] [CrossRef]
  22. Yildiz, Y.O.; Ahadi, A.; Kirca, M. Strain rate effects on tensile and compression behavior of nano-crystalline nanoporous gold: A molecular dynamic study. Mech. Mater. 2020, 143, 103338. [Google Scholar] [CrossRef]
  23. Xiong, Q.; Kitamura, T.; Li, Z. Cylindrical voids induced deformation response of single crystal coppers during low-speed shock compressions: A molecular dynamics study. Mech. Mater. 2019, 138, 103167. [Google Scholar] [CrossRef]
  24. Xiong, Q.; Kitamura, T.; Li, Z. Nanocrystallization in single-crystal copper under laser shock compression: A molecular dynamics study. Mater. Sci. Eng. A 2019, 752, 115–127. [Google Scholar] [CrossRef]
  25. Rawat, S.; Mitra, N. Molecular dynamics investigation of c-axis deformation of single crystal Ti under uniaxial stress conditions: Evolution of compression twinning and dislocations. Comput. Mater. Sci. 2018, 141, 19–29. [Google Scholar] [CrossRef]
  26. Xie, H.; Yu, T.; Yin, F. Tension–compression asymmetry in homogeneous dislocation nucleation stress of single crystals Cu, Au, Ni and Ni3Al. Mater. Sci. Eng. A 2014, 604, 142–147. [Google Scholar] [CrossRef]
  27. Sarvesha, R.; Gokhale, A.; Kumar, K.; Sharma, N.K.; Jain, J.; Singh, S.S. Effect of crystal orientation on indentation-induced deformation behavior of zinc. Mater. Sci. Eng. A 2020, 776, 139064. [Google Scholar] [CrossRef]
  28. Li, J.; Fang, Q.; Liu, Y.; Zhang, L. Scratching of copper with rough surfaces conducted by diamond tip simulated using molecular dynamics. Int. J. Adv. Manuf. Technol. 2015, 77, 1057–1070. [Google Scholar] [CrossRef]
  29. Su, H.; Tang, Q. Chip formation dependence of machining velocities in nano-scale by molecular dynamics simulations. Sci. China Technol. Sci. 2014, 57, 2426–2433. [Google Scholar] [CrossRef]
  30. Dmitriev, A.I.; Nikonov, A.Y.; Shugurov, A.R.; Panin, A.V. Numerical study of atomic scale deformation mechanisms of Ti grains with different crystallographic orientation subjected to scratch testing. Appl. Surf. Sci. 2019, 471, 318–327. [Google Scholar] [CrossRef]
  31. Fung, K.Y.; Tang, C.Y.; Cheung, C.F. Molecular dynamics analysis of the effect of surface flaws of diamond tools on tool wear in nanometric cutting. Comput. Mater. Sci. 2017, 133, 60–70. [Google Scholar] [CrossRef]
  32. Zhang, P.; Zhao, H.; Shi, C.; Zhang, L.; Huang, H.; Ren, L. Influence of double-tip scratch and single-tip scratch on nano-scratching process via molecular dynamics simulation. Appl. Surf. Sci. 2013, 280, 751–756. [Google Scholar] [CrossRef]
  33. Sharma, A.; Datta, D.; Balasubramaniam, R. Molecular dynamics simulation to investigate the orientation effects on nanoscale cutting of single crystal copper. Comput. Mater. Sci. 2018, 153, 241–250. [Google Scholar] [CrossRef]
  34. Dmitriev, A.I.; Kuznetsov, V.P.; Nikonov, A.Y.; Smolin, I.Y. Modeling of nanostructuring burnishing on different scales. Phys. Mesomech. 2014, 17, 243–249. [Google Scholar] [CrossRef]
  35. Lychagin, D.; Dmitriev, A.; Nikonov, A.; Alfyorova, E. Crystallographic and Geometric Factors in the Shear Development in <001> FCC Single Crystals: Molecular Dynamics Simulation and Experimental Study. Crystals 2020, 10, 666. [Google Scholar] [CrossRef]
  36. Howie, A.; Swann, P.R. Direct measurements of stacking-fault energies from observations of dislocation nodes. Philos. Mag. 1961, 6, 1215–1226. [Google Scholar] [CrossRef]
  37. Plimpton, S. Fast Parallel Algorithms for Short-Range Molecular Dynamics. J. Comput. Phys. 1995, 117, 1–19. [Google Scholar] [CrossRef] [Green Version]
  38. Mishin, Y.; Farkas, D.; Mehl, M.J.; Papaconstantopoulos, D.A. Interatomic potentials for monoatomic metals from experimental data and ab initio calculations. Phys. Rev. B 1999, 59, 3393–3407. [Google Scholar] [CrossRef] [Green Version]
  39. Cai, J.; Ye, Y.Y. Simple analytical embedded-atom-potential model including a long-range force for fcc metals and their alloys. Phys. Rev. B 1996, 54, 8398–8410. [Google Scholar] [CrossRef]
  40. Stukowski, A. Visualization and analysis of atomistic simulation data with OVITO–the Open Visualization Tool. Model. Simul. Mater. Sci. Eng. 2010, 18, 015012. [Google Scholar] [CrossRef]
  41. Honeycutt, J.D.; Andersen, H.C. Molecular dynamics study of melting and freezing of small Lennard-Jones clusters. J. Phys. Chem. 1987, 91, 4950–4963. [Google Scholar] [CrossRef]
  42. Stukowski, A.; Bulatov, V.V.; Arsenlis, A. Automated identification and indexing of dislocations in crystal interfaces. Model. Simul. Mater. Sci. Eng. 2012, 20, 85007. [Google Scholar] [CrossRef]
  43. Magid, K.R.; Florando, J.N.; Lassila, D.H.; LeBlanc, M.M.; Tamura, N.; Morris, J.W. Mapping mesoscale heterogeneity in the plastic deformation of a copper single crystal. Philos. Mag. 2009, 89, 77–107. [Google Scholar] [CrossRef] [Green Version]
  44. Lychagin, D.V.; Tarasov, S.Y.; Chumaevskii, A.V.; Alfyorova, E.A. Macrosegmentation and strain hardening stages in copper single crystals under compression. Int. J. Plast. 2015, 69, 36–53. [Google Scholar] [CrossRef]
  45. Alfyorova, E.A.; Lychagin, D.V. Self-organization of plastic deformation and deformation relief in FCC single crystals. Mech. Mater. 2018, 117, 202–213. [Google Scholar] [CrossRef]
  46. Smallman, R.; Ngan, A.H. Introduction to Dislocations. In Modern Physical Metallurgy; Butterworth-Heinemann: Oxford, UK, 2014; pp. 121–158. [Google Scholar]
  47. Friedel, J. CXXX. On the linear work hardening mate of face-centred cubic single crystals. Lond. Edinb. Dublin Philos. Mag. J. Sci. 1955, 46, 1169–1186. [Google Scholar] [CrossRef]
  48. Hirth, J.P.; Lothe, J. Theory of Dislocation; McGraw-Hill: New York, NY, USA, 1968; p. 780. [Google Scholar]
  49. Thompson, N. Dislocation Nodes in Face-Centred Cubic Lattices. Proc. Phys. Soc. Sect. B 1953, 66, 481–492. [Google Scholar] [CrossRef]
  50. Wang, H.; Xu, D.S.; Yang, R.; Veyssière, P. The formation of stacking fault tetrahedra in Al and Cu: I. Dipole annihilation and the nucleation stage. Acta Mater. 2011, 59, 1–9. [Google Scholar] [CrossRef]
  51. Wang, H.; Xu, D.S.; Yang, R.; Veyssière, P. The formation of stacking fault tetrahedra in Al and Cu: II. SFT growth by successive absorption of vacancies generated by dipole annihilation. Acta Mater. 2011, 59, 10–18. [Google Scholar] [CrossRef]
  52. Wang, H.; Xu, D.S.; Yang, R.; Veyssière, P. The formation of stacking fault tetrahedra in Al and Cu: III. Growth by expanding ledges. Acta Mater. 2011, 59, 19–29. [Google Scholar] [CrossRef]
  53. Poletaev, G.M.; Starostenkov, M.D. Structural transformations of stacking fault tetrahedra upon the absorption of point defects. Tech. Phys. Lett. 2009, 35, 1–4. [Google Scholar] [CrossRef]
  54. Wirth, B.D.; Bulatov, V.V.; de la Rubia, T.D. Dislocation-Stacking Fault Tetrahedron Interactions in Cu. J. Eng. Mater. Technol. 2002, 124, 329–334. [Google Scholar] [CrossRef]
  55. Osetsky, Y.; Stoller, R.; Matsukawa, Y. Dislocation–stacking fault tetrahedron interaction: What can we learn from atomic-scale modelling. J. Nucl. Mater. 2004, 329–333, 1228–1232. [Google Scholar] [CrossRef]
  56. Robach, J.S.; Robertson, I.M.; Wirth, B.D.; Arsenlis, A. In-situ transmission electron microscopy observations and molecular dynamics simulations of dislocation-defect interactions in ion-irradiated copper. Philos. Mag. 2003, 83, 955–967. [Google Scholar] [CrossRef]
  57. Matsukawa, Y.; Zinkle, S.J. Dynamic observation of the collapse process of a stacking fault tetrahedron by moving dislocations. J. Nucl. Mater. 2004, 329–333, 919–923. [Google Scholar] [CrossRef]
  58. Dudarev, E.F.; Kornienko, L.A.; Bakach, G.P. Effect of stacking-fault energy on the development of a dislocation substructure, strain hardening, and plasticity of fcc solid solutions. Sov. Phys. J. 1991, 34, 207–216. [Google Scholar] [CrossRef]
  59. Kozlov, E.; Koneva, N. Nature of hardening of metallic materials. Russ. Phys. J. 2002, 1, 1–23. [Google Scholar]
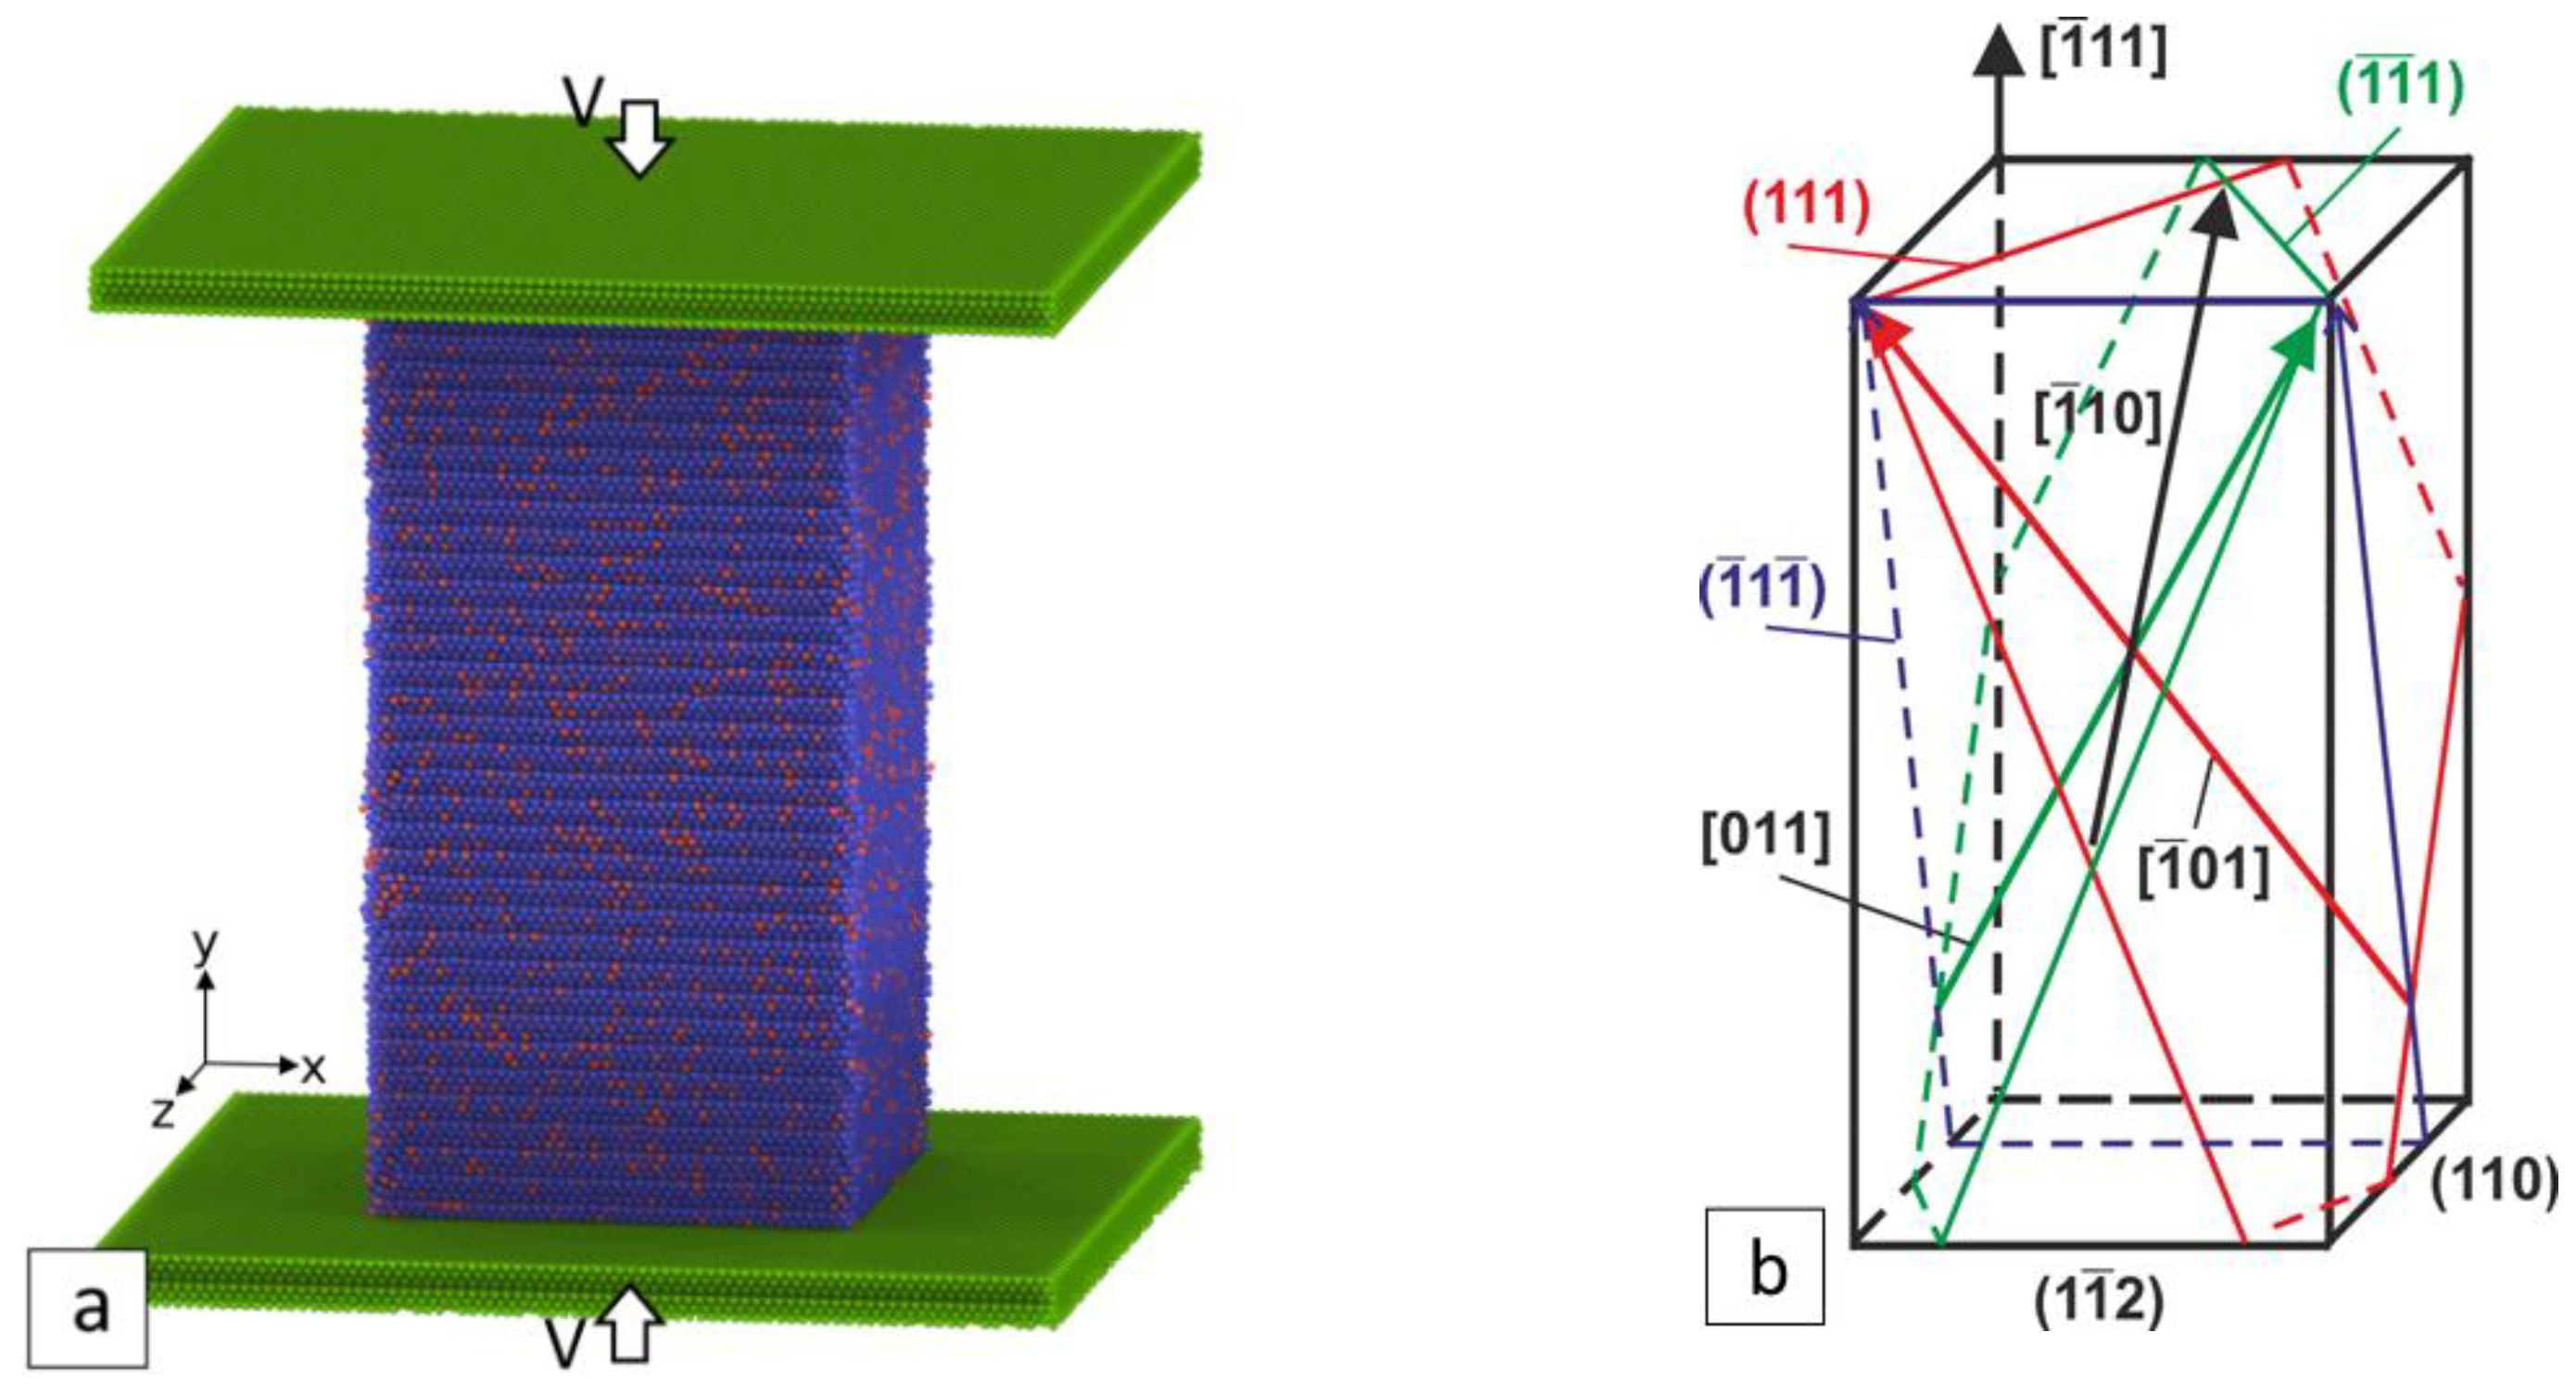
Figure 1. (a) Initial structure of the simulated sample and (b) the crystallographic diagram.
Metals 11 00582 g001
Figure 2. The kinematics of dislocations motion in (a) CuAl and (b) Ni at times 1, 2, 3, 4 and 5: a—screw partial dislocations, b—edge partial dislocations, and c—perfect dislocation.
Metals 11 00582 g002
Figure 3. The deformation relief of simulated [ 1 ¯ 11 ] single crystals: (a) CuAl (ε = 11.2%) and (b) nickel (ε = 11.8%). Experimentally observed deformation relief of [ 1 ¯ 11 ] nickel single crystal, optical microscopy, ε = 0.10; (c)— ( 1 1 ¯ 2 ) ; (d)—(110).
Metals 11 00582 g003
Figure 4. The evolution of the dislocation structure of CuAl alloy single crystal at strain: (a) 10.1%; (b) 10.6%; (c) 11.3%; and (d) 12.3%.
Metals 11 00582 g004
Figure 5. The evolution of the dislocation structure of Ni single crystal at strain: (a) 16.8%; (b) 17.1%; (c) 18.6%; and (d) 18.8%.
Metals 11 00582 g005aMetals 11 00582 g005b
Figure 6. The structure of low-mobile dislocation complexes from Shockley dislocations and other dislocations such as (a) stair-rod, Hirth; (b) stair-rod and perfect; (c) Stair-rod, Hirth, and perfect; (d) few stair-rods; and (e) stair-rod and Hirth.
Metals 11 00582 g006
Figure 7. The structures of stair-rod dislocation complexes: (a) a 6 110 junction; (b) a 6 110 dislocations tetrahedron; (c) stacking fault tetrahedral; (d) a 6 110 dislocations tetrahedron with Shockley partial dislocations; and (e) double tetrahedron (1/6 ratio of indices not shown).
Metals 11 00582 g007
Figure 8. (a) Deformation twins and stacking faults in CuAl alloy and (b) dislocation cells in nickel using transmission electron microscopy: A—cell wall; B—sliding dislocation; C—microtwin; D—stacking fault; and E—microband.
Metals 11 00582 g008
Figure 9. The stress–strain curve of (a) CuAl alloy and (b) nickel single crystals with a highlighted fragment showing areas of hardening and softening.
Metals 11 00582 g009
Figure 10. The fraction of the length of each type of dislocation (P) depending on the strain: (a) CuAl alloy and (b) nickel. The black line is the stress–strain curve.
Metals 11 00582 g010
Table 1. Calculated and experimental values of stacking fault energy.
MaterialSimulation 300 K, mJ/m2Experiment, mJ/m2
Ni136150
Cu-13at.%Al173
Publisher’s Note: MDPI stays neutral with regard to jurisdictional claims in published maps and institutional affiliations.