1. Introduction
The accurate prediction of failure during sheet metal forming is a big challenge in the numerical design of sheet metal forming processes. To describe the largest strain that sheet metals can plastically deform without failure during stamping, Goodwin [
1] introduced the idea of forming limit curves (FLCs), which set the maximum plastic deformation in the space of the major and minor strains. Since its proposal, FLC has been widely used to define the forming limit of sheet metal forming. An FLC is generally measured by experiments, which are designed for linear strain paths. However, the sheet metal forming processes of complex panels and multiple-step forming involves dramatic strain path changing during stamping. Experimental studies show that strain path changing strongly influences the formability of sheet metals. Graf and Hosford [
2] conducted experiments of AA2008-T4 to investigate the effect of strain path changing on FLCs. One year later, Graf and Hosford [
3] shared their experimental results on the influence of strain path changing on FLCs of AA6111-T4. Their experiments have shown that the experimental FLCs under proportional strain path are proper for the failure prediction of sheet metal forming with approximately linear strain paths, but the FLC is somewhat wrongly used for stamping of complex-shaped panels or multiple-step forming with strong strain path changing.
Theoretically, Hill [
4] proposed a localized necking model for the failure modeling of sheet metal forming. Meanwhile, Swift [
5] introduced a diffuse necking model. Generally, Hill’s localized necking model is used to predict the left-hand side of an FLC, while Swift’s diffuse necking model is used to predict the right-hand side FLC. Therefore, these two models are generally combined together and referred to as the Hill-Swift model. Marciniak and Kuczynski [
6] proposed an imperfection-based model to predict FLCs of sheet metals. The Marciniak-Kuczynski model is widely used and analyzed since its proposal. The Marciniak-Kuczynski model can be used to take account of the effect of yield functions, strain rate effect and even microstructures in FLC prediction [
7]. Cao et al. [
8] applied the Marciniak-Kuczynski model to investigate the effect of strain path changing on FLCs. Stoughton [
9] showed that the forming limit for both proportional and nonproportional loading could be explained from a single criterion, which is based on the state of stress rather than the state of strain, thereby introducing the definition of forming a limit stress diagram. Based on the crystal plasticity theory in conjunction with the Marciniak-Kuczynski model, Wu et al. [
10] suggested that the forming limit stress diagram is much more favorable than the forming limit strain diagram in representing forming limits in the numerical simulation of sheet metal forming processes. Alternatively, Stoughton and Yoon [
11] proposed a new type of forming limit diagrams based on a polar representation of the effective plastic strain and showed that the new diagram is an effective solution to the problem of nonlinear effects. Korkolis and Kyriakides [
12] studied the effect of strain path changing effect on the failure of inflated aluminum tubes and concluded that the amount of plastic pre-strain also affects the failure stress and strain during tube hydroforming.
Since the beginning of the 20th century, ductile fracture has attracted increasing efforts for failure prediction in sheet metal forming as the wide employment of advanced high strength steels and aluminum alloys. It is because the lightweight metals fail mainly by a ductile fracture with little necking [
13,
14]. Various ductile fracture criteria were proposed for the modeling of ductile fracture under different loading conditions for sheet metals. Bai and Wierzbicki [
15] modified the Mohr-Coulomb criterion for ductile fracture modeling of advanced high strength steels. Mohr and Marcedat [
16] proposed a phenomenological Hosford-Coulomb model for the prediction of ductile fracture at low-stress triaxiality. Ductile fracture is observed to take place along the direction of the maximum shear stress in different stress states of compression, shear and tension [
17]. Based on this experimental observation, Lou et al. [
18] proposed a shear ductile fracture criterion based on the micro-mechanism of ductile fracture for the nucleation, growth and coalescence of voids. Thereafter, two modifications were developed to consider a changeable cutoff value for the stress triaxiality [
19] and to describe fracture in shear, uniaxial tension, plane strain tension and equibiaxial tension of sheet metals [
20]. Hu et al. [
21] and Mu et al. [
22] developed two different fracture models considering the effect of the maximum shear stress. Sun et al. [
23] proposed a new method by directly utilizing original measured data of the stress-strain relation in the Marciniak-Kuczynski model to predict the FLC of an aluminum alloy sheet. Cao et al. [
24] developed a fracture model coupled with the Johnson-Cook plasticity model to investigate the strain rate effect for 7050-T7451 aluminum alloy.
Though ductile fracture criteria are increasingly used in the fracture prediction of sheet metal forming, the effect of strain path changing is still not clear. In this study, the strain path changing effect is investigated by using a recently proposed ductile fracture criterion [
18], which is referred to as DF2012. The DF2012 criterion is first calibrated for AA6111-T4 under proportional loading. Then the calibrated criterion is used to describe the pre-strain effect of uniaxial tension, plane strain tension and equibiaxial tension on the fracture-forming limit curve (FFLC). The predicted FFLCs under bilinear strain paths are compared with experimental results to analyze its predictability of the pre-strain influence on FFLCs. Reasons are discussed for the improper prediction of FFLCs under some strain path pairs, such as uniaxial tension followed by equibiaxial tension and equibiaxial tension followed by plane strain tension.
2. Modeling of Plastic Deformation
The material used in this study was an aluminum alloy sheet of AA6111-T4. Its thickness was 1.05 mm. The chemical composition of the alloy was approximately of 0.85% Si, 0.75% Cu, 0.65% Mg, 0.25% Fe, 0.22% Mn and 0.03% Cr. The grain of the alloy was pancake-shaped. Experiments were conducted using dog bone specimens along three directions of 0°, 45° and 90°. Strain hardening behavior was described by the Hollomon law as
. The anisotropic Lankford values or R-values were also measured along the rolling, diagonal and transverse directions as 0.67, 0.63 and 0.78, respectively. The average R-value was calculated as
= 0.68, and ∆
r was calculated as
= 0.1. ∆r was comparatively small compared with
. Accordingly, normal anisotropy could be assumed for simplicity purposes. All the experiments in this paragraph and the FFLC tests under proportional and nonproportional loading paths below were conducted by Graf and Hosford [
3]. Readers are strongly suggested to refer to the original paper by Graf and Hosford [
3] for the details of the experimental procedures and results.
FFLCs under proportional loading were measured by the standard punch stretching tests for AA6111-T4 sheets. The strains were measured by the distortion of circles for, which its diameter was 2.54 mm before stretching. The measured fracture strain was about 0.35 at uniaxial tension, 0.17 under plane strain tension and 0.244 at equibiaxial tension. The sheets were also prestrained in uniaxial tension, plane strain tension and biaxial tension to different strain levels. Then specimens were cut from the prestrained sheets and stretched further by punch stretching to measure the FFLC for each combination of prestrain strain paths and levels. The measured FFLC under bilinear strain paths was used for the evaluation of the analytical prediction of fracture limits. Details of FFLC experiments were suggested to refer to Graf and Hosford [
3].
For the sake of simplicity, the material is assumed to be normal anisotropic. There are many anisotropic yield functions proposed for both sheet and bulk metals [
25,
26,
27,
28,
29,
30,
31,
32]. The anisotropic Drucker function [
33] is used to describe the normal anisotropy of the metal in this study. Similar to the non-quadratic yield functions, the anisotropic Drucker function can differentiate the difference in yielding between face-centered cubic (FCC) and body-centered cubic (BCC) metals. The anisotropic Drucker function is formulated as:
In the anisotropic Drucker function above,
and
are referred to as the second and third invariants of
which is computed as follows:
where
is computed as:
Here
is the fourth-order linear transformation given by:
Then the linearly transformed stress tensor
can be explicitly expressed as:
For sheet metal forming under plane-stress conditions, the linearly transformed tensor is computed as:
In the anisotropic Drucker function, the effect of the third invariant is modified by which is calibrated to be 1.226 and 2.0 for BCC and FCC metals. Moreover, six anisotropic parameters are introduced in the linear transformation tensor of , among which four are related to anisotropic plastic behavior. When the anisotropic parameters are with , the anisotropic Drucker function reduces to isotropic for FCC metals, while the isotropic Drucker function for BCC metals is recovered when with .
The derivatives of the anisotropic Drucker function for plane-stress conditions are calculated as follows:
with
and:
is the vector transformed in Equation (7) and calculated in the forms of:
Considering the incompressibility of plastic deformation for continuum metals, the thickness strain can be computed as .
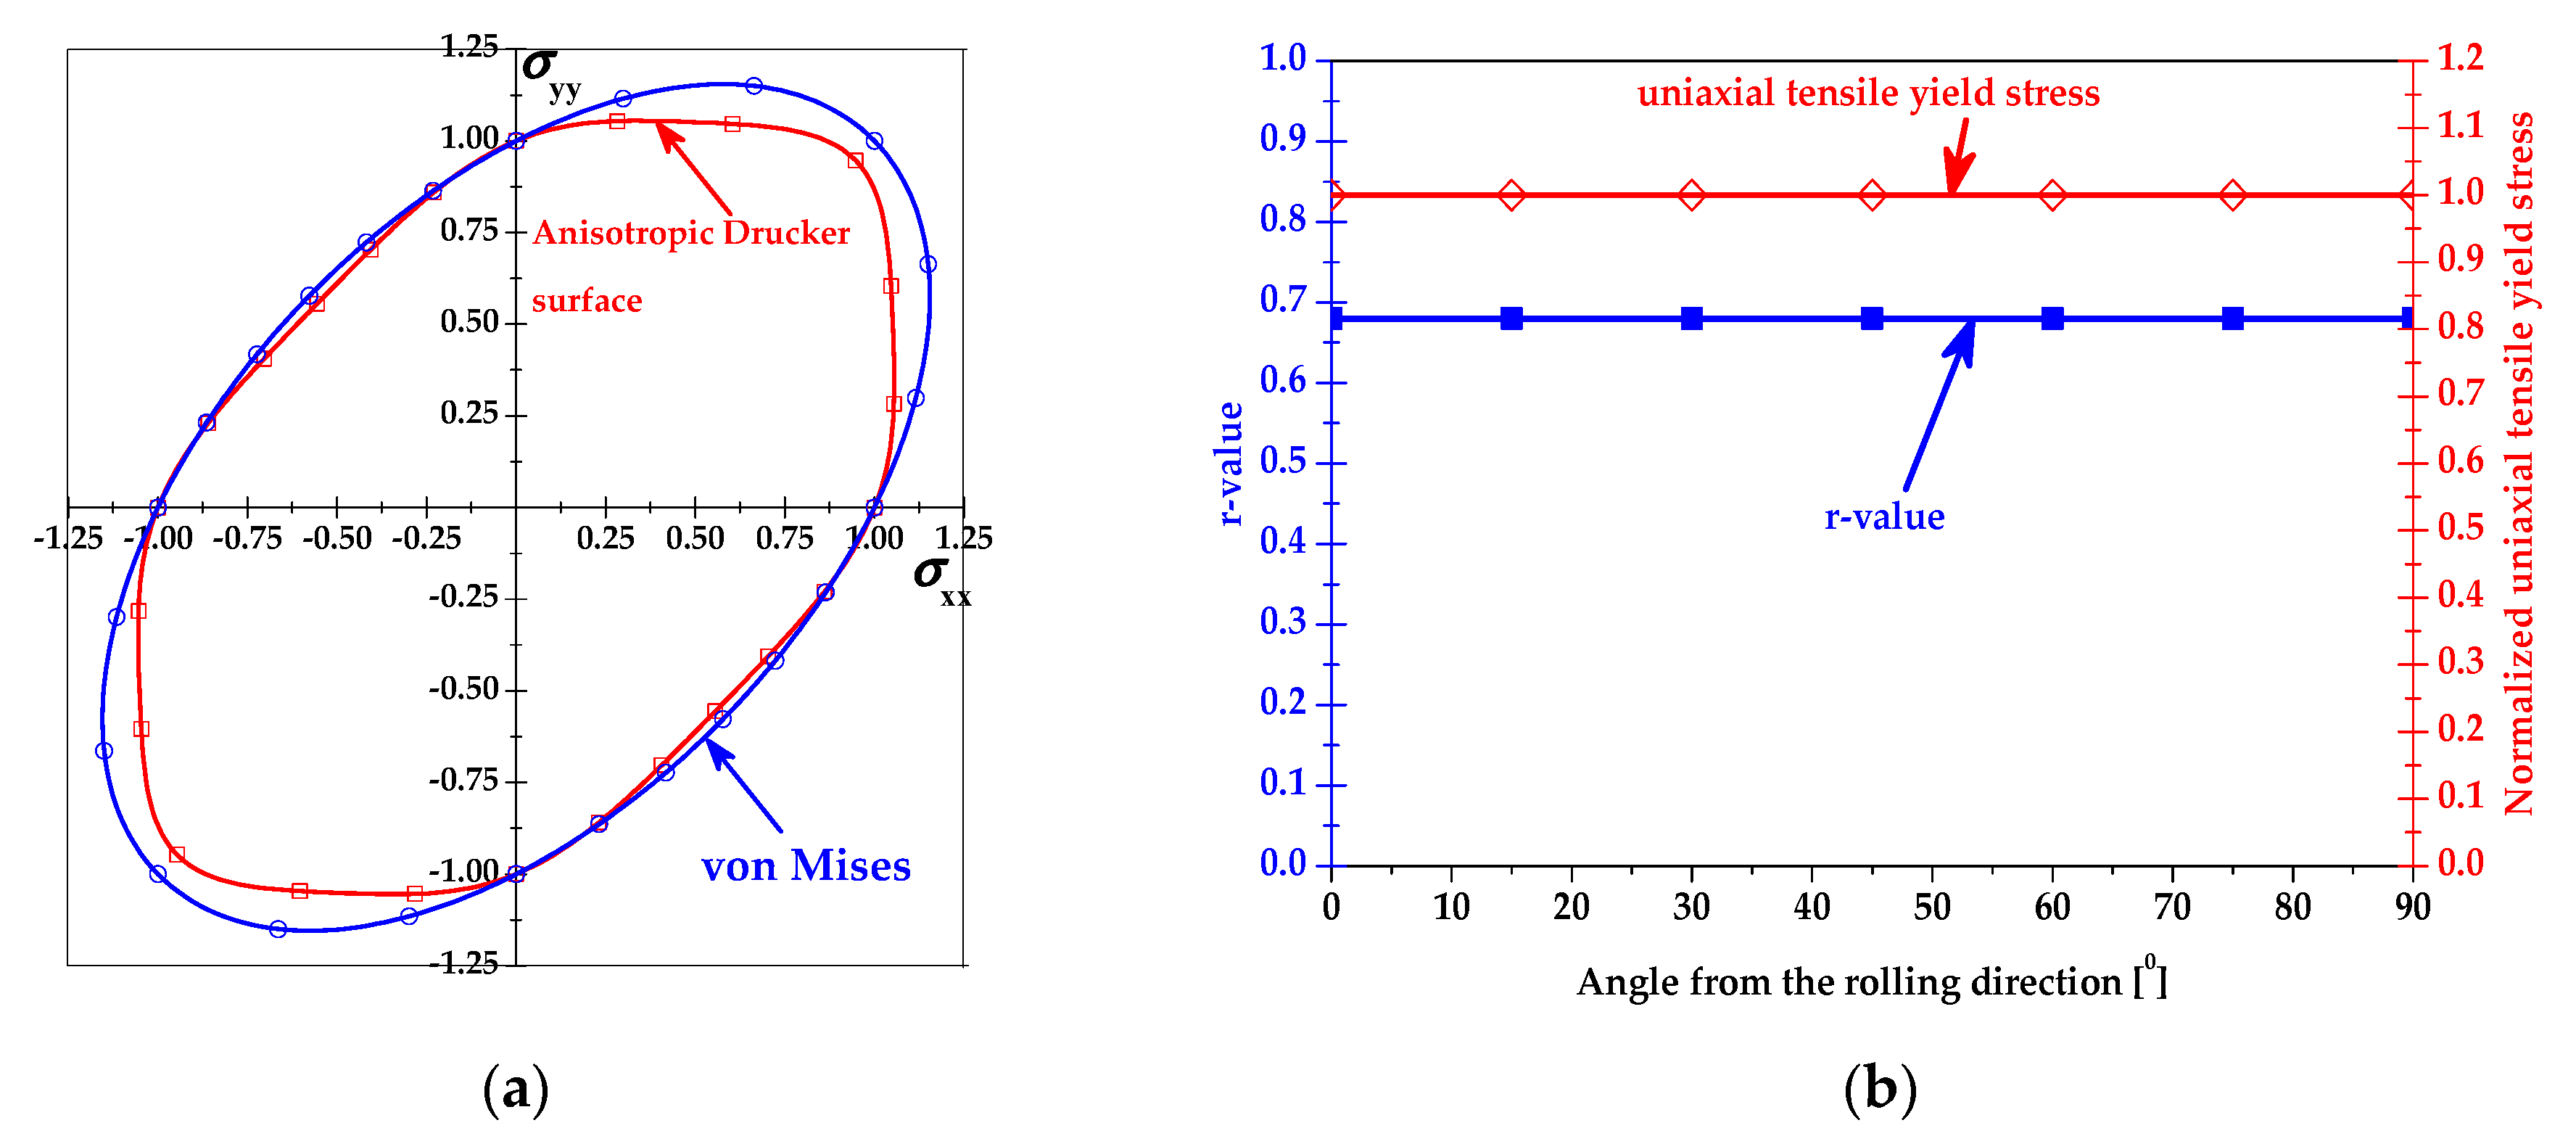
For AA6111-T4, the anisotropic Drucker function was calibrated by the mean R-values by the assumption that the material was normal anisotropic. The calibrated anisotropic parameters are listed in
Table 1. The AA6111-T4 yield surface is described in
Figure 1. The anisotropic Drucker yield surface was noted to describe lower strength under plane strain tension than the von Mises function. Furthermore, the predicted R-values and uniaxial tensile yield stress were insensitive to the loading direction since normal anisotropy was assumed for AA6111-T4. The predicted R-value was 0.68, which was identical to the experimental mean R-value.
3. Shear Ductile Fracture Criterion
To model fracture in metal forming processes, various ductile fracture criteria [
15,
16,
17,
18,
19,
20,
21,
22] were developed based on different assumptions. Recently, Lou et al. [
18] developed a micro-mechanism-inspired ductile fracture criterion for nucleation, growth and shear coalescence of voids in the form of:
where
represents the equivalent stress,
is the largest shear stress,
is the stress triaxiality, and
is the equivalent plastic strain at the onset of fracture.
is computed as
with
as the mean stress. There are three fracture parameters of
and
which need to be calibrated by experimental data points. For a sheet metal stretched by two principal stresses along RD and TD, the stress state is assumed to be
and the stress ratio is defined as
. Then the strain increment ratio under this loading condition is computed with the assumption of the associate flow rule as below:
The strain increments of
and
are given in Equations (8) and (9), respectively. Moreover,
is defined as the ratio of the stress
to the anisotropic Drucker effective stress computed in Equation (1) as below:
Under biaxial tension with
, the normalized maximum shear stress is obtained as:
The stress triaxiality is calculated as:
The equivalent plastic strain increment can be calculated with the equation below:
Then the equivalent plastic strain increment is obtained as:
With Equations (24)–(27), the DF2012 criterion under proportional biaxial tension can be reformulated as:
The above equation can be expressed in the form below:
Logarithmic operation is applied on both sides of the above equation, which gives:
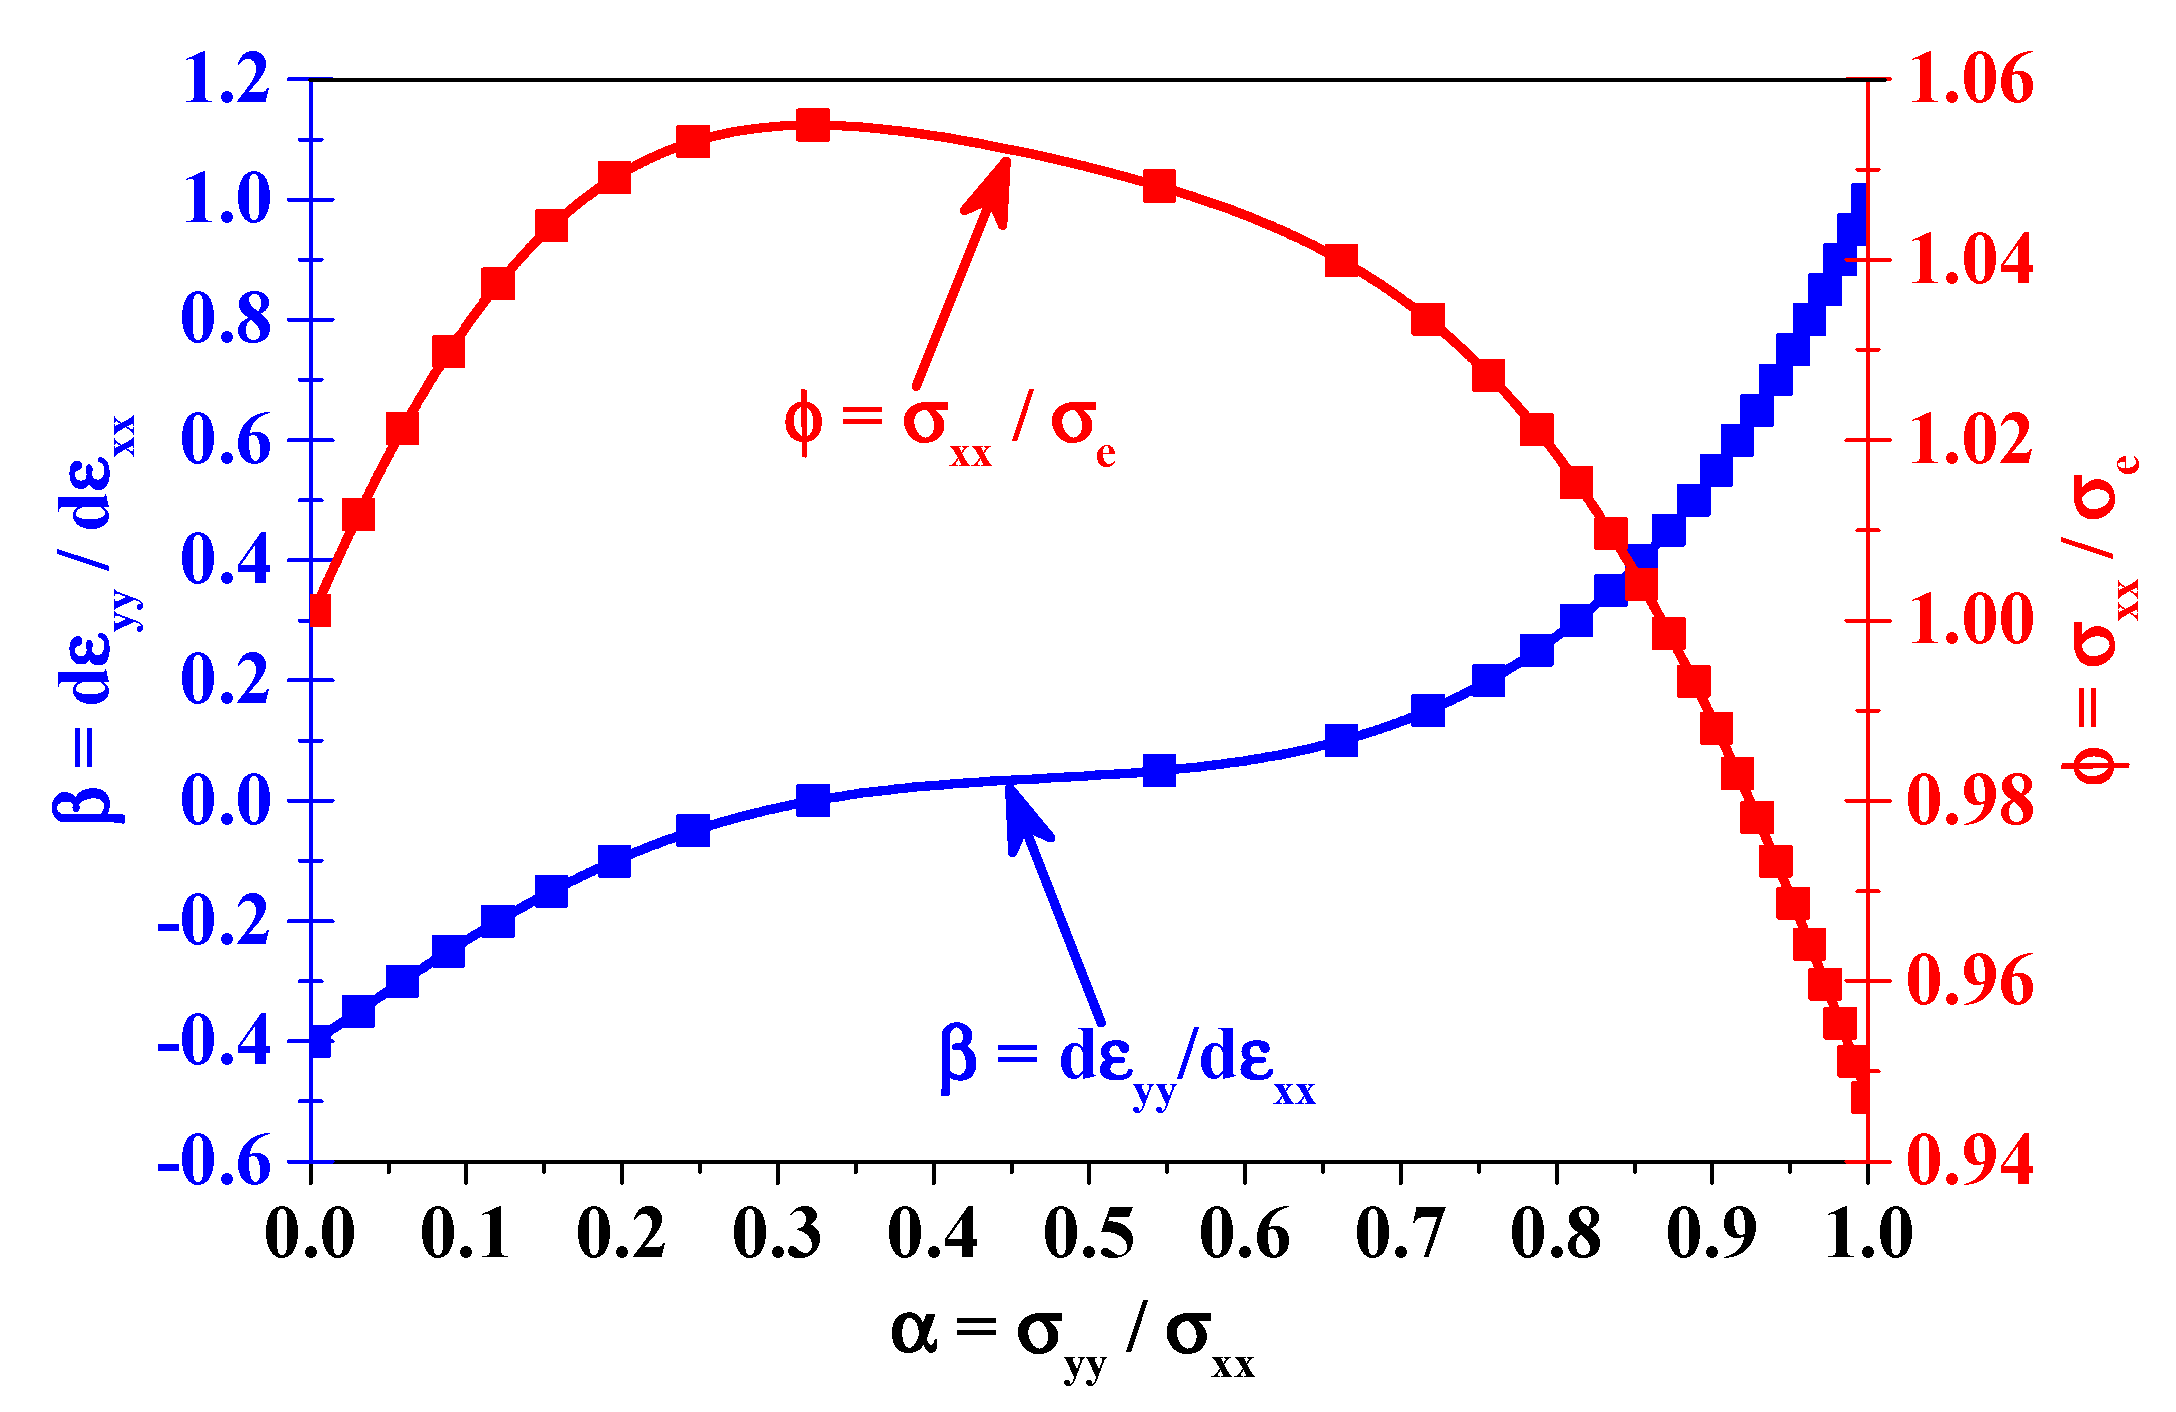
For AA6111-T4, the relations between
and
are obtained with the anisotropic Drucker function, as illustrated in
Figure 2.
For uniaxial tension, , and and then , where and are the uniaxial tensile fracture strain components along RD and the equivalent plastic strain to fracture of uniaxial tension.
For plane strain tension,
, and
. Then the DF2012 criterion in Equation (30) reduces to:
with
as the fracture strain component along RD under plane strain tension along RD.
For the equibiaxial tension with
,
, and
. Then the DF2012 criterion in Equation (30) reduces to:
with
as the fracture strain component along RD under equibiaxial tension.
Since
,
and
are solved with Equations (31) and (32) as follows:
4. Modeling of Strain Path Changing Effect on FFLC
Graf and Hosford [
3] conducted forming limit tests for AA6111-T4 from uniaxial tension to equibiaxial tension. The fracture strains were measured for the alloy.
Table 2 summarizes the measured fracture strain pairs under uniaxial tension, plane strain tension and equibiaxial tension. With the analysis in
Section 3 and Equation (33), the fracture parameters of the DF2012 criterion can be easily calculated as
,
and
. For the computation of fracture strain under bilinear strain path, we first assume that the pre-strain strain path is
, the corresponding stress ratio
and the magnitude of the pre-strain
. Then the following strain path, stress ratio and strain increment up to fracture are denoted as
,
and
. According to Equation (28), it is easy to obtain the secondary strain up to fracture by solving Equation (34) as below:
Then the fracture limit strain with a pre-strain of
and strain path of
followed by the strain path of
is obtained as:
Then the FFLC under bilinear strain paths are easily predicted by keeping as uniaxial tension, plane strain tension, equibiaxial tension or other strain paths and setting as different values prestrain, and then varying the strain path of secondary plastic deformation of from uniaxial tension to equibiaxial tension.
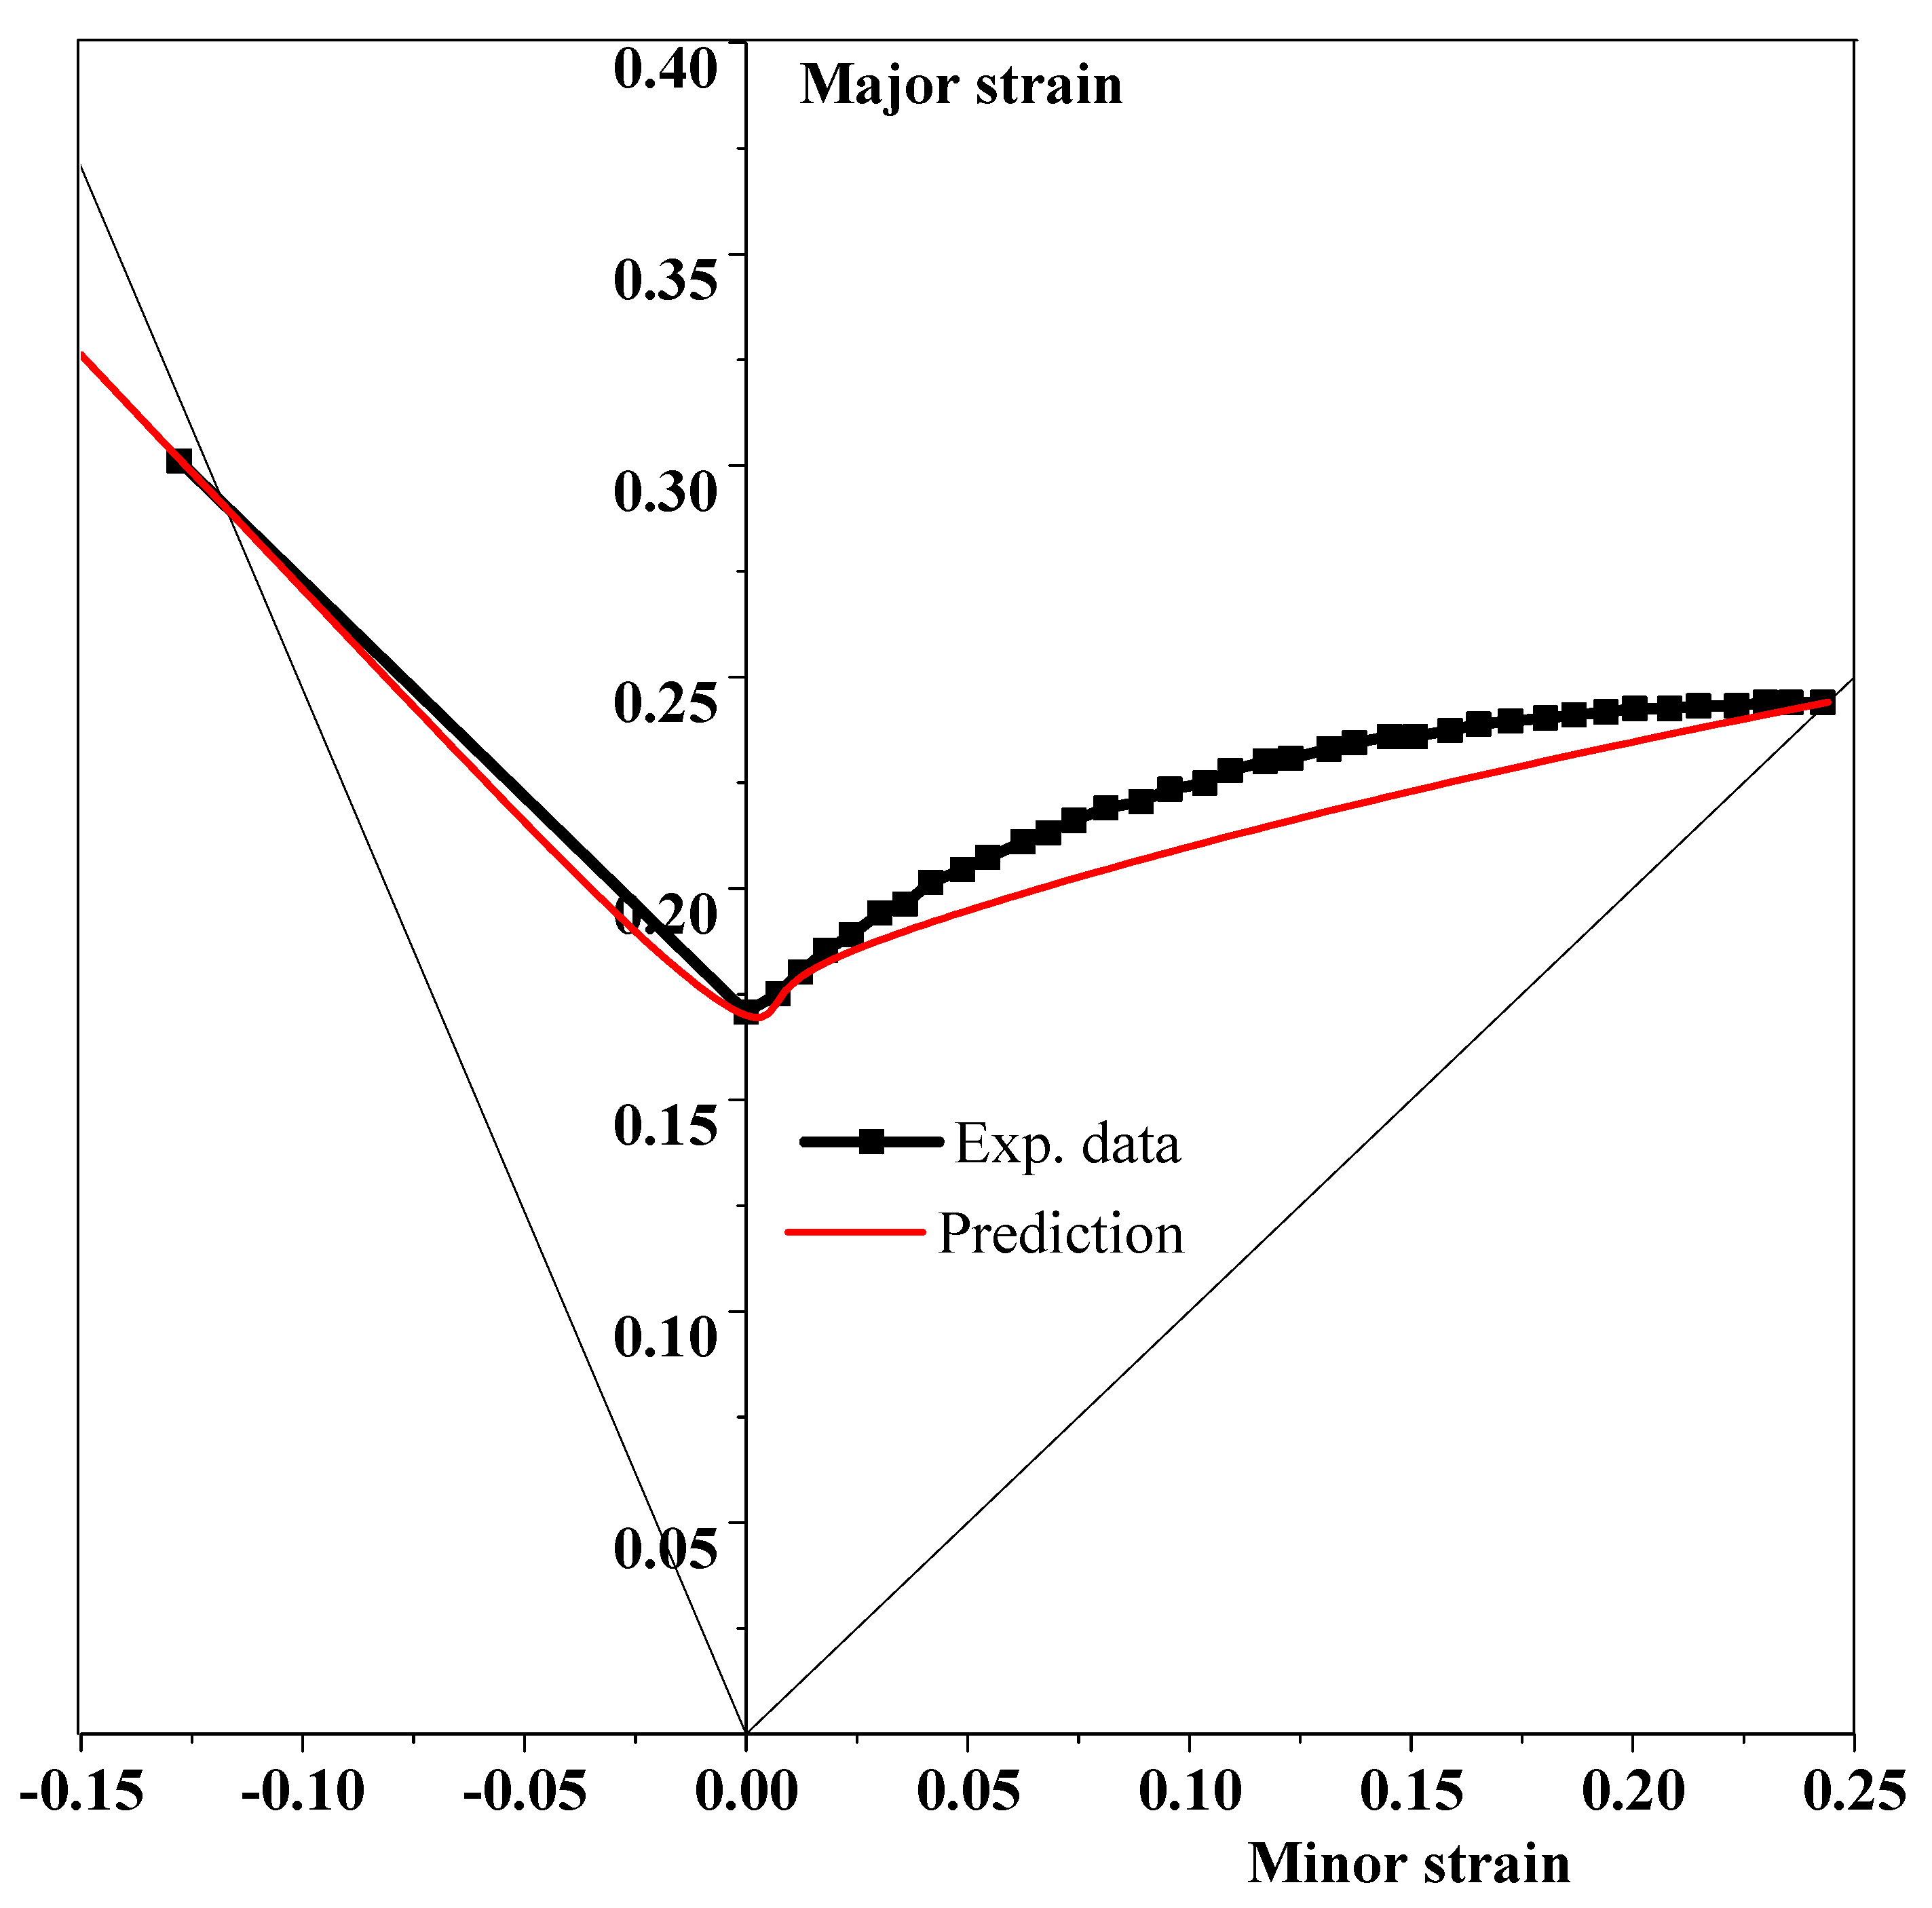
The FFLC was predicted by the calibrated DF2012 criterion as compared with experimental measurement in
Figure 3. It was obvious that the DF2012 criterion predicts the FFLC of AA6111-T4 accurately from uniaxial tension to equibiaxial tension. The difference between prediction and experimental measurement was acceptable for the failure modeling of sheet metal.
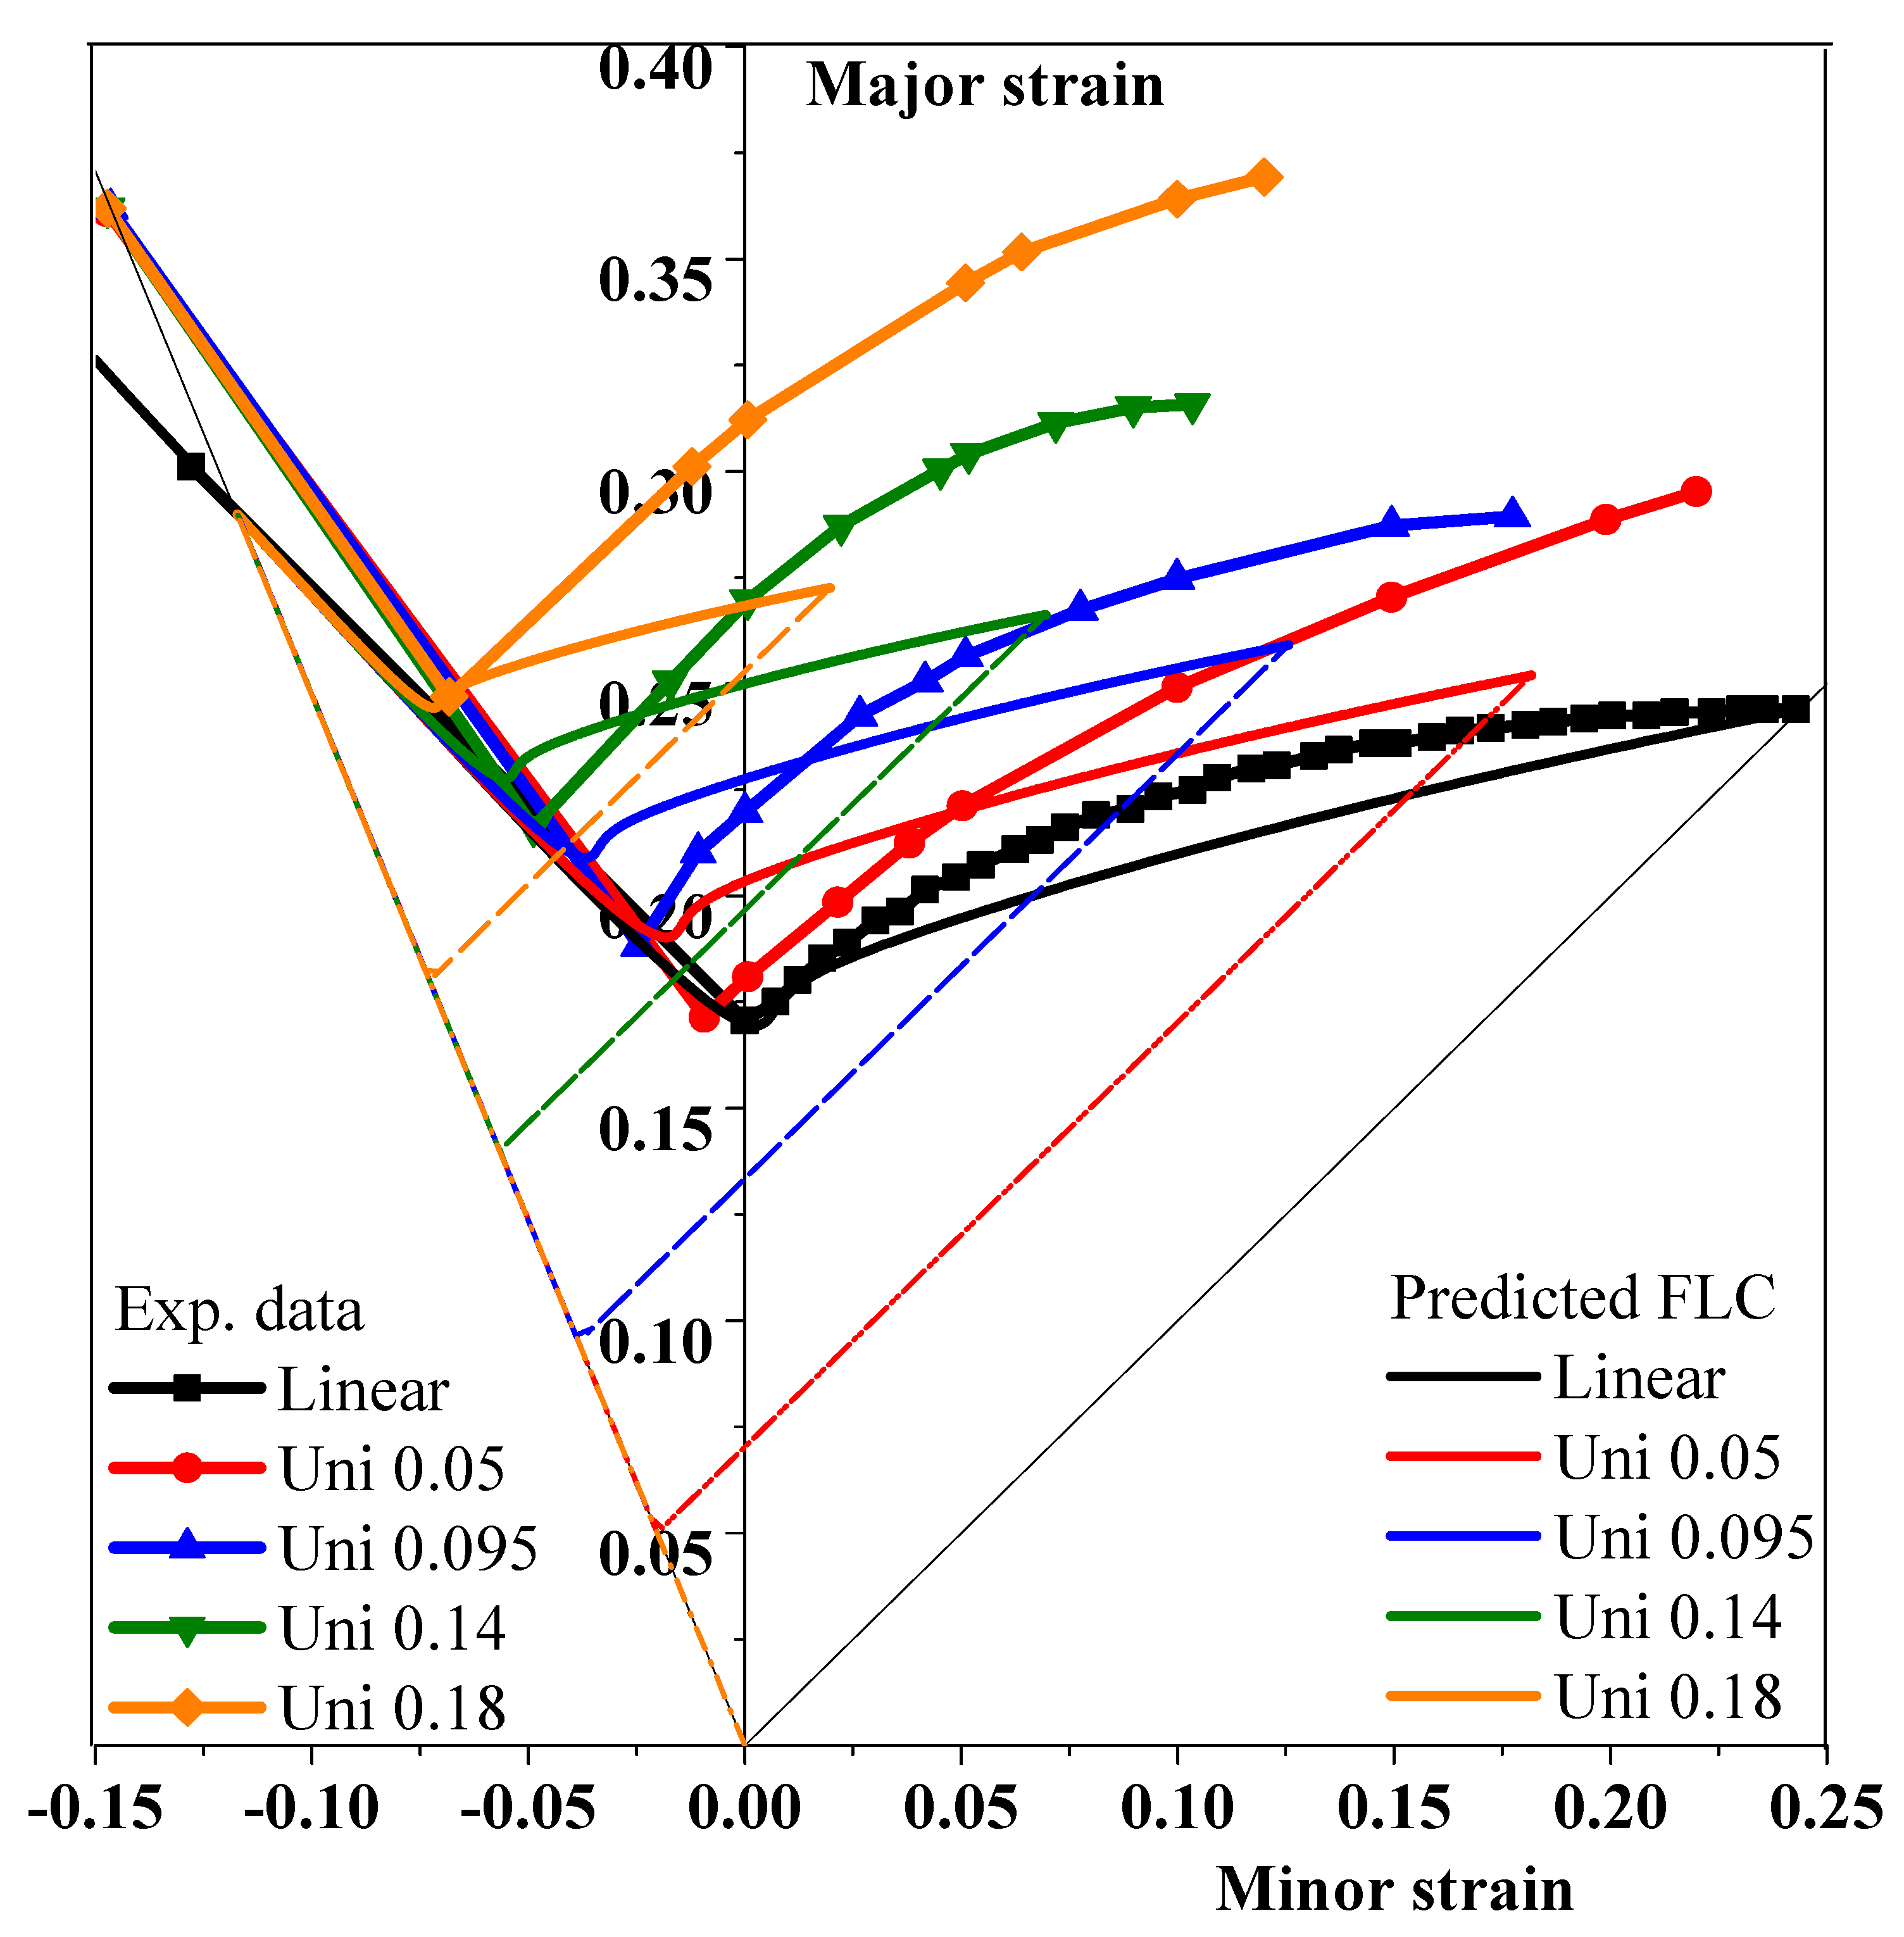
The effect of pre-strain under uniaxial tension was theoretically predicted by the DF2012 criterion and compared with experimental results in
Figure 4. From both prediction and experiments, pre-strain under uniaxial tension had little impact on the fracture strain between uniaxial tension and plane strain tension. On the other hand, the pre-strain under uniaxial tension tremendously improves the formability when the following strain path was from plane strain tension to balanced biaxial tension. The improvement in fracture strain reached the maximum when the strain path was first uniaxial tension followed by balanced biaxial tension. This observation indicated that forming processed and tools could be designed to reach better drawability of metal sheets when the strain path follows the sequence of uniaxial tension and equibiaxial tension. Moreover, it was noted that the fracture strain under uniaxial tension followed by uniaxial tension was about 0.06 higher than that of solely uniaxial tension. This was because the unloading improves the fracture strain for uniaxial tension, unloading and reloaded under uniaxial tension. Finally, the experimental measured FFLC with the second strain path from plane strain tension to balanced biaxial tension was higher than the FFLC from prediction. The prediction error was due to the simple isotropic hardening was assumed in this study. The unloading effect was expected to be the reason for higher fracture strain for these bilinear strain paths, but it was neglected in the plasticity modeling. Analytically, kinematic hardening or anisotropic hardening were suggested to be employed for better predicting accuracy of FFLCs for strain path changing effect.
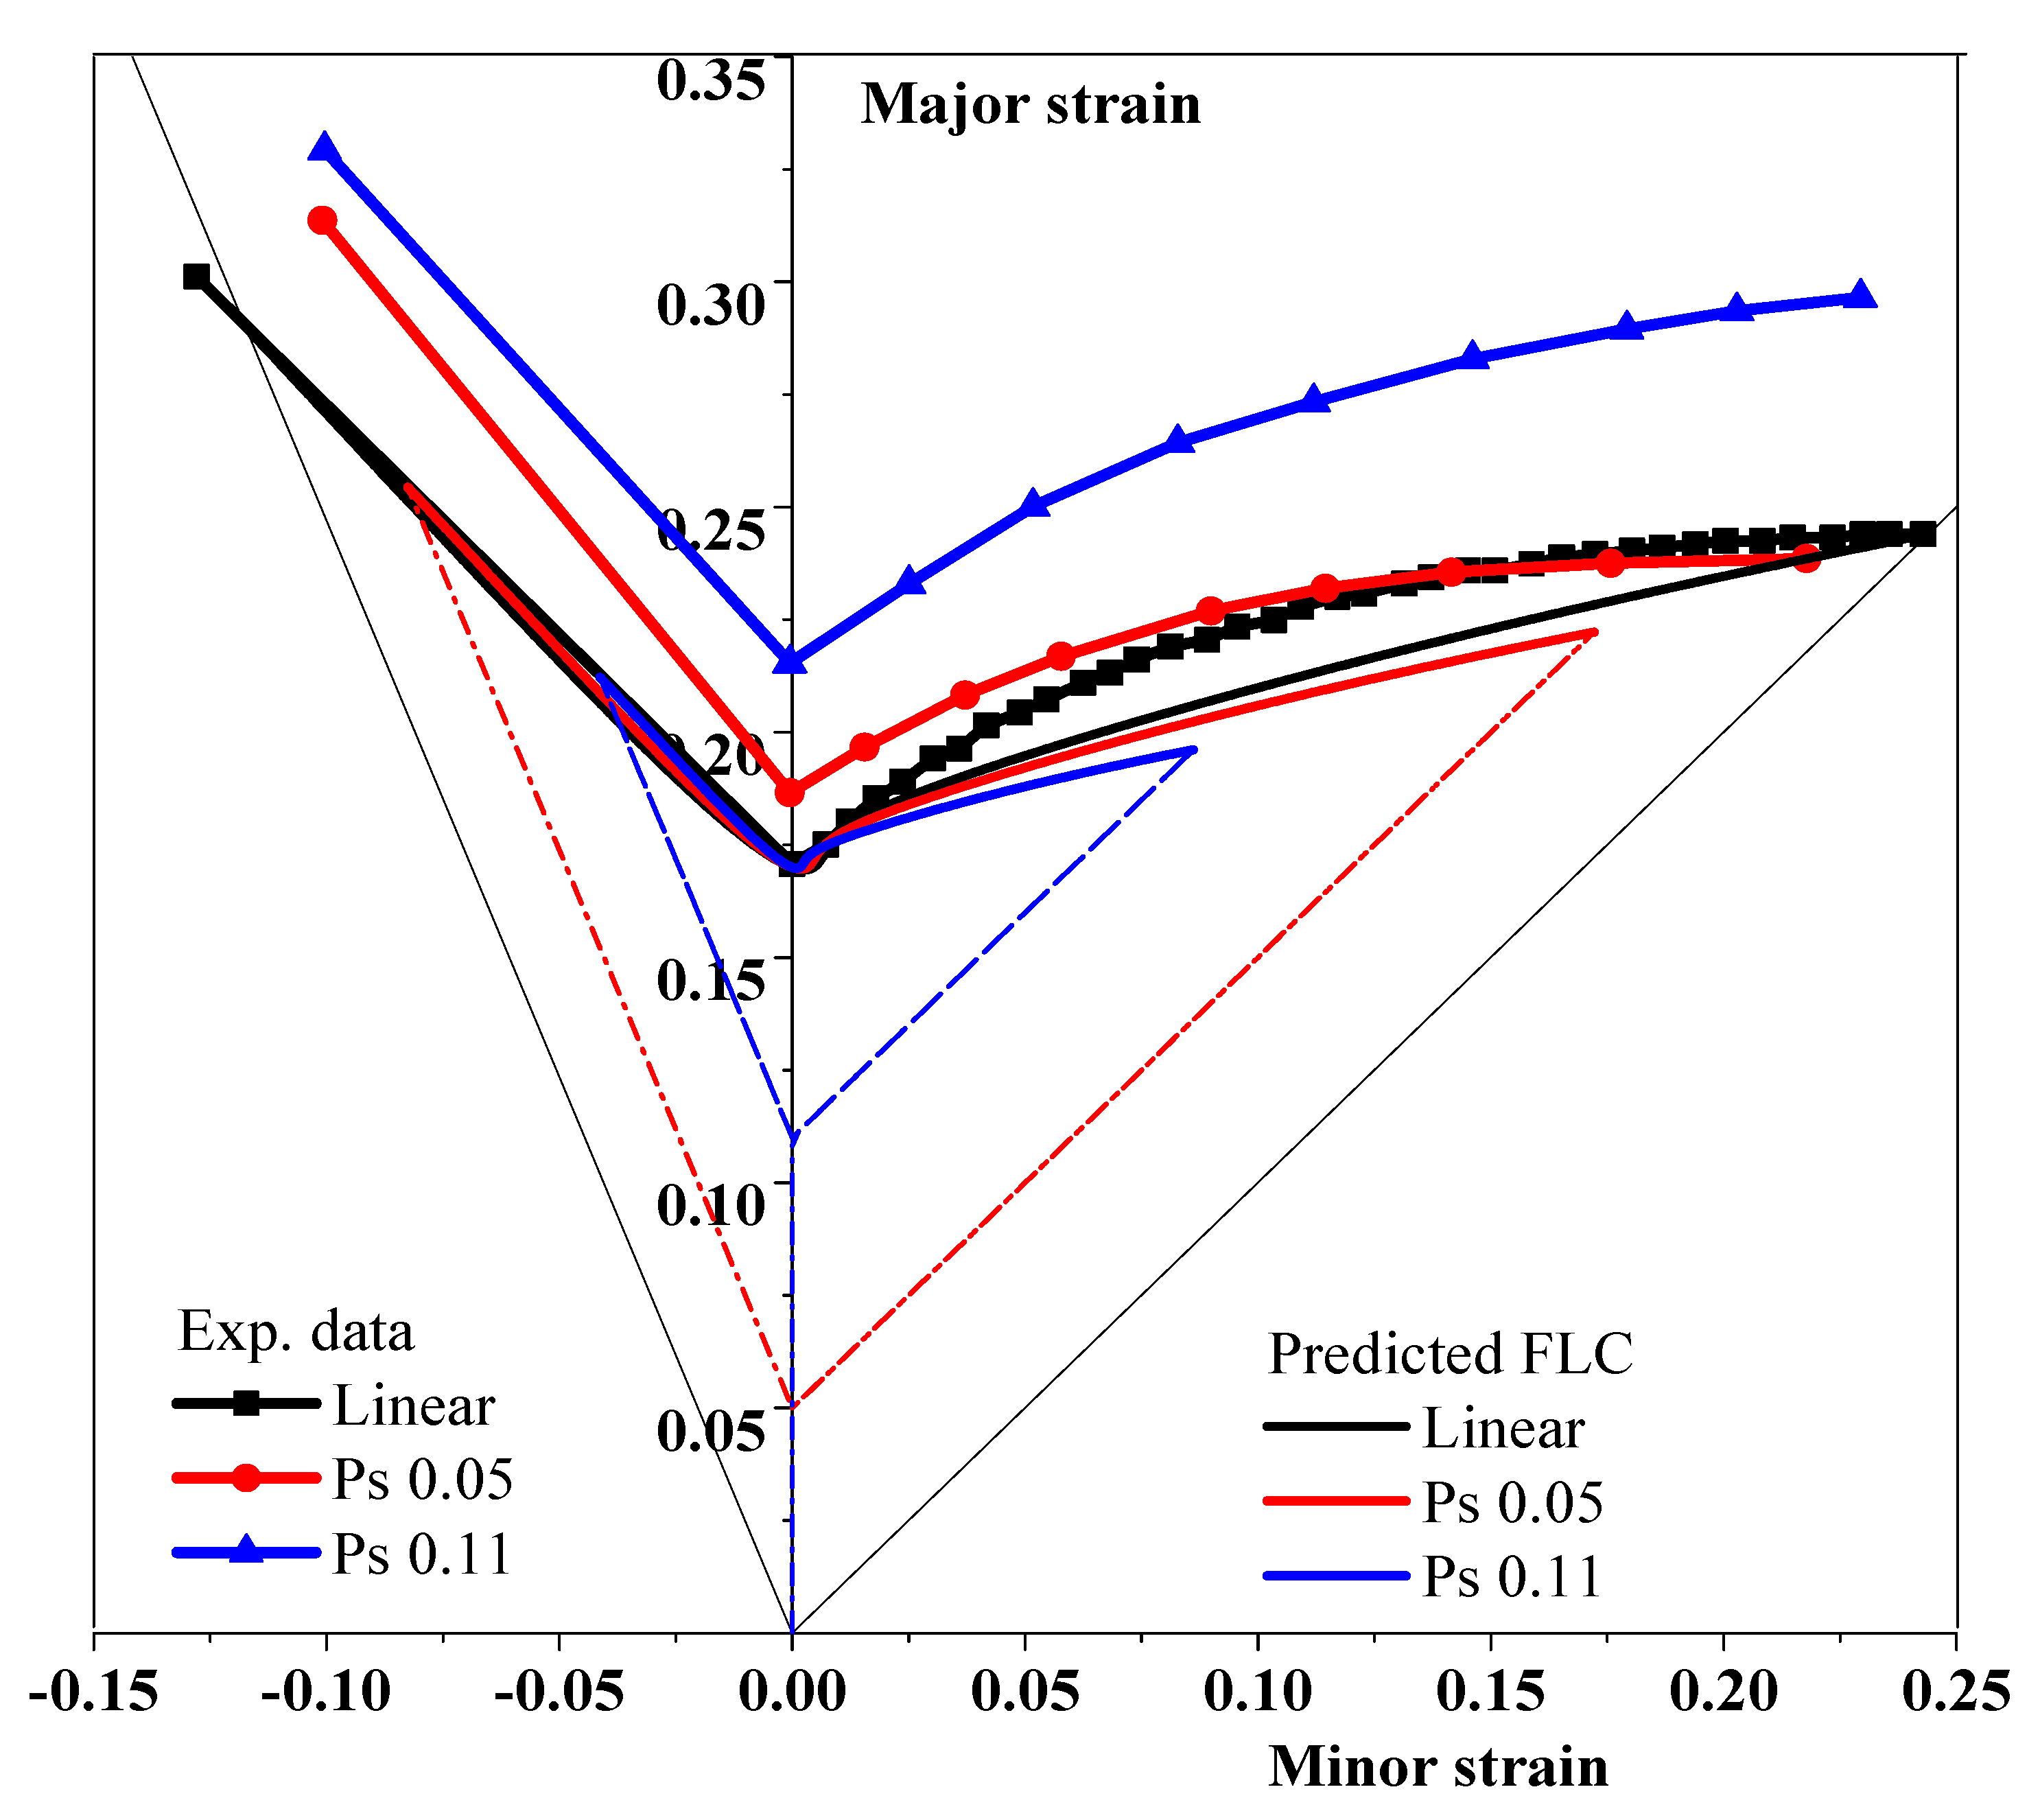
The predicted effect of the pre-strain under plane strain tension was compared with experimental results in
Figure 5. First, it should be noted that there was a quite large difference in experimental fracture strain between monotonic loading and loading-unloading-reloading even with the identical strain path. Taking the plane strain as an example, 0.05 prestrain under plane strain tension improved about 9.4% fracture strain under plane strain tension than monotonic plane strain tension, as observed in
Figure 5. 0.11 prestrain under plane strain tension raised the fracture strain by about 26.2% compared with the fracture strain under monotonically plane strain tension. This could not be explained theoretically here with isotropic hardening. The evolution of yield surfaces was recommended to be considered to improve the analytical prediction accuracy of this phenomenon. This would be attributed to annealing or some kind of damage recovering of the alloy or cyclic loading effect under the identical strain path. Moreover, experimental results show that the pre-strain under plane strain tension had little effect on the shape of FFLCs, which was also observed by the prediction of the DF2012 criterion. The prediction also demonstrated that the pre-strain effect under plane strain tension was negligible for the left-hand side of FFLCs, but slightly lowers the right-hand side FLC, even though the effect was not so obvious. To summarize, the prestrain under plane strain tension had little effect on the formability when the following strain path was between uniaxial tension and plane strain tension, but slightly reduces the ductility of metals in case that the secondary strain path was from plane strain tension to equibiaxial tension. However, the comparison shows that there was a large potential for the improvement of fracture modeling under stretching after plane strain tension. One of the improving approaches was to take the evolution of yield surfaces or kinematic hardening into account instead of simple isotropic hardening assumption.
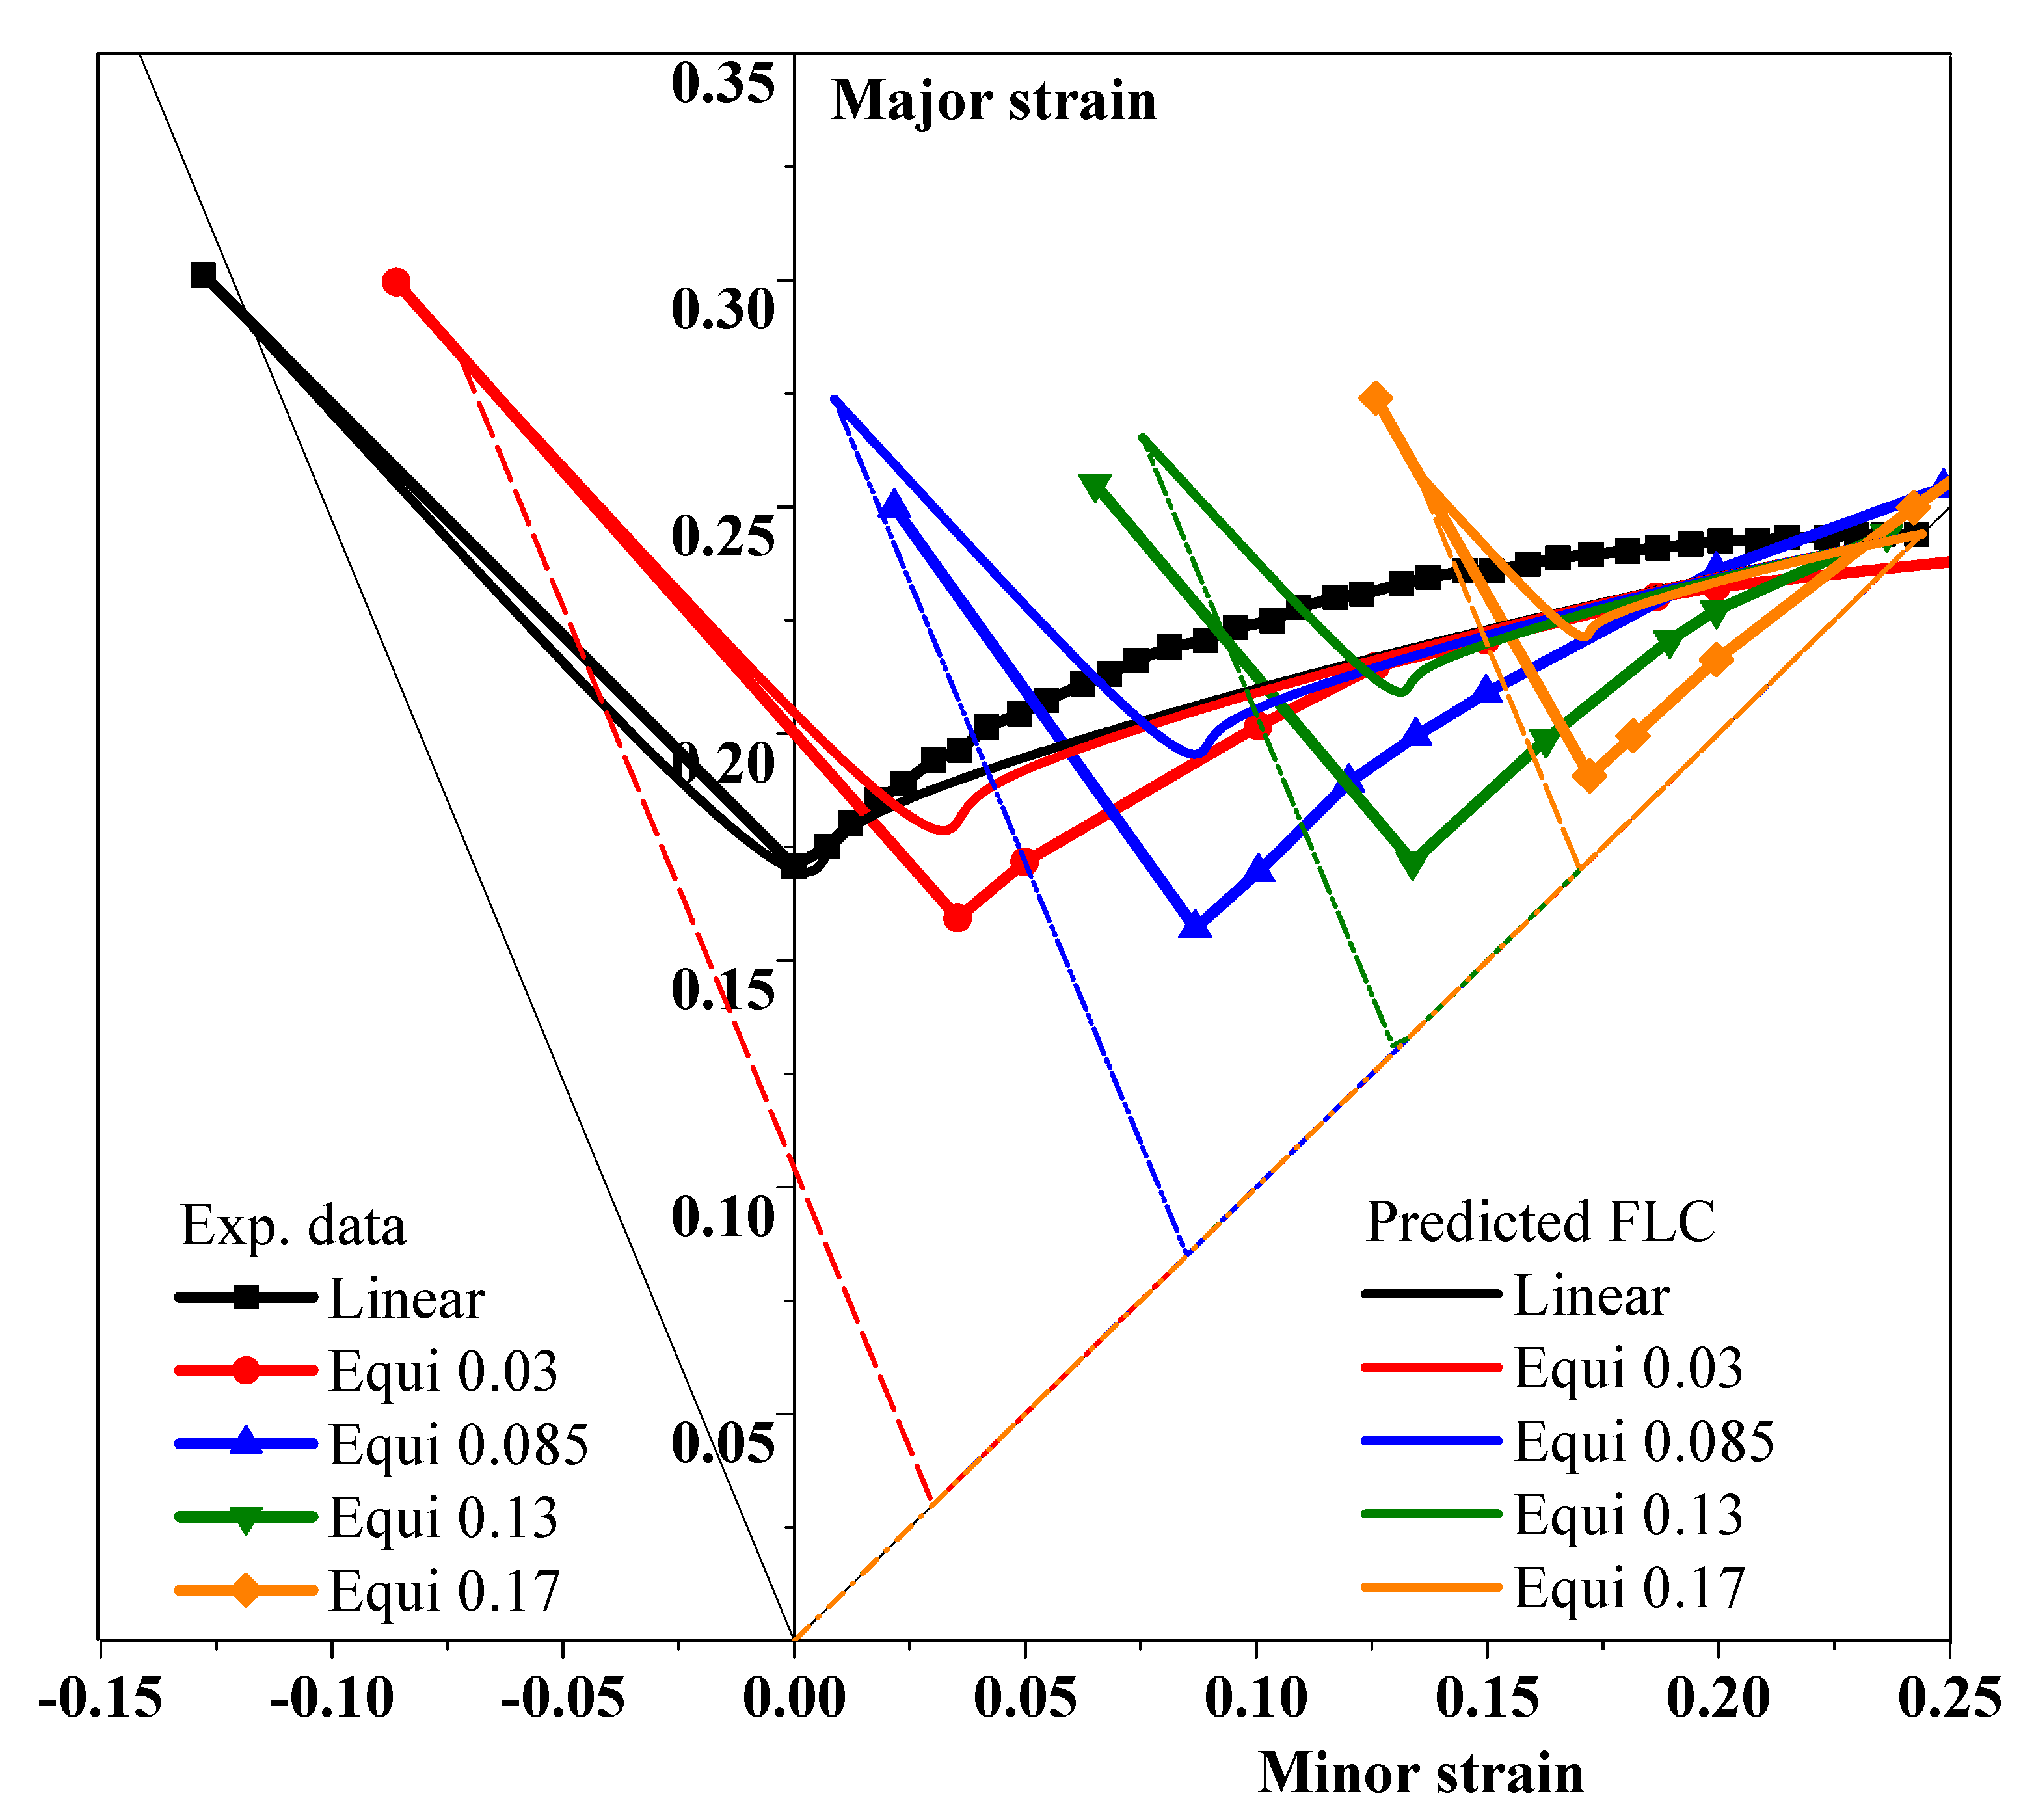
The effect of pre-strain under equibiaxial tension was compared between experiments and the DF2012 prediction in
Figure 6. Both experiments and prediction show that the pre-strain of equibiaxial tension lowers the formability of metals for most secondary strain paths, except for the case that the secondary strain path was close to uniaxial tension. However, the predicted effect of pre-strain under equibiaxial tension was less than experimental observation, even though a similar effect was predicted by the DF2012 criterion. The experimental results and the DF2012 prediction suggest that the secondary strain paths between plane strain tension and equibiaxial tension after prestrain under equibiaxial tension should be avoided for better formability of sheet metals in the design of forming processed and tool geometry, but the strain path of equibiaxial tension followed by uniaxial tension was preferred since this special loading path improves the deformation limits before fracture. The results also show that the fracture predicting error of equibiaxial tension followed by plane strain tension was very large, and approaches should be proposed to better model the strain path changing effect on fracture limit for this bilinear strain path.
Author Contributions
Conceptualization, S.L. and Y.L.; methodology, S.L. and Y.L.; software, S.L., Y.L. and Y.X.; validation, S.L., Y.L., and G.Y.; formal analysis, S.L. and Y.L.; investigation, S.L., Y.L., G.Y. and Y.X.; resources, S.L. and Y.L.; data curation, S.L. and Y.L.; writing—original draft preparation, S.L. and Y.L.; writing—review and editing, S.L. and Y.L.; visualization, S.L., Y.L. and G.Y.; supervision, S.L. and Y.L.; project administration, S.L. and Y.L.; funding acquisition, S.L. and Y.X. All authors have read and agreed to the published version of the manuscript.
Funding
This research was funded by the National Natural Science Foundation of China (grant no. 52075423 and 51905551) and the Taizhou Science and Technology Project of Zhejiang (grant no. 2002gy14).
Data Availability Statement
Not applicable.
Conflicts of Interest
The authors declare no conflict of interest.
References
- Goodwin, G.M. Application of strain analysis to sheet metal forming problems in the press shop. SAE Trans. 1968, 77, 380–387. [Google Scholar]
- Graf, A.; Hosford, W. Effect of changing strain paths on forming limit diagrams of Al 2008-T4. Metal. Trans. A 1993, 24, 11. [Google Scholar] [CrossRef]
- Graf, A.; Hosford, W. The influence of strain-path changes on forming limit diagrams of Al6111 T4. Int. J. Mech. Sci. 1994, 36, 897–910. [Google Scholar] [CrossRef]
- Hill, R. On discontinuous plastic states, with special reference to localized necking in thin sheets. J. Mech. Phys. Solids 1952, 1, 19–30. [Google Scholar] [CrossRef]
- Swift, H.W. Plastic instability under plane stress. J. Mech. Phys. Solids 1952, 1, 1–18. [Google Scholar] [CrossRef]
- Marciniak, Z.; Kuczynski, K. Limit strains in the processes of stretch-forming sheet metal. Int. J. Mech. Sci. 1967, 9, 613–620. [Google Scholar] [CrossRef]
- Barlat, F.; Richmond, O. Prediction of tricomponent plane stress yield surfaces and associated flow and failure behavior of strongly textured f.c.c polycrystalline sheets. Mater. Sci. Eng. 1987, 95, 15–29. [Google Scholar] [CrossRef]
- Cao, J.; Yao, H.; Karafillis, A.; Boyce, M.C. Prediction of localized thinning in sheet metal using a general anisotropic yield function. Int. J. Plast. 2000, 16, 1105–1129. [Google Scholar] [CrossRef]
- Stoughton, T.B. A general forming limit criterion for sheet metal forming. Int. J. Mech. Sci. 2000, 42, 1–27. [Google Scholar] [CrossRef]
- Wu, P.D.; Graf, A.; MacEwen, S.R.; Lloyd, D.J.; Jain, M.; Neale, K.W. On forming limit stress diagram analysis. Int. J. Solids Struct. 2005, 42, 2225–2241. [Google Scholar] [CrossRef]
- Stoughton, T.B.; Yoon, J.W. Path independent forming limits in strain and stress spaces. Int. J. Solids Struct. 2012, 49, 3616–3625. [Google Scholar] [CrossRef]
- Korkolis, Y.P.; Kyriakides, S. Path-dependent failure of inflated aluminum tubes. Int. J. Plast. 2009, 25, 2059–2080. [Google Scholar] [CrossRef]
- Bao, Y.B.; Wierzbicki, T. On fracture locus in the equivalent strain and stress triaxiality space. Int. J. Mech. Sci. 2004, 46, 81–98. [Google Scholar] [CrossRef]
- Lou, Y.; Huh, H. Prediction of ductile fracture for advanced high strength steel with a new criterion: Experiments and simulation. J. Mater. Process. Tech. 2013, 213, 1284–1302. [Google Scholar] [CrossRef]
- Bai, Y.L.; Wierzbicki, T. Appliation of extended Mohr-Coulomb criterion to ductile fracture. Int. J. Fract. 2010, 161, 1–20. [Google Scholar] [CrossRef]
- Mohr, D.; Marcadet, S.J. Micromechanically-motivated phenomenological Hosford–Coulomb model for predicting ductile fracture initiation at low stress triaxialities. Int. J. Solids Struct. 2015, 67/68, 40–55. [Google Scholar] [CrossRef]
- Lou, Y.; Yoon, J.W.; Huh, H.; Chao, Q.; Song, J.H. Correlation of the maximum shear stress with micro-mechanisms of ductile fracture for metals with high strength-to-weight ratio. Int. J. Mech. Sci. 2018, 146/147, 583–601. [Google Scholar] [CrossRef]
- Lou, Y.; Huh, H.; Lim, S.; Pack, K. New ductile fracture criterion for prediction of fracture forming limit diagrams of sheet metals. Int. J. Solids Struct. 2012, 49, 3605–3615. [Google Scholar] [CrossRef]
- Lou, Y.; Yoon, J.W.; Huh, H. Modeling of shear ductile fracture considering a changeable cut-off value for stress triaxiality. Int. J. Plast. 2014, 54, 56–80. [Google Scholar] [CrossRef]
- Lou, Y.; Chen, L.; Clausmeyer, T.; Tekkaya, A.E.; Yoon, J.W. Modeling of ductile fracture from shear to balanced biaxial tension for sheet metals. Int. J. Solids Struct. 2017, 112, 169–184. [Google Scholar] [CrossRef]
- Hu, Q.; Li, X.F.; Han, X.H.; Chen, J. A new shear and tension based ductile fracture criterion: Modeling and validation. Eur. J. Mech. A Solids 2017, 66, 370–386. [Google Scholar] [CrossRef]
- Mu, L.; Zang, Y.; Wang, Y.; Li, X.L.; Stemler, P.M.A. Phenomenological uncoupled ductile fracture model considering different void deformation modes for sheet metal forming. Int. J. Mech. Sci. 2018, 141, 408–423. [Google Scholar] [CrossRef]
- Sun, L.R.; Cai, Z.Y.; He, D.Y.; Li, L. Aluminum Alloy Sheet-Forming Limit Curve Prediction Based on Original Measured Stress-Strain Data and Its Application in Stretch-Forming Process. Metals 2019, 9, 1129. [Google Scholar] [CrossRef]
- Cao, J.; Li, F.G.; Ma, W.F.; Wang, K.; Ren, J.J.; Nie, H.L.; Dang, W. A Strain Rate Dependent Fracture Model of 7050 Aluminum Alloy. Metals 2020, 10, 3. [Google Scholar] [CrossRef]
- Hill, R. A theory of the yielding and plastic flow of anisotropic metals. Proc. R. Soc. A Math. Phys. Eng. Sci. 1948, 193, 281–297. [Google Scholar] [CrossRef]
- Barlat, F.; Lian, K. Plastic behavior and stretchability of sheet metals. Part I: A yield function for orthotropic sheets under plane stress conditions. Int. J. Plast. 1989, 5, 51–66. [Google Scholar] [CrossRef]
- Barlat, F.; Brem, J.C.; Yoon, J.W.; Chung, K.; Dick, R.E.; Lege, D.J.; Pourboghrat, F.; Choi, S.H.; Chu, E. Plane stress yield function for aluminum alloy sheets—Part I: Theory. Int. J. Plast. 2003, 19, 1297–1319. [Google Scholar] [CrossRef]
- Barlat, F.; Aretz, H.; Yoon, J.W.; Karabin, M.E.; Brem, J.C.; Dick, R.E. Linear transformation-based anisotropic yield functions. Int. J. Plast. 2005, 21, 1009–1039. [Google Scholar] [CrossRef]
- Cazacu, O.; Barlat, F. A criterion for description of anisotropy and yield differential effects in pressure-insensitive metals. Int. J. Plast. 2004, 20, 2027–2045. [Google Scholar] [CrossRef]
- Yoon, J.W.; Lou, Y.; Yoon, J.H.; Glazoff, M.V. Asymmetric yield function based on the stress invariants for pressure sensitive metals. Int. J. Plast. 2014, 56, 184–202. [Google Scholar] [CrossRef]
- Lou, Y.; Zhang, S.; Yoon, J.W. A reduced Yld2004 function for modeling of anisotropic plastic deformation of metals under triaxial loading. Int. J. Mech. Sci. 2019, 161/162, 105027. [Google Scholar] [CrossRef]
- Lou, Y.; Zhang, S.; Yoon, J.W. Strength modeling of sheet metals from shear to plane strain tension. Int. J. Plast. 2020, 134, 102813. [Google Scholar] [CrossRef]
- Lou, Y.; Yoon, J.W. Anisotropic yield function based on stress invariants for BCC and FCC metals and its extension to ductile fracture criterion. Int. J. Plast. 2018, 101, 125–155. [Google Scholar] [CrossRef]
| Publisher’s Note: MDPI stays neutral with regard to jurisdictional claims in published maps and institutional affiliations. |
© 2021 by the authors. Licensee MDPI, Basel, Switzerland. This article is an open access article distributed under the terms and conditions of the Creative Commons Attribution (CC BY) license (http://creativecommons.org/licenses/by/4.0/).


