Abstract
This paper presents computational modeling of a crack growth path under mixed-mode loadings in linear elastic materials and investigates the influence of a hole on both fatigue crack propagation and fatigue life when subjected to constant amplitude loading conditions. Though the crack propagation is inevitable, the simulation specified the crack propagation path such that the critical structure domain was not exceeded. ANSYS Mechanical APDL 19.2 was introduced with the aid of a new feature in ANSYS: Smart Crack growth technology. It predicts the propagation direction and subsequent fatigue life for structural components using the extended finite element method (XFEM). The Paris law model was used to evaluate the mixed-mode fatigue life for both a modified four-point bending beam and a cracked plate with three holes under the linear elastic fracture mechanics (LEFM) assumption. Precise estimates of the stress intensity factors (SIFs), the trajectory of crack growth, and the fatigue life by an incremental crack propagation analysis were recorded. The findings of this analysis are confirmed in published works in terms of crack propagation trajectories under mixed-mode loading conditions.
1. Introduction
Since the end of the Second World War, the failure of materials under stresses even lower than the yield stresses has gained significant attention [1]. Ensuring the stability of critical structures while establishing their safe working condition is vital. In most industries, the accurate estimation of both crack path and fatigue life are crucial in terms of reliability. In various applications, such as aerospace manufacturing and the aviation industry, experimental studies are necessary for fatigue analysis, but, because of high costs, precise computational methods are required for crack propagation analysis to predict the direction of crack growth and fatigue lifetime in both static and dynamic loading conditions [2]. The failure is related to (a) the presence of flaws such as interfaces and cracks, and (b) the nature of fluctuating loads. Cracks tend to initiate and propagate when subjected to fluctuating loads until a point when the structure does not bear the load that contributes to complete failure. These cracks are considered fatigue cracks and the expected life is one of the major parameters to determine the safety of the structure. This is computed by adding the number of loading cycles required to nucleate the fatigue cracks that lead to failure. The calculation of the growth rate of the cracks is usually based on the relation between the range of the stress intensity factors (SIFs) and the cracks’ geometry.
The extended finite element method (XFEM) is an alternate way to predict the SIFs using computational methods. In general, the initiation and propagation of cracks must be associated to the SIFs in a complicated state [3,4,5,6]. The extended finite element method proposed by Belytschko and Black in 1999 [7] has been widely used in recent studies. It is based on the standard finite element framework and uses a special displacement feature to allow discontinuities to occur, overcoming the need to re-mesh continuously throughout the crack tip expansion process. To evaluate the SIFs, XFEM was used to perform crack growth analysis without updating the mesh [8]. Extensive work was undertaken to develop efficient models to evaluate the fatigue crack growth (FCG) and fatigue life in order to overcome fatigue failures. There are several proposed experimental models, but they become prohibitive both in terms of cost and time. An effective way to reduce the laboratory work, time, and costs is to incorporate a simulation methodology that involves numerical analysis and use of the ANSYS APDL.19.2 extended finite element method. Many fatigue crack problems identified in the literature to date use different computational approaches in simulating simple and complex two- and three-dimensional geometries [2,9,10,11,12,13,14,15].
This work used the ANSYS APDL 19.2 XFEM to precisely predict the mixed-mode stress intensity factors along with the associated fatigue life for a modified four-point bending beam and a cracked plate with three holes. In particular, three methods have been widely used to illustrate the fatigue assessment of materials: the fracture mechanics method developed by Paris and Erdogan [16], the strain-life method independently proposed by Coffin [17], and the stress-life (SN) method proposed by Wöhler [18]. The first approach, by which the crack tip can be described separately by the SIFs, was employed in this study for predicting fatigue life. The second approach is suitable in the lower cycle fatigue range, whereas the third, SN approach estimates the time spent to initiate and grow a crack until the component breaks into parts, which requires stress results from a linear static analysis. The main motivation for this work was to make a significant contribution to the use of ANSYS as an alternative tool for simulating fatigue crack propagation problems during mixed-mode loading and to monitor the trajectory of crack growth in cases of the presence of holes in the geometry.
2. Mixed-Mode Fatigue Life Evaluation Procedure Using ANSYS
ANSYS (version 19.2, Ansys, Inc., Canonsburg, PA, USA), can model three kinds of cracks: arbitrary, semi-elliptical, and pre-meshed. The pre-meshed crack method requires a crack front employed by the Smart Crack growth analysis tool, whereby the stress intensity factor is the criterion of failure. The node sets that were rendered were distributed to the front, top, and bottom of the crack. The latest feature presented in ANSYS is the Smart Crack growth mesh-based tetrahedron, which adds the pre-meshed crack requirement after completion, enabling the selection of the type of crack growth. The sphere of influence process can be used in refining the mesh around the crack tip about the geometric edge that passes through the thickness. The geometric regions to be described are the crack tip, the crack top, and the bottom surfaces of the crack; each of these regions is associated with a node set to be used for analysis. The ANSYS software considered mixed-mode loading where the maximum circumferential stress criterion was implemented. The following are the formulas for the direction angle of crack propagation in ANSYS [19,20]:
where KI = max KI during cyclic loading and KII = max KII during cyclic loading.
In ANSYS Mechanical APDL 19.2, by using XFEM, crack growth simulation was restricted to region II of the typical fatigue crack growth graph, which can be represented as:
From Equation (2), fatigue lifecycles may be predicted for crack increments as:
The equivalent range of the stress intensity factor formula is determined as follows [19]:
where = the stress intensity factor range in mode I loading and = the stress intensity factor range in mode II loading.
Based on numerical analysis, there are many methods formulated for evaluating the stress intensity factors. The interaction integral technique is usually the most accurate method that has the ability of estimating KI and KII separately. ANSYS proposes two methods for computing SIFs: the displacement extrapolation method (DEM) and the interaction integral method (IIM). The second method was adopted because it is numerically easier to implement and has better precision with fewer mesh requirements. This approach uses the domain integral approach [21] where an auxiliary field is used to separate KI from KII, as this ability is missing in the domain integral itself. The energy release rate in terms of the mixed-mode stress intensity factors KI, KII, and KIII was proposed as [21,22]:
The superimposed state Equation (5) becomes:
Here, superscript (S) denotes the superimposed state; J(s) is the domain integral for the actual state; Jaux(s) is the domain integral for the auxiliary state; and I(s) is an integral with interacting actual and auxiliary terms.
By setting and , Equation (6) yields:
By setting and , and selecting gives the relationships between KII and KIII:
where E and are the modulus of elasticity and the modulus of rigidity, respectively.
3. Numerical Results and Discussion
3.1. Modified Four-Point Bending Beam
This case corresponds to a single cracked beam with a hole, loaded in the upper two points and constrained in the lower two points, i.e., a modified four-point bending specimen as shown in Figure 1. This refers to a problem of plane strain that was solved numerically in [23,24]. The geometry is 125 × 30 × 10 mm3 in size, and the hole radius, R = 5.2 mm, was located 9.3 mm from the left of the original crack and 14.8 mm above it. This specimen was simulated under fatigue loading with a constant amplitude load ratio, R= 0.1, and the quantity of the applied loads were P = 100 N. The initial mesh of this geometry is shown in Figure 2. The material for this specimen was cold-rolled SAE 1020 steel with the following properties as shown in Table 1:
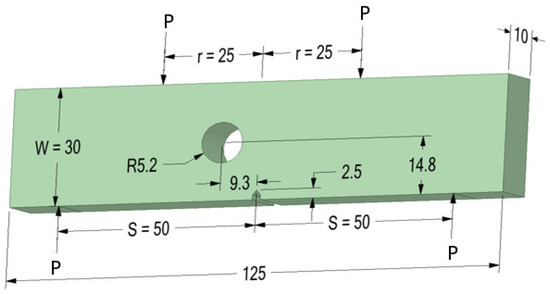
Figure 1.
Geometry of the four-point bending beam (dimensions in mm).
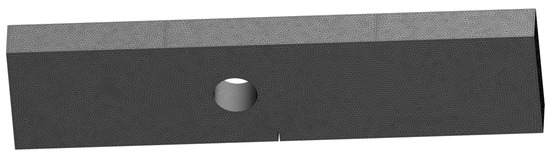
Figure 2.
Initial mesh of the four-point bending beam.

Table 1.
Materials properties for cold-rolled SAE 1020 steel.
The predicted crack growth trajectory was smooth and identical to the experimental path predicted by [23] and can be further compared to the predicted trajectories obtained using other numerical methods, such as the finite element method based on local Lepp–Delaunay mesh refinement used in [24], the finite element with configurational forces used in [25], and the coupled extended meshfree–smoothed meshfree method used in [26], as shown in Figure 3a–e, respectively. In the initial period, the crack grew with a small increment when the crack tip was relatively far from the hole. The crack growth direction changed with a large angle and gradually affected the hole with the crack proceeding. Figure 4 illustrates six different steps of the crack growth represented in the von Mises stress distribution, whereas the three-dimensional distribution of the von Mises stress distribution with and without deformation is shown with a legend in Figure 5.
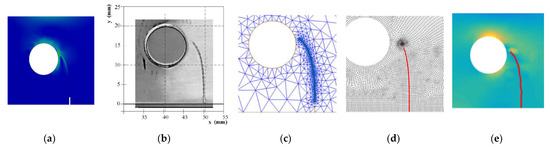
Figure 3.
Comparison of the crack growth trajectory for the four-point bending beam; (a) present study; (b) experimental observation reproduced from [23] with permission from Elsevier 2003; (c) numerical reproduced from [24] with permission from Elsevier 2010; (d) numerical reproduced from [25] with permission from Elsevier 2017; (e) numerical reproduced from [26] with permission from Elsevier 2020.
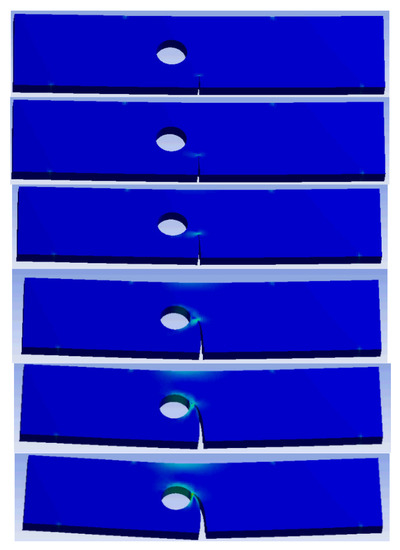
Figure 4.
From top to bottom, six different steps of crack growth for the four-point bending beam.
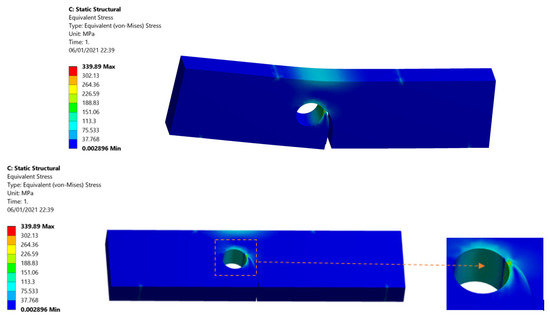
Figure 5.
Von Mises stress distribution for the last step of the crack growth with and without deformation.
The distribution of the maximum principal stress is shown in Figure 6 with enlargement of the crack tip area.
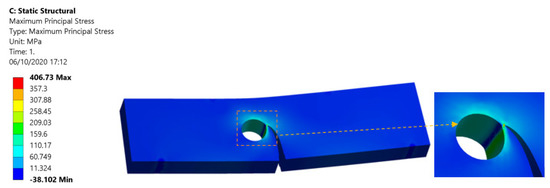
Figure 6.
Maximum principal stress distribution.
For fatigue life evaluation, the SIFs are the important criterion. For a normal four-point bending beam, various handbooks may include analytical calculations of the SIFs. For the regular four-point bending beam without a hole the SIFs solution is formulated as follows [27]:
where KI is the first mode of SIFs, f(a/W) refers to the dimensionless SIF, W is the beam width, t is beam thickness, P is load applied, s and r are the distances defined in Figure 1, and a is the length of the crack. The dimensionless regular stress intensity factor for the point bending beam without holes was formulated as [27]:
The presence of a hole created a curved crack trajectory in this modified geometry, hence, Equation (11) was no longer valid as a consequence of the curved crack direction. ANSYS can obtain accurate expected f(a/W) values rather than manual solutions for the regular four-point bending beam specimen. In order to achieve the dimensionless stress factor f(a/W), mode I SIFs (KI) were obtained from ANSYS and substituted into Equation (11). Fitting the fifth-degree polynomial into the stress intensity factors for the modified four-point bending beam gave the following equation:
f(a/W) = 12.116(a/W) − 88.937(a/W)2 + 336.46(a/W)3 − 595.59(a/W)4 + 417.66(a/W)5 + 0.4287
A generalized linear regression method facilitates usage of the formula, which displays SIFs as a function of both the relevant crack and contact parameters, easing assessment of crack growth behavior. For the modified four-point beam specimen used in the above analysis, the numerical dimensionless SIFs were compared with the analytical solution in Equation (11) for the standard beam without a hole, as well as with the dimensionless SIF values calculated by [14] applying the boundary element method (BEM) with BemCracker2D (BC2D) software as shown in Figure 7.
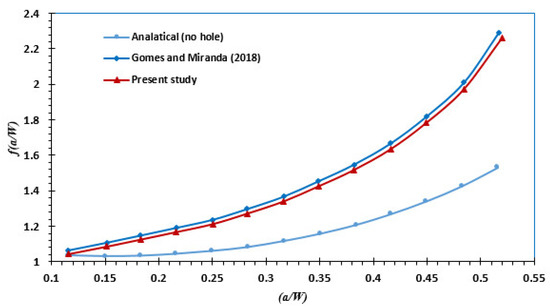
Figure 7.
Dimensionless stress intensity factors for the standard and modified four-point bending beams.
The predicted values of both modes of stress intensity factors, i.e., KI and KII are shown below in Figure 8. As seen in this figure, the crack started to grow in a straight line as the first mode of stress intensity factors dominated the crack growth direction. When the crack direction was influenced by the presence of the hole, the crack grew toward the hole and changed its direction, increasing the values of the second mode of stress intensity factors. The predicted fatigue life according to the number of cycles was compared, as shown in Figure 9, to the experimental results performed by [14] alongside the numerical results for the same authors with two software programs: Vida and BemCracker2D. According to this figure, there was a strong correlation between the present study’s result and the Vida software compared to that of the BemCracker2D. According to Figure 8, the bimodality ratio (KII/KI) was not zero. The direction of the crack was dominated by KI at the beginning of the crack growth since the KII values were small compared to the KI values. After that, as the second mode of stress intensity factors, KII was increased gradually up to a maximum value of 21 MPa(mm)1/2, leading to a change in the direction of the crack toward the hole.
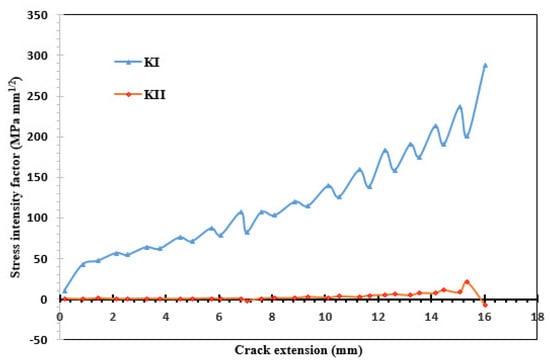
Figure 8.
Predicted values of the stress intensity factors.
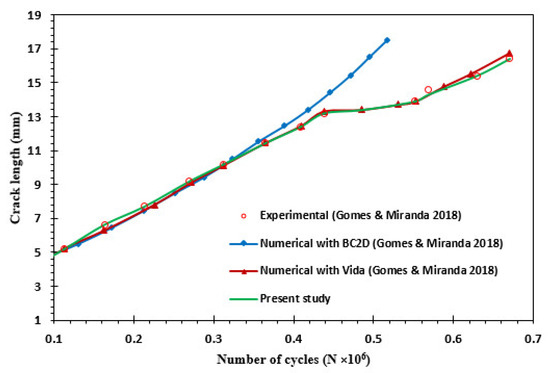
Figure 9.
Comparison for fatigue life of the modified four-point bending beam.
3.2. Cracked Plate with Three Holes
Consider a 120 mm × 65 mm × 16 mm rectangular plate with two 13 mm diameter holes near both ends and a 20 mm hole near the middle of the plate, as seen in Figure 10. At the middle of the plate is an initial edge crack of 10 mm. The plate was made from aluminum 7075-T6, with the material properties shown in Table 2, and the amount of the fatigue load was P = 20 kN with a stress ratio R = 0.1. Linear elastic material behavior was assumed. The initial XFEM ANSYS model with an eight-node tetrahedron mesh is shown in Figure 10b. The size of the mesh element was set as 1 mm, creating a mesh of 581,980 nodes and 398,566 elements.
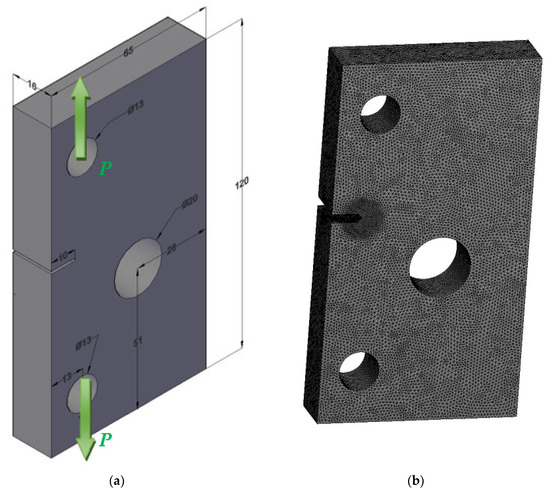
Figure 10.
(a) Description geometry of the cracked plate with three holes (dimensions in mm); (b) initial mesh.
Table 2.
Materials properties for aluminum 7075-T6.
The crack path growth simulated with ANSYS software was compared, and had strong agreement, with both experimental and numerical results from ABAQUS software obtained by [28] as well as with numerical results performed by [29] using XFEM with a controllable crack propagation strategy, as seen in Figure 11a–d, respectively. The distribution of the maximum principal stress, the von Mises stress, and the equivalent strain are shown in Figure 12, Figure 13 and Figure 14, respectively.
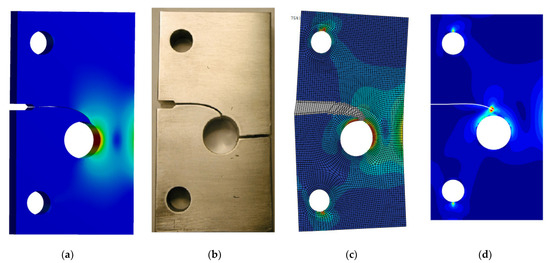
Figure 11.
Comparison of crack growth trajectory; (a) present study; (b) experimental observation reproduced from [28] with permission from Elsevier 2009; (c) numerical reproduced from [28] with permission from Elsevier 2009; (d) numerical reproduced from [29] with permission from Elsevier 2018.
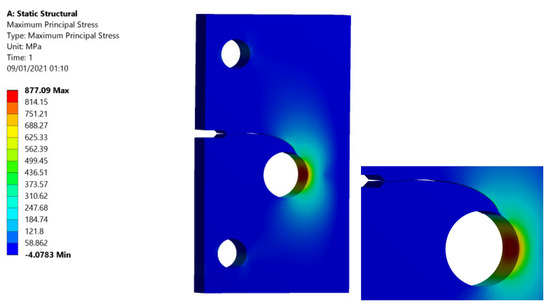
Figure 12.
The maximum principal stress distribution.
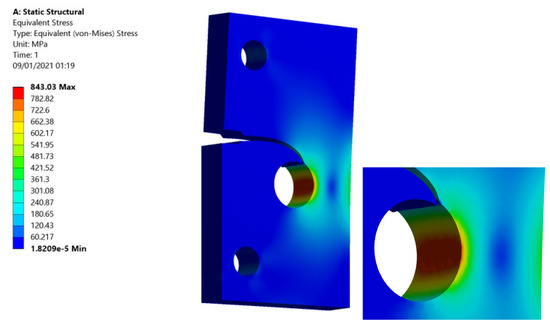
Figure 13.
The equivalent von Mises stress distribution.
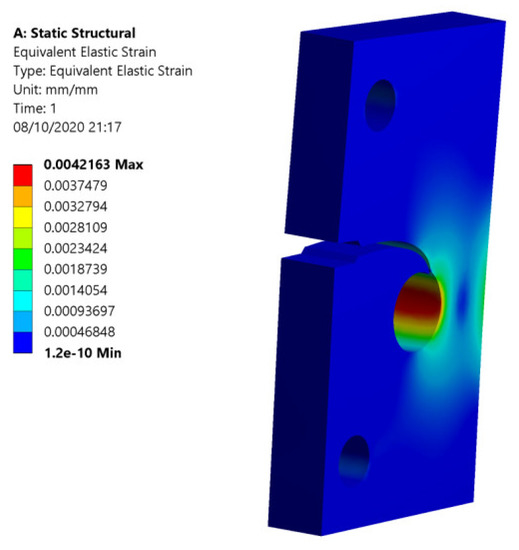
Figure 14.
The equivalent elastic strain distribution.
The maximum value of the von Mises stress was in the last step of the crack growth, in which the area around the crack tip is known as a plastic zone. In this area, the behavior of the material is plastic. The plastic zone is created when the stress goes from minimum to maximum values and is called uploading. The plastic zone is plastically elongated in the loading direction. It becomes longer than it was before. As a consequence, the zone is loaded in compression during unloading and reversed plasticity occurs. As pointed out by Rice [30], reversed plasticity requires a local stress increment in the reserved direction in the order of twice the yield stress.
The predicted values of the two modes of stress intensity factors, i.e., KI and KII, are shown in Figure 15 and Figure 16, respectively. As shown in Figure 14, the crack starts to grow in a straight direction, indicating the domination of KI followed by a curved direction with an increasing negative value of the second mode, KII, that results in the crack growing toward the hole.
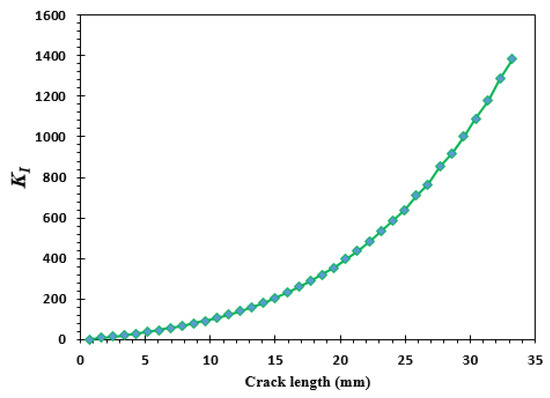
Figure 15.
Predicted values of the first mode of stress intensity factors.
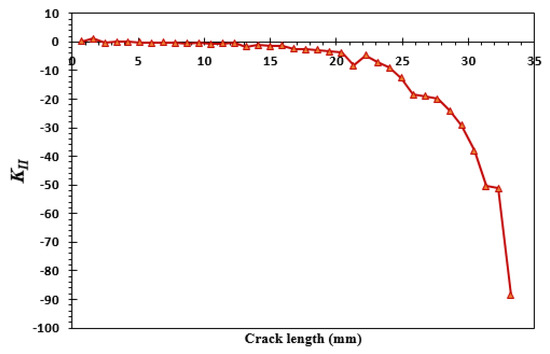
Figure 16.
Predicted values of the second mode of stress intensity factors.
4. Conclusions
The crack propagation direction can be specified by simulation techniques such as implementing ANSYS software and ensuring the critical domain of the structure is not exceeded. In order to demonstrate the accuracy and to reveal the merits of the implementation, various numerical examples of crack growth were solved. Different issues were addressed through these examples, such as the effect of hole position on the trajectory of crack growth, mixed-mode stress intensity factors, fatigue lifecycles, and various stress distributions. Depending on the location of the crack, the presence of a hole in the geometry affects the crack and deflects it in the hole’s direction, so the crack changes or even passes through the hole and grows until the hole is missing. The validation of the software results were revealed by consistent comparisons with the numerical results of crack propagation by ANSYS and the experimental results.
Funding
This research received no external funding.
Data Availability Statement
Not applicable.
Conflicts of Interest
The author declares no conflict of interest.
References
- Frost, N.; Pook, L.; Denton, K. A fracture mechanics analysis of fatigue crack growth data for various materials. Eng. Fract. Mech. 1971, 3, 109–126. [Google Scholar] [CrossRef]
- Dirik, H.; Yalçinkaya, T. Crack path and life prediction under mixed mode cyclic variable amplitude loading through XFEM. Int. J. Fatigue 2018, 114, 34–50. [Google Scholar] [CrossRef]
- Sih, G.; Liebowitz, H. Mathematical Fundamentals in Fracture; Academic Press: New York, NY, USA, 1968; pp. 67–190. [Google Scholar]
- Hellan, K. Introduction to Fracture Mechanics; McGraw-Hill: New York, NY, USA, 1985. [Google Scholar]
- Barsom, J.; Rolfe, S. Fracture and Fatigue in Structure: Application of Fracture Mechanics; American Society for Testing and Materials: Philadelphia, PA, USA, 1999. [Google Scholar]
- Broek, D. Elementary Engineering Fracture Mechanics; Springer Science & Business Media: Berlin/Heidelberg, Germany, 2012. [Google Scholar]
- Belytschko, T.; Black, T. Elastic crack growth in finite elements with minimal remeshing. Int. J. Numer. Methods Eng. 1999, 45, 601–620. [Google Scholar] [CrossRef]
- Bergara, A.; Dorado, J.I.; Martin-Meizoso, A.; Martínez-Esnaola, J.M. Fatigue crack propagation in complex stress fields: Experiments and numerical simulations using the Extended Finite Element Method (XFEM). Int. J. Fatigue 2017, 103, 112–121. [Google Scholar] [CrossRef]
- Alshoaibi, A.M. Finite element procedures for the numerical simulation of fatigue crack propagation under mixed mode loading. Struct. Eng. Mech. 2010, 35, 283–299. [Google Scholar] [CrossRef]
- Alshoaibi, A.M. Comprehensive Comparisons of Two and Three Dimensional Numerical Estimation of Stress Intensity Factors and Crack propagation in Linear Elastic Analysis. Int. J. Integr. Eng. 2019, 11, 45–52. [Google Scholar] [CrossRef]
- Alshoaibi, A.M.; Fageehi, Y.A. 2D finite element simulation of mixed mode fatigue crack propagation for CTS specimen. J. Mater. Res. Technol. 2020, 9, 7850–7861. [Google Scholar] [CrossRef]
- Fageehi, Y.A.; Alshoaibi, A.M. Numerical Simulation of Mixed-Mode Fatigue Crack Growth for Compact Tension Shear Specimen. Adv. Mater. Sci. Eng. 2020. [Google Scholar] [CrossRef]
- Chen, H.; Wang, Q.; Zeng, W.; Liu, G.R.; Sun, J.; He, L.; Bui, T.Q. Dynamic brittle crack propagation modeling using singular edge-based smoothed finite element method with local mesh rezoning. Eur. J. Mech. A/Solids 2019, 76, 208–223. [Google Scholar] [CrossRef]
- Gomes, G.; Miranda, A.C. Analysis of crack growth problems using the object-oriented program bemcracker2D. Frat. Ed Integrità Strutt. 2018, 12, 67–85. [Google Scholar] [CrossRef]
- Fageehi, Y.A.; Alshoaibi, A.M. Nonplanar Crack Growth Simulation of Multiple Cracks Using Finite Element Method. Adv. Mater. Sci. Eng. 2020. [Google Scholar] [CrossRef]
- Paris, P.; Erdogan, F. A critical analysis of crack propagation laws. J. Basic Eng. 1963, 85, 528–533. [Google Scholar] [CrossRef]
- Coffin, L. Fatigue and Endurance of Metals. In Cyclic Deformation and Fatigue of Metals (Russian Translation); USSR: Moscow, Russia, 1963; pp. 257–272. [Google Scholar]
- Wöhler, A. Versuche zur Ermittlung der auf die Eisenbahnwagenachsen einwirkenden Kräfte und die Widerstandsfähigkeit der Wagen-Achsen. Z. Bauwes. 1860, 10, 583–614. [Google Scholar]
- Bjørheim, F. Practical Comparison of Crack Meshing in ANSYS Mechanical APDL 19.2. Master’s Thesis, University of Stavanger, Stavanger, Norway, 2019. [Google Scholar]
- ANSYS. Academic Research Mechanical, Release 19.2, Help System. In Coupled Field Analysis Guide, 2020; ANSYS, Inc.: Canonsburg, PA, USA, 2020. [Google Scholar]
- Walters, M.C.; Paulino, G.H.; Dodds, R.H., Jr. Interaction integral procedures for 3-D curved cracks including surface tractions. Eng. Fract. Mech. 2005, 72, 1635–1663. [Google Scholar] [CrossRef]
- Anderson, T.L. Fracture Mechanics: Fundamentals and Applications; CRC Press: Cleveland, OH, USA, 2017. [Google Scholar]
- Miranda, A.C.O.; Meggiolaro, M.A.; Castro, J.T.P.; Martha, L.F.; Bittencourt, T.N. Fatigue life and crack path predictions in generic 2D structural components. Eng. Fract. Mech. 2003, 70, 1259–1279. [Google Scholar] [CrossRef]
- Azócar, D.; Elgueta, M.; Rivara, M.C. Automatic LEFM crack propagation method based on local Lepp–Delaunay mesh refinement. Adv. Eng. Softw. 2010, 41, 111–119. [Google Scholar] [CrossRef]
- Guo, Y.; Li, Q. Material configurational forces applied to mixed mode crack propagation. Theor. Appl. Fract. Mech. 2017, 89, 147–157. [Google Scholar] [CrossRef]
- Ma, W.; Liu, G.; Wang, W. A coupled extended meshfree–Smoothed meshfree method for crack growth simulation. Theor. Appl. Fract. Mech. 2020, 107, 102572. [Google Scholar] [CrossRef]
- Fett, T. Stress Intensity Factors, T-Stresses, Weight Functions: Supplement Volume; KIT Scientific Publishing: Karlsruhe, Germeny, 2009; Volume 55. [Google Scholar]
- Giner, E.; Sukumar, N.; Tarancón, J.E.; Fuenmayor, F.J. An Abaqus implementation of the extended finite element method. Eng. Fract. Mech. 2009, 76, 347–368. [Google Scholar] [CrossRef]
- Cheng, Z.; Wang, H. How to control the crack to propagate along the specified path feasibly? Comput. Methods Appl. Mech. Eng. 2018, 336, 554–577. [Google Scholar] [CrossRef]
- Rice, J.R. Mechanics of crack tip deformation and extension by fatigue. In Fatigue Crack Propagation; ASTM: West Conshohocken, PA, USA, 1967; pp. 247–309. [Google Scholar]


Publisher’s Note: MDPI stays neutral with regard to jurisdictional claims in published maps and institutional affiliations. |
© 2021 by the author. Licensee MDPI, Basel, Switzerland. This article is an open access article distributed under the terms and conditions of the Creative Commons Attribution (CC BY) license (http://creativecommons.org/licenses/by/4.0/).