Article

Early Crack Propagation in Single Tooth Bending Fatigue: Combination of Finite Element Analysis and Critical-Planes Fatigue Criteria

1
Faculty of Science and Technology, Free University of Bolzano/Bozen, Piazza Università 1, 39100 Bolzano, Italy
2
Department of Mechanical Engineering, Politecnico di Milano, via La Masa 1, 20157 Milano, Italy
*
Authors to whom correspondence should be addressed.
Metals 2021, 11(11), 1871; https://doi.org/10.3390/met11111871
Submission received: 28 October 2021 / Revised: 17 November 2021 / Accepted: 17 November 2021 / Published: 21 November 2021
(This article belongs to the Special Issue Computational Methods for Fatigue and Fracture)

Abstract

:
Mechanical components, such as gears, are usually subjected to variable loads that induce multiaxial non-proportional stress states, which in turn can lead to failure due to fatigue. However, the material properties are usually available in the forms of bending or shear fatigue limits. Multiaxial fatigue criteria can be used to bridge the gap between the available data and the actual loading conditions. However, different criteria could lead to different results. The main goal of this paper is to evaluate the accuracy of different criteria applied to real mechanical components. With respect to this, five different criteria based on the critical plane concept (i.e., Findley, Matake, McDiarmid, Papadopoulos, and Susmel) have been investigated. These criteria were selected because they not only assess the level of damage, but also predict the direction of crack propagation just after nucleation. Therefore, measurements (crack position and direction) on different fractured gear samples tested via Single Tooth Bending Fatigue (STBF) tests on two gear geometries were used as reference. The STBF configuration was numerically simulated via Finite Elements (FE) analyses. The results of FE were elaborated based on the above-mentioned criteria. The numerical results were compared with the experimental ones. The result of the comparison showed that all the fatigue criteria agree in identifying the most critical point. The Findley and Papadopulus criteria proved to be the most accurate in estimating the level of damage. The Susmel criterion turns out to be the most conservative one. With respect to the identification of the direction of early propagation of the crack, the Findley criterion revealed the most appropriate.

1. Introduction

In mechanical systems, gears are widely used components to transmit torque and motion (i.e., mechanical power) between non-coaxial shafts [1]. Due to their working principle (i.e., meshing of conjugate profiles), teeth are subject to various damage mechanisms that can lead to the failure of the entire mechanical system [2,3]. Wear, scuffing, and (micro) pitting in the teeth flank are just a few examples of failure modes that, in turn, can be attributable to high contact pressures and/or insufficient lubrication [4,5,6,7,8]. However, Tooth (root) Bending Fatigue (TBF) is the most dangerous one [9,10].
TBF leads to the nucleation and propagation of a crack in the Tooth Root Radius ( ρ f P ) due to the varying stress induced by tooth bending during meshing [11,12]. Therefore, a fundamental aspect to be considered while designing gears is the capability to withstand cyclic bending loads [13]. With this respect, different standards support the gear design to avoid TBF failures, e.g., ISO 6336-3 [14,15] and ANSI/AGMA [16]. The above-mentioned standards support gear design through the determination of Tooth Bending Strength (TBS). According to the Method B of ISO 6336-3 [15], the maximum stress σ F at the ρ f P due to pure bending has to not exceed the permissible bending stress σ F P that, in turn, is proportional to the material strength σ F l i m , i.e., a material property usually determined through Single Tooth Bending Fatigue (STBF) tests [17,18,19,20].
In STBF tests, teeth belonging to a gear sample made of the material to be characterized are loaded with two pulsating, competing, parallel, and discordant forces applied through two anvils (having parallel faces) mounted on a universal (fatigue) testing machine [21,22]. Exploiting the Wildhaber property [1], these forces are applied perpendicularly to two tooth flanks, resulting in tangent to the base circle [23]. STBF tests are interrupted if a tooth fails or if it withstands the run-out condition (106–108) cycles [24,25,26,27,28]. The statistical elaboration of failures and run-outs (the load levels are defined with the staircase approach [29,30]) leads to the determination of the load-carrying capacity [20]. The methods for translating this load into stresses acting at the ρ f P (i.e., σ F l i m ) can be different: (1) through the reverse application of the standard (e.g., [31,32,33,34]), (2) by means of experimental measures (e.g., exploiting strain gauges [35]), (3) via Finite Element (FE) simulations (e.g., [36,37,38,39]).
With respect to the FE simulations, on the one hand, they allow us to obtain relevant information on the principal stresses in the ρ f P , for each loading condition. On the other hand, results of FE simulation have to be further elaborated to estimate the fatigue behavior of a specific gear design [40,41]. In other words, numerical simulations of STBF tests and further data elaboration based on fatigue criteria using material data obtained via standard tests (i.e., torsion, bending and traction quasi-static and fatigue tests on standard specimens) seems to be a valuable alternative to long experimental campaigns.
In recent studies, the authors pointed out that the FE simulation results of the STBF configuration can be analyzed and elaborated via different fatigue criteria based on the critical plane approach [41,42,43]. These allow for evaluating the criticality of each point along the ρ f P . Moreover, it permits to individuate the potential propagation direction of the crack after nucleation. Nevertheless, it has been observed that different fatigue criteria could lead to different results in terms of TBS and/or crack propagation direction [42].
The goal of the present paper is to evaluate the most appropriate fatigue criteria for characterizing the fatigue behavior in terms of the individuation of the nucleation point and the determination of the direction of early propagation of the crack in real mechanical components characterized by non-proportional multiaxial states of stress. This stress state, i.e., any state of time varying stress where the orientation of the principal axes changes with respect to a reference system integral with the studied component, can be found in gears [38]. In this respect, STBF tests described in [35,38,39,40] have been numerically reproduced and the FE results have been analyzed through different fatigue criteria based on the critical plane, i.e., Findley [44], Matake [45], McDiarmid [46], Papadopoulos [47], and Susmel et al. [48]. The outcomes of the elaboration have been compared with the cracks observed in the above-mentioned experimental campaigns [35,38,39,40].
The present paper is organized as follows. In Section 2, the mathematical elaboration of a generic time-dependent stress tensor σ = ( t ) according to different fatigue criteria is presented. In Section 3, FE modeling, numerical data processing, and experimental data acquisition are shown. Comparison of numerical and experimental results are presented in Section 4. Discussions and conclusion can be found in Section 5.

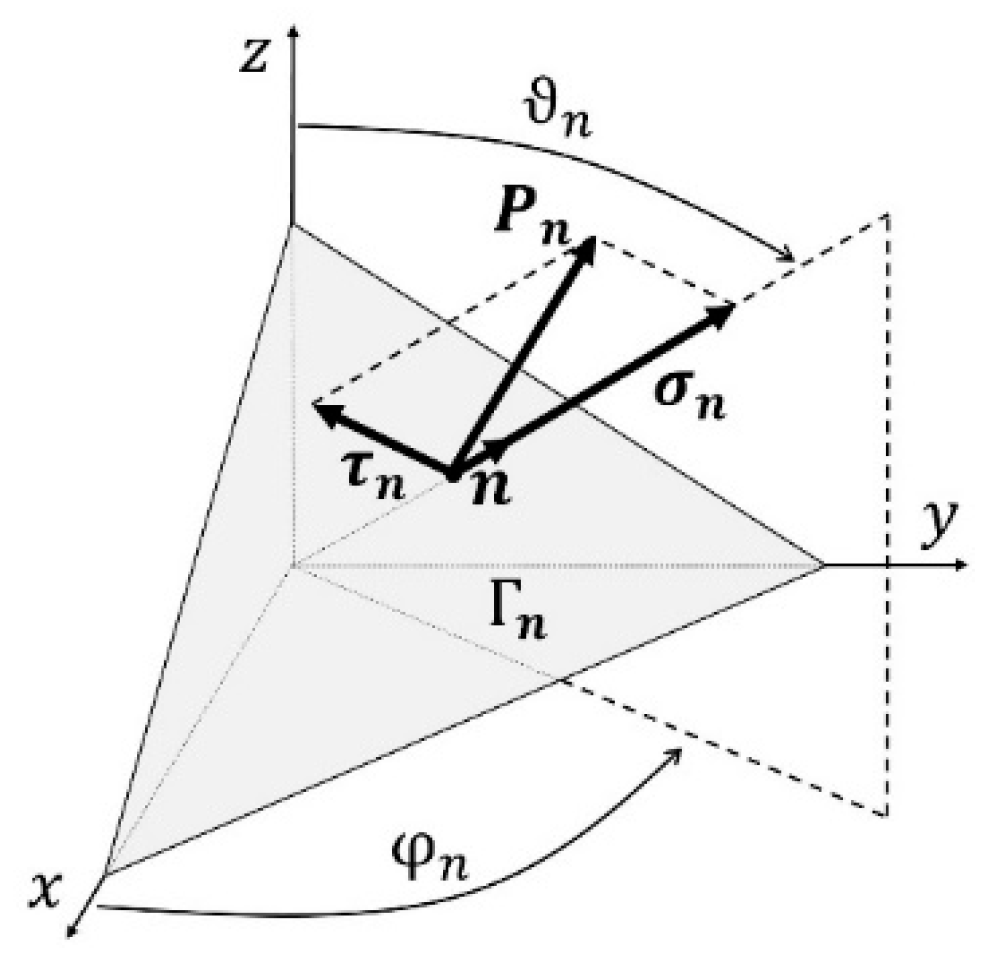
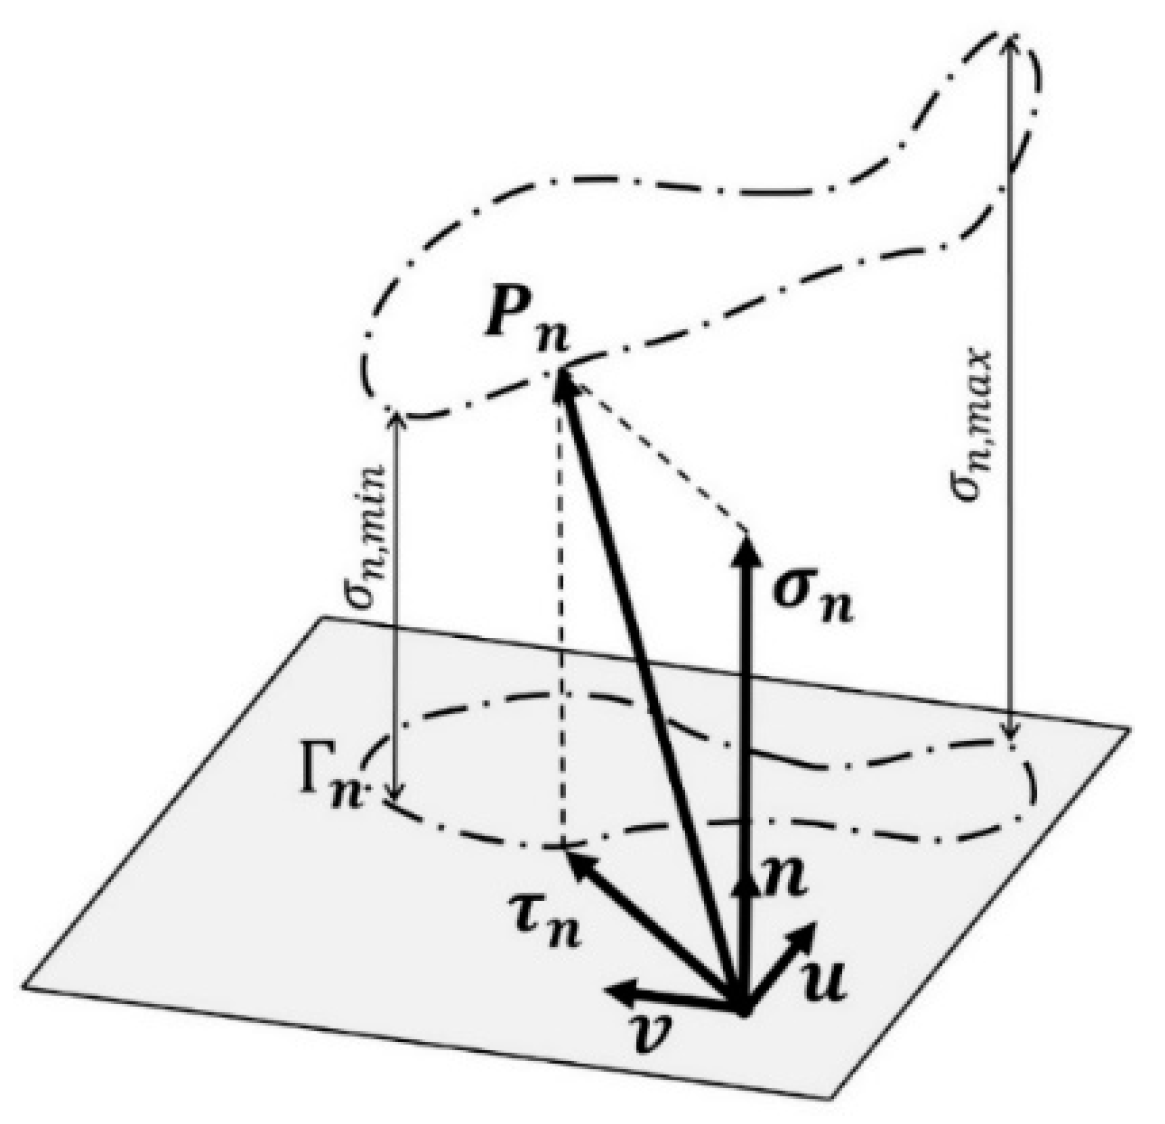
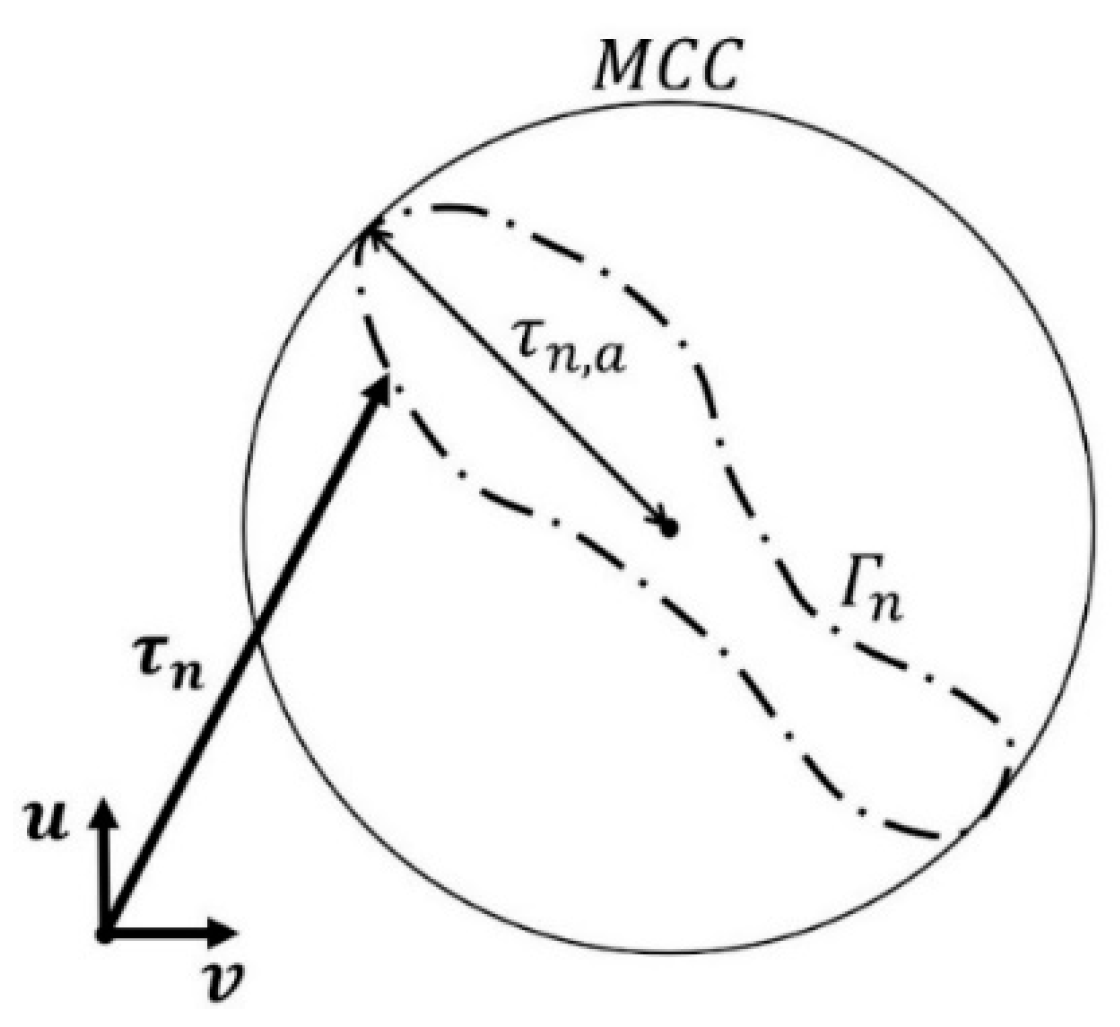
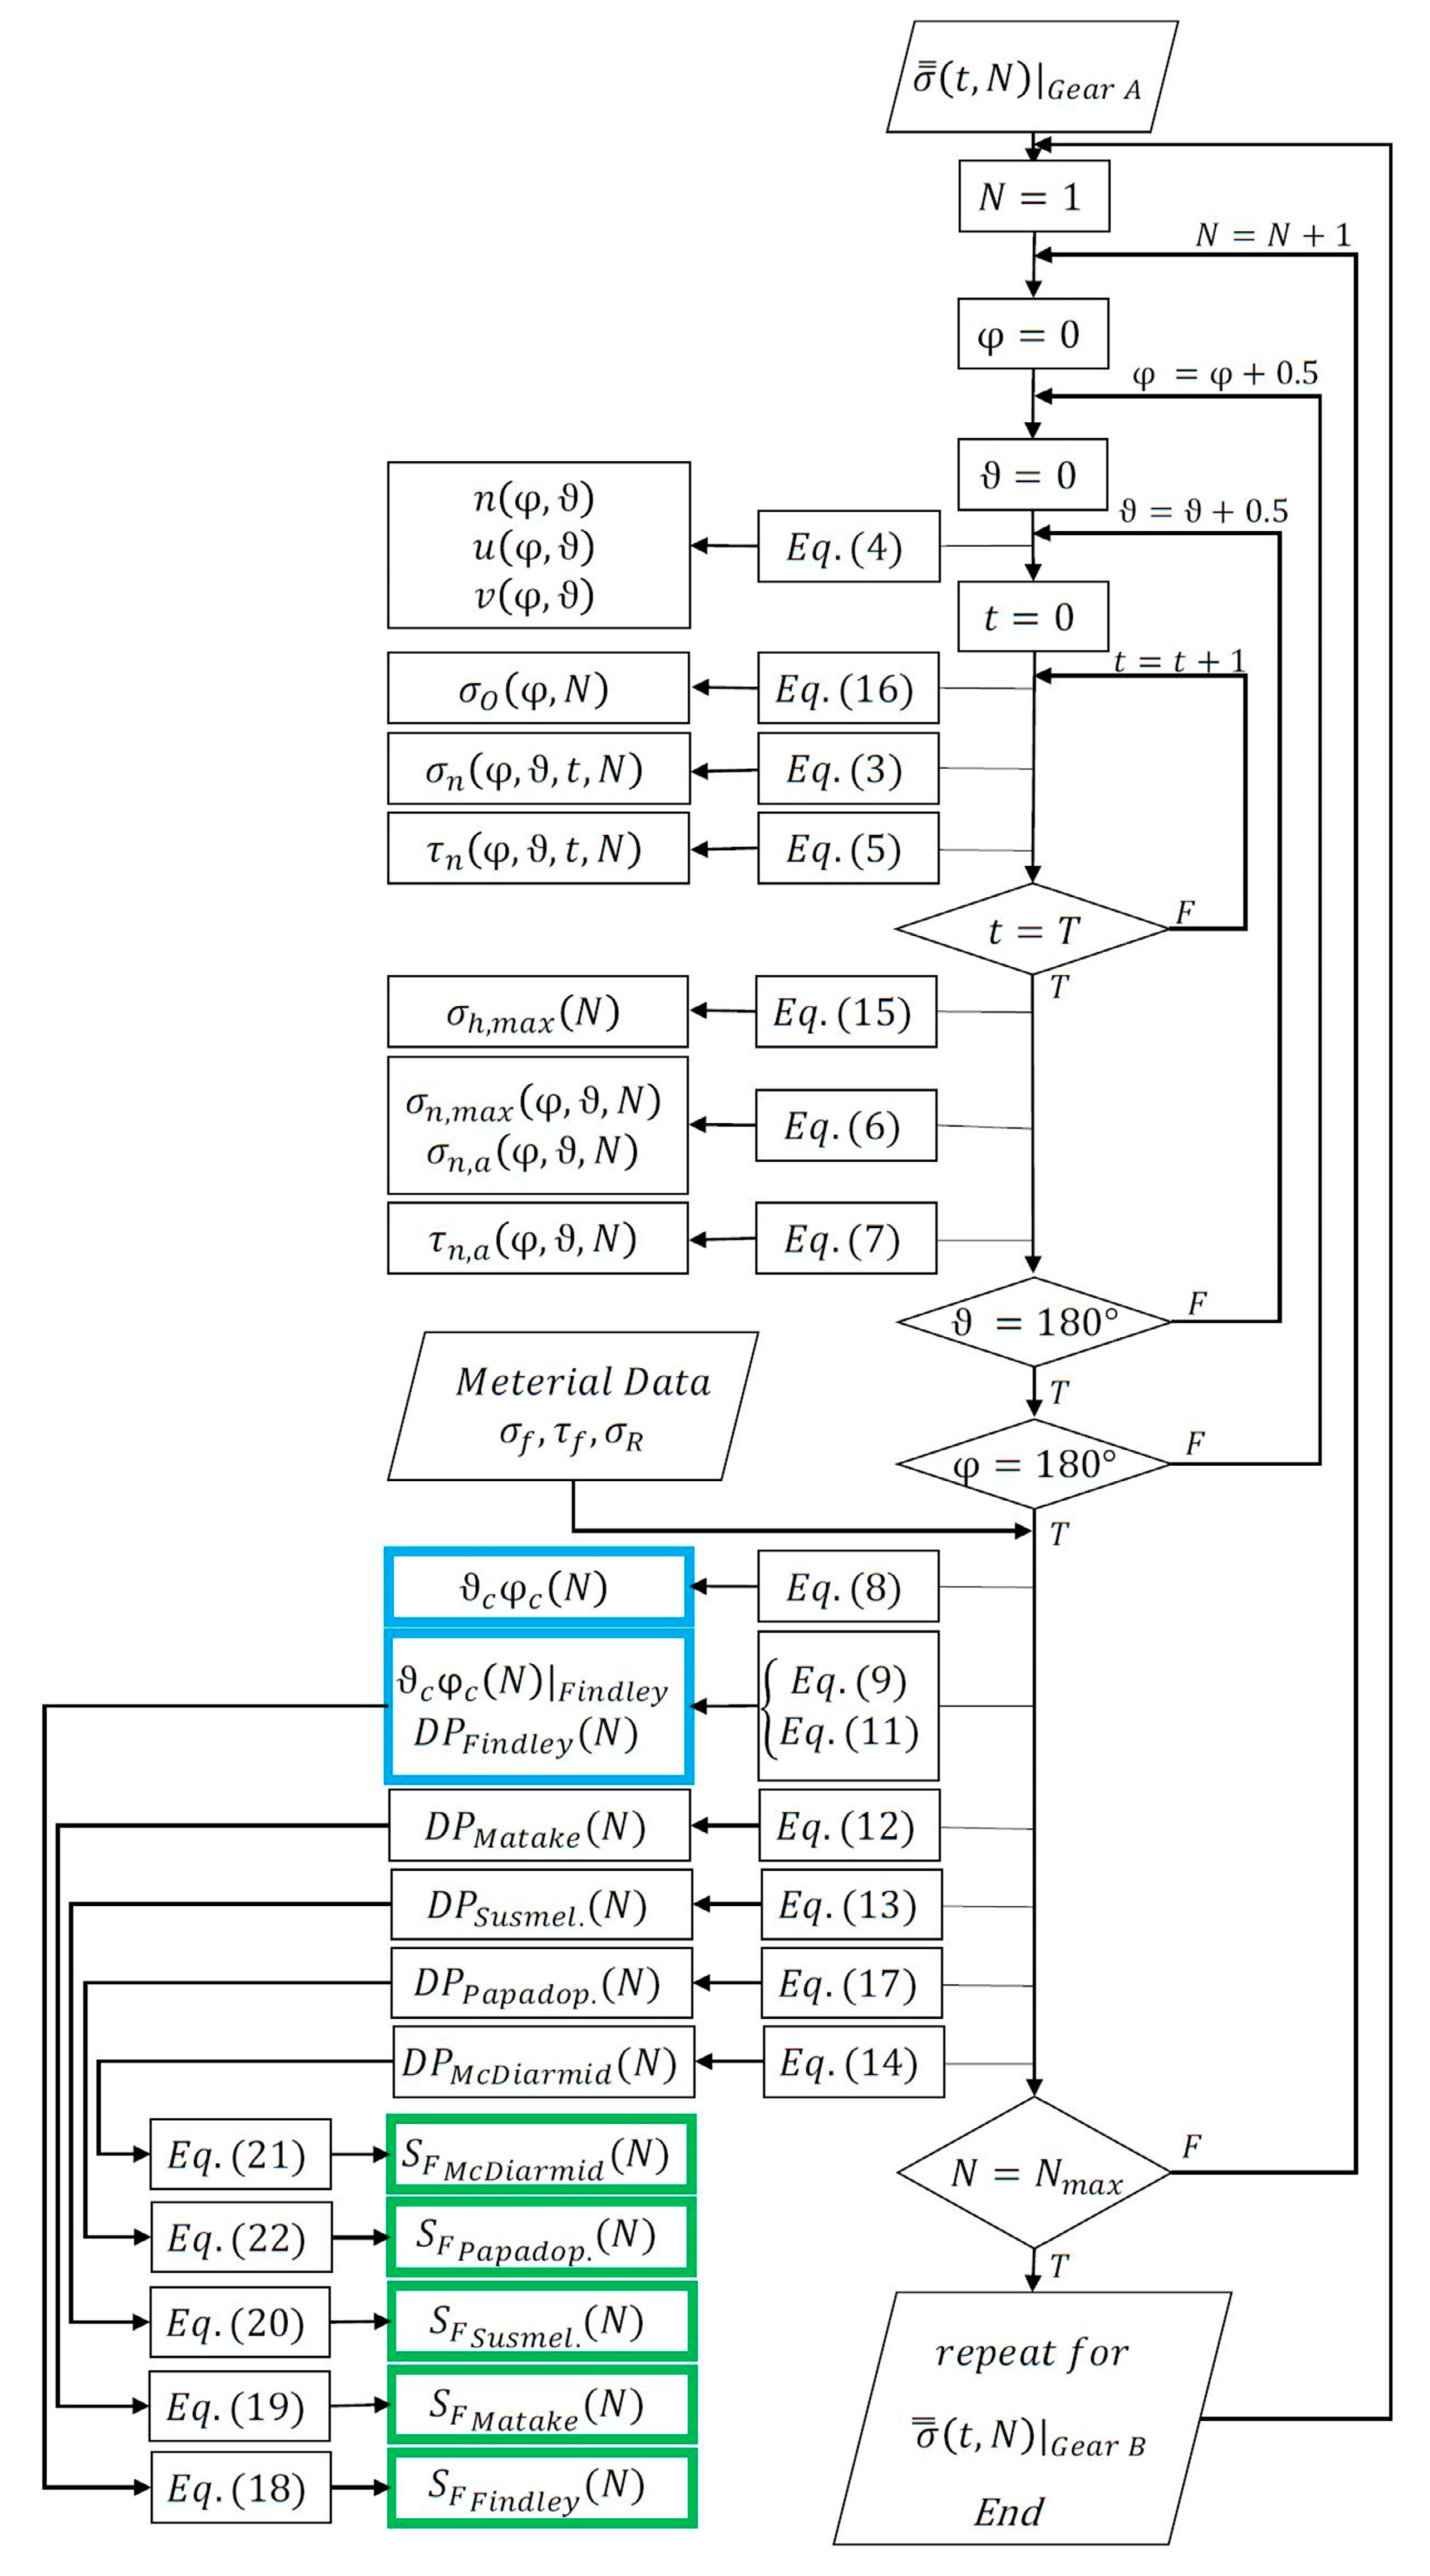
2. Background: Mathematical Modeling of Fatigue Criteria Based on the Critical Plane

In the present section, the mathematical modeling is presented of the main fatigue criteria based on critical plane (i.e., Findley [44], Matake [45], McDiarmid [46], Papadopoulos [47], and Susmel et al. [48]). Each fatigue criterion starts from the time-dependent stress tensor σ = ( t ) (Equation (1)) referred to the point whose fatigue behavior has to be evaluated.
σ = ( t ) = [ σ x x ( t ) τ x y ( t ) τ x z ( t ) τ y x ( t ) σ y y ( t ) τ y z ( t ) τ z x ( t ) τ z y ( t ) σ z z ( t ) ]
More specifically, a generic plane (including the point to be evaluated) can be defined by means of its normal vector n that, in turn, can be defined according with its spherical coordinates ( φ n , ϑ n ) with respect to a generic reference system (Figure 1).
According to Equation (2), it is possible to calculate the stress vector P n acting on the afore-mentioned plane; the vector can, in turn, be decomposed into a normal component σ n and into a tangential component τ n (Figure 1).
P n ( φ n , ϑ n , t ) = σ = ( t )   n ( φ n , ϑ n )
On the one hand, σ n (which can be calculated through Equation (3)) presents a fixed direction and a time-dependent modulus. On the other hand, τ n has a time-dependent modulus and direction. Therefore, τ n has to be further decomposed into its components along the u and v directions (Figure 2). The unitary vectors n , u , v are defined as in Equation (4). In Equation (5), τ n is defined.
σ n ( φ n , ϑ n , t ) = n T ( φ n , ϑ n ) σ = ( t )   n ( φ n , ϑ n )
u ( φ n , ϑ n ) = [ sin ϑ n cos φ n 0 ] v ( φ n , ϑ n ) = [ cos ϑ n cos φ n cos ϑ n sin φ n sin θ n ] ;   n ( φ n , ϑ n ) = [ sin ϑ n cos φ n sin ϑ n sin φ n cos ϑ n ]
τ n ( φ n , ϑ n , t ) = u T ( φ n , ϑ n ) σ = ( t ) u ( φ n , ϑ n ) + v T ( φ n , ϑ n ) σ = ( t ) v ( φ n , ϑ n )
It is worth noting that, for periodic stresses (having a period T ), the point of the arrow of the vector P n describes a closed tridimensional curve. Consequently, τ n describes a closed curve in the plane (Figure 2). In the Figure, this curve is indicated as Γ n . On the one hand, the normal stress σ n ranges from a minimum σ n , m i n to a maximum σ n , m a x value (Figure 2). Therefore, it is possible to define the value of the alternating stress (acting on the plane having normal n ) as σ n , a defined according to Equation (6). On the other hand, to define the value of alternate tangential stress τ n , a (acting on the plane having normal n ), literature reports different methods. The most diffused one is the Minimum Circumscribed Circle (MCC) (Equation (7)) [49]. Considering that the curve Γ n is representative of the tangential stresses acting on the studied plane during the entire loading cycle, the MCC method suggests determining τ n , a as the radius of the smallest circle that can entirely contain the curve Γ n (Figure 3).
σ n , a = max T { σ n ( t ) } min T { σ n ( t ) } = σ n , m a x σ n , m i n
τ n , a = M C C T { τ n ( t ) }
By varying the spherical coordinates ( φ n , ϑ n ) systematically, it is possible to define a series of different planes passing through the point to be evaluated. For each plane it is possible to calculate the related stress parameters, i.e., τ n , a , σ n , m i n ,   σ n , m a x , and σ n , a . Based on these stress parameters, it is possible to individuate the critical plane having specific spherical coordinates ( φ c , ϑ c ) . According to the Matake, the Susmel et al., the Papadopoulos, and the McDiarmid criteria, the critical plane is defined as the plane that displays the maximum value of τ n , a (Equation (8)).
( φ C , ϑ C ) max φ , ϑ { τ n , a ( φ , ϑ ) }
Conversely, according to the Findley criterion, the critical plane is defined as the plane that presents the maximum value of the damage parameter ( D P ) defined as in Equation (9). This is a function of the alternating tangential stress ( τ n , a ) and the maximum stress reached in a cycle ( σ n , m a x ) . Therefore, the Findley criterion could lead to a critical plane having a different orientation with respect to the critical plane according to the other fatigue criteria.
( φ C , ϑ C ) max φ , ϑ { τ n , a ( φ , ϑ ) + 2 r τ / σ 1 2 ( r τ / σ r τ / σ 2 ) σ n , m a x ( φ , ϑ ) }
where   r τ / σ is the ration between the material fatigue limit at symmetrical alternating torsional loading ( τ f ) and material fatigue limit at symmetrical alternating bending loading ( σ f ) as in Equation (10). It is worth noticing that these material properties can be estimated through simple fatigue tests.
r τ / σ = τ f / σ f
Once the critical plane   ( φ c , ϑ c ) has been identified, the various criteria require that the damage parameter on this plane be calculated. In the present paper, the stress parameters related with the critical plane are labeled with the subscript c , i.e., τ c , a ,   σ c , m a x ,   σ c , a .
The various criteria differ on how the damage parameter ( D P ) is calculated. According to Findley, the damage parameter ( D P F i n d l e y ) is defined as in Equation (11). According to the Matake criteria, the D P M a t a k e is affected by the alternating (tangential) stress σ c , a ( τ c , a ) (Equation (12)). The Susmel et al. criteria requires calculating the damage parameter ( D P S u s m e l   e t   a l . ) according to Equation (13). With respect to the criteria proposed by McDiarmid, it is necessary to consider the ultimate tensile stress σ R (Equation (14)).
D P F i n d l e y = τ c , a + 2 r τ / σ 1 2 ( r τ / σ r τ / σ 2 ) σ c , m a x
D P M a t a k e = τ c , a + ( 2 r τ / σ 1 ) σ c , a
D P S u s m e l   e t   a l . = τ c , a + ( τ f σ f 2 ) σ c , m a x τ c , a
D P M c D i a r m i d = τ c , a + τ f 2 σ R σ c , m a x
To implement the Papadopoulos’ criteria, it is important to define the maximum octahedral stress σ h , m a x (in the time window T ). It can be calculated through Equation (15), where σ O is a vector with the principal stresses, i.e., the stresses that, for the same time instant t , satisfies Equation (16). I = is the identity matrix. The D P P a p a d o p o u l o s can be calculated according to Equation (17).
σ h , m a x = max T { 1 3 i = 1 , 2 , 3 σ O i }
det | σ = ( t ) σ O I = | = 0
D P P a p a d o p o u l o s = τ c , a + ( 3 2 ( 2 r τ / σ 1 ) ) σ h , m a x
Eventually, each fatigue criteria (based on critical plane) state that the component works safely as long as the value of the damage parameter, in each point, is below a specific threshold. Therefore, it is possible to calculate a safety factor ( S F ) (for each criterion and in each position) which formulation depends on the implemented criterion. For example, S F F i n d l a y is defined in Equation (18). In Equations (19)–(22) the S F for the Matake, Susmel et al., McDiarmid, and Papadopoulos criteria can be found, respectively. S F > 1 means that the analyzed stress state has not reached the critical value according to the studied criterion (and vice versa for S F < 1 ).
S F F i n d l a y = τ f 2 ( r τ / σ r τ / σ 2 ) D P F i n d l e y
S F M a t a k e = τ f D P M a t a k e
S F S u s m e l   e t   a l . = τ f D P S u s m e l   e t   a l .
S F M c D i a r m i d = τ f D P M c D i a r m i d
S F P a p a d o p o u l o s = τ f D P P a p a d o p o u l o s

3. Materials and Methods

In the present paper, two different gear-samples geometries subjected to STBF loading have been modeled by means of Finite Element Model (FEM). In Table 1, the geometrical parameters of the gears are reported. The above-mentioned gears were studied experimentally in [38,40]. The authors have collected experimental images of cracks in several teeth (related to the study conducted in [38,40]) in which failure by TBF occurred. Through these images, it has been possible to extrapolate the position of the nucleation point of the cracks in the teeth root region and the direction (angle) of early propagation (Section 3.1). FEM results have been elaborated through critical plane criteria to characterize the crack behavior in the ρ f P (Section 3.2). The numerical and experimental results have been compared in Section 4.

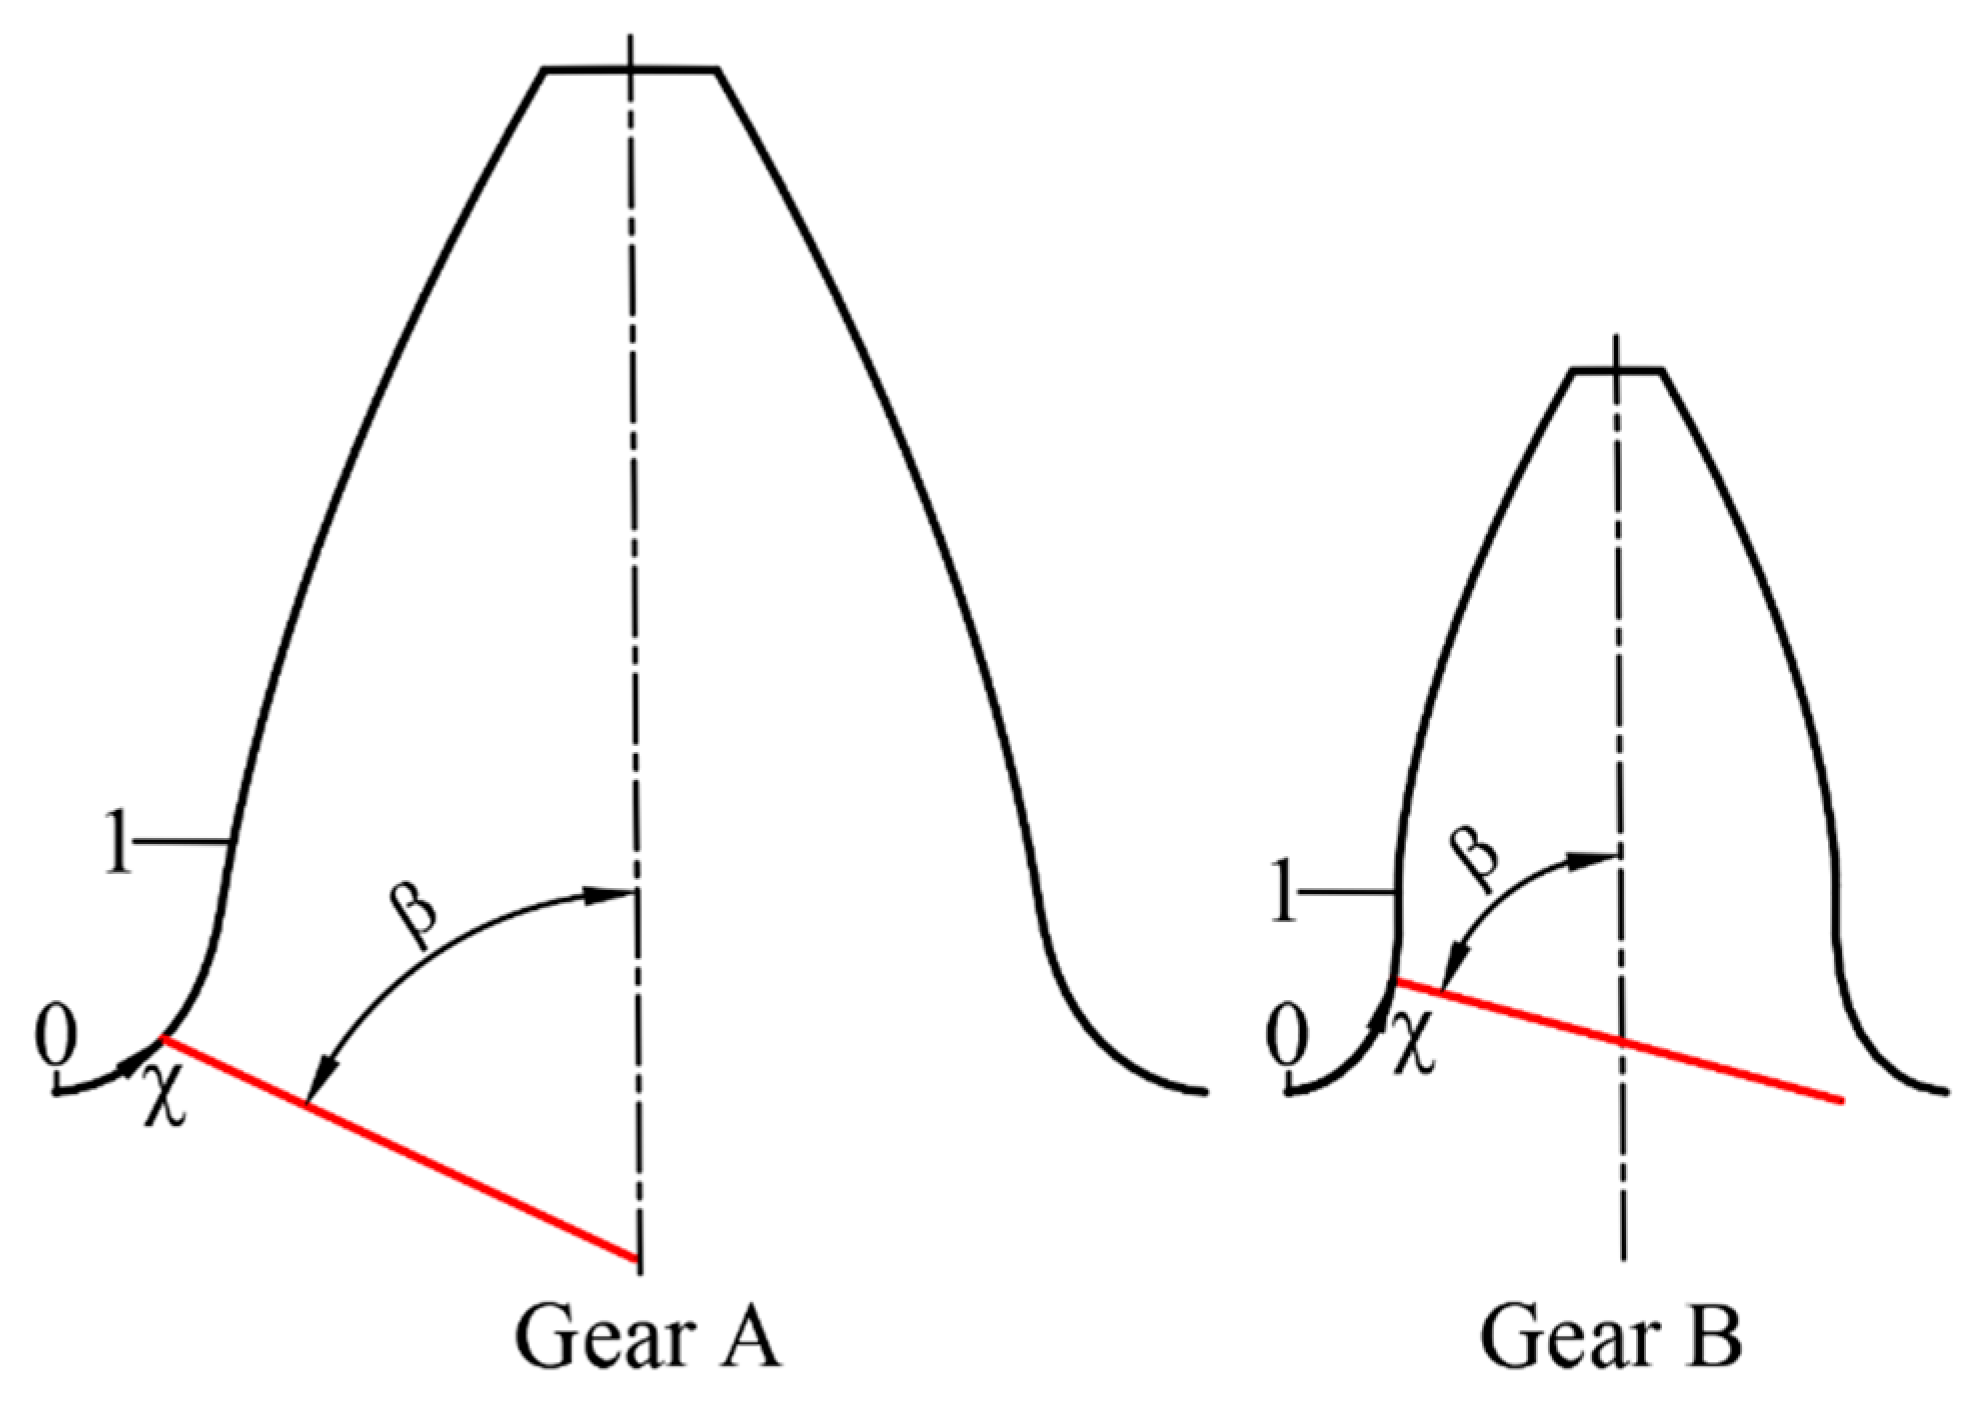
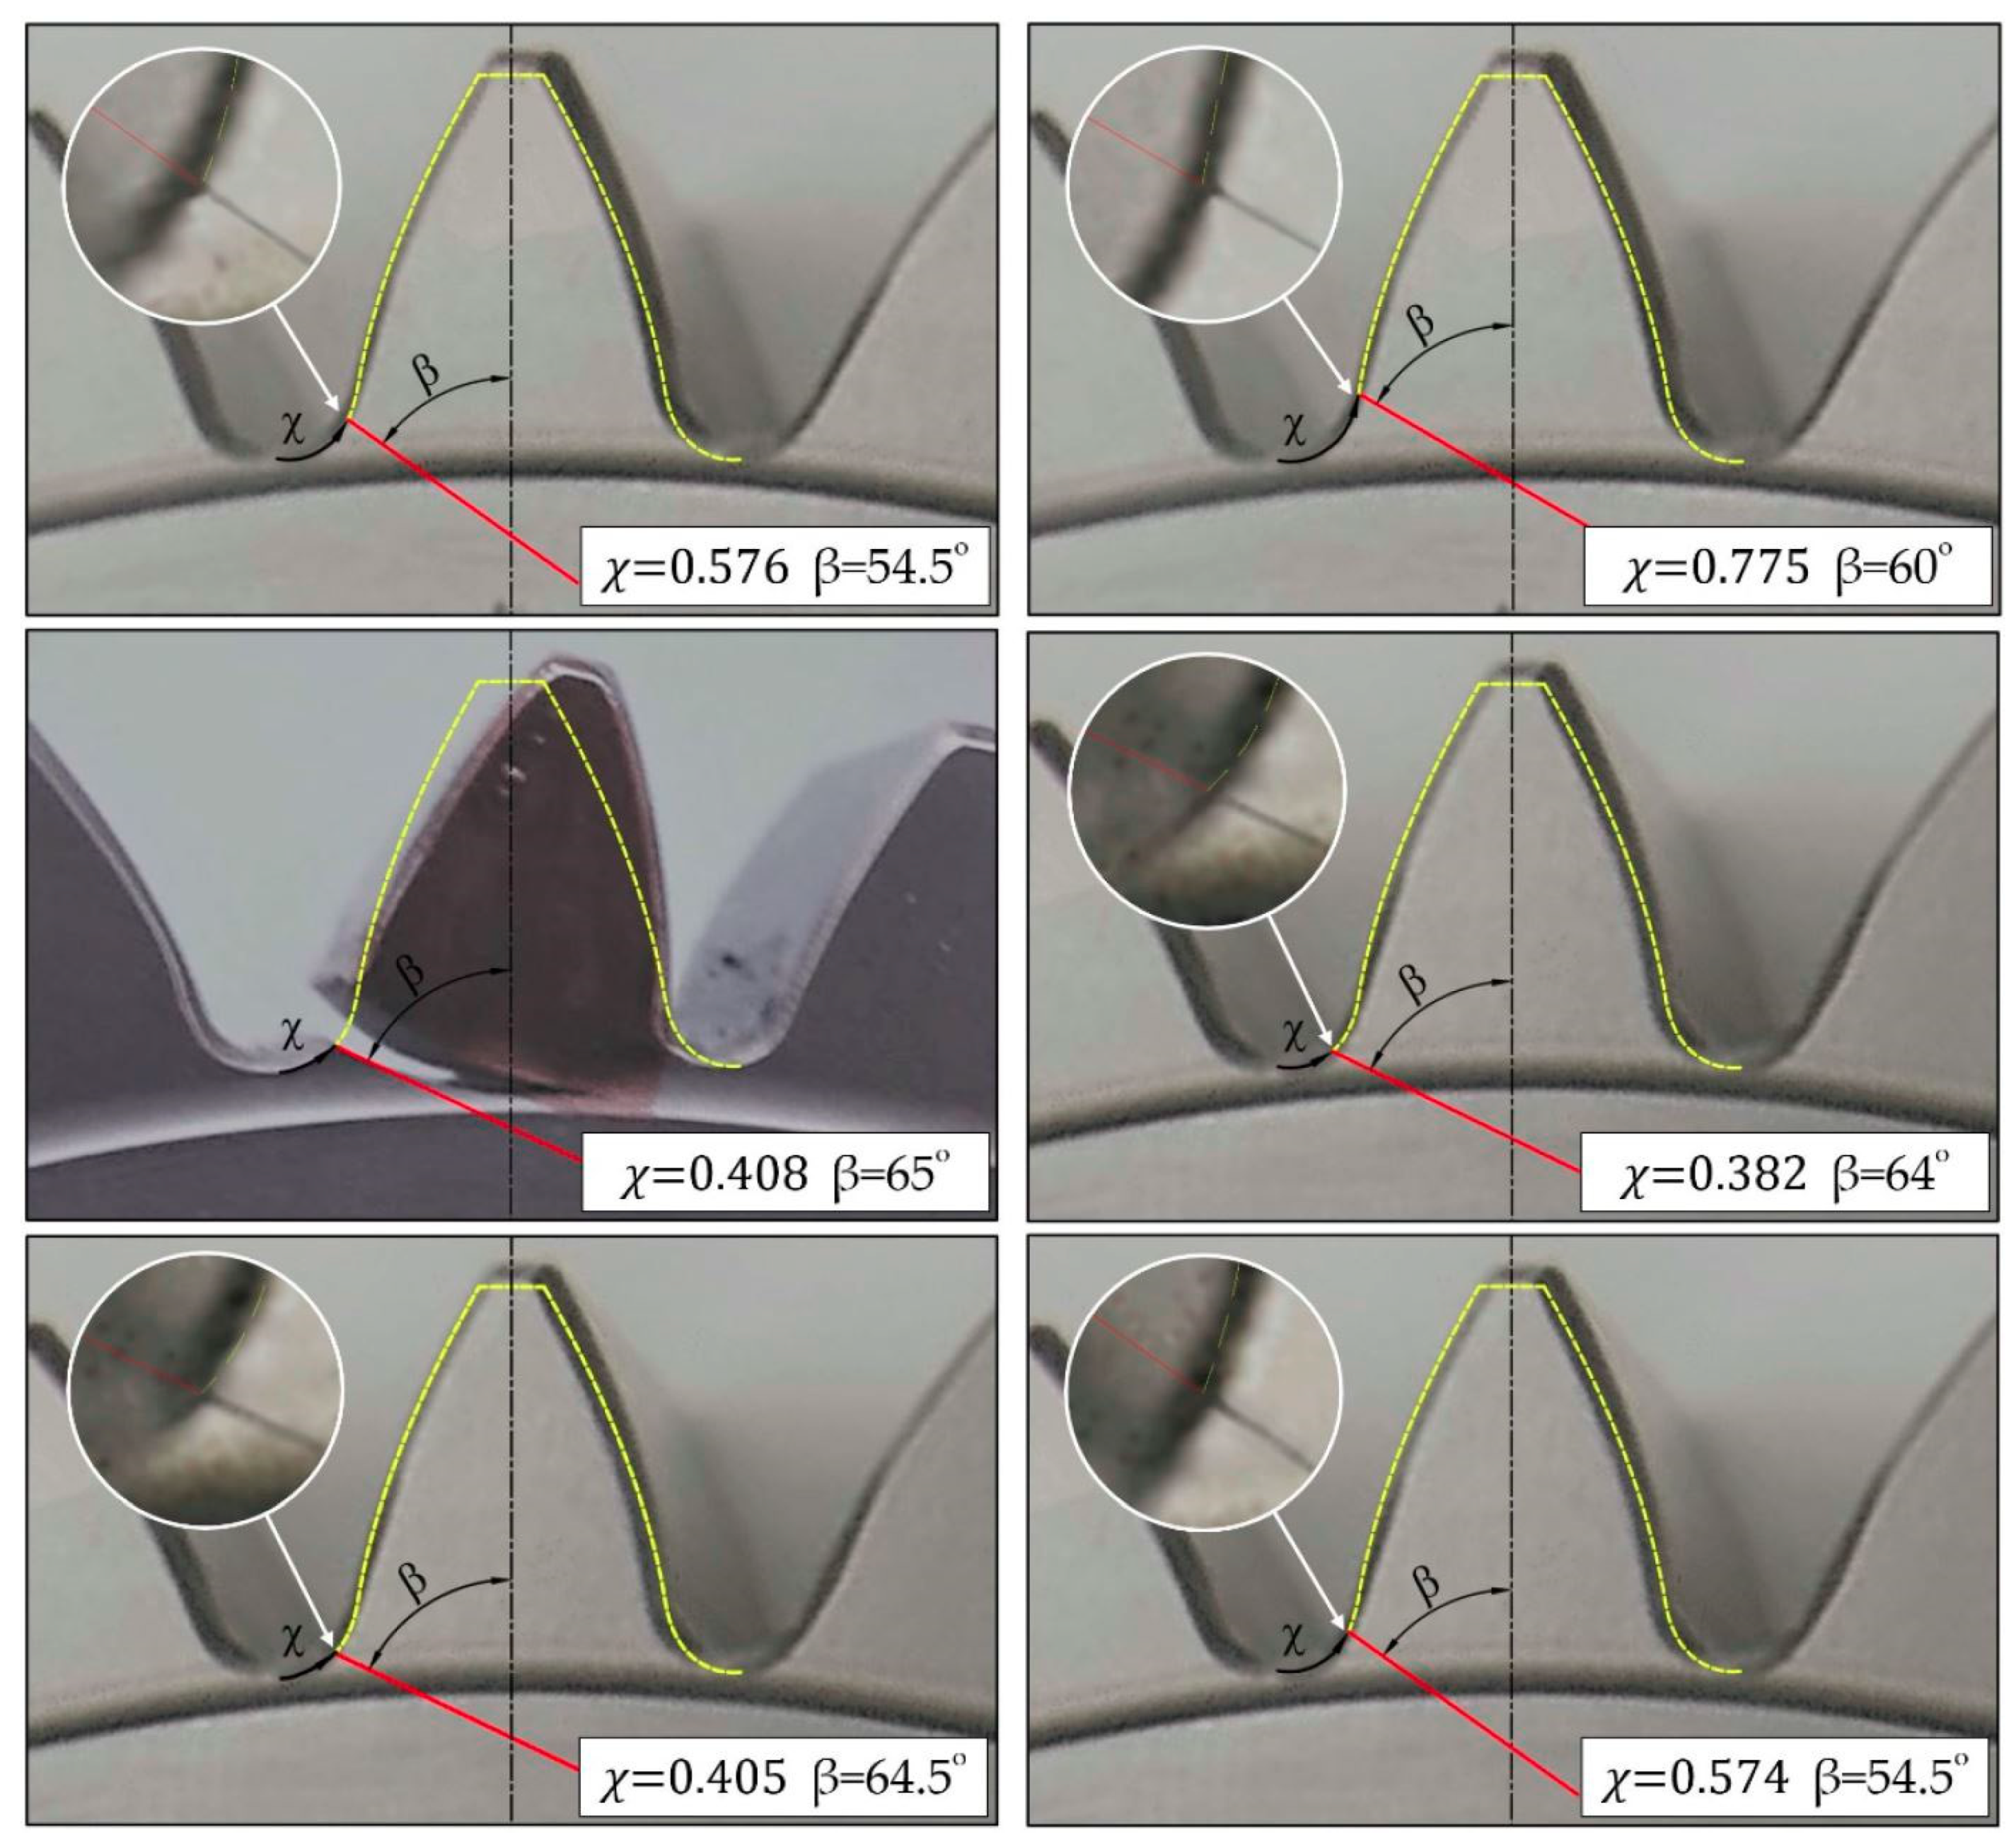
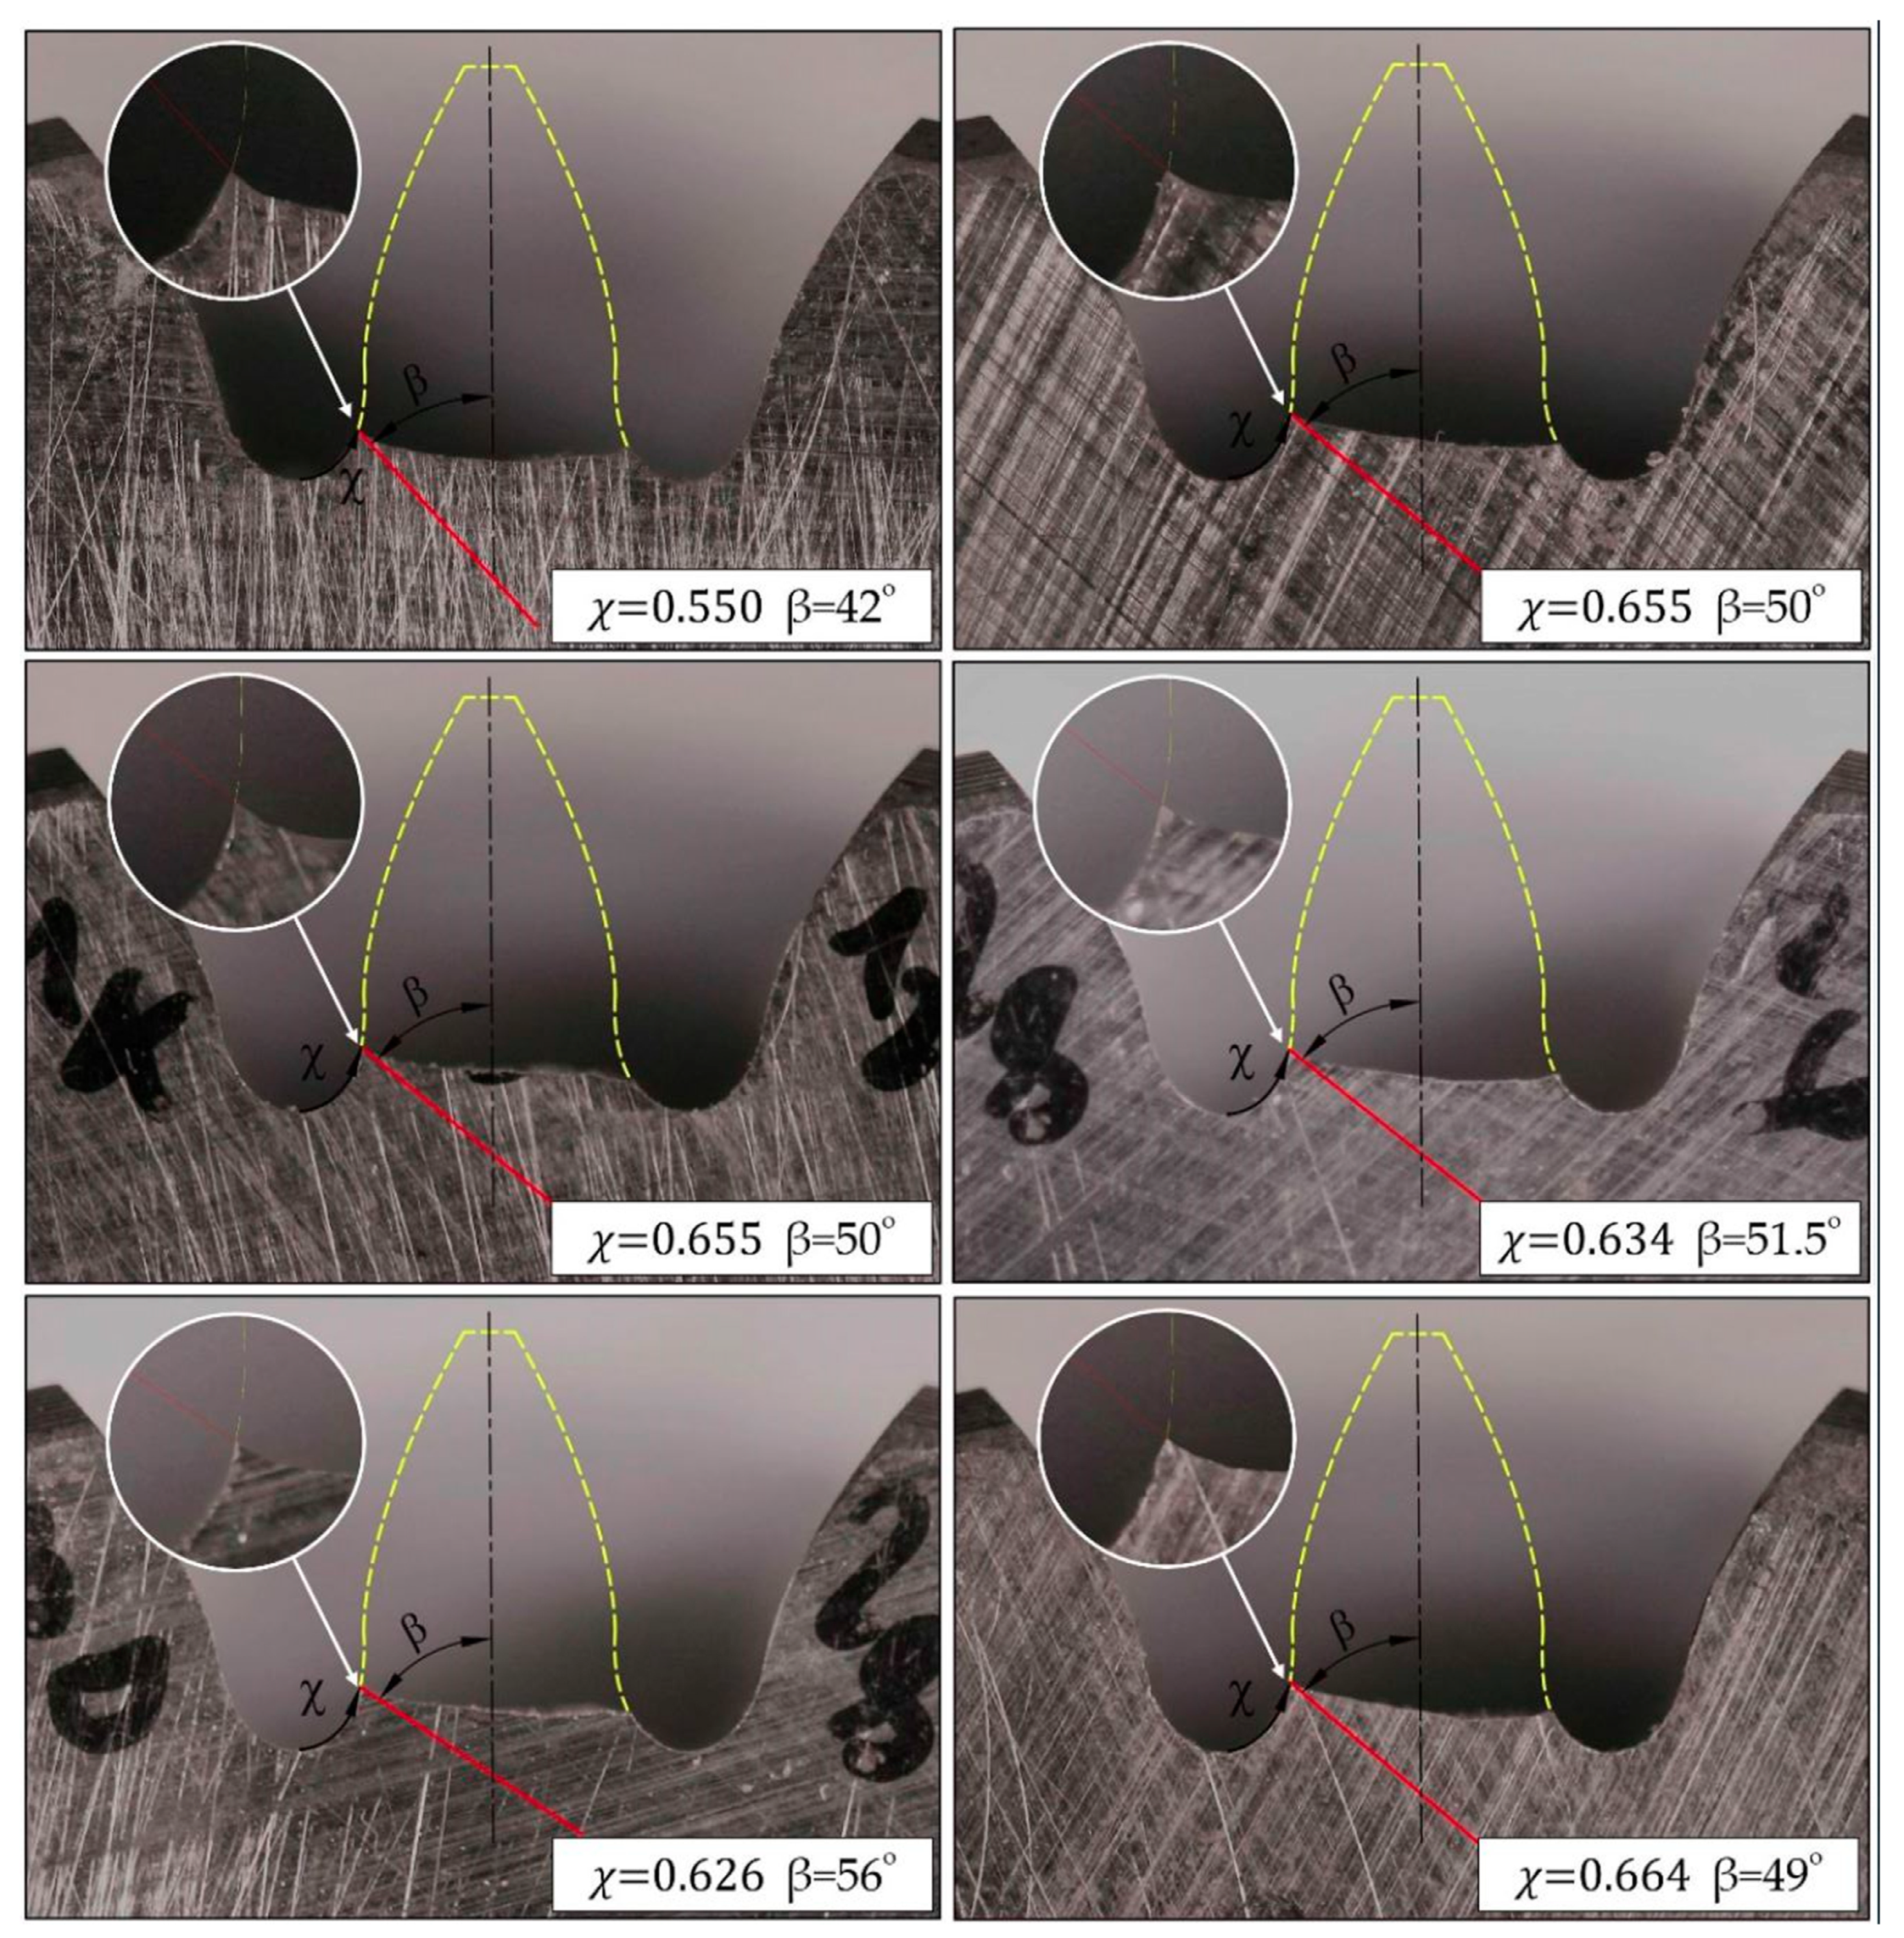
3.1. Individuation of Cracks Characteristic through Experimental Images

The crack propagation just after nucleation can be characterized by the two parameters χ and β (Figure 4). Using these coordinates, it has been assumed that the early propagation plane is always perpendicular to the view in Figure 4.
  • χ is a linear coordinate along the ρ f P . This coordinate can take any value from 0 (i.e., lower point in the radius at the foot) to 1 (i.e., connection point between the   ρ f P and tooth flank). Through χ, it is possible to define the position of each nucleation point.
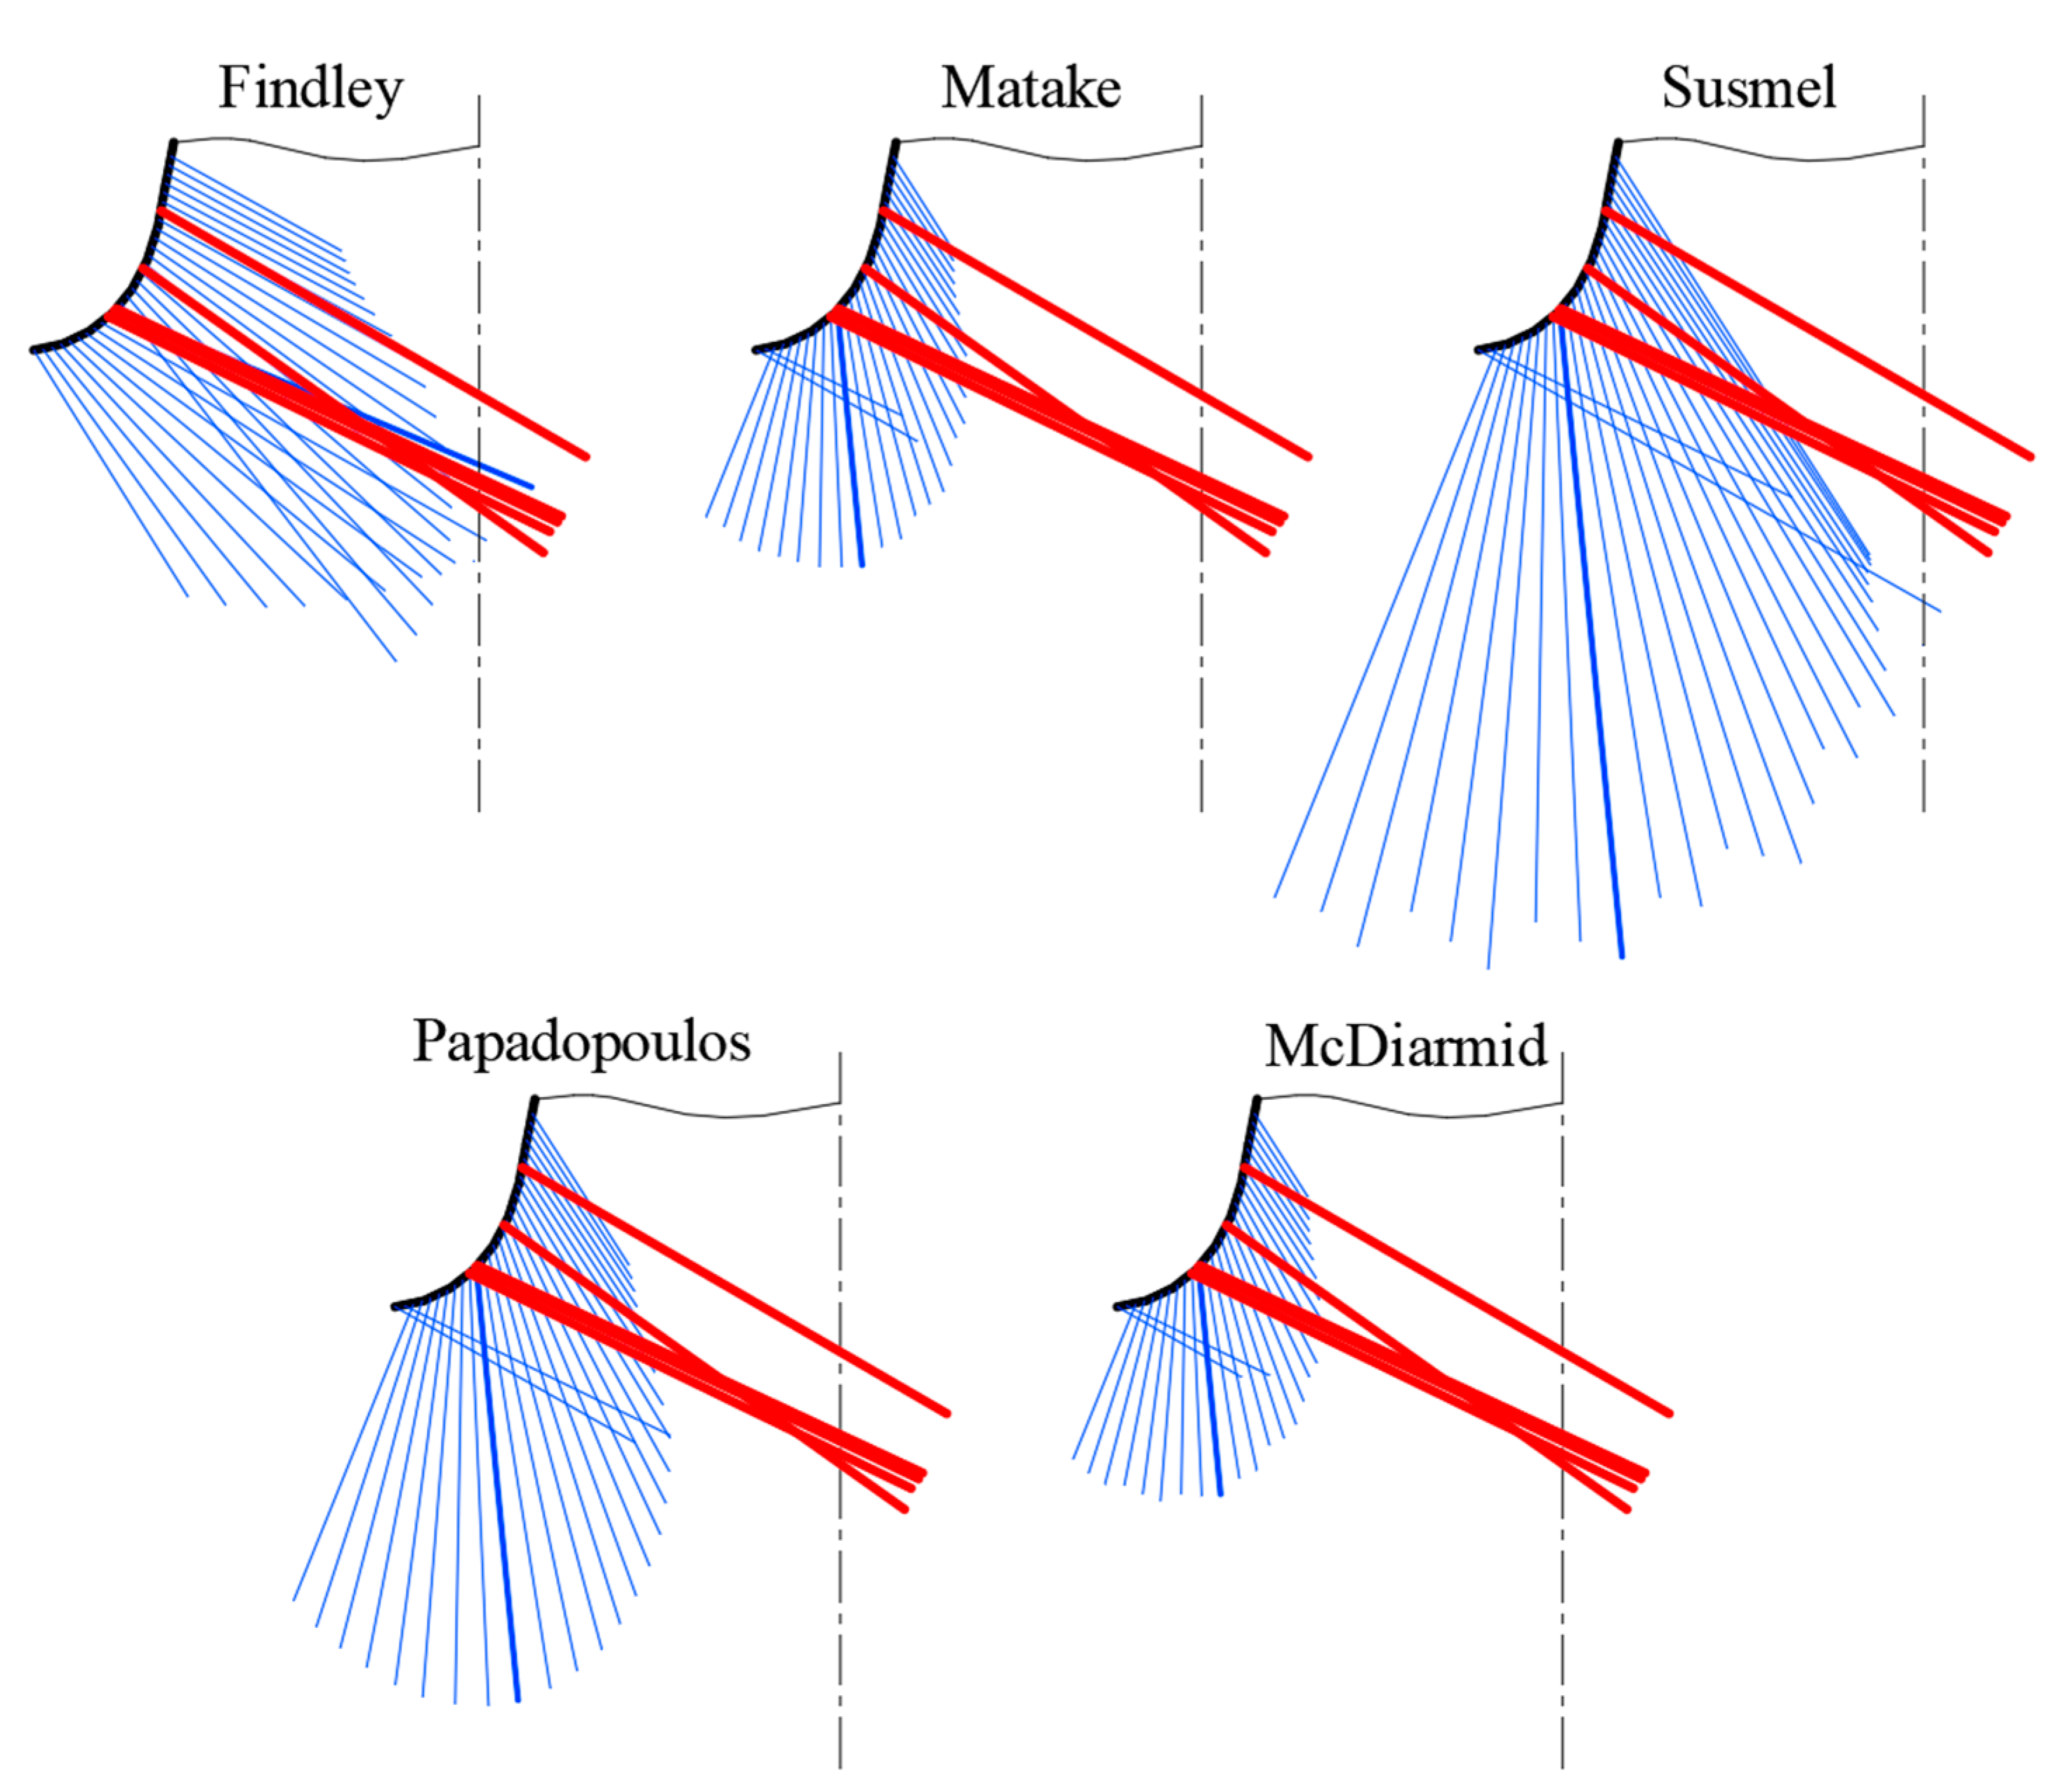
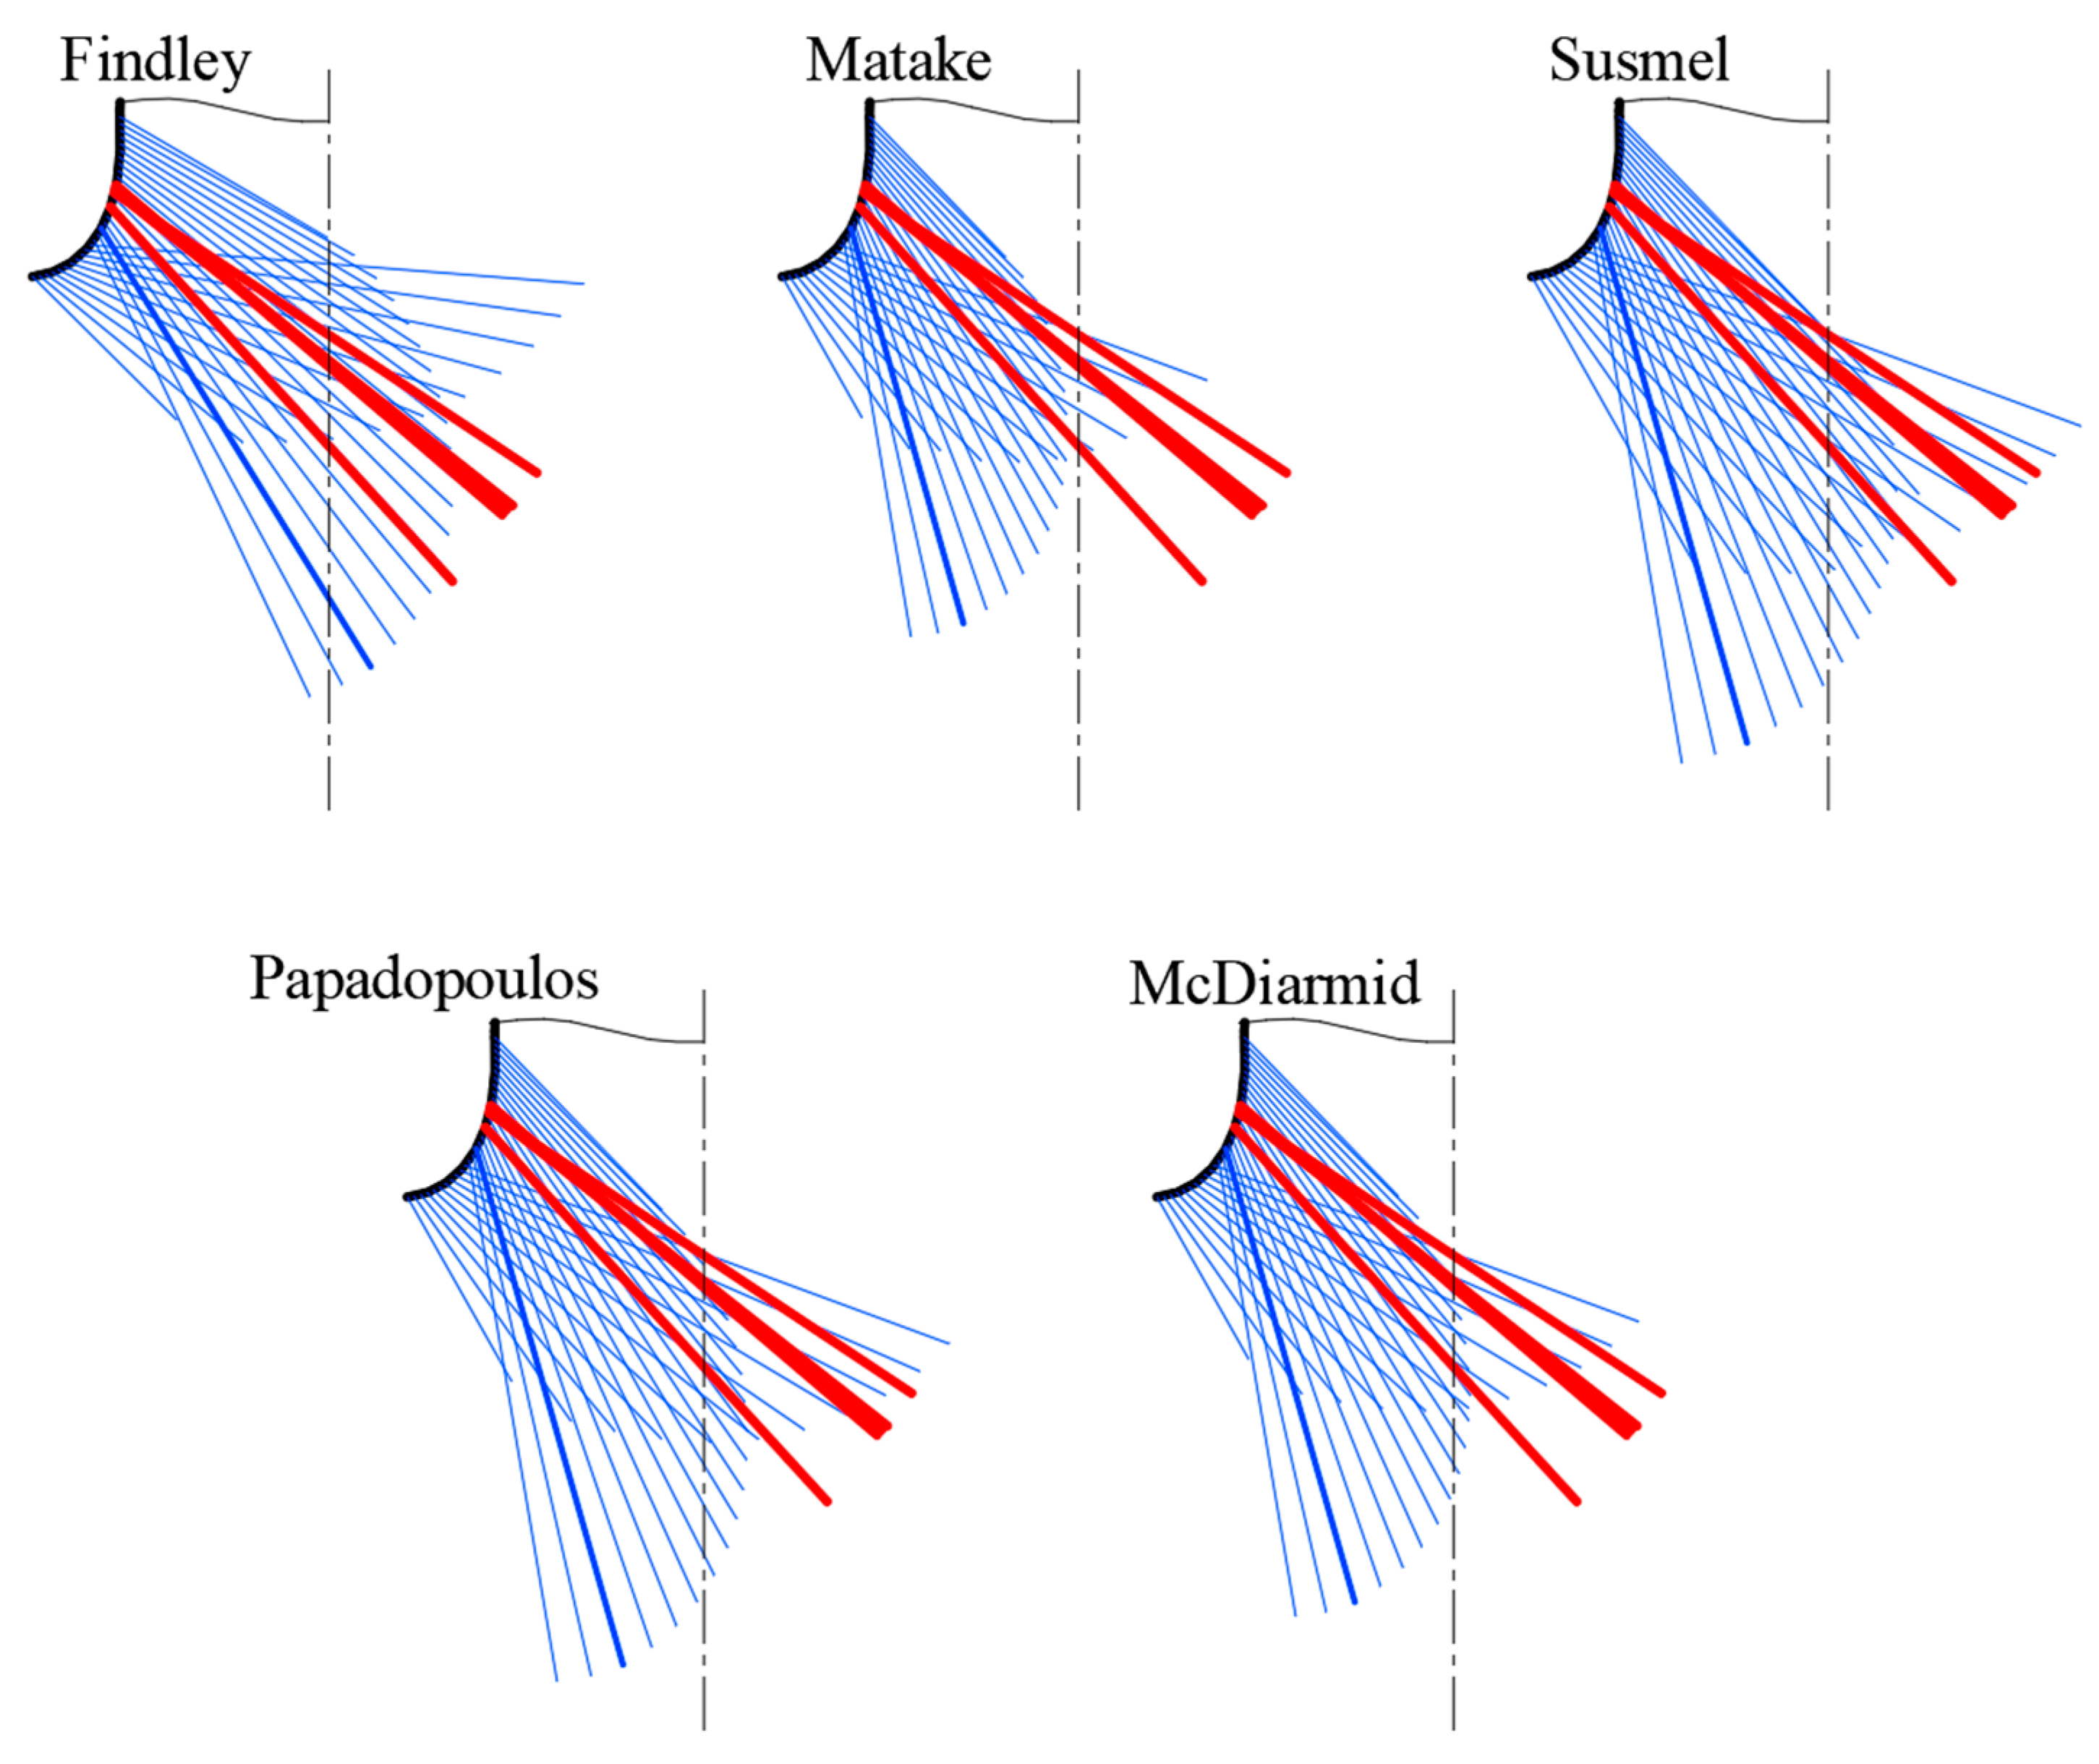
  • β is the angle between the tooth axis and crack direction in its early propagation.
In Figure 4, χ and β are reported for generic cracks (highlighted in red) in Gear A and Gear B. In the figure, the point in which χ assumes its minimum and its maximum value are indicated.
In Figure 5 and Figure 6, experimental images on which χ and β have been identified are shown. More specifically, Figure 5 shows six images of different teeth belonging to Gear A. The same, referred to as Gear B, is shown in Figure 6.
In the figures, the yellow dashed line represents the tooth profile (before the test) while the red solid line represents the direction of early propagation of the crack. It is worth noting that while in Gear B the crack always led to the complete detachment of the tooth, as far as Gear A is concerned, the tests were interrupted when the crack was detected via the variation of the stiffness of the system (even if it did not lead to the complete breakage of the tooth). Therefore, in some images of Gear A, the crack is of limited size and is hidden by the red line, which, however, represents its initial propagation direction.
With respect to Gear A (Figure 5), all the cracks nucleated in 0.382 ≤ χ ≤ 0.775 having a direction 54.5° ≤ β ≤ 65°. With respect to Gear B (Figure 6), all the cracks nucleated in 0.550 ≤ χ ≤ 0.664 having a direction 42° ≤ β ≤ 51.5°. It is interesting to notice that, for Gear A, three cracks nucleated in the proximity of χ = 0.400, while the other three cracks nucleated in different points. The latter cracks may be nucleated at different locations due to micro defects in the material. Moreover, in Gear B, the nucleation points have a lower dispersion, but are located in the proximity of the end of the grinding zone where, most likely, a micro notch has formed between the root radius and the beginning of the involute tooth profile.

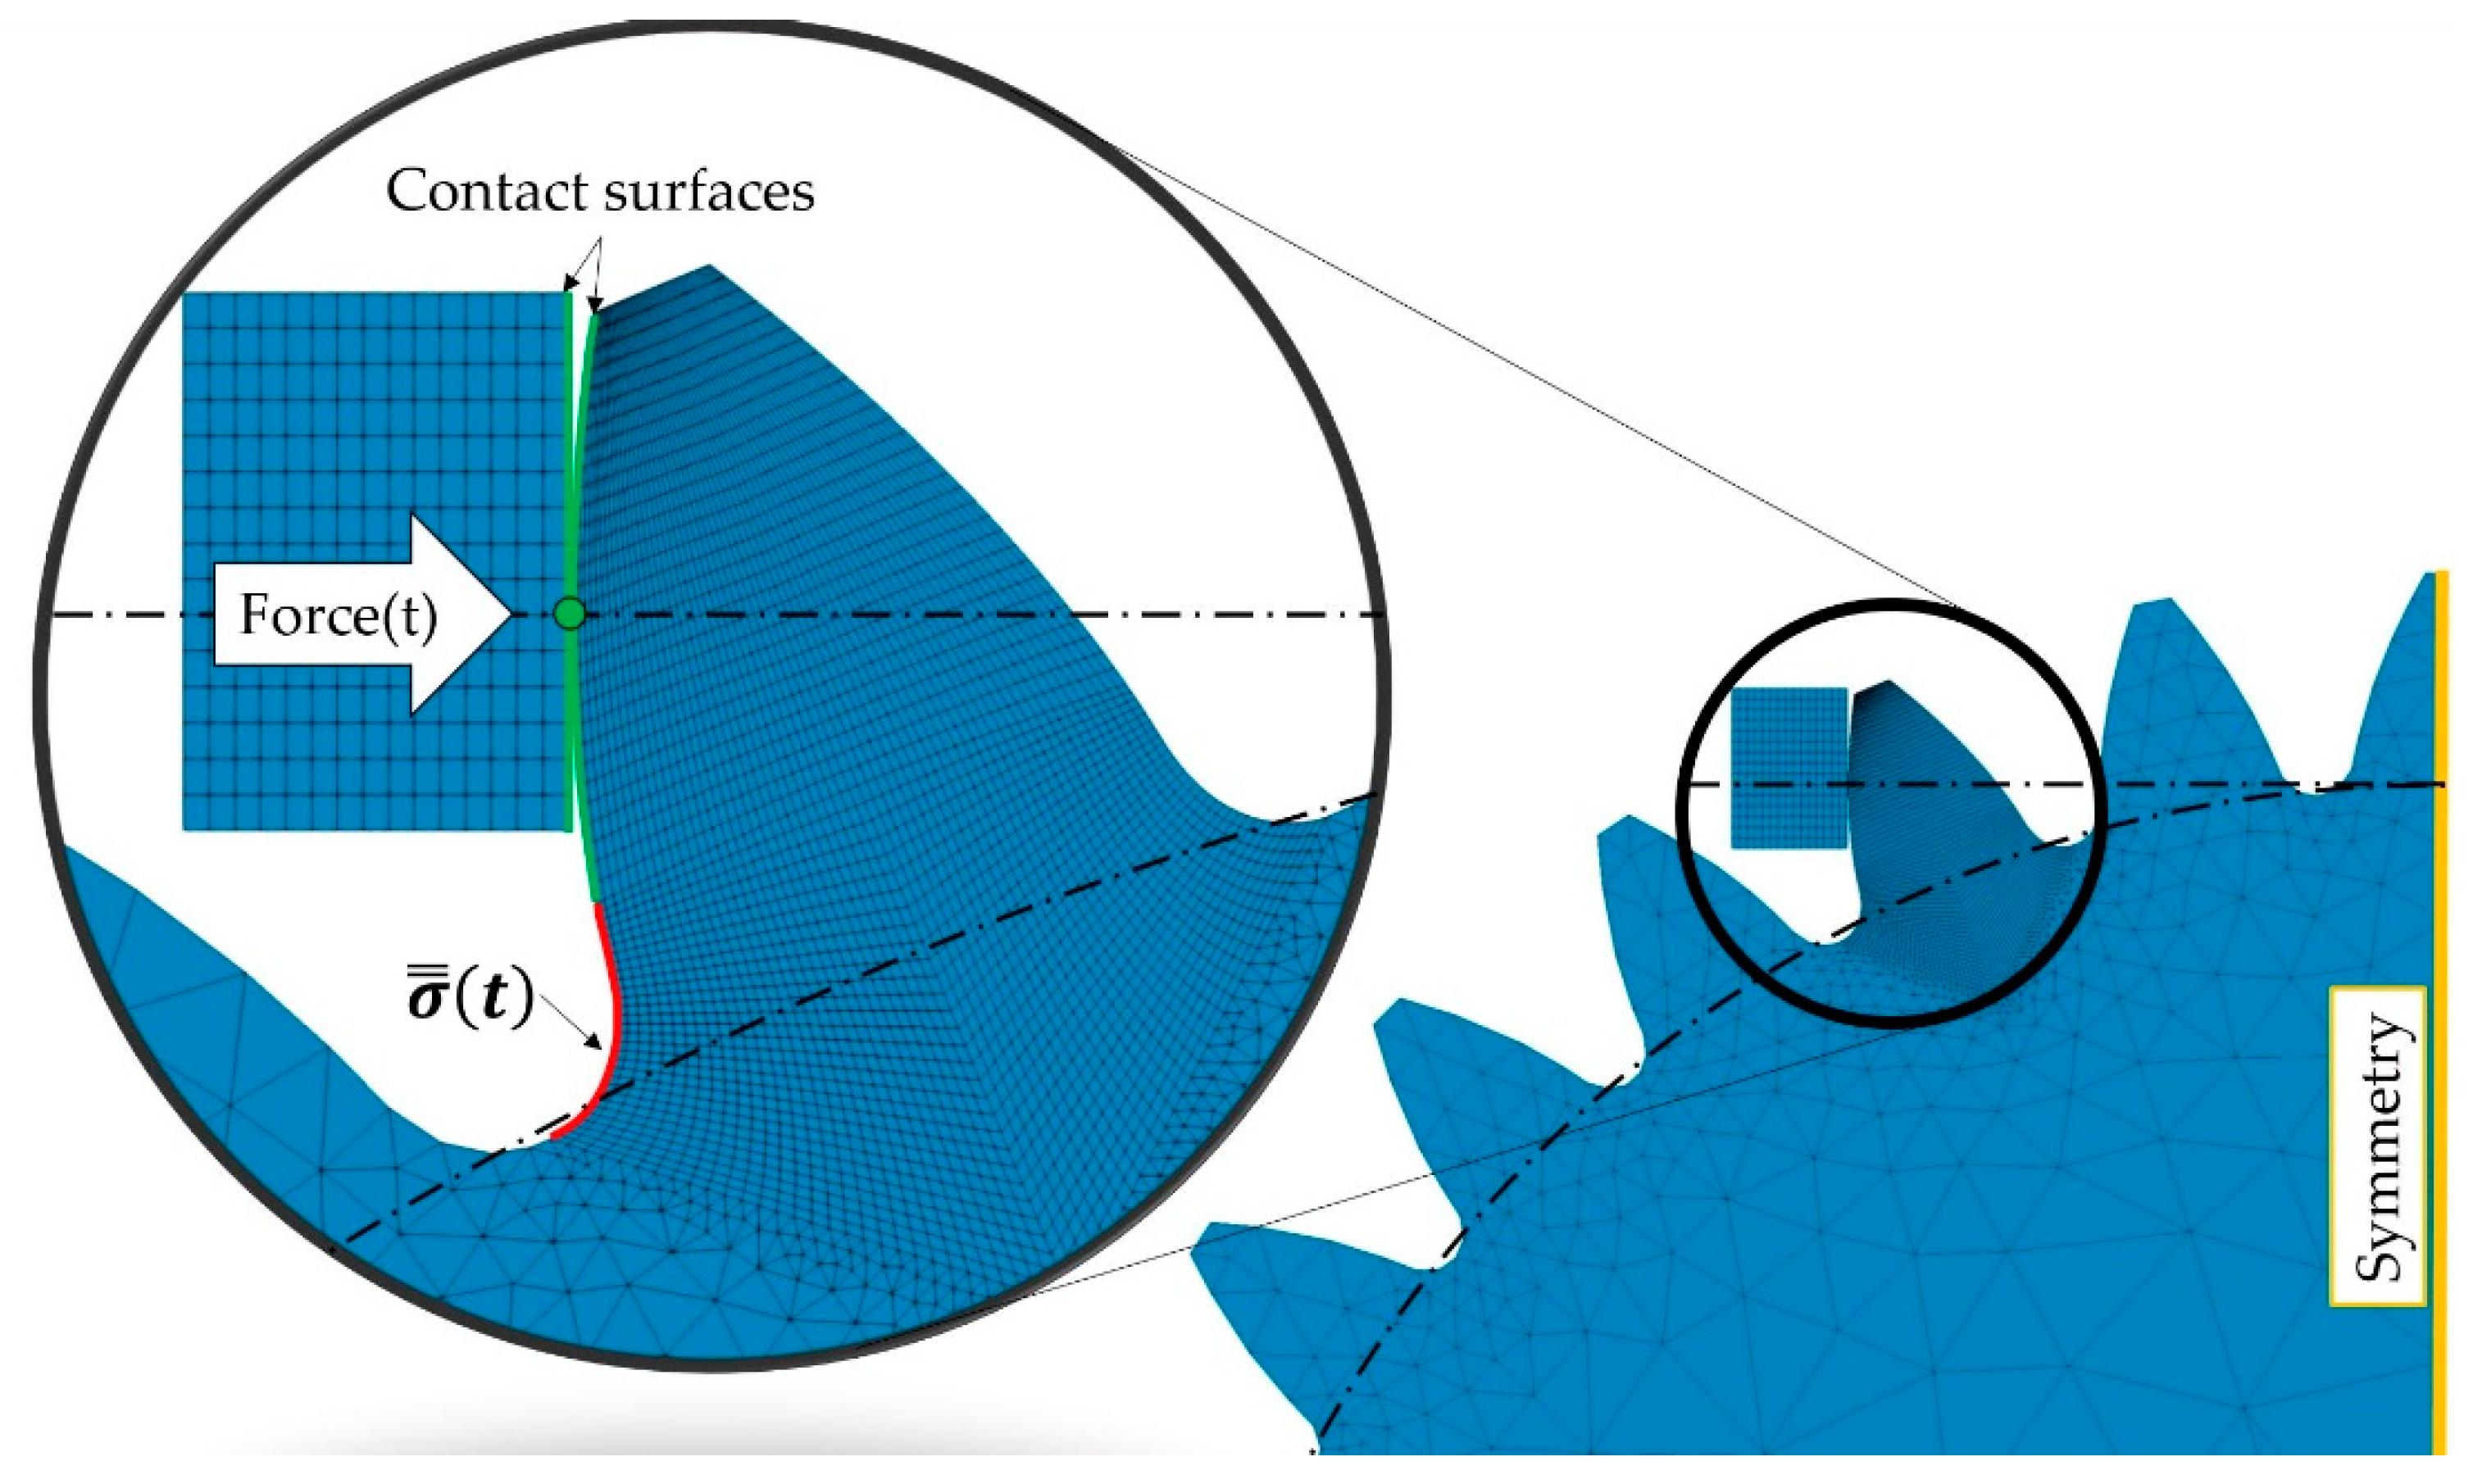
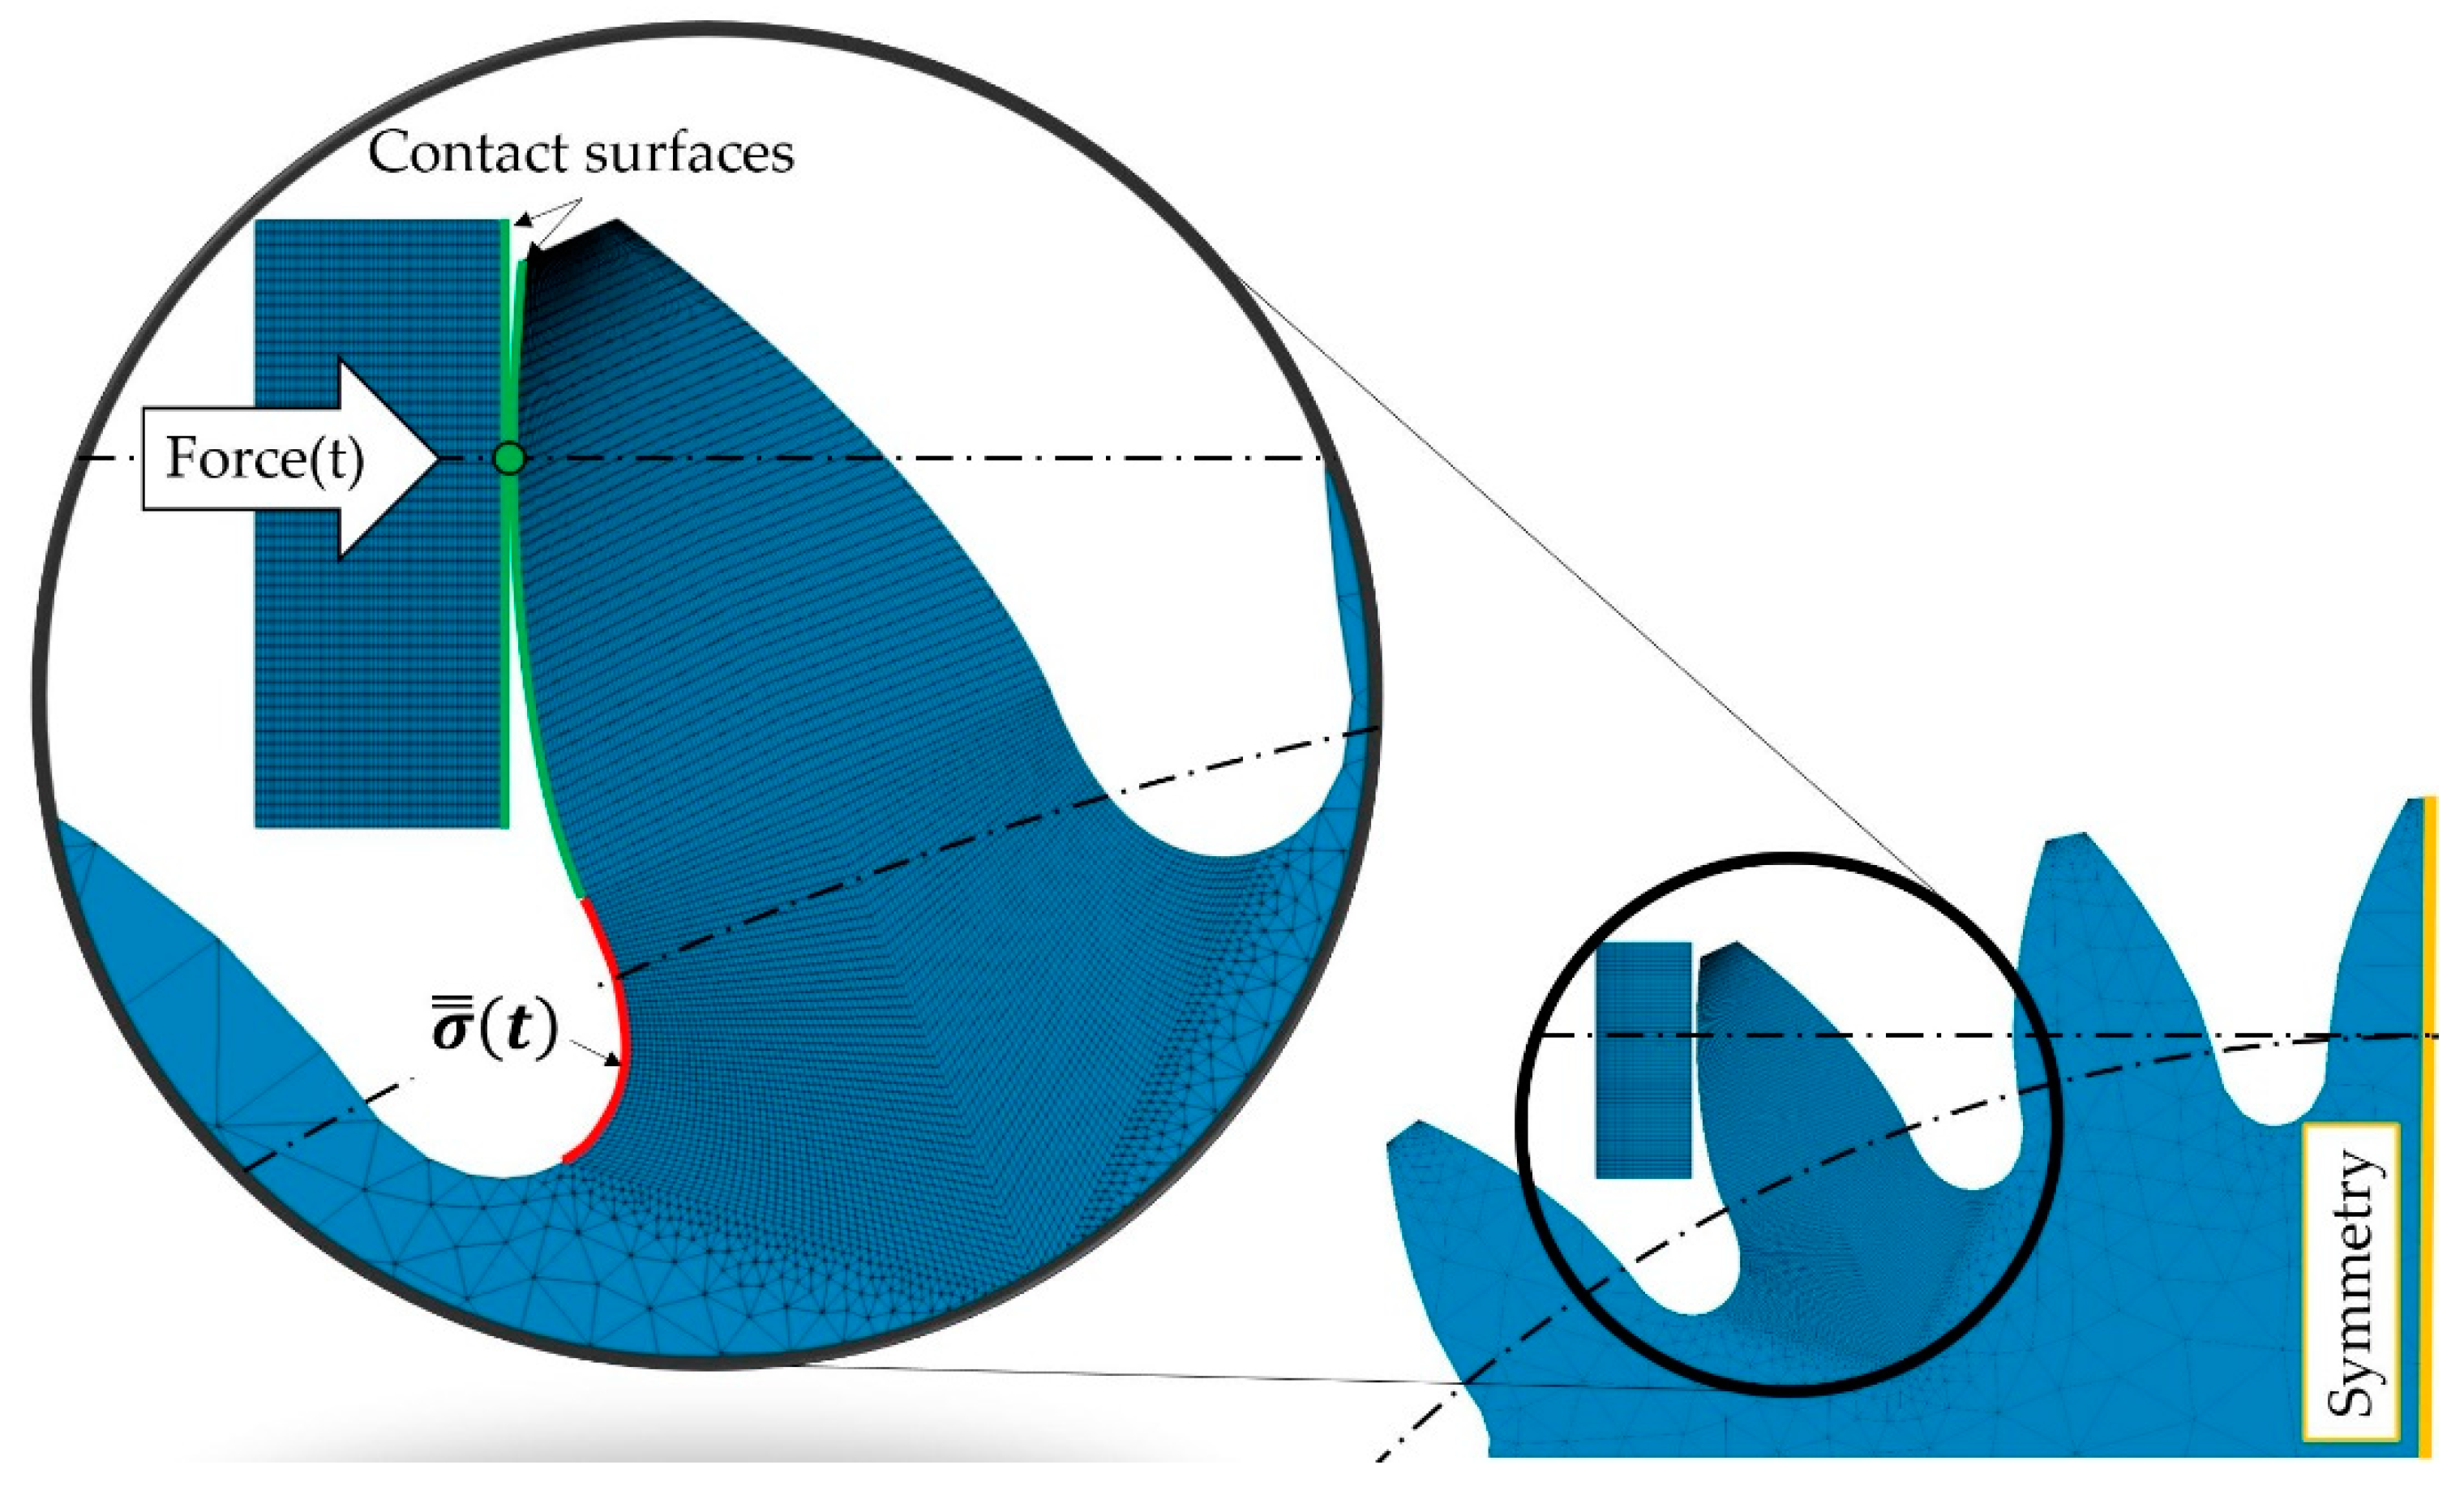
3.2. Numerical Elaboration Aimed to Characterize Cracks within Tooth Root Radius

The FEM has been set up into the open-source software, Salome-Meca/Code_Aster. In Figure 7 and Figure 8, it is possible to see the STBF test modeling for Gear A and Gear B, respectively. In the present study, 3D simulations have been performed to also consider the boundary effects.
To reduce the computational effort, only a quarter of each gear has been modeled exploiting symmetries. More specifically, on the one hand, half of the face width has been modeled. On the other hand, gears are symmetric on a plane parallel to the contact-face of the anvil and positioned at half of the Wildhaber distance (yellow line in Figure 7 and Figure 8).
The models have been created through extruded meshes. Linear elements having typical isotropic steel properties have been used i.e., a Young modulus equal to 205,000 MPa and a Poisson’s ratio of 0.3. In each model, hexahedral elements have been exploited to model the loaded tooth while TRIA6 elements, i.e., triangular base prisms, have been used to model the remaining volume of the gear. The mesh density has been increased in the loaded tooth after a sensitivity analysis. More specifically, the mesh density has been increased by 10% until the results of the simulations present a variation of less than 1%. The final models have the mesh characteristics listed in Table 2.
Non-linear simulations have been performed to simulate the contact between the anvil and the tooth flank for each gear. While the analyses are non-linear due to the contacts, the state of stress never exceeded the yielding. In Figure 7 and Figure 8, the contact faces are indicated with green lines and the theoretical contact point is indicated with a green circle. It is located in the intersection between the horizontal line tangent to the base circle (represented in the figures) and the tooth flank. With respect to Gear A, a pulsating compressive force varying sinusoidally from a minimum value of 3700 kN to a maximum value of 37,000 kN has been applied to the anvil. With respect to Gear B, the minimum and maximum value of the force applied result 1498 kN and 14,980 kN, respectively. Through the above-mentioned loading configuration, taking into consideration the symmetries exploited, it has been possible to replicate the experimental conditions, i.e., ratio between the minimum and maximum force of 0.1 (applied in the experimentation). Those levels of force are the loads that averagely lead to a failure in 106 cycles.
The stress tensor σ = ( t ) was extracted for both gears in the most critical areas where fracture is expected to nucleate, i.e., within the ρ f P (nodes highlighted with the red line in Figure 7 and Figure 8). At this point, the approaches presented in Section 2 have been applied by defining the material properties ( σ f ,   τ f , σ R ). In particular, Gear A has been manufactured with VAR 9310 having a bending fatigue limit σ f = 1400   MPa , a torsional fatigue limit τ f = 1100   MPa , and an ultimate tensile strength σ R = 2700   MPa . On the other hand, Gear B has been manufactured through 20MnCr5 having σ f = 516   MPa , τ f = 303   MPa , and σ R = 1028   MPa .
Therefore, for each gear and for each point within the ρ f P , it has been possible to elaborate the stress tensor σ = ( t ) implementing the different fatigue criteria presented in the previous section. In the present paper, the studied points are the nodes of the computational grid belonging to the ρ f P . This choice was made in order to avoid the need of interpolation. The workflow followed is graphically explained in Figure 9. For each gear, the workflow is structured with four FOR loops. The innermost one analyses data for each simulated time step (in these cases T = 40 ). The FOR loops on ϑ and φ aim to discretize the space by defining the direction of different planes varying by 0.5° each cycle (from 0° to 180°). The FOR loop on the nodes within the ρ f P i.e., N m a x = 31 for Gear A and N m a x = 51 for Gear B, aims to study the most critical positions. Indeed, for each node N ( θ c φ c ) , belonging to the symmetry section of the tooth (i.e., the most critical), the critical plane has been individuated through the presented framework. This allowed for achieving a twofold objective. First, it allows us to calculate the damage parameters for each node and each criteria (through Equations (11)–(14) and (17)). Therefore, it has been possible to calculate S F for each node and each criteria (Equations (18)–(22)) (green boxes in Figure 9). In this way, it has been possible to estimate the differences between nodes in terms of criticality. Moreover, the most critical node according to the different criteria implemented has been established. Second, it has allowed us to identify the direction of the crack propagation (at least in in the proximity of the studied nodes) if it nucleates in any of them (by differentiating between the various fatigue criteria) (blue boxes in Figure 9).
The above-mentioned direction of the critical plane corresponds to the direction of early propagation of the crack after nucleation (evaluated for each node and each criterion). In addition, S F is representative of the criticality of the node (according to the criteria in question). The combination of these two results, i.e., direction of critical plane and S F , allowed for obtaining an overview of possible crack propagation scenarios in the ρ f P according to the various criteria. These results have been compared with the experimental ones in terms of crack positions and paths observed after performing STBF tests. The comparison has allowed for assessing the effectiveness of each criterion to correctly predict the failure.

4. Results

As mentioned in the previous section, numerical and experimental results have been compared. On the one hand, in STBF specimens, it has been possible to identify both the point where the crack nucleated and the direction of crack propagation for each tooth that failed during the test. On the other hand, through the elaboration of numerical results, for each node within the ρ f P it has been possible to evaluate the damage parameter (it indicates the criticality of the node in question) and the direction of the critical plane (it indicates the direction of the initial crack propagation if the crack nucleates in the studied node).
The comparison has allowed for assessing the effectiveness of each criterion to correctly predict the failure. More specifically, each criterion has been evaluated based on its attitude to:
  • Provide a S F consistent with the experimental measurements, i.e., how the S F is close to 1 since the simulated loading condition, according to the experimental results, should lead to a maximum tensile stress σ F equal to the permissible bending one σ F P ;
  • Identify the actual critical node, i.e., how close the numerically identified critical node is to the crack nucleation point obtained through experimental tests;
  • Determine the actual crack direction, i.e., how the numerically calculated critical plane direction (at the node closest to nucleation point) is similar to the experimentally observed crack propagation direction.
In Table 3, the minimum S F calculated according with the investigated criteria and the relative node location is reported for the two gears. With respect to the parameter χ, all the criteria show a congruence in identifying the critical node ( χ = 0.400 for Gear A and χ = 0.435 for Gear B). In addition, it is interesting to highlight that, according to the standard [14], the critical node should be located in χ = 0.508 for Gear A and χ = 0.430 for Gear B (the standard [14] defines the critical point as the point of the fillet tangent to a straight line having 30° inclination with respect to the axis of the tooth). Therefore, on the one hand, numerical results lead to individuate the critical node in the same position of the standard for Gear B and in a different position for Gear A. On the other hand, experimental results show a greater variability in the nucleation point that, in turn, are not in agreement with the standard in either case but in very good agreement with the numerical results for Gear A.
With respect to the value of   S F , in Table 3 it emerges that the implementation of the Findley criterion leads to values of S F closer to the unity for both the gears. Comparable values emerge even when implementing the Papadopoulos criterion. Moreover, while for Gear B all   S F values are close to unity (ranges from 0.94 to 1.23), for Gear A Matake and McDiarmid criteria lead to very high values of S F i.e., 1.96 and 2.14, respectively. In both the cases it is possible to assert that the Susmel criteria is the most conservative one.
In Figure 10 and Figure 11, experimental and numerical results are graphically compared. Figure 10 is related to the   ρ f P of Gear A, Figure 11 concerns the   ρ f P of Gear B. In particular, for each of the criteria investigated, the direction of the critical plane calculated in different nodes of the fillet are shown through blue lines. The length of the segments is proportional to the damage parameter. The thicker blue line represents the critical plane having the higher damage parameter. The red lines represent the experimental results and have length as if it was a critical plane having a unit S F . For each criterion, only the   ρ f P and the tooth axis have been reported. The results can be represented graphically in 2D since the critical planes are all perpendicular to the views in the figures.
Naturally, the direction of the critical planes only varies between Findley and the other criteria, which, in turn, identify the critical plane in the same way. What changes between the various criteria is the value of the damage parameter associated with each node and, therefore, the length of the blue segments.
With respect to Gear A, it is possible to notice that most of the experimentally measured cracks are located in the proximity of the most critical node (i.e., the intersection between the thickest blue line and the radius). However, only the Findley criterion is capable of identifying, with very good approximation, the direction of early propagation of the crack. In addition, Findley’s criterion also allows for identifying the direction of cracks even when these nucleate in different positions of the radius, i.e., χ = 0.576 ,   χ = 0.574 ,   χ = 0.775 (most likely due to minor manufacturing or material defects in those positions).
The other criteria lead to very different angles with respect to the ones observed experimentally, e.g., 59° difference between the plane with the maximum τ c , a and the crack observed in its proximity. Therefore, the Findley criterion is the criterion that better models crack nucleation (and early propagation) at the   ρ f P of Gear A.
With respect to Gear B, most of the experimentally observed cracks are not in the proximity of the most critical plane calculated numerically. However, also in this case, the Findley criterion is capable of better estimating the crack propagation direction within the whole ρ f P . Indeed, the other criteria suffer from errors ranging from 15° to 25° while Findley approximates the direction with an error of less than 5°.

5. Discussion and Conclusions

In the present paper, a methodological approach for implementing five different fatigue criteria based on the critical plane is presented. This relies on the elaboration of the stress tensor σ = ( t ) calculated via FE simulations on specific nodes modeling the ρ F in STBF loading condition. With the aim of evaluating the accuracy of the different criteria, two different gear geometries have been studied. In both cases, the gears had been experimentally tested and, therefore, it has been possible to obtain the force values leading to the permissible stress, the crack nucleation points, and the crack propagation (just after nucleation) directions in multiple tests. Therefore, the numerical results have been compared with the experimental ones in terms of: (1) capability of the criteria to provide a S F equal to one; (2) identify the actual critical node; and (3) determine the actual crack direction.
With respect to the point (1), Findley and Papadopoulos are the criteria that lead to the expected outcome most effective in both gears. The Matake criterion leads to overestimating the material strength in both the gears. The Susmel et al. criterion tends to underestimate the material properties and, therefore, it results in being a conservative criterion. The McDiarmid criterion leads to two different results in the two gears, i.e., in Gear B the value of S F is close to unity while it is more than double for Gear A. This may be due to the high tensile strength of the Gear A material that, in turn, it is considered in the formulation of the damage parameter according to McDiarmid. Eventually, in terms of the point (1), the Findley and Papadopoulos criteria are the most appropriate ones to be applied on gears for estimating fatigue behavior.
With respect to the point (2), all criteria agree in identifying the most critical node in both gear geometries. However, the comparison with experimental results shows that in Gear A, numerical results correctly identify the nucleation point of the crack, while in Gear B, the nucleation point is not accurately identified. Nevertheless, the numerical results of Gear B agree with the standard [14]. In addition, it is worth noting that some cracks in Gear A are located in different points, probably due to micro defects of the material or in the manufacturing process, while in Gear B all the cracks nucleate in the proximity of the end of the grinding zone between the ρ f P and the tooth flank. Moreover, it is possible to notice that the difference in the damage parameter between neighboring nodes is relatively low (less than 3% of difference in the proximity of the most critical node). Therefore, it is possible to state that about 25% of the studied area is subject to a damage parameter above 90% of the maximum damage parameter. Eventually, it is possible to assert that the experimental cracks occur in different positions due to phenomena related to micro-defects that, in turn, were not reproduced with the present FE modeling.
With respect to the point (3), Findley’s criterion is undoubtedly the most appropriate for identifying the direction of crack propagation in each possible nucleation point of both the studied gears. Therefore, it is possible to assert that the crack propagation direction at the ρ f P does not follow the plane of maximum alternating shear stress but the plane of maximum damage parameter according to Findley. Indeed, all experimentally identified cracks follow a direction relevant to that indicated by the implementation of Findley’s criterion. This result could open the door to the development of new fatigue criteria based on the critical plane for the study of gear. Indeed, an interesting future research direction would be to formulate and/or verify criteria defining the critical plane by the damage parameter (as currently done by Findley’s criterion) and, therefore, taking into account also the stress normal to the critical plane for its definition.
Eventually, it is worth noting that the method proposed in this paper has a general validity since it models three-dimensional geometries. However, in the specific case studied in this article, two-dimensional models could also be used to speed up the simulations. In this case, to implement the elaboration of the stress history, it would have been possible to use cylindrical coordinates by setting an angle constant consistent with the simulated model.

Author Contributions

Conceptualization, F.C. and L.M.; methodology, F.C. and L.M.; software, L.F.; validation, L.B., L.M. and F.C.; formal analysis, F.C. and L.M.; investigation, F.C. and L.M.; resources, L.B., F.C. and L.M.; data curation, L.F., F.C. and L.M.; writing—original draft preparation, L.M.; writing—review and editing, F.C.; visualization, L.M., L.B.; supervision, F.C. All authors have read and agreed to the published version of the manuscript.

Funding

This work was supported by the Open Access Publishing Fund of the Free University of Bozen-Bolzano.

Institutional Review Board Statement

Not applicable.

Informed Consent Statement

Not applicable.

Conflicts of Interest

The authors declare no conflict of interest.

Nomenclature

TBFTooth Bending Fatigue
TBSTooth Bending Strength
STBFSingle Tooth Bending Fatigue
FEFinite Element
MCC Minimum Circumscribed Circle
DP Damage Parameter
ρ f P Tooth Root Radius
σ F Maximum tensile stress
σ F P Permissible bending stress
σ F l i m Material strength
σ = ( t ) Stress tensor history
P n Stress exerting on a plane defined by a normal vector n
φ n , ϑ n Spherical coordinates of the plane defined by a normal vector n
σ n Stress component normal to the plane defined by a normal vector n
τ n Stress component tangential to the plane defined by a normal vector n
σ n , m i n Minimum value assumed by σ n
σ n , m a x Maximum value assumed by σ n
Γ n Curve determined by τ n along the time
τ n , a Alternating tangential stress on the plane defined by a normal vector n
τ n , m Average tangential stress on the plane defined by a normal vector n
σ c , m a x Maximum stress component normal to the critical plane
τ c , a Alternating tangential stress on the critical plane
σ f Material fatigue limit at symmetrical alternating bending loading
τ f Material fatigue limit at symmetrical alternating torsional loading
r τ / σ Ratio between τ f and σ f
S F Safety Factor
χLinear coordinate along the fillet in the tooth root radius
βAngle between the tooth axis and crack direction
T Time period in a loading cycle
N m a x Number of nodes modeling the tooth root radius

References

  1. Vullo, V. Gears; Springer International Publishing: New York, NY, USA, 2020. [Google Scholar]
  2. Radzevich, S.P.; Dudley, D.W. Handbook of Practical Gear Design; CRC Press: Boca Raton, FL, USA, 1994. [Google Scholar]
  3. Yadav, A. Different types Failure in gears—A Review. Int. J. Sci. Eng. Technol. Res. 2012, 5, 82–92. [Google Scholar]
  4. Fernandes, P.J.L.; McDuling, C. Surface contact fatigue failures in gears. Eng. Fail. Anal. 1997, 4, 99–107. [Google Scholar] [CrossRef]
  5. Li, S.; Kahraman, A. A scuffing model for spur gear contacts. Mech. Mach. Theory 2021, 156, 104161. [Google Scholar] [CrossRef]
  6. Wu, S.; Cheng, H.S. Sliding wear calculation in spur gears. J. Tribol 1993, 115, 493–500. [Google Scholar] [CrossRef]
  7. Blake, J.W.; Cheng, H.S. A surface pitting life model for spur gears: Part I—Life prediction. J. Tribol. 1991, 113, 712–718. [Google Scholar] [CrossRef]
  8. Liu, H.; Liu, H.; Zhu, C.; Zhou, Y. A review on micropitting studies of steel gears. Coatings 2019, 9, 42. [Google Scholar] [CrossRef] [Green Version]
  9. Fernandes, P.J.L. Tooth bending fatigue failures in gears. Eng. Fail. Anal. 1996, 3, 219–225. [Google Scholar] [CrossRef]
  10. Pantazopoulos, G.A. Bending fatigue failure of a helical pinion bevel gear. J. Fail. Anal. Prev. 2015, 15, 219–226. [Google Scholar] [CrossRef]
  11. Davoli, P.; Conrado, E.; Michaelis, K. Recognizing gear failures. Mach. Des. 2007, 63, 64–67. [Google Scholar]
  12. Bretl, N.; Schurer, S.; Tobie, T.; Stahl, K.; Höhn, B.R. Investigations on tooth root bending strength of case hardened gears in the range of high cycle fatigue. In Proceedings of the American Gear Manufacturers Association Fall Technical Meeting, Indianapolis, IN, USA, 15–17 September 2013; pp. 103–118. [Google Scholar]
  13. Hong, I.J.; Kahraman, A.; Anderson, N. A rotating gear test methodology for evaluation of high-cycle tooth bending fatigue lives under fully reversed and fully released loading conditions. Int. J. Fatigue 2020, 133, 105432. [Google Scholar] [CrossRef]
  14. ISO 6336-1:2006, 2006. Calculation of Load Capacity of Spur and Helical Gears, Part 1: Basic Principles, Introduction and General Influence Factors, ISO: Geneva, Switzerland.
  15. ISO 6336-3:2006, 2006. Calculation of Load Capacity of Spur and Helical Gears, Part 3: Calculation of Tooth Bending Strength, ISO: Geneva, Switzerland.
  16. ANSI/AGMA 2001-D04, 2004. Fundamental Rating Factors and Calculation Methods for Involute Spur and Helical Gear Teeth, American Gear Manufacturers Association: Alexandria, Virginia, 2004.
  17. Benedetti, M.; Fontanari, V.; Höhn, B.R.; Oster, P.; Tobie, T. Influence of shot peening on bending tooth fatigue limit of case hardened gears. Int. J. Fatigue 2002, 24, 1127–1136. [Google Scholar] [CrossRef]
  18. McPherson, D.R.; Rao, S.B. Methodology for translating single-tooth bending fatigue data to be comparable to running gear data. Gear Technol. 2008, 42–51. [Google Scholar] [CrossRef]
  19. Dobler, D.I.A.; Hergesell, I.M.; Stahl, I.K. Increased Tooth Bending Strength and Pitting Load Capacity of Fine-Module Gears. Gear Technol. 2016, 33, 48–53. [Google Scholar]
  20. Concli, F. Tooth Root Bending Strength of Gears: Dimensional Effect for Small Gears Having a Module below 5 mm. Appl. Sci. 2021, 11, 2416. [Google Scholar] [CrossRef]
  21. McPherson, D.R.; Rao, S.B. Mechanical Testing of Gears. In Mechanical Testing and Evaluation; ASM International: Materials Park, OH, USA, 2000; Volume 8, pp. 861–872. [Google Scholar]
  22. Gorla, C.; Conrado, E.; Rosa, F.; Concli, F. Contact and bending fatigue behaviour of austempered ductile iron gears. Proc. Inst. Mech. Eng. Part C J. Mech. Eng. Sci. 2018, 232, 998–1008. [Google Scholar] [CrossRef]
  23. Concli, F.; Fraccaroli, L. Bending fatigue strength of small size 2 mm module gears. Wit Trans. Eng. Sci. 2021, 133, 39–46. [Google Scholar] [CrossRef]
  24. Rao, S.B.; McPherson, D.R. Experimental characterization of bending fatigue strength in gear teeth. Gear Technol. 2003, 20, 25–32. [Google Scholar]
  25. Fontanari, V.; Molinari, A.; Marini, M.; Pahl, W.; Benedetti, M. Tooth Root Bending Fatigue Strength of High-Density Sintered Small-Module Spur Gears: The Effect of Porosity and Microstructure. Metals 2019, 9, 599. [Google Scholar] [CrossRef] [Green Version]
  26. Winkler, K.J.; Schurer, S.; Tobie, T.; Stahl, K. Investigations on the tooth root bending strength and the fatigue fracture char-acteristics of case-carburized and shot-peened gears of different sizes. Proc. Inst. Mech. Eng. Part C J. Mech. Eng. Sci. 2019, 233, 7338–7349. [Google Scholar] [CrossRef]
  27. Argoud, V.; Morel, F.; Pessard, E.; Bellett, D.; Thibault, S.; Gourdin, S. Fatigue behaviour of gear teeth made of case hardened steel: From competing mechanisms to lifetime variability. Procedia Struct. Integr. 2019, 19, 719–728. [Google Scholar] [CrossRef]
  28. Bonaiti, L.; Rosa, F.; Rao, P.M.; Concli, F.; Gorla, C. Gear root bending strength: Statistical treatment of Single Tooth Bending Fatigue tests results. Forsch. Ing. 2021. [Google Scholar] [CrossRef]
  29. Dixon, W.J.; Mood, A.M. A method for obtaining and analyzing sensitivity data. J. Am. Stat. Assoc. 1948, 43, 109–126. [Google Scholar] [CrossRef]
  30. Maršálek, P.; Moravec, V. A methodology for gear fatigue tests and their evaluation. J. Middle Eur. Constr. Des. Cars 2011, 9, 13–17. [Google Scholar]
  31. Conrado, E.; Gorla, C.; Davoli, P.; Boniardi, M. A comparison of bending fatigue strength of carburized and nitrided gears for industrial applications. Eng. Fail. Anal. 2017, 78, 41–54. [Google Scholar] [CrossRef]
  32. Gorla, C.; Rosa, F.; Concli, F.; Albertini, H. Bending fatigue strength of innovative gear materials for wind turbines gearboxes: Effect of surface coatings. In Proceedings of the ASME International Mechanical Engineering Congress and Exposition, Houston, TX, USA, 9–15 November 2012; Volume 45233, pp. 3141–3147. [Google Scholar] [CrossRef]
  33. Gorla, C.; Rosa, F.; Conrado, E.; Albertini, H. Bending and contact fatigue strength of innovative steels for large gears. Proc. Inst. Mech. Eng. Part C J. Mech. Eng. Sci. 2014, 228, 2469–2482. [Google Scholar] [CrossRef] [Green Version]
  34. Concli, F.; Bonaiti, L.; Gerosa, R.; Cortese, L.; Nalli, F.; Rosa, F.; Gorla, C. Bending Fatigue Behavior of 17-4 PH Gears Produced by Additive Manufacturing. Appl. Sci. 2021, 11, 3019. [Google Scholar] [CrossRef]
  35. Gasparini, G.; Mariani, U.; Gorla, C.; Filippini, M.; Rosa, F. Bending fatigue tests of helicopter case carburized gears: Influence of material, design and manufacturing parameters. Gear Technol. 2009, 68–76. [Google Scholar]
  36. Concli, F. Austempered Ductile Iron (ADI) for gears: Contact and bending fatigue behavior. Procedia Struct. Integr. 2018, 8, 14–23. [Google Scholar] [CrossRef]
  37. Bonaiti, L.; Concli, F.; Gorla, C.; Rosa, F. Bending fatigue behaviour of 17-4 PH gears produced via selective laser melting. Procedia Struct. Integr. 2019, 24, 764–774. [Google Scholar] [CrossRef]
  38. Gasparini, G.; Mariani, U.; Gorla, C.; Filippini, M.; Rosa, F. Bending Fatigue Tests of Helicopter Case Carburized Gears: Influence of Material, Design and Manufacturing Parameters. In Proceedings of the American Gear Manufacturers Association 369 (AGMA) Fall Technical Meeting, San Antonio, TX, USA, 12–14 October 2008; pp. 131–142. [Google Scholar]
  39. Gorla, C.; Rosa, F.; Conrado, E.; Concli, F. Bending fatigue strength of case carburized and nitrided gear steels for aeronautical applications. Int. J. Appl. Eng. Res. 2017, 12, 11306–11322. [Google Scholar]
  40. Bonaiti, L.; Bayoumi, A.B.M.; Concli, F.; Rosa, F.; Gorla, C. Gear root bending strength: A comparison between Single Tooth Bending Fatigue Tests and meshing gears. J. Mech. Des. 2021, 143, 103402. [Google Scholar] [CrossRef]
  41. Concli, F.; Fraccaroli, L.; Maccioni, L. Gear Root Bending Strength: A New Multiaxial Approach to Translate the Results of Single Tooth Bending Fatigue Tests to Meshing Gears. Metals 2021, 11, 863. [Google Scholar] [CrossRef]
  42. Concli, F.; Maccioni, L.; Bonaiti, L. Reliable gear design: Translation of the results of single tooth bending fatigue tests through the combination of numerical simulations and fatigue criteria. WIT Trans. Eng. Sci. 2021, 130, 111–122. [Google Scholar] [CrossRef]
  43. Concli, F.; Maccioni, L. Critical planes criteria applied to gear teeth: Which one is the most appropriate to characterize crack propagation? WIT Trans. Eng. Sci. 2021, 133, 15–25. [Google Scholar] [CrossRef]
  44. Findley, W.N. A theory for the effect of mean stress on fatigue of metals under combined torsion and axial load or bending. J. Eng. Ind. 1959, 81, 301–305. [Google Scholar] [CrossRef]
  45. Matake, T. An explanation on fatigue limit under combined stress. Bull. JSME 1977, 20, 257–263. [Google Scholar] [CrossRef]
  46. McDiarmid, D.L. Fatigue under Out-of-Phase Biaxial Stresses of Different Frequencies. Multiaxial Fatigue; ASTM International: West Conshohocken, PA, USA, 1985. [Google Scholar] [CrossRef]
  47. Papadopoulos, I.V. A high-cycle fatigue criterion applied in biaxial and triaxial out-of-phase stress conditions. Fatigue Fract. Eng. Mater. Struct. 1995, 18, 79–91. [Google Scholar] [CrossRef]
  48. Susmel, L.; Tovo, R.; Lazzarin, P. The mean stress effect on the high-cycle fatigue strength from a multiaxial fatigue point of view. Int. J. Fatigue 2005, 27, 928–943. [Google Scholar] [CrossRef]
  49. Papadopoulos, I.V. Critical plane approaches in high-cycle fatigue: On the definition of the amplitude and mean value of the shear stress acting on the critical plane. Fatigue Frac. Eng. Mater. Struct. 1998, 21, 269–285. [Google Scholar] [CrossRef]
Figure 1. Components of P n ( φ n , ϑ n , t ) on the plane n ( φ n , ϑ n ) .
Metals 11 01871 g001
Figure 2. u and v on the plane n ( φ n , ϑ n ) and definition of the curve Γ n .
Metals 11 01871 g002
Figure 3. Minimum Circumscribed Circle (MCC) method.
Metals 11 01871 g003
Figure 4. Cracks characteristics (χ, β) in experimental tests.
Metals 11 01871 g004
Figure 5. Individuation of cracks characteristics (χ, β) in experimental tests performed on Gear A.
Metals 11 01871 g005
Figure 6. Individuation of cracks characteristics (χ, β) in experimental tests performed on Gear B.
Metals 11 01871 g006
Figure 7. Finite Element Model of the STBF of Gear A.
Metals 11 01871 g007
Figure 8. Finite Element Model of the STBF of Gear B.
Metals 11 01871 g008
Figure 9. Framework to elaborate the time-dependent stress tensor on each node implementing different fatigue criteria.
Metals 11 01871 g009
Figure 10. Direction of the critical planes according to the different criteria studied at different nodes for Gear A. Numerical results in blue (segment length proportional to the damage parameter) and experimental results in red (segment length proportional to the damage parameter that lead to a unitary S F ).
Metals 11 01871 g010
Figure 11. Direction of the critical planes according to the different criteria studied at different nodes for Gear B. Numerical results in blue (segment length proportional to the damage parameter) and experimental results in red (segment length proportional to the damage parameter that lead to a unitary S F ).
Metals 11 01871 g011
Table 1. Geometrical parameters of the simulated gears—Gear A [38], Gear B [40].
DescriptionSymbolUnitGear AGear B
Normal module m n mm3.773012.2
Normal pressure angle α n °22.517
Number of teeth z -3230
Face width b mm1520
Profile shift coefficient x -0.06810.25
Dedendum coefficient h f P * -1.31531.675
Root radius factor ρ f P * -0.360.368
Addendum coefficient h a P * -1.15951.361
Table 2. Mesh characteristics of the simulated gears.
CharacteristicsUnitGear AGear B
Total nodes#75,824214,160
Hexahedral elements#54,000156,690
TRIA6 elements#27,85583,205
Element in the half-face width #1515
Nodes in the tooth flank #480800
Nodes in the tooth root radius #496816
Table 3. Minimum S F calculated through different fatigue criteria and associated critical node location χ.
Gear S F F i n d l e y ( χ ) S F M a t a k e ( χ ) S F S u s m e l ( χ ) S F P a p a d o p o u l o s ( χ ) S F M c D i a r m i d ( χ )
A1.08(0.400)1.96(0.400)0.79(0.400)1.13(0.400)2.14(0.400)
B0.98(0.435)1.23(0.435)0.94(0.435)0.95(0.435)1.08(0.435)
Publisher’s Note: MDPI stays neutral with regard to jurisdictional claims in published maps and institutional affiliations.

