Abstract
A large amount of experimental studies have shown significant dependence of strength of ductile metals on stress state and stress history. These effects have to be taken into account in constitutive models and corresponding numerical analysis to be able to predict safety and lifetime of engineering structures in a realistic manner. In this context, the present paper deals with numerical analysis of the influence of the load path on damage and fracture behavior of aluminum alloys. A continuum damage model is discussed taking into account the effect of stress state and loading history on damage criteria and on evolution equations of damage strains. Experiments with the biaxially loaded H-specimen have been performed and different preloading histories have been taken into account. Evolution of strain fields is monitored by digital image correlation, and fracture modes are visualized by scanning electron microscopy (SEM). In addition, numerically predicted stress states are used to explain occurrence of different stress-state- and preloading-path-dependent localization behavior in critical specimens areas, as well as damage and fracture modes, revealed by SEM. The experiments with newly developed biaxially loaded specimens and corresponding numerical simulations show that the preloading history remarkably affects the occurrence of width and orientation of localized strain fields, as well as evolution of damage mechanisms and fracture modes. Therefore, characterization of materials must be based on an enhanced experimental program including biaxial tests with different loading histories. The observed damage and failure behavior can be predicted by the proposed continuum model taking into account stress-state-dependent damage criteria and damage strains.
1. Introduction
During the last few decades, various high quality metals and alloys have been developed to fulfill industrial demands on lightweight design to enforce safety requirements, to reduce energy consumption, and to improve cost efficiency [1,2]. For example, material properties have to be optimized to reduce localization of irreversible strains leading to damage and fracture in critical parts of elements. Ductile fracture can be seen as a major factor causing end of life of structures [3]. Therefore, analysis of deformation, damage, and failure behavior of these newly developed materials is an important concern in engineering disciplines [4]. In this context, development of accurate and practically applicable material models is demanded [5,6]. In addition, experiments covering different stress states and load histories are needed to validate the theoretical approaches for a wide range of engineering applications and to identify corresponding material parameters [7,8]. Special focus of the experimental and numerical analysis presented in this paper is on formation of localized shear bands and their effect on fracture modes.
In the literature, many experiments with different specimens have been discussed to investigate formation and localization of inelastic deformations, as well as damage and fracture mechanisms, on different scales. For example, to analyze the effect of stress state on mechanical behavior, experiments with uniaxially loaded specimens containing smooth or notched geometries have been examined. Stress state dependence of plastic deformations is addressed by Reference [9], whereas the effect of stress triaxiality on damage is investigated by References [10,11,12]. Further uniaxial tests have been performed to analyze fracture in ductile metals [13,14,15,16]. In addition, to study the behavior under nearly zero stress, triaxialities specimens deformed by shear stresses in critical parts during uniaxial loading have been proposed [17,18,19]. The experimental results taken from different uniaxially loaded specimens generated further interest in stress-state- and loading-history-dependent ductile failure processes and motivated a number of additional careful experimental investigations. Since uniaxially loaded specimens with various geometries only cover a small range of stress states and only allow proportional load paths, further tests with biaxially loaded cruciform specimens have been presented [20,21,22,23] and optimized geometries of cruciform specimens have been developed [24,25,26]. New geometries of biaxially loaded specimens have been proposed to examine in detail stress state dependence of damage and fracture processes in ductile metals [7,27,28]. In these experimental studies, specimens have been tested under proportional load paths.
However, many engineering processes are dominated by non-proportional loading paths; therefore, investigation of the effect of non-proportional loading histories is important from practical point of view. Only a few experimental analyses dealing with generally non-proportionally loaded biaxial specimens have been published due to expensive special testing equipment and difficulties in realization of non-proportional experiments. A specific case with limitation in load ratios is tension-torsion-tests. For example, fracture behavior of aluminum alloys undergoing non-proportional load paths have been analyzed [29,30]. After tension-torsion tests, they reported remarkable differences in the final load at fracture and in the formation of the crack paths. Further experiments with non-proportional tension-torsion and tension-compression loadings on differently notched specimens have been performed [31,32,33,34]. Their results also revealed influence of the load paths on damage accumulation and onset of fracture. In addition, notched cylindrical steel specimens have been tested under stress triaxiality step-jumps [35]. They observed different fracture loci after non-proportional loading compared to proportional one. In addition, cylindrical specimens under internal pressure and axial loads with different load paths have been tested [36]. They confirmed that failure strains are path-dependent. Furthermore, more generalized tests with the biaxially loaded X0-specimen undergoing different non-proportional loading histories have been discussed [37,38]. Their experimental results have shown remarkable dependence of damage and fracture behavior on load paths. In addition, corresponding numerical simulations have been performed [39,40] analyzing the X0- and the H-specimen, respectively, and revealed the effect of changing stress states on damage and failure processes. Based on these experimental and corresponding numerical investigations, it can be concluded that formation of damage and failure mechanisms is remarkably affected by the load paths and has to be analyzed in further detail.
In sheet metal forming processes, various stress states occur during complex loading conditions which may lead to failure. Thus, it is important to understand the stress-state-dependent mechanical processes in detail. In this context, a new set of experiments with non-proportional loading histories is proposed. Experimental and numerical results of further biaxial experiments with the H-specimen undergoing non-proportional load paths with focus on the effect of various preloading conditions on localized deformation, as well as on damage and fracture mechanisms, on different scales, are presented and discussed. The investigated material is the aluminum alloy EN AW 6082-T6 (produced by ThyssenKrupp Schulte GmbH, Essen, Germany) which is a medium strength alloy most commonly used for machining and for other highly stressed applications. It has excellent corrosion resistance, as well as very good weldability, and is typically formed by extrusion or rolling. It is used in structures in civil engineering, like trusses, bridges, and cranes or transport applications, but also in beer barrels and milk churns.
The numerical analysis is based on a continuum damage model taking into account stress-state-dependent damage mode functions. Rate equation for the damage strains is proposed to model the load-history-dependent evolution of damage-induced deformations. Results of biaxial tests with the H-specimen are presented with special focus on different stress states and preloading histories. Digital image correlation (DIC) monitors formation of strain fields and reveals localized deformation pattern in critical regions of the specimen. In addition, scanning electron microscopy (SEM) of the fractured surfaces elucidate different fracture processes on the micro-level. Moreover, corresponding numerical simulations were performed and point out stress states in critical parts of the specimen at different stages of the loading processes.
2. Continuum Damage Model
The theoretical framework analysis of inelastic deformations, as well as of damage and failure behavior of ductile metals, takes into account experimental and numerical investigations on both the micro- and the macro-level considering different processes on these scales and their interactions [5,41,42]. The continuum damage model is based on the introduction of the damage strain tensor, , characterizing the stress-state-dependent evolution of different damage mechanisms on the micro-scale in a phenomenological macroscopic way. To propose and to validate its evolution equations, as well as to identify corresponding parameters, a series of multiaxial experiments with different loading histories is necessary. In the experimental program, a wide range of stress states has to be covered, and proportional, as well as non-proportional, load paths have to be considered to validate the continuum model for a wide range of engineering applications.
The continuum approach takes into account damaged, as well as fictitious undamaged, configurations and is based on the additive decomposition of the strain rate tensor into elastic, , effective plastic, , and damage parts, ; see Reference [41] for further details. In particular, the hyper-elastic constitutive law in the undamaged configuration leads to the effective Kirchhoff stress tensor
where G and K represent the constant shear and bulk modulus, and is the elastic strain tensor. Plastic behavior of ductile metals is characterized by the yield criterion
expressed in terms of the first and second deviatoric invariants of the effective stress tensor (1), and , the equivalent yield stress c of the undamaged material, and the hydrostatic stress coefficient a.
The effective plastic strain rate
predicts the evolution of plastic deformations, where denotes a non-negative scalar factor, is the normalized deviatoric effective stress tensor, and represents the equivalent plastic strain rate.
Furthermore, considering the damaged configurations, the Kirchhoff stress tensor
depends on both the elastic and the damage strain tensors, and , to take into account deterioration of elastic material properties caused by damage described by the additional material parameters ….
Damage and fracture processes on the micro-scale depend on the stress state acting in a material point. For example, during tensile loading with high positive stress, triaxialities nucleation, growth, and coalescence of micro-voids are the predominant mechanisms, whereas, during shear and compressive loading with small positive or negative stress, triaxialities formation and growth of micro-shear-cracks are the main processes. Combination of these basic damage processes on the micro-scale is active for moderate positive stress triaxialities, and no damage formation has been observed in ductile metals for high negative stress triaxialities [43]. Thus, the damage process is characterized by the damage condition
with the first and second deviatoric invariants of the Kirchhoff stress tensor (4), and , and the equivalent damage stress . The stress-state-dependent factors and represent damage mode parameters corresponding to the aforementioned damage processes acting on the micro-scale. In the present model, dependence on the stress state is given in terms of the stress triaxiality:
defined as the ratio of the mean stress and the von Mises equivalent stress , as well as of the Lode parameter
written in terms of the principal Kirchhoff stress components , , and .
In addition, the damage strain rate tensor
predicts evolution of irreversible macroscopic strains caused by different damage processes on the micro-level in a phenomenological way. In Equation (8), denotes the equivalent damage strain rate, and and are the normalized stress-related deviatoric tensors with
where denotes the stress tensor work-conjugate to the damage strain rate tensor (8) (see Reference [41] for further details). In Equation (8), the parameters , , and are kinematic parameters characterizing the portion of volumetric and isochoric deformations corresponding to the different stress-state-dependent damage and failure mechanisms on the micro-level mentioned above. It should be noted that the damage mode parameters and in Equation (5), as well as , , and in Equation (8), have been identified by numerical investigations on the micro-scale analyzing deformation and failure behavior of differently loaded micro-defect-containing representative volume elements [42,44,45]. Thus, they have to be validated by experiments undergoing a wide range of loading conditions.
3. Experimental and Numerical Aspects
The experiments are carried out with the biaxial test machine type LFM-BIAX 20 kN (produced by Walter & Bai, Löhningen, Switzerland) containing four electro-mechanically, individually driven actuators (Figure 1a). On the experimental side, slight non-symmetric behavior caused by fabrication tolerances of the specimens, misalignment of the machine, and unsymmetrical clamping cannot be avoided. To handle this asymmetry, a mainly displacement-driven procedure was used. The corresponding notation (Figure 2e) can be outlined as follows:
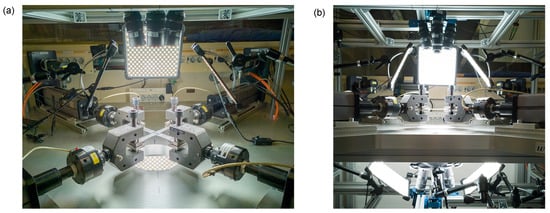
Figure 1.
(a) Biaxial test machine, (b) lighting system and camera equipment.
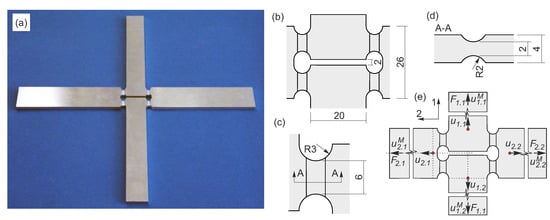
Figure 2.
Geometry (a–d), loading, and displacements (e) of the H-specimen (all dimensions in mm).
- The axis are indicated by a first subscript which can be followed by a second subscript indicating the cylinder. Both subscripts are separated by a dot, e.g., .
- Displacements are denoted by u and are measured in axis direction. The machine displacements are indicated by a superscript M, whereas the nominal displacements (measured at the red dots indicated in Figure 2e) do not have any additional superscript.
- Forces are denoted by F, and the average forces on each axis are introduced and plotted in the corresponding figures.
Furthermore, the experimental technique applied here is described in detail in Reference [7] for proportional loading and in Reference [37] for non-proportional loading. Briefly, it can be outlined for loading on axis one as follows:
- The leading machine displacement of cylinder is continuously increased by mm/s.
- The same displacement is applied on the cylinder on the opposite side of the same axis as .
- The force is of the cylinder is retained at zero, which causes the machine displacement , i.e., the cylinder is force driven.
- The same displacement is applied as on the cylinder on the opposite side of the same axis.
This technique is very stable due to the fact that three of the four cylinders are displacement driven, and the load ratio is kept constant throughout the experiment. Furthermore, it is worthy of note that the relation between the machine displacements and the nominal displacements is non-linear and dependent on the load case; for this, the nominal displacements were introduced as corresponding displacement measure. For loading on axis two, the first index had to be alternated.
The specimens are clamped in the four heads of the actuators, and, during the tests, they are biaxially strained with proportional and non-proportional paths. During the experiments, three-dimensional displacement fields in selected regions of the specimen are monitored by digital image correlation (DIC) using stereo setting. For the setup, eight cameras equipped with 75 mm lenses were available (Figure 1b). With this setup, 80 px/mm could be reached at the center of the specimen, and the depth of field was approximately at the applied aperture. Furthermore, the cameras of the stereo DIC system was inclined by approximately 10° to the principal symmetry plane. Consequently, the focus of the cameras had to be central at the base of the notch to explore the depth of field in a satisfactory way; thus, the cameras have to be aligned with the notches. Furthermore, the corresponding lighting system (Figure 1) is aligned in such a way that shadows and reflection are avoided within the notched parts. This allows analysis of evolution of different strain fields and will reveal strain localization phenomena, as well as formation of macro-cracks. In addition, after the experiments, fracture surfaces of the failed specimens are examined by SEM to elucidate fracture modes on the micro-scale.
New geometries of cruciform specimens have been proposed [7] and in the present investigation the H-specimen (see Figure 2) is tested in detail. The investigated material is EN AW 6082-T6 aluminum alloy supplied in the form of 4 mm thick sheets. Its chemical decomposition is shown in Table 1. The outer dimensions of the H-specimen are 240 mm in both directions (a) and in its center are notches in thickness direction (b), leading here to localization of strains, damage, and fracture during loading. Length of the notched parts is 6 mm with reduction of thickness up to 2 mm. The notch radii are 3 mm in plane (c) and 2 mm in thickness (d) direction. The H-specimen is loaded in two perpendicular directions by and (e). The force leads to shear behavior in the notches, whereas the force leads to superimposed tension or compression, causing a wide range of stress states with different stress triaxialities and Lode parameters. Corresponding displacements of the red points shown in Figure 2e, and in direction 1 and and in direction 2, are recorded by DIC during the experiments. They are used to compute the relative displacements and taken into account in the load-displacement-curves.

Table 1.
Chemical composition of EN AW 6082 T6 aluminum alloy (% weight).
Numerical simulations of the biaxial experiments with the H-specimen were performed by the finite element program ANSYSenhanced by an user-defined material subroutine based on the continuum damage model discussed above. A quarter of the H-specimen is discretized by 7712 eight-node-elements of type Solid185 (Figure 3). Symmetry boundary conditions were applied to the symmetry surfaces in 1- and 2-direction (Figure 2e), the displacements were applied to the nodes at the end faces, and out of plane movement was prevented by zero displacements of the nodes at the end faces on the symmetry plane in thickness (3) direction. In the notched parts of the specimen, refinement of the finite element mesh was taken into account to model in an accurate manner localized strain behavior, as well as gradients of stresses and strains.
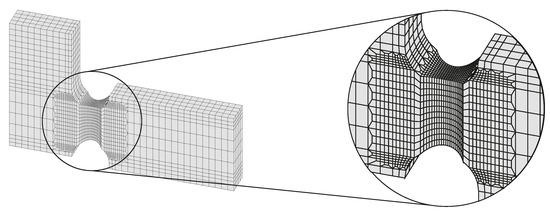
Figure 3.
Finite element mesh.
The numerical analysis is based on material parameters determined by fitting of experimental equivalent stress–equivalent strain curves of uniaxial tension tests. Initial elastic behavior is characterized by Young’s modulus E = 69,000 MPa and Poisson’s ratio . The deterioration of elastic properties by evolution of damage is modeled by the parameters = −10,000 MPa, = −10,000 MPa, = −10,000 MPa, and = −10,000 MPa. In addition, plastic hardening of the investigated aluminum alloy EN AW 6082-T6 is adequately described by the Voce law [46] for the current yield stress:
with the initial yield stress = , the hardening moduli = 0, and = , as well as the hardening exponent, b = . Damage softening is assumed to be modeled by the quadratic function for the equivalent damage stress
with the initial damage stress and the modulus .
4. Results and Discussion
4.1. Experimental Program
The basic experiments are (EXP 1/0), causing shear mechanisms in the notches of the H-specimen, and (EXP 0/+1), leading to tensile behavior. These basic tests are used as reference experiments, as well as to determine the displacements at onset of fracture, which are needed for the alternative tests with different loading histories. The respective load-displacement curves from the experiments and corresponding numerical simulations are shown in Figure 4a and Figure 5a. For , the load maximum is and the specimen fails at the displacement . In the loading case , the load reaches , and the displacement at onset of fracture is . In the first series of alternative loading histories (EXP 0/+1 to 1/0), the specimens are initially loaded by , where this process stops when 50%, 75%, or 85% of the final displacement of EXP 0/+1 has been reached (solid line in Figure 4). Then, the specimens are unloaded and subsequently loaded by up to final fracture (dotted line in Figure 4). The effect of the different preloading paths can be seen in Figure 4. In particular, in the case of 50% of the final displacement (EXP 0/+1 to 1/0 50%), the maximum load is , and the displacement at onset of fracture reaches ; see Figure 4b. Thus, the effect of preloading on the load-displacement behavior is very small. If preloading of 75% of is taken into account (EXP 0/+1 to 1/0 75%), in the second step, the maximum load is only , and the different specimens failed earlier at different levels between and 1.03 mm (Figure 4c). And, as shown in Figure 4d, in the case of 85% preloading (EXP 0/+1 to 1/0 85%), the load only reaches and failed between and 0.96 mm. Thus, the different preloading paths have remarkable influence on the load-displacement behavior during the second load paths with . The reduction of maximum load is about 20%, and the final displacement is only about 70% of the displacement of the specimen without preloading history. Thus, the pre-tensile-loading of the H-specimen makes the material more brittle and may lead to earlier failure during forming processes.
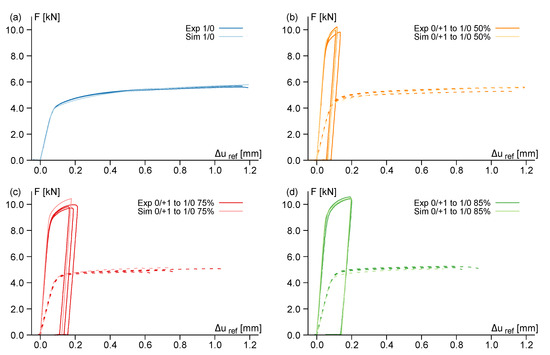
Figure 4.
Load-displacement curves for with different preloadings.
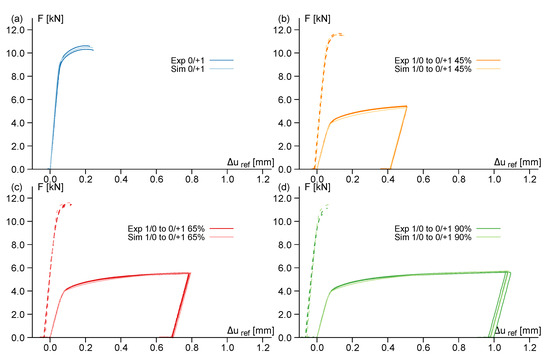
Figure 5.
Load-displacement curves for with different preloadings.
In the second series of alternative load paths (EXP 1/0 to 0/+1), the H-specimens are initially loaded by , and this process stops when 45%, 65%, or 90% of the final displacement of EXP 1/0 has been reached (solid line in Figure 5). After unloading, the specimens are loaded in a second step by up to final fracture (dotted line in Figure 5). Figure 5 shows how the different preloadings affect the load-displacement curves of the final load path. In particular, if preloading of 45% of the final displacement is taken into account (EXP 1/0 to 0/+1 45%), the maximum load in the second step is (Figure 5b), which is an increase in load of about 15% compared to the respective basic test. After unloading of the first step, the displacement in axis 2 is , which increases up to , where the specimen failed. In the case of preloading with 65% of the final displacement (EXP 1/0 to 0/+1 65%), the maximum load is , and the displacement at onset of fracture reaches ; see Figure 5c. And if preloading of 90% of the final displacement is considered (EXP 1/0 to 0/+1 90%), the maximum load in the second step of can be seen in Figure 5d, and the specimen failed at the displacement . Again, the different preloading histories remarkably affect the load-displacement behavior during the second load path with . In the case of pre-shear-loading, an increase of the load maxima of about 15% is measured. In addition, the relative displacements at failure are remarkably reduced and reach only about 20% of the displacements after the basic experiment without preloading. Thus, the pre-shear-loading of the H-specimen makes the material very brittle with only marginal further inelastic deformations. It can also be seen in Figure 4 and Figure 5 that the load-displacement curves of the numerical simulations agree very well with the experimental ones.
4.2. Preloading by , Final Loading by
The distributions of the first principal strain for the first loading history (preloading by and final loading by ) can be seen in Figure 6, where the left pictures are experimental results monitored by DIC, and the respective right pictures show numerically predicted strains. In particular, at the end of the proportional load path (P 1/0 end), the first principal strain reaches 0.57 in a localized band with orientation from top right to bottom left (Figure 6a). In this case, the experimental and the numerical results agree quite well. After preloading by (NP 0/+1), more widespread distribution of the first principal strain can be seen in the DIC pictures with maxima of 0.06 after 50% preloading rate (Figure 6(b1)), of 0.11 after 75% (Figure 6(c1)), or of 0.12 after 85% preloading rate (Figure 6(d1)). In the corresponding numerical simulations, wide vertical strain bands are predicted with similar maxima. After unloading and subsequent loading by (NP 0/+1 to 1/0), the strain fields completely change: In the first case, with 50% preloading (Figure 6(b2)), the first principal strain field is localized in a slightly diagonal band very similar to that one after the proportional path (Figure 6a) but with higher values up to 0.64. With higher preloading rates of 75% and 85%, respectively, the localized strain bands become smaller and move to nearly vertical orientation (Figure 6(c2,d2)). Thus, different preloading rates lead to changes in amount, width, and orientation of localized first principal strain bands. After preloading of the H-specimen, the behavior becomes more brittle, and the change in orientation of more vertical localized strain bands will lead to a change in failure behavior. This is discussed in more detail after analysis of fracture surfaces by SEM.
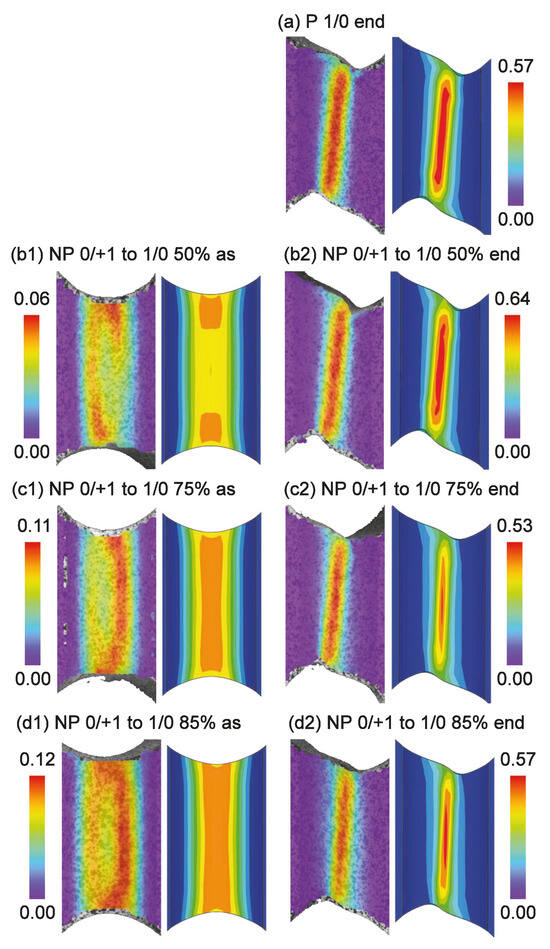
Figure 6.
First principal strain by digital image correlation (DIC) (left) and numerical simulation (right).
Numerically-predicted distributions and amounts of the stress triaxiality and the Lode parameter on the surface (S) of the notched region, in the longitudinal section (L), and in the cross section (C) for the loading histories EXP 0/+1 to 1/0 are shown in Figure 7. In particular, at the end of the basic experiment with the proportional loading path P 1/0 end (Figure 7a), the distribution of the stress triaxiality in the notch is nearly homogeneous with ; only at the top and bottom boundaries can small regions with the stress triaxiality of be seen in the cross section (C). The corresponding Lode parameter is also nearly homogeneously distributed with , and only in small regions at the boundaries parameters do up to (top right and bottom left) or to (top left and bottom right) occur. These stress parameters are typical for shear loading conditions. The distributions and amounts of the stress parameters of the differently preloaded specimens are very similar; therefore, only results for 85% preloading rate are shown in Figure 7. For example, at the end of the preloading step (NP 0/+1 to 1/0 85% as; see Figure 7b), the stress triaxiality in the center of the notch is about , and, at the boundaries, 0.4 is numerically predicted. The corresponding Lode parameter is in the center of the notch and reaches in the outer parts of the longitudinal (L) and the cross section (C), whereas occurs on the surface (S) of the notched region. After unloading of and reloading by (NP 0/+1 to 1/0 85% end), the stress triaxiality at the end of this load step is in the notch with nearly homogeneous distribution, and, at the boundaries of the cross section (C), very small regions with 0.3 can be seen (Figure 7c). The corresponding Lode parameter is in the cross section (C) and reaches on the surface (S) of the notch, whereas, again, small regions at the boundaries of the notch with and , respectively, are numerically predicted. Comparison of the results shown in Figure 7a,c reveal that the final distributions and amounts of the stress triaxiality and the Lode parameter are only marginally affected by the different preloading paths.
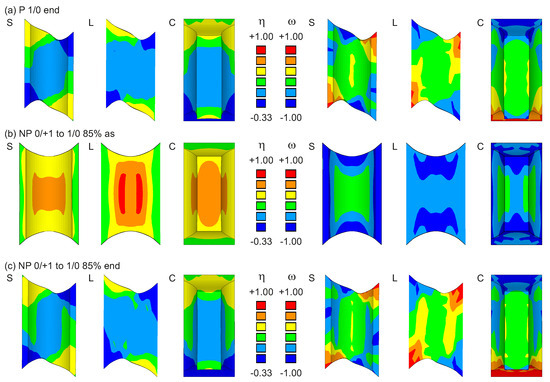
Figure 7.
Stress triaxiality and Lode parameter : S—surface, L—longitudinal section, C—cross section.
Furthermore, numerically predicted distributions and amounts of the equivalent plastic strain and the equivalent damage strain on the surface (S) of the notched region, in the longitudinal section (L), and in the cross section (C) for the loading histories EXP 0/+1 to 1/0 are shown in Figure 8. In particular, at the end of the basic experiment with the proportional loading path P 1/0 end (Figure 8a), the maximum equivalent plastic strain occurs on the surface (S) of the notch in a localized band with slightly diagonal orientation from top right to bottom left. This maximum can also be seen in the center of the notch (L, C), whereas, at the boundaries, the equivalent plastic strain is smaller, with . Similar behavior can be seen for the equivalent damage strain; its maximum is in two points on the surface (S) of the notch, whereas only is numerically predicted in the center of the notch (L, C). Again, a localized band of equivalent damage strains occurs with diagonal orientation from top right to bottom left. In addition, distributions and amounts of the respective equivalent strains for different preloading histories are also shown in Figure 8. For the 50% preloading rate, the equivalent plastic strains after the first load path by (NP 0/+1 to 1/0 50% as) reach on the surface (S) of the notch and in its center (L, C); see Figure 8b. The equivalent plastic strains are concentrated in a vertical band and the distribution in the cross section (C) is nearly homogeneous. At this stage of tensile loading, damage is numerically predicted only in the center of the notch (L, C) with the maximum , whereas the surface (S) of the notch remains undamaged. After unloading of and reloading with (NP 0/+1 to 1/0 50% end), remarkable increase in the equivalent strains can be seen in Figure 8c. On the surface (S) and in the center (L, C) of the notch, is reached, and the plastic behavior is very similar to that one after the basic experiment shown in Figure 8a. The equivalent damage strain is also similar to that one of the basic experiment with the diagonal band and the maxima on the surface of the notch (S), but the maximum is now 0.19, which is an increase of about 90% compared to the basic experiment. In the case of alternative preloading rates of 75% and 85%, the distributions of equivalent plastic strains are very similar to those discussed above with maxima on the surface (S) of the notch, as well as the vertical band after the preloading step (Figure 8d,f) and the slightly diagonal band after the final load step (Figure 8e,g). However, remarkable differences in the maxima can be seen: For 75% preloading rate, (Figure 8d), and, for 85%, (Figure 8f) are reached after the first load step. After unloading of and reloading with , the maxima are for 75% preloading rate (Figure 8e) and for 85% (Figure 8f). Thus, there is an increase of plastic deformation compared to the basic experiment (Figure 8a). The equivalent damage strains for the alternative paths with 75% and 85% after the first preloading step are also similar to that one for 50% and the maxima reach for 75% preloading rate (Figure 8d) and for 85% (Figure 8f). However, damage caused by the first preloading step affects the further damage evolution during the final load path. In the case of 75% preloading rate, the distribution of damage now shows a nearly vertical band of the equivalent damage strains on the surface (S) and in the longitudinal section (L) of the notch, and the maximum in the center reaches (Figure 8e). This behavior can also be seen after 85% preloading rate: The equivalent damage strain is localized in a vertical band, and the maximum is in the center of the notch (Figure 8g), and a remarkable increase in the equivalent damage strain of about 50% is numerically predicted. Thus, the different preloading paths only marginally influence the distribution of plastic strains, whereas the orientation of the localized band of the equivalent damage strain changes from a diagonal to a vertical orientation. In addition, with increase in preloading rate, the maxima of equivalent damage strains move from the boundaries to the center of the notch. This indicates that onset of fracture in the pre-tensile-loaded H-specimen happens in the center of the notch, leading to more unexpected and dangerous behavior.
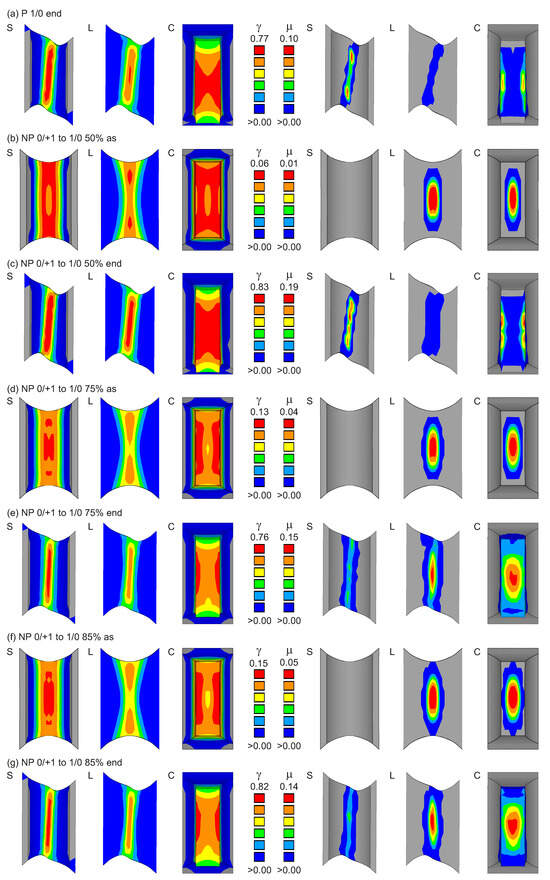
Figure 8.
Equivalent plastic strain and equivalent damage strain : S—surface, L—longitudinal section, C—cross section.
Photos of the fractured specimens are shown in Figure 9. After proportional loading by (P 1/0 end, Figure 9a), the fracture line shows diagonal orientation. With increasing preloading rate (Figure 9b–d), the orientation of the fracture line moves from diagonal to a more vertical one. These pictures agree well with the distributions of the first principal strain (Figure 6), as well as with the equivalent plastic and equivalent damage strains (Figure 8).
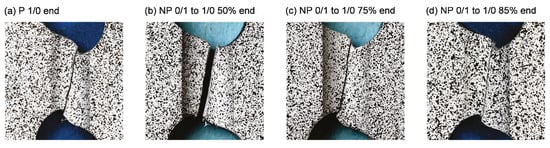
Figure 9.
Fracture lines.
After the respective experiments, pictures of the fracture surfaces in the central part of the notch were taken by scanning electron microscopy (SEM); see Figure 10. After sole loading by (P 1/0 end), only very few preexisting voids, which are compressed by shear stresses, as well as predominant micro-shear-cracks, can be seen in Figure 10a. This damage behavior is typical for the stress state with and shown in Figure 7a. If preloading by is taken into account, first damage mechanism is growth of voids corresponding to the positive stress triaxialities and negative Lode parameters (see Figure 7b). With increasing load , the voids further grow and, in some parts, coalesce with neighboring ones to larger micro-pores. This effect can also be seen in the equivalent damage strains with increasing preloading rate in Figure 8b,d,f. These voids remain during unloading and are sheared in the final load path with . This behavior is clearly shown in Figure 10: With increasing preloading rate, larger voids can be seen in Figure 8d, which are sheared and compressed and superposed by micro-shear-cracks. Thus, pre-tensile-loading changes the damage behavior to more void-dominated modes, indicating more brittle behavior compared to only shear-loaded specimens.
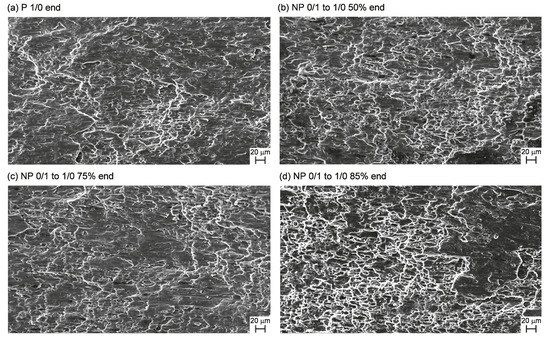
Figure 10.
Scanning electron microscopy (SEM) pictures of the fracture surfaces.
4.3. Preloading by , Final Loading by
The distributions of the first principal strain for the first loading history (preloading by and final loading by ) can be seen in Figure 11, where the left pictures are experimental results monitored by DIC, and the respective right pictures show numerically predicted strains. In particular, at the end of the proportional load path (P 0/+1 end), the first principal strain reaches 0.15 in a widespread band (Figure 11a), which is less widespread in the numerical simulation. After preloading by (NP 1/0), more localized distribution of the first principal strain can be seen in the DIC pictures with maxima of 0.21 after 45% preloading rate (Figure 11(b1)), of 0.34 after 65% (Figure 11(c1)), or of 0.49 after 90% preloading rate (Figure 11(d1)). In the corresponding numerical simulations, localized diagonal bands are predicted with similar maxima and orientation from top right to bottom left. After unloading and subsequent loading by (NP 1/0 to 0/+1), the strain fields only slightly change and are mainly caused by the preloading paths. However, the amount of the principal strains remarkably increases up to about 300% of those at the end of the basic test.
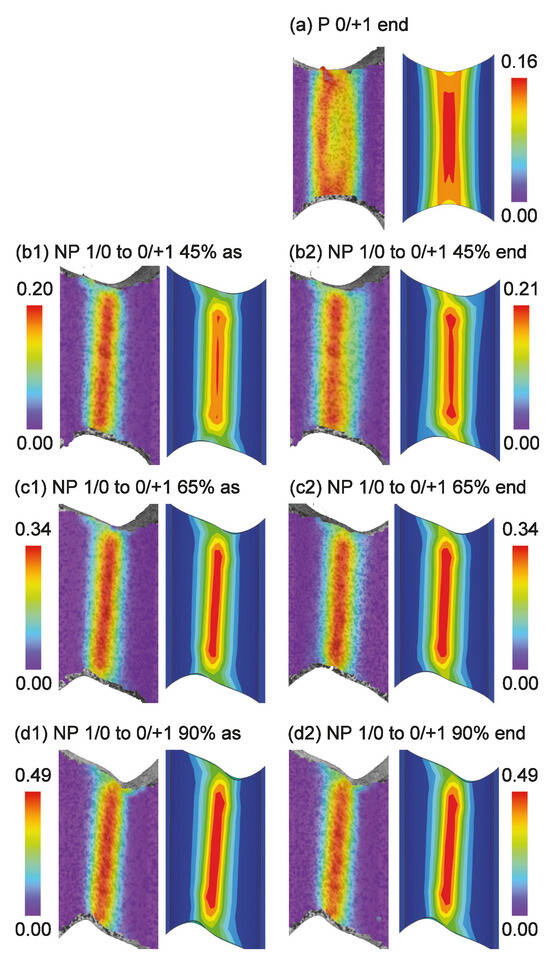
Figure 11.
First principal strain by DIC (left) and numerical simulation (right).
Numerically-predicted distributions and amounts of the stress triaxiality and the Lode parameter on the surface (S) of the notched region, in the longitudinal section (L) and in the cross section (C) for the loading histories EXP 1/0 to 0/+1, are shown in Figure 12. In particular, at the end of the basic experiment with the proportional loading path P 0/+1 end (Figure 12a), the distribution of the stress triaxiality shows high values of about 0.9 near the center of the notch (L), whereas, in the cross section (C) and on the surface (S), the stress triaxiality is between and . The corresponding Lode parameter is in the center of the notch (L, C) surrounded by smaller values up to . On the surface, (S) of the notch the Lode parameter is about . It is worthy of note that the distribution of the stress triaxiality and of the Lode parameter, respectively, on the surface (S), in the longitudinal (L), and in the cross (C) section of the notch are symmetric. These stress parameters are typical for tensile tests with doubly-notched flat specimens.
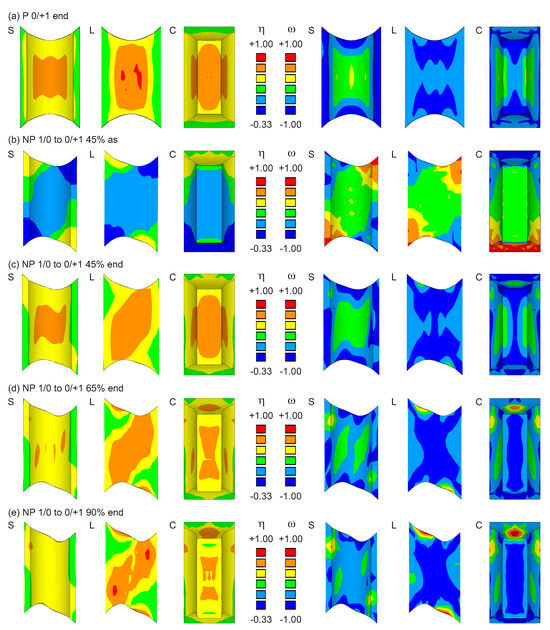
Figure 12.
Stress triaxiality and Lode parameter : S—surface, L—longitudinal section, C—cross section.
The distributions and amounts of the stress parameters of the differently preloaded specimens are also shown in Figure 12. For example, at the end of the preloading step with 45% loading rate (NP 1/0 to 0/+1 45% as; see Figure 12b), the stress triaxiality and the Lode parameter agree with those of the basic experiment P 1/0 end (Figure 7a) with nearly homogeneous distribution of these parameters in the notched region and the values of about and . Very similar distributions are also numerically predicted for 65% and 90% loading rate and, thus, are not shown in Figure 12. After unloading of and reloading with up to final fracture (NP 1/0 to 0/+1 45% end), the stress triaxiality only reaches in the center (L, C) and on the surface (S) of the notch; see Figure 12c. The distribution of the corresponding Lode parameter is less homogeneous with in the center of the cross section (C), and, on the surface (S), it is about . Thus, compared with the basic experiment (Figure 12a), a slight influence of the preloading step on the stress parameters can be seen, where the distribution of the stress parameters is now non-symmetric. In the case of 65% and 90% preloading rate (NP 1/0 to 0/+1 65% end; NP 1/0 to 0/+1 90% end), respectively, further decrease in the stress triaxiality at the end of the experiments is numerically predicted; see Figure 12d,e. The corresponding Lode parameter here shows on the surface (S) of the notch a band with and in the longitudinal section (L) two small regions on top left and bottom right can be seen with values up to . Compared to the stress parameters at the end of the basic test (Figure 12a), the values of the stress triaxiality and of the Lode parameter have been affected by the preloading histories, and their initially symmetric distribution has changed. However, the changes in the amounts of the stress parameters are small.
Furthermore, numerically predicted distributions and amounts of the equivalent plastic strain and the equivalent damage strain on the surface (S) of the notched region, in the longitudinal section (L), and in the cross section (C) for the loading histories EXP 1/0 to 0/+1 are shown in Figure 13. In particular, at the end of the basic experiment with the proportional loading path P 0/+1 end (Figure 13a), the maximum equivalent plastic strain occurs on the surface (S) of the notch in a vertical band, whereas, in the center of the notch (L, C), only is reached. On the other hand, the equivalent damage strain has its maximum with in the center (L, C) of the notch, whereas, on the surface (S), no damage is numerically predicted. For this basic loading case P 0/+1, the distributions of the equivalent plastic strain and of the equivalent damage strain are symmetric in the notched part of the H-specimen; see Figure 13a.
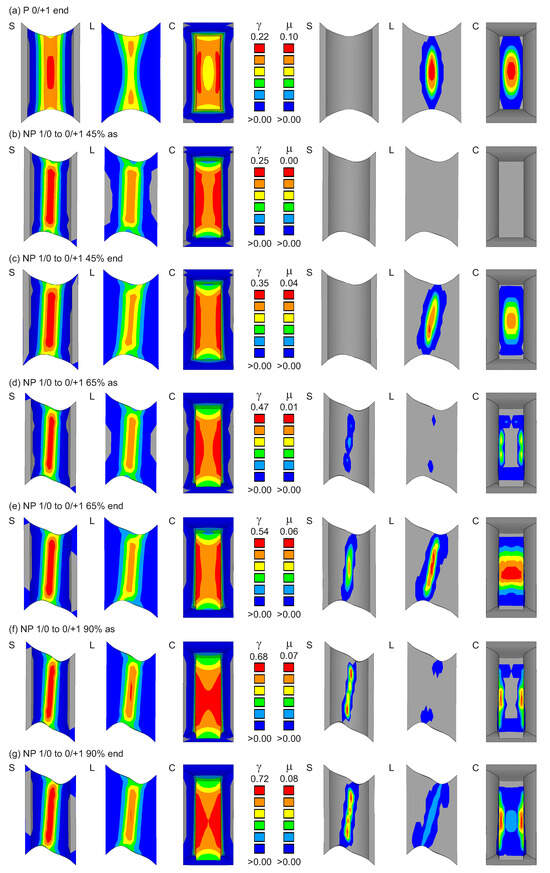
Figure 13.
Equivalent plastic strain and equivalent damage strain : S—surface, L—longitudinal section, C—cross section.
In addition, distributions and amounts of the respective equivalent strains for different preloading histories are also shown in Figure 13. For the 45% preloading rate, the equivalent plastic strains after the first load path by (NP 1/0 to 0/+1 45% as) reach on the surface (S) of the notch and in its center (L, C); see Figure 13b. The equivalent plastic strains are localized in a slightly diagonal band from top right to bottom left. At this loading stage, no damage is numerically predicted. After unloading of and reloading with (NP 1/0 to 10/+1 45% end), the equivalent plastic strains have increased up to on the surface (S) of the notch, and the distribution of the first load step (Figure 13b) remains nearly unchanged. During this load path, the equivalent damage strains increase up to in the center (L, C) of the notch, and it is localized here in a diagonal band with orientation from top right to bottom left. The surface of the notch (S) remains undamaged. The distribution of the equivalent plastic strain and the equivalent damage strain is different to that one after the basic experiment (Figure 13a), where the localized bands are vertical. Although, after the first preloading step with 45% rate quasi, no damage occurs, and damage only increases in the second load path (which is identical to that one of the basic experiment),and the distribution of damage (Figure 13c) is different from that one of the basic test (Figure 13a). This means that the final damage state is not only affected by damage of earlier load steps but is also influenced by the evolution of plastic deformations. In the case of 65% preloading rate, the distribution of the equivalent plastic strain after loading with is similar to that one of 45% rate, but the values reach on the surface (S) of the notch and in its center (L, C); see Figure 13d. In addition, damage also occurs and there are some small regions on the surface (S), in the longitudinal (L), and in the cross section (C) of the notch with equivalent damage strains up to . After unloading of and reloading with (NP 1/0 to 10/+1 65% end), the equivalent plastic strains increase up to , whereas the distribution remains nearly unchanged. However, although damage is very small after the first load step (Figure 13d), the equivalent damage strain after the final load step reaches , which can be seen in the longitudinal section (L) of the notch, and it is in the center (C). Again, the equivalent damage strain is localized in a slightly diagonal band with orientation from top right to bottom left, and this distribution is different compared to that one of the basic experiment (Figure 13a). This trend can also be seen in the case of 90% preloading rate (NP 1/0 to 0/+1 90%); see Figure 13f,g. In the first preloading step with , the equivalent plastic strain has the same distribution as before (Figure 13d), but the maximum reaches . The equivalent damage strain now reaches on the surface (S) of the notch, and, again, the diagonal localized band can be seen. In the center (L, C) of the notch, no damage is numerically predicted. After unloading of and reloading with (NP 1/0 to 0/+1 90% end), the equivalent plastic strain increases up to , and the distribution remains nearly unchanged (Figure 13g). The equivalent damage strain also increases up to on the surface, and, especially in the longitudinal section (L), the localized diagonal band is clearly visible. These results clearly show that the preloading history remarkably affects the plastic and damage strain behavior, and especially the orientation of localized inelastic bands. With increasing pre-shear-loading, the maximum damage occurs at the boundaries of the notch indicating that onset of fracture happens in this region. Thus, the beginning of the fracture process will be visible, leading to less dangerous behavior.
Photos of the fractured specimens are shown in Figure 14. After proportional loading by (P 0/+1 end, Figure 14a), the fracture line shows vertical orientation. With increasing preloading rate (Figure 14b–d), the orientation of the fracture line moves from vertical to a diagonal one. These pictures agree well with the distributions of the first principal strain (Figure 11), as well as with the equivalent plastic and equivalent damage strains (Figure 13).
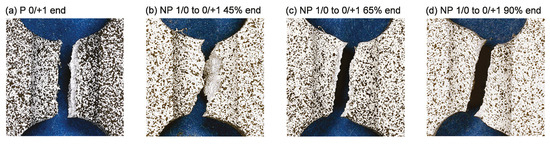
Figure 14.
Fracture lines.
After the respective experiments, pictures of the fracture surfaces in the central part of the notch were taken by SEM; see Figure 15. After only loading by (P 0/+1 end), a lot of voids with different sizes, as well as dimples, can be seen in Figure 15a. This damage and fracture behavior is typical for the stress state with high stress triaxialities, as shown in Figure 12a. If preloading by is taken into account, inelastic shear behavior occurs, corresponding to nearly zero stress parameters ( and ; see Figure 12b). As discussed above, nearly only plastic deformations are numerically predicted for 45% and 65% preloading rate (Figure 13b,d), whereas also damage strains occur for 90% rate; see Figure 13f. These shear deformations can be seen in Figure 15b,c, which are superimposed by voids leading to failure of the H-specimen. For 90% preloading rate, micro-shear-cracks occur in the first load step. They accumulated to macro-cracks in the subsequent tensile test with some small superimposed voids; see Figure 15d. Thus, for these loading conditions, damage and the final fracture processes are remarkably influenced by the preloading history.
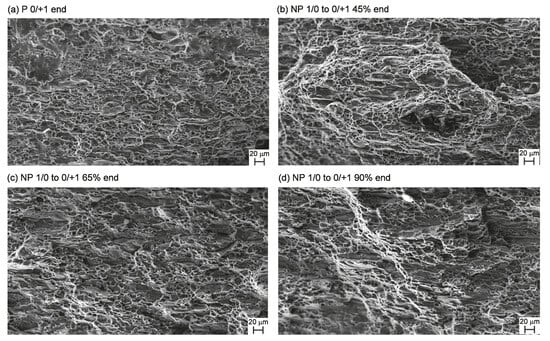
Figure 15.
SEM pictures of the fracture surfaces.
5. Conclusions
In this paper, the influence of the load path on damage and fracture behavior of aluminum alloys was investigated in detail. Various experiments and corresponding numerical simulations with the biaxially loaded H-specimen were performed with focus on different preloading histories. The main conclusions are:
- Characterization of materials must be based on an enhanced experimental program including biaxial tests with different loading histories to analyze the stress state and stress history dependence on deformation and failure behavior.
- A sophisticated damage model must be used taking into account anisotropic and stress-state-dependent damage processes on the micro-level. The proposed continuum model based on rate equations for damage strain tensors allows simulation of deformation behavior, as well as damage and failure in structural elements undergoing various loading histories.
- Different preloading histories remarkably influence the load-displacement behavior. The specimen becomes more brittle with smaller elongations at the onset of fracture.
- The final stresses remain nearly unaffected by different preloadings, although the stress histories are different.
- Changes in the amount, width and orientation of localized strain bands occur, mainly caused by the different preloading histories.
- In shear tests, after pre-tensile-loading, regions of maximum damage move from the boundaries of the notch to its center, where onset of fracture will happen. This indicates unexpected and dangerous failure behavior.
- In shear tests, pre-tensile-loading changes the damage behavior from shear mechanisms to more void-dominated modes, indicating more brittle behavior.
- In tension tests, after pre-shear-loading, regions of maximum damage move from the center to the boundaries of the notch. Onset of the fracture process will be visible, leading to less dangerous behavior.
- In tension tests, pre-shear-loading leads to micro-shear-crack behavior, which is only marginally affected by few growing voids caused by subsequent tensile loading. The failure process will be shear-dominated.
- The experimental and numerical results may give hints and recommendations to optimize metal forming processes.
Author Contributions
Conceptualization, M.B., S.G., and M.Z.; methodology, M.B.; software, S.G. and M.Z.; validation, M.Z.; formal analysis, M.B., S.G., and M.Z.; investigation, M.Z., M.B.; writing—review and editing, S.G. and M.Z.; visualization, M.Z.; supervision, M.B.; project administration, M.B. and S.G.; funding acquisition, M.B. All authors have read and agreed to the published version of the manuscript.
Funding
This research was funded by Deutsche Forschungsgemeinschaft DFG (German Research Foundation) under project number 322157331 (BR1793/20-1).
Institutional Review Board Statement
Not applicable.
Informed Consent Statement
Not applicable.
Data Availability Statement
The data presented in this study are available on request from the corresponding author.
Acknowledgments
The financial support of the DFG is gratefully acknowledged. The technical support of Wolfgang Saur (Universität der Bundeswehr München, Werkstoffe das Bauwesens, Germany) is also gratefully acknowledged.
Conflicts of Interest
The authors declare no conflict of interest.
References
- Stanić, D.; Zovko Brodarac, Z.; Li, L. Influence of Copper Addition in AlSi7MgCu Alloy on Microstructure Development and Tensile Strength Improvement. Metals 2020, 10, 1623. [Google Scholar] [CrossRef]
- Yang, G.; Kim, J.K. An Overview of High Yield Strength Twinning-Induced Plasticity Steels. Metals 2021, 11, 124. [Google Scholar] [CrossRef]
- Mazlan, S.; Yidris, N.; Koloor, S.S.R.; Petrů, M. Experimental and Numerical Analysis of Fatigue Life of Aluminum Al 2024-T351 at Elevated Temperature. Metals 2020, 10, 1581. [Google Scholar] [CrossRef]
- Park, H.G.; Kang, B.S.; Kim, J. Numerical Modeling and Experimental Verification for High-Speed Forming of Al5052 with Single Current Pulse. Metals 2019, 9, 1311. [Google Scholar] [CrossRef]
- Brünig, M. A thermodynamically consistent continuum damage model taking into account the ideas of CL Chow. Int. J. Damage Mech. 2016, 25, 1130–1141. [Google Scholar] [CrossRef]
- Živković, J.; Dunić, V.; Milovanović, V.; Pavlović, A.; Živković, M. A Modified Phase-Field Damage Model for Metal Plasticity at Finite Strains: Numerical Development and Experimental Validation. Metals 2021, 11, 47. [Google Scholar] [CrossRef]
- Gerke, S.; Adulyasak, P.; Brünig, M. New biaxially loaded specimens for the analysis of damage and fracture in sheet metals. Int. J. Solids Struct. 2017, 110–111, 209–218. [Google Scholar] [CrossRef]
- Zhang, W.; Zhu, Z.; Zhou, C.; He, X. Biaxial Tensile Behavior of Commercially Pure Titanium under Various In-Plane Load Ratios and Strain Rates. Metals 2021, 11, 155. [Google Scholar] [CrossRef]
- Bai, Y.; Wierzbicki, T. A new model of metal plasticity and fracture with pressure and Lode dependence. Int. J. Plast. 2008, 24, 1071–1096. [Google Scholar] [CrossRef]
- Bonora, N.; Gentile, D.; Pirondi, A.; Newaz, G. Ductile damage evolution under triaxial state of stress: Theory and experiments. Int. J. Plast. 2005, 21, 981–1007. [Google Scholar] [CrossRef]
- Brünig, M.; Chyra, O.; Albrecht, D.; Driemeier, L.; Alves, M. A ductile damage criterion at various stress triaxialities. Int. J. Plast. 2008, 24, 1731–1755. [Google Scholar] [CrossRef]
- Driemeier, L.; Brünig, M.; Micheli, G.; Alves, M. Experiments on stress-triaxiality dependence of material behavior of aluminum alloys. Mech. Mater. 2010, 42, 207–217. [Google Scholar] [CrossRef]
- Bao, Y.; Wierzbicki, T. On fracture locus in the equivalent strain and stress triaxiality space. Int. J. Mech. Sci. 2004, 46, 81–98. [Google Scholar] [CrossRef]
- Gao, X.; Zhang, G.; Roe, C. A Study on the Effect of the Stress State on Ductile Fracture. Int. J. Damage Mech. 2010, 19, 75–94. [Google Scholar] [CrossRef]
- Li, H.; Fu, M.W.; Lu, J.; Yang, H. Ductile fracture: Experiments and computations. Int. J. Plast. 2011, 27, 147–180. [Google Scholar] [CrossRef]
- Dunand, M.; Mohr, D. On the predictive capabilities of the shear modified Gurson and the modified Mohr–Coulomb fracture models over a wide range of stress triaxialities and Lode angles. J. Mech. Phys. Solids 2011, 59, 1374–1394. [Google Scholar] [CrossRef]
- Roth, C.C.; Mohr, D. Ductile fracture experiments with locally proportional loading histories. Int. J. Plast. 2016, 79, 328–354. [Google Scholar] [CrossRef]
- Lou, Y.; Chen, L.; Clausmeyer, T.; Tekkaya, A.E.; Yoon, J.W. Modeling of ductile fracture from shear to balanced biaxial tension for sheet metals. Int. J. Solids Struct. 2017, 112, 169–184. [Google Scholar] [CrossRef]
- Liu, Y.; Kang, L.; Ge, H. Experimental and numerical study on ductile fracture of structural steels under different stress states. J. Constr. Steel Res. 2019, 158, 381–404. [Google Scholar] [CrossRef]
- Lin, S.B.; Ding, J.L. Experimental study of the plastic yielding of rolled sheet metals with the cruciform plate specimen. Int. J. Plast. 1995, 11, 583–604. [Google Scholar] [CrossRef]
- Green, D.E.; Neale, K.W.; MacEwen, S.R.; Makinde, A.; Perrin, R. Experimental investigation of the biaxial behaviour of an aluminum sheet. Int. J. Plast. 2004, 20, 1677–1706. [Google Scholar] [CrossRef]
- Kuwabara, T. Advances in experiments on metal sheets and tubes in support of constitutive modeling and forming simulations. Int. J. Plast. 2007, 23, 385–419. [Google Scholar] [CrossRef]
- Kulawinski, D.; Nagel, K.; Henkel, S.; Hübner, P.; Fischer, H.; Kuna, M.; Biermann, H. Characterization of stress–strain behavior of a cast TRIP steel under different biaxial planar load ratios. Eng. Fract. Mech. 2011, 78, 1684–1695. [Google Scholar] [CrossRef]
- Demmerle, S.; Boehler, J.P. Optimal design of biaxial tensile cruciform specimens. J. Mech. Phys. Solids 1993, 41, 143–181. [Google Scholar] [CrossRef]
- Song, X.; Leotoing, L.; Guines, D.; Ragneau, E. Characterization of forming limits at fracture with an optimized cruciform specimen: Application to DP600 steel sheets. Int. J. Mech. Sci. 2017, 126, 35–43. [Google Scholar] [CrossRef]
- Liedmann, J.; Gerke, S.; Barthold, F.J.; Brünig, M. Shape optimization of the X0-specimen: Theory, numerical simulation and experimental verification. Comput. Mech. 2020. [Google Scholar] [CrossRef]
- Brünig, M.; Brenner, D.; Gerke, S. Stress state dependence of ductile damage and fracture behavior: Experiments and numerical simulations. Eng. Fract. Mech. 2015, 141, 152–169. [Google Scholar] [CrossRef]
- Brünig, M.; Brenner, D.; Gerke, S. Modeling of Stress-State-Dependent Damage and Failure of Ductile Metals. Appl. Mech. Mater. 2015, 784, 35–42. [Google Scholar] [CrossRef]
- Wang, J.; Chow, C.L. Mixed Mode Ductile Fracture Studies With Nonproportional Loading Based on Continuum Damage Mechanics. J. Eng. Mater. Technol. 1989, 111, 204–209. [Google Scholar] [CrossRef]
- Chow, C.L.; Lu, T.J. An Analytical and Experimental Study of Mixed-Mode Ductile Fracture under Nonproportional Loading. Int. J. Damage Mech. 1992, 1, 191–236. [Google Scholar] [CrossRef]
- Cortese, L.; Nalli, F.; Rossi, M. A nonlinear model for ductile damage accumulation under multiaxial non-proportional loading conditions. Int. J. Plast. 2016, 85, 77–92. [Google Scholar] [CrossRef]
- Zhuang, X.; Wang, T.; Zhu, X.; Zhao, Z. Calibration and application of ductile fracture criterion under non-proportional loading condition. Eng. Fract. Mech. 2016, 165, 39–56. [Google Scholar] [CrossRef]
- Scales, M.; Chen, K.; Kyriakides, S. Material response, localization, and failure of an aluminum alloy under combined shear and tension: Part I experiments. Int. J. Plast. 2019, 120, 340–360. [Google Scholar] [CrossRef]
- Fincato, R.; Tsutsumi, S. Numerical modeling of the evolution of ductile damage under proportional and non-proportional loading. Int. J. Solids Struct. 2019, 160, 247–264. [Google Scholar] [CrossRef]
- Basu, S.; Benzerga, A.A. On the path-dependence of the fracture locus in ductile materials: Experiments. Int. J. Solids Struct. 2015, 71, 79–90. [Google Scholar] [CrossRef]
- Korkolis, Y.P.; Kyriakides, S. Path-dependent failure of inflated aluminum tubes. Int. J. Plast. 2009, 25, 2059–2080. [Google Scholar] [CrossRef]
- Gerke, S.; Zistl, M.; Bhardwaj, A.; Brünig, M. Experiments with the X0-specimen on the effect of non-proportional loading paths on damage and fracture mechanisms in aluminum alloys. Int. J. Solids Struct. 2019, 163, 157–169. [Google Scholar] [CrossRef]
- Brünig, M.; Zistl, M.; Gerke, S. Biaxial experiments on characterization of stress-state-dependent damage in ductile metals. Prod. Eng. 2020, 14, 87–93. [Google Scholar] [CrossRef]
- Brünig, M.; Gerke, S.; Zistl, M. Experiments and numerical simulations with the H-specimen on damage and fracture of ductile metals under non-proportional loading paths. Eng. Fract. Mech. 2019, 217, 106531. [Google Scholar] [CrossRef]
- Gerke, S.; Zistl, M.; Brünig, M. Experiments and numerical simulation of damage and fracture of the X0-specimen under non-proportional loading paths. Eng. Fract. Mech. 2020, 224, 106795. [Google Scholar] [CrossRef]
- Brünig, M. An anisotropic ductile damage model based on irreversible thermodynamics. Int. J. Plast. 2003, 19, 1679–1713. [Google Scholar] [CrossRef]
- Brünig, M.; Gerke, S.; Hagenbrock, V. Micro-mechanical studies on the effect of the stress triaxiality and the Lode parameter on ductile damage. Int. J. Plast. 2013, 50, 49–65. [Google Scholar] [CrossRef]
- Brünig, M.; Gerke, S.; Schmidt, M. Damage and failure at negative stress triaxialities: Experiments, modeling and numerical simulations. Int. J. Plast. 2018, 102, 70–82. [Google Scholar] [CrossRef]
- Brünig, M.; Gerke, S.; Hagenbrock, V. Stress-state-dependence of damage strain rate tensors caused by growth and coalescence of micro-defects. Int. J. Plast. 2014, 63, 49–63. [Google Scholar] [CrossRef]
- Brünig, M.; Hagenbrock, V.; Gerke, S. Macroscopic damage laws based on analysis of microscopic unit cells. ZAMM J. Appl. Math. Mech./Z. Angew. Math. Mech. 2018, 98, 181–194. [Google Scholar] [CrossRef]
- Voce, E. A practical strain-hardening function. Metallurgia 1955, 51, 219–226. [Google Scholar]


Publisher’s Note: MDPI stays neutral with regard to jurisdictional claims in published maps and institutional affiliations. |
© 2021 by the authors. Licensee MDPI, Basel, Switzerland. This article is an open access article distributed under the terms and conditions of the Creative Commons Attribution (CC BY) license (http://creativecommons.org/licenses/by/4.0/).