Abstract
The microstructural properties of a Pb-free solder joint significantly affect its mechanical behaviours. This paper details a systematic study of the effect of the annealing process on the microstructure and shear strength of a Zn-added Sn-0.7Cu solder joint. The results indicated that the IMC layer’s thickness at the solder/Cu interface increases with annealing time. The interfacial IMC layer of the Sn-0.7Cu solder joint gradually thickened with increasing annealing time and annealing temperature, while the interfacial IMC layer’s morphology changed from scallop-type to layer-type after the annealing process. However, the addition of 1.0 wt.% and 1.5 wt.% Zn in the Sn-0.7Cu effectively altered the interfacial IMC phase to Cu-Zn and suppressed the growth of Cu3Sn during the annealing process. The single-lap shear tests results confirmed that the addition of Zn decreased the shear strength of Sn-0.7Cu. The interfacial IMC of the Cu6Sn5 phase in Sn-0.7Cu changed to Cu-Zn due to the addition of Zn. The shear fractures in the annealed solder joint were ductile within the bulk solder instead of the interfacial IMC layer. Increased annealing time resulted in the increased presence of the Cu-Zn phase, which decreased the hardness and shear strength of the Sn-0.7Cu solder joint.
1. Introduction
The traditional Sn-Pb solder is prevalent in interconnections and electronic packaging. However, its toxicity and environmental impact are of grave concern. Subsequently, the use of Pb in electronic packaging has been forbidden by the European Union’s proposal for Directive on Waste from Electrical and Electronic Equipment (WEEE) and Directive of the Restriction of the Use of Certain Hazardous Substances (RoHS) since July 2006 [1]. Several iterations of Pb-free solders, such as Sn-Ag, Sn-Zn, Sn-Ag-Cu, and Sn-Cu solder systems, have been developed to pursue green technologies in electronics manufacturing. Sn-0.7Cu is one of the most common Pb-free solders used in electronic packaging due to its excellent mechanical properties, wettability, ubiquity, and low costs [2]. In the electronic packaging industry, reliability losses in many electronic systems are caused by the failure of solder joints instead of device malfunction [3], which shifted research focus onto solder joints’ reliability. Solder joint reliability studies commonly involve a crucial component: the interfacial intermetallic compounds (IMCs). During soldering, interfacial intermetallic layer(s) form at the solder/Cu interfaces when the solder wets the Cu pad on the PCB, which subsequently dictates the bonding strength and service reliability of the solder joints.
Generally, an electronic device, during its operation, is subject to high temperatures, which destabilises the IMCs in the device [4]. The IMC layer will continue to grow in the solid-state condition, which has long-term (negative) consequences on the solder joint’s performance. Thermal annealing influences the solder joint’s strength via changes in the IMCs’ thickness and the solders’ microstructure. The total thickness of the intermetallic layer may increase with increasing thermal annealing times and temperatures. It is surmised that microstructure growth can significantly influence the solder joints’ reliability, and knowledge of microstructural changes in solders and joints is essential if electronic devices’ operational life is to be increased. The IMC layer’s kinetic growth during thermal annealing needs to be understood to develop reliable Pb-free solder joints. During thermal annealing, the IMC layers experience gradual growth, which results in decreased ductility and defect-like voids forming at the interface(s), the latter of which could potentially cause the subsequent failure of the solder interconnections.
The Sn-Zn solder system has been vigorously researched in the development of a low-cost Pb-free solder alloy. As shown in phase diagram (Figure 1), the Sn phase has tie-lines with the Cu6Sn5, Cu-Zn and Cu5Zn8 phase, respectively. As the Zn composition increases, the reaction product changes from single phase Cu6Sn5 to two phase, Cu6Sn5 + Cu-Zn, a single phase Cu-Zn, a two phase Cu-Zn + Cu5Zn8 and then to single phase Cu5Zn8 [5]. Recent works have reported that Zn’s addition into Sn-3.0Ag-0.5Cu solder influences the microstructure, enhancing the mechanical strength, and decreasing the resulting solder joints’ melting temperature [6]. The addition of Zn also influenced the IMC’s growth rate, decreased the melting temperature, and improved the microstructure of the Sn-3.0Ag-0.5Cu solder, as per Siahaan et al. [7]. The effects of introducing low amounts of Zn into Sn-3.0Ag-0.5Cu BGA solder joints on Cu pads were studied by Sousa et al. [8], who concluded that the presence of small amounts of Zn had a significantly beneficial effect on the interfacial IMC. The effect of the addition of higher amounts of Zn into Sn-0.7Cu Pb-free solder on wettability was explored by Wang et al. [9], and it was reported that the microstructure of Sn-Cu solder was refined via the addition of Zn by inducing the change of the interfacial IMC layer from Cu-Sn to Cu-Zn [10]. The formation of Cu-Zn is beneficial in suppressing the growth of IMC interface. Therefore, in order to look for an IMC depressed at high temperature application. This Cu-Zn intermetallic materials system is interesting to explore.
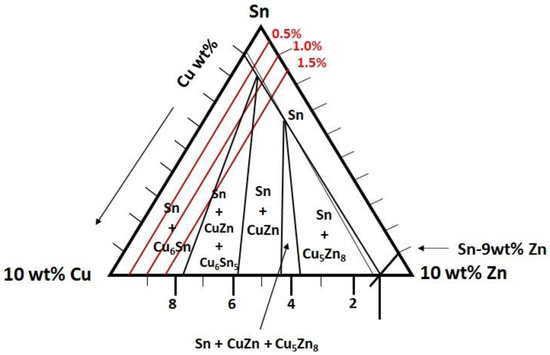
Figure 1.
Ternary phase diagram of Sn-Cu-Zn [5].
In the context of the interfacial reliability of solder joints during storage and field service, the interfacial IMC thickness is expected to influence the joints’ strength and subsequent mechanical properties. The formation and growth of interfacial IMCs during soldering and thermal annealing has been widely studied. This paper details the investigation into the evolution of IMCs at Sn-0.7Cu-xZn/Cu as-reflowed and annealed under high temperatures. The joints’ reliability after annealing and the formation and growth of the interfacial IMC layers are linked to the subsequent solder joints’ shear strength. The activation energy of Sn-0.7Cu-xZn was elucidated, and sheared fractography was also analysed.
2. Materials and Methods
In this work, the Sn-0.7Cu solder alloy was synthesised with different added Zn concentrations (0 wt.%, 0.5 wt.%, 1.0 wt.% and 1.5 wt.%). The Sn-0.7Cu solder ingot was obtained from Nihon Superior, Esaka-Cho Suita, Japan, while the Zn ingot was purchased from Sigma-Aldrich (M) Sdn. Bhd. The solder alloy was prepared by suspending it for an hour in an electric-resistance furnace at 350 °C. Then, the molten solder was stirred using graphite rod and cast in stainless steel moulds coated with boron nitride, which was then cooled. The solder balls (diameter of 600 µm) were produced by using a 2.0-mm-diameter metal puncher and had been rolled into a sheet with a thickness of 30 µm, then mixed with rosin mildly activated (RMA) flux and melted using reflow oven at 250 °C. The solder balls were produced via surface tension and eventually passed through a series of sieves to ensure a uniformed solder size was obtained. The produced solder balls were dipped with flux and placed on a Cu-substrate PCB with an organic soldering preservative (OSP) surface finish and reflowed at 250 °C using the temperature profile shown in Figure 1. The soldered samples were then annealed at 120 °C, 150 °C, and 180 °C for 24 h, 120 h, and 240 h, respectively.
The cross-sectional microstructure at the interface(s) of the solder joints was imaged and analysed. The effect of the addition of Zn on Sn-0.7Cu on the thicknesses of Cu6Sn5 and Cu3Sn at three different temperatures were determined. The samples were imaged using an optical microscope and scanning electron microscope (SEM) to observe the microstructure changes and IMC layers’ growth kinetics. Five images were taken at three different areas to obtain the average thickness of the interfacial IMC layer across the joints. The interfacial IMC layer thickness measurements were conducted by dividing the IMC layer area by its length using the ImageJ analyser. The microhardness test involved using a Vickers microhardness test machine operated as per the ASTM B933-09 standard test method, with operating parameters of 10 s dwell time and a 1 kgf indenting load. Five points for each composition were tested, and the obtained values averaged to ensure the accuracy of the measurement. The strength of the solder joint post-annealing process was investigate using the shear test experiment. A 1 g amount of the solder alloy and flux were covered vertically and sandwiched with a Cu-substrate, then soldered as per the temperature profile shown in Figure 2. The shear tests were conducted using an Instron machine at a strain rate of 2 mm min−1. The specification of shear strength was based on the ASTM D1002, as per Figure 3. For each annealing condition, five samples were sheared, and the average shear strengths were calculated to ensure accuracy in measurement. The fractography for the fracture surface was also imaged using an SEM.
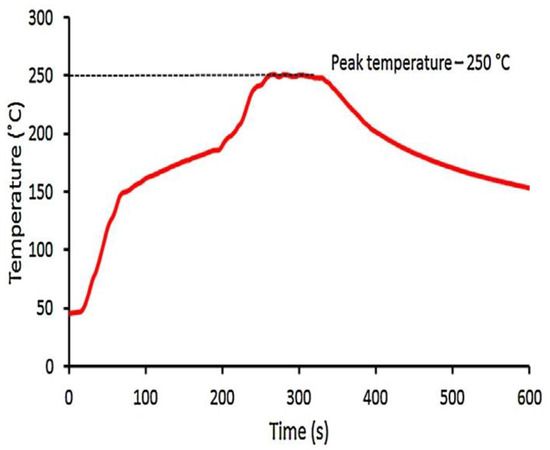
Figure 2.
Solder reflow temperature profile for solder joint fabrication.
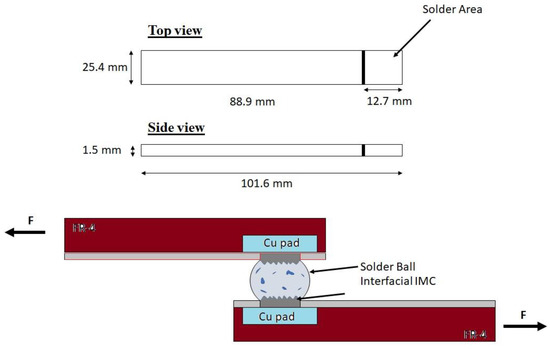
Figure 3.
Illustration of the shear test of solder joints.
3. Results and Discussion
3.1. Microstructure Analysis
Figure 4 shows the microstructure of the β-Sn and eutectic of Sn-0.7Cu solder joint with and without the addition of 1.5 wt.% Zn after being annealed at 180 °C at various times. It can be seen that the Sn-0.7Cu solder bulk contains a β-Sn and eutectic Cu6Sn5 at 0 h. However, after the annealing process (long time), the hollowed Cu6Sn5 primary IMC was formed, and the β-Sn refined. Tian et al. [11] reported a similar phenomenon, where the hollowed Cu6Sn5 primary IMC was formed after annealing Sn-3.0Ag-0.5Cu for an extended time. The observation detailed above can be attributed to the local differences in the dissolution rates along the polycrystalline Cu-pad’s surface, where there were areas where not all of the Cu atoms participated in the interfacial reactions [12]. However, with the addition of 1.5 wt.% Zn into Sn-0.7Cu solder alloy, it is a mixture of Cu6Sn5 and Cu-Zn. even after the annealing process. There are also no sizeable primary IMC crystals being formed after the annealing process.
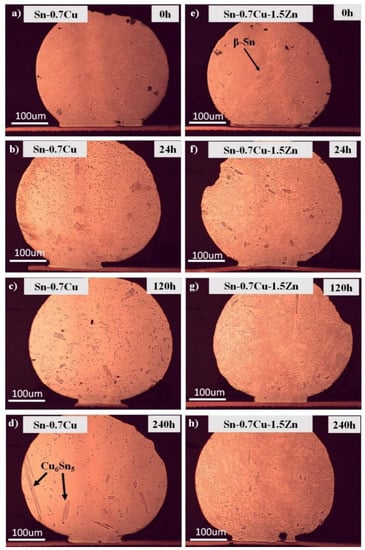
Figure 4.
Microstructure of primary IMC after annealing at 180 °C. Sn-0.7Cu at (a) 0 h, (b) 24 h, (c) 120 h, (d) 240 h and Sn-0.7Cu-1.5Zn at (e) 0 h, (f) 24, h (g) 120 h, (h) 240 h.
The area fraction of the β-Sn and eutectic phases microstructures were calculated before and after annealing at 24 h, 120 h, and 240 h. The area fraction is quantified in Figure 5a, where it can be seen that the eutectic Cu6Sn5 decreased with a longer annealing process. The area of the eutectic Cu6Sn5 in Sn-0.7Cu is 391.33 μm2 and 808.67 μm2 for β-Sn. After being annealed for 240 h, the eutectic decreased to 180 μm2 while β-Sn increased to 1020 μm2, as shown in Figure 5a. With the addition of 0.5 wt.% Zn and 1.0 wt.% Zn, the eutectic Cu6Sn5 decreased with the longer annealing process. However, with the addition of 1.5 wt.% Zn, the area fraction of the eutectic Cu6Sn5 and β-Sn phase of solder alloy remained similar after the annealing time increased to 240 h, as is evident in Figure 5d.
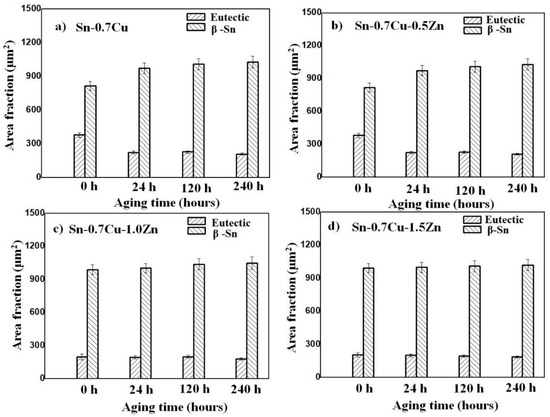
Figure 5.
Area fraction of (a) Sn-0.7Cu, (b) Sn-0.7Cu-0.5Zn, (c) Sn-0.7Cu-1.0Zn and (d) Sn-0.7Cu-1.5Zn at various annealing time.
Generally, the area fraction of the eutectic Cu6Sn5 phase decreases with the addition of Zn. The addition of Zn into Sn-0.7Cu solders can decrease the area fraction of the eutectic Cu6Sn5 phase, confirming that Zn’s addition into Sn-0.7Cu is effective for decreasing the coarsening of IMC particles and stabilising the microstructure during thermal annealing [13]. It can also be seen that there is little change in the area fraction of the eutectic Cu6Sn5 and β-Sn phase after annealing, as per Figure 5c,d. The eutectic phases of Sn-0.7Cu are Cu6Sn5 and β-Sn, while in the Sn-0.7Cu-1.5Zn solder, it is a mixture of Cu6Sn5 and Cu-Zn. The presence of the Cu-Zn phase was also reported by Wang et al. [6], who observed that the addition of 1.0 wt.% Zn into Sn-3.0Ag-0.5Cu solder could induce the IMC phase transformation from Cu6Sn5 to Cu-Zn. In conclusion, the size, distribution, and area fraction of the Zn precipitates are very similar in both conditions.
The cross-sectional microstructures of Sn-0.7Cu and Sn-0.7Cu-1.5Zn solder joints annealed at 180 °C for 240 h are shown in Figure 6. Two interfacial IMC layers, which are Cu6Sn5 and Cu3Sn, were detected in the Sn-0.7Cu/Cu solder joints annealed at 180 °C. However, only one of the interfacial IMC layers in the Sn-0.7Cu-1.5Zn/Cu solder joint was Cu-Zn. The thickness of the interfacial IMC layer increased with increasing annealing time. Relative to the interfacial microstructure of the solder joints of Sn-0.7Cu-1.5Zn, the small crack was detected within the interfacial IMC layer of the solder joints at Sn-0.7Cu. This also shown that the addition of Zn decreases the crack formation at the interfacial IMC layer. This phenomenon can be explained by the fact that it is more probable for cracks to occur in a thicker IMC layer formed by higher annealing temperatures due to the IMC’s inherently brittle nature. Some voids were formed at the interface of both the Cu3Sn and Cu6Sn5/Cu3Sn.
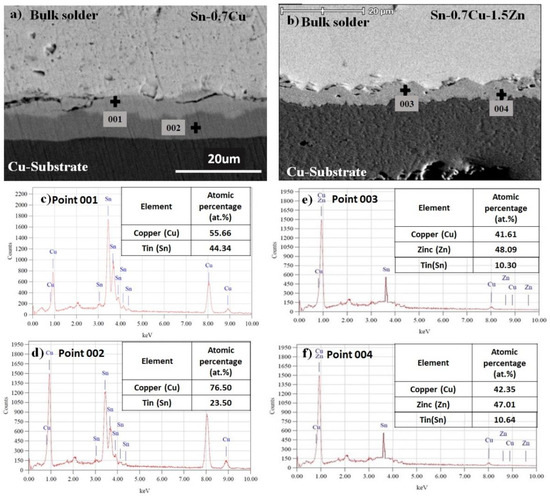
Figure 6.
EDX point analysis at interfacial IMC of (a) Sn-0.7Cu alloys and (b) Sn-0.7Cu-1.5Zn alloy after annealing at 180 °C for 240 h. (c): Cu6Sn5 (d): Cu3Sn (e) Cu-Zn (f) Cu-Zn.
Voids were found to have formed in the Sn-0.7Cu-1.5Zn after being annealed for 240 h, which were determined to be Kirkendall voids formed in the Sn-based solder. It is known that Kirkendall voids form due to unbalanced diffusion at interfaces [14]. These voids might weaken the solder joints’ mechanical properties by decreasing the joining interface area.
Figure 6c,d shows the EDX spot points at the interfacial IMC of the Sn-0.7Cu after annealing at 180 °C for 240 h. 001 spotted points were located near the bulk solder, while 002 was spotted near the Cu substrate. It can be seen that point 001 is the Cu6Sn5 IMC layer, while the 002 spot is the Cu3Sn IMC layer. Figure 6e,f show the EDX spot point 003 and 004 showing the Sn-0.7Cu-1.5Zn containing the mainly Cu-Zn IMC layer. No Cu3Sn IMC layers were detectable.
3.2. Interfacial IMC and Activation Energy
Figure 7, Figure 8, Figure 9 and Figure 10 show the Sn-0.7Cu solder alloy’s interfacial microstructure growths with different Zn additions (0 wt.%, 0.5 wt.%, 1.0 wt.% and 1.5 wt.%) joint samples after being annealed at 180 °C. The interfacial layer commonly consists of two parallel layers: Cu6Sn5 and Cu3Sn. The former was formed during soldering and grew via the inter-diffusion of Cu and Sn and reactions with each other, while the latter forms and grow via reactions between the Cu substrate and the Cu6Sn5 IMC layer [15]. For the Sn-0.7Cu solder joint, it can be seen that the interfacial IMC layers are mainly composed of Cu6Sn5 with a round scallop-type morphology and that the Cu3Sn layers are too thin to be objectively observed. After the reflow process, the interfacial Cu6Sn5 layer appears in the solder joints in the scallop-like morphology and gradually changed to planar-like morphology after the annealing process. The IMC layer thickness increases significantly, and the Cu3Sn phase form when annealing longer, as per Figure 7b–d. Figure 8, Figure 9 and Figure 10 show the interfacial microstructure evolution of the Sn-0.7Cu with the addition of 0.5 wt, 1.0 wt.%, and 1.5 wt.% Zn. The morphology of the IMC formed in each sample (addition of Zn) seemed similar. However, after the annealing process, no Cu3Sn phase is detected, as seen in Figure 9 and Figure 10.
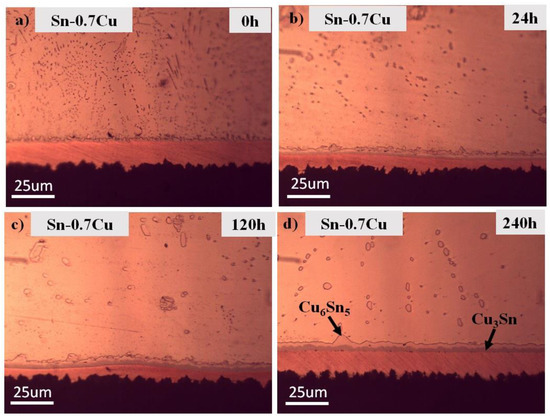
Figure 7.
Microstructure of Interfacial IMC of Sn-0.7Cu after annealing at (a) 0 h, (b) 24 h, (c) 120 h and (d) 240 h at 180 °C.
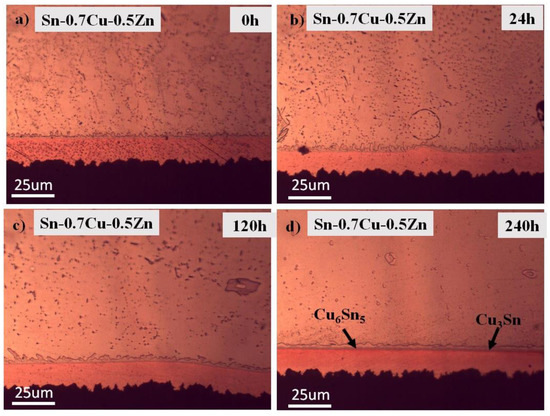
Figure 8.
Microstructure of Interfacial IMC of Sn-0.7Cu-0.5Zn after annealing at (a) 0 h, (b) 24 h, (c) 120 h and (d) 240 h at 180 °C.
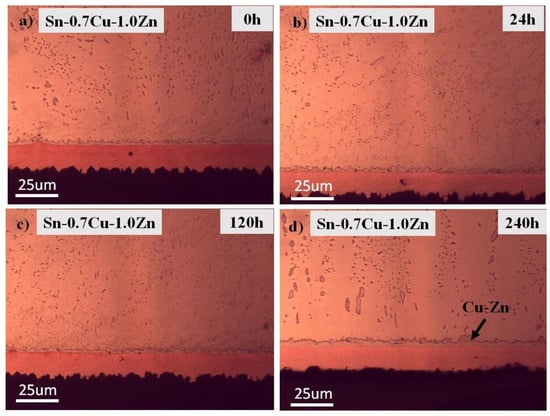
Figure 9.
Microstructure of Interfacial IMC of Sn-0.7Cu-1.0Zn after annealing at (a) 0 h, (b) 24 h, (c) 120 h and (d) 240 h at 180 °C.
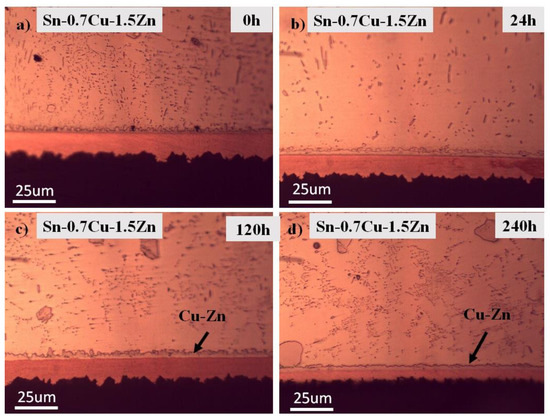
Figure 10.
Microstructure of Interfacial IMC of Sn-0.7Cu-1.5Zn after annealing at (a) 0 h, (b) 24 h, (c) 120 h and (d) 240 h at 180 °C.
The interfacial IMC thicknesses for each solder is increases with the annealing time [16]. The relationship between the interfacial IMC thickness and annealing time with the addition of different amounts of Zn into Sn-0.7Cu is plotted and shown in Figure 11. The interfacial IMC can be divided into two types in the Sn-0.7Cu/Cu: the Cu6Sn5 phase that would grow first at the interface during soldering, and the Cu3Sn phase that grows after the diffusion process in the solder joint [17]. In solid-state annealing, the solubility and diffusivity of Cu in Sn are much lower than those in the molten solder; hence, the rate of IMC growth is much slower, which is even more pronounced when the IMC layer becomes a diffusion barrier [15]. The growth rate for different phases differs based on its respective service conditions. Chen et al. [17] pointed out that the growth rate of Cu6Sn5 is lower than that of Cu3Sn under isothermal annealing conditions. Additionally, the excessive growth of the IMC layer can degrade the solder joints’ reliability. Shen et al. [18] posited that the IMC layer increases with annealing time due to solid-state diffusion between Cu atoms from the Cu-pad and Sn from the bulk solder.
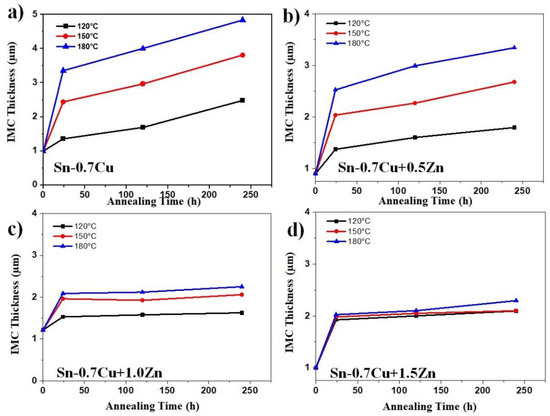
Figure 11.
Effect of annealing on IMC thickness occurred at the interface of (a) Sn-0.7Cu, (b) Sn-0.7Cu-0.5Zn, (c) Sn-0.7Cu-1.0Zn, and (d) Sn-0.7Cu-1.5Zn.
In the Sn-0.7Cu-xZn/Cu, the addition of 1.0 wt.% and 1.5 wt.% Zn in Sn-0.7Cu effectively changed the interfacial IMC phase Cu-Zn and suppressed the growth of Cu3Sn during thermal annealing. It has been reported that the mixture of Cu6Sn5 and Cu-Zn could form in the interfacial IMC. However, in our study, we could not see the Cu6Sn5 intermetallic, this is maybe because Cu6Sn5 phase is too thin to be observed. Additionally, based on the thermodynamic calculation, the addition of Zn into the Sn–0.7Cu solder alloy transforms the IMC phase from Cu6Sn5 into Cu-Zn when the additive Zn concentration exceeds 0.35 and 0.8 wt.% in Sn–Bi and Sn–0.7Cu solders, respectively. Wang et al. [9] also inferred that Cu6Sn5 is the first IMC formed between Sn-Cu-Zn and Cu, as the Zn content is <0.88%. However, at Zn content >0.88%, the first IMC formed during wetting reaction will be Cu-Zn. The results shown in Figure 8 indicates that the first IMC of Sn-0.7Cu-1.5Zn on Cu-substrate during wetting reaction should be the Cu-Zn phase instead of Cu6Sn5. Yu et al. posited that the diffusivity of Sn in the Cu-Sn alloy could be described by DSn = 1.90 × 10⁻¹⁰ cm2 s−1 and the diffusivity of Zn in the Cu–Zn alloy could be described by DZn = 2.70 × 10⁻¹⁰ cm2 s−1 at 300 °C [19], which goes to show that at 300 °C (molten state), the diffusivity of DZn > DSn, explaining the formation of Cu-Zn phase instead of the Cu6Sn5 compound during the soldering process. The Gibbs free energy of Cu-Zn formation is much lower than that of the Cu6Sn5 and Cu3Sn phases, making it structurally stabler. The Gibbs free energy of the Cu-Zn formation is ΔG = −12.34 kJ/mol, which is much lower than that of the Cu3Sn (ΔG = −7.78 kJ/mol) and Cu6Sn5 (ΔG = −7.42 kJ/mol) [20]. Therefore, instead of Cu6Sn5 and Cu3Sn, the Cu-Zn intermetallic phase was formed due to the large magnitude of its Gibbs’ free energy.
According to Hamada et al. [20], a minor addition of Zn can suppress the growth of IMC in the Sn-Ag-Cu solder joint, while Zeng et al. reported that the presence of small amounts of Ni and Zn (0.15 wt.%) could suppress the growth of Cu3Sn in the interfacial layer, resulting in a more stable interfacial layer of Cu6Sn5 inhibiting the polymorphic phase transformation of Cu6Sn5 [21]. They also reported that Zn, as an individual addition, suppressed the growth of Cu3Sn in a similar manner to Ni when Zn’s concentration reached 0.4 wt.%. It has recently been reported that dissolving Zn into Cu6Sn5 helps suppress the growth of IMCs during annealing, which results in a more stable interfacial IMC layer [22].
During device operations, the soldered joint is subject to solid-state annealing conditions. The existing IMC in the solid joint will continue to grow via solid-state diffusion under such thermal conditions. Figure 12a–d show the relationship between the IMCs’ layer thickness and the annealing time of Sn-0.7Cu-xZn at various annealing temperatures. Usually, the isothermal growth kinetics of the intermetallic layer can be expressed using an empirical power law:
where X is the full thickness of the IMC at time t, while D and t indicate the respective constant the growth rate and annealing time, respectively. The straight-line slope is and the growth rate can be determined from a linear regression analysis of X vs. .
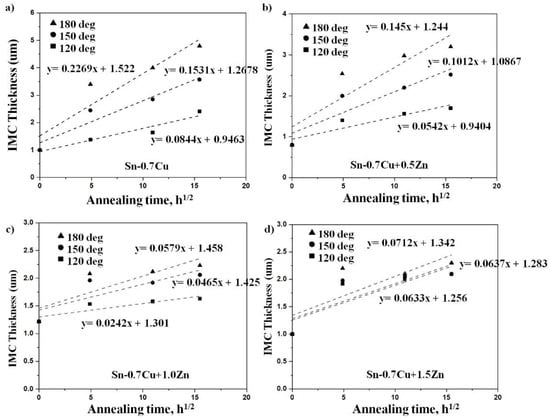
Figure 12.
Relationship between interfacial IMC layer thickness with annealing time for (a) Sn-0.7Cu, (b) Sn-0.7Cu-0.5Zn, (c) Sn-0.7Cu-1.0Zn, and (d) Sn-0.7Cu-1.5Zn.
The growth activation energies can be attained from the growth kinetics curve. The following Arrhenius relationship is frequently used to calculate the activation energy for a layer growth:
where k is the inter-diffusion coefficient, k0 is the constant temperature-independent value, Q is the diffusion activation energy, R is the gas constant, and T is the absolute temperature value. The activation energy can be calculated by taking the natural logarithm of the plot shown in Figure 13, as per Equation (3).
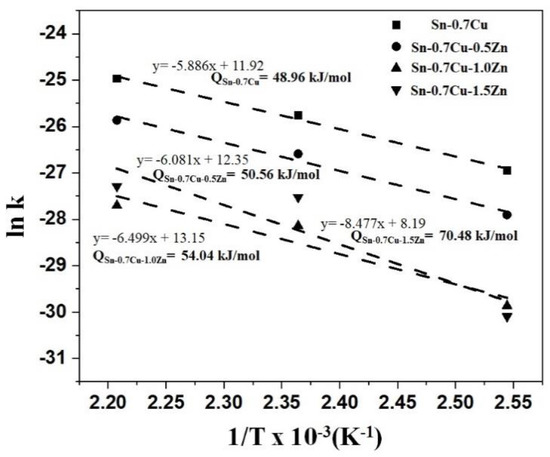
Figure 13.
Arrhenius plots of ln k vs. 1/T for the IMC growth kinetics for Sn-0.7Cu-xZn.
Figure 13 shows the Arrhenius plots for the IMC layer growth of the Sn-0.7Cu with Zn. The activation energy for the IMC growth during annealing is estimated to be 48.96 kJ mol−1 for Sn-0.7Cu, and the addition of 0.5 wt.% Zn into Sn-0.7Cu solder is estimated to increase the activation energy to 50.56 kJ mol−1. However, the addition of 1.0 wt.% and 1.5 wt.% resulted in much higher activation energy, which is 54.04 kJ mol−1 and 70.48 kJ mol−1, respectively. The thickness of the IMCs is correlated with activation energy. For solders with higher activation energies, their IMC thickness was lower than solders with lower activation energy, which can be attributed to the fact that IMC requires more energy to grow.
The lower activation energy in the lower temperature range means that the grain boundary diffusion controls growth, while the higher activation energy at a higher temperature range can be attributed to bulk diffusion via the IMC layer. Generally, solder alloys with high activation energies are expected to grow slower at low temperatures and faster at high temperatures, relative to the lower activation energy. Additionally, the addition of 1.0 wt.% and 1.5 wt.% Zn into Sn-0.7Cu changed the IMC from Cu6Sn5 into Cu-Zn, which is why the activation energy of Sn-0.7Cu-1.0Zn and Sn-0.7Cu-1.5Zn is higher than that of the Sn-0.7Cu solder alloy. In this work, Cu-Zn is formed because of the larger driving force compared to Cu6Sn5. Then, the diffusion process will occur during annealing, and we found greater diffusion of Cu in Cu-Zn compared to in Cu6Sn5 due to the higher activation energy of Cu-Zn phase. Wang et al. [23] reported that with the addition of 1.0 wt.% Zn, the interface IMC composition changed completely from Cu-Sn IMC to Cu-Zn IMC. Wang et al. [6] investigated the interfacial IMC formation between SAC305-1.0Zn solder alloy and Cu-substrate during soldering and isothermal annealing at 150 °C and 175 °C for 5–28 days and found that both Cu6Sn5 and Cu3Sn layers thickened with increasing annealing time. The Cu6Sn5 phase is typically formed above the solder’s melting point, while the Cu3Sn phase is generally produced during low-temperature thermal annealing (100 °C to 175 °C) via diffusion between Cu and Cu6Sn5 [24].
3.3. Mechanical Properties
Microhardness tests were conducted to elucidate changes in the mechanical properties induced by microstructural changes. Figure 14 shows the average microhardness after the annealing process at 180 °C. The result shows that the Sn-0.7Cu solder alloy decreased gradually with increasing annealing times. In the case of the Sn-0.7Cu containing 0.5 wt.% of Zn, the microhardness decreases after being annealed at 180 °C for 24 h. After an annealing time of 120 h, the solder containing 0.5 wt.% of Zn showed a slight decrease in its microhardness. Finally, when the annealing time increased to 240 h, the microhardness of Sn-0.7Cu-0.5Zn decreased after the annealing process. The same trend was observed with the addition of 1.0 wt.% and 1.5 wt.% Zn in the Sn-0.7Cu solder alloy.
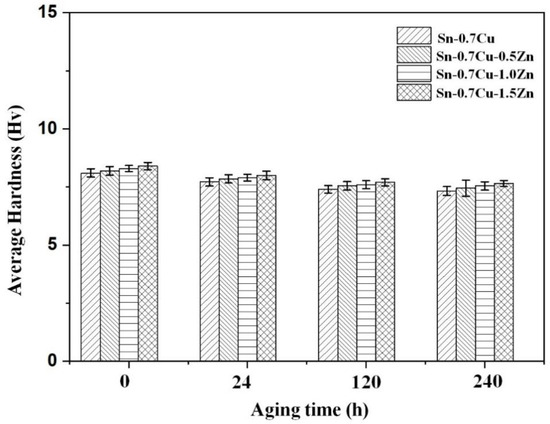
Figure 14.
Average hardness after thermal annealing at 180 °C.
The addition of Zn into Sn-0.7Cu solder alloy resulted in the phase Cu-Zn primary intermetallic (IMCs) forming after the reflow process, and when the annealing time increased, the Cu-Zn phase continues to grow. However, with addition of Zn, it did not significantly influence the microhardness of Sn-0.7Cu solder alloy. Though the addition of Zn did not affect the microhardness directly, the addition of 1.5 wt.% Zn can decrease the size of the β-Sn dendrites in the bulk solder, and increasing annealing time may change the existing area of the phase [25].
The shear tests were conducted to elucidate the mechanical properties of the solder joints. The samples were annealed at 180 °C for 24 h, 120 h, and 240 h. The shear strengths of the joints after thermal annealing are shown in Figure 15. Generally, the shear strength of the Sn-0.7Cu alloy decreases with extended annealing times. When a small amount of Zn was added, the shear strength of Sn-0.7Cu-0.5Zn solder alloy slightly decreased relative to that of the Sn-0.7Cu alloy. However, after annealing for 24 h, the solder containing 0.5 wt.% Zn showed a slightly improved shear strength. Then, after increasing the annealing time to 120 h and 240 h, the shear strengths of the solder alloys with Zn additions of 0.5 wt.%, 1.0 wt.%, and 1.5 wt.% slightly decreased. The decreased shear strengths due to Zn’s addition can be attributed to the formation of the Cu-Zn phase after the reflow process. Usually, the Sn-0.7Cu-xZn react with the Cu substrate and forms the Cu-Zn interfacial IMC, and it is expected that the phase Cu-Zn primary intermetallic decrease the strength, as per Ng et al. [26]. As pointed out previously, the microstructures of the Sn-0.7Cu-xZn were more stable than those of the Sn-0.7Cu solders during thermal annealing. The IMC particles’ substantial growth was also significantly suppressed due to Zn’s addition to the Sn-0.7Cu solders. These stable mechanical properties in the Zn-doped solders during thermal annealing can be attributed to the Cu-Zn phase. The decrease in strength of the Sn-0.7Cu alloy after annealing attributed to the fact that annealing coarsens the Cu6Sn5 IMC, which decreases their ability to block dislocation movements, and that the β-Sn phase coarsens/grows during annealing, which reduces the overall strength of the alloy.
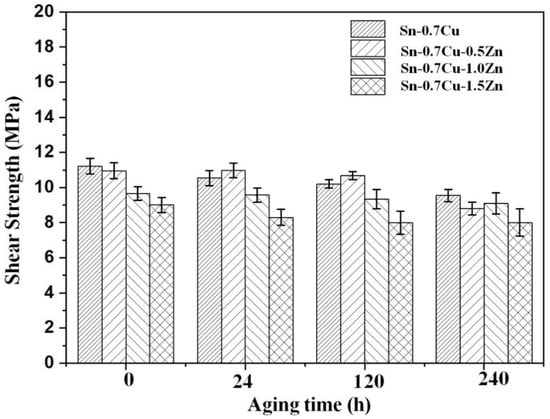
Figure 15.
Shear strength after thermal annealing at 180 °C.
3.4. Shear Fracture Surface Morphology
The sheared samples’ fractography was imaged using SEM to further elucidate the shear behaviours of Sn-0.7Cu solder joints under Zn’s influence. Figure 16 shows the shear fracture morphology of Sn-0.7Cu-xZn alloys (0 wt.%, 0.5 wt.%, 1.0 wt.%, and 1.5 wt.%) before and after the annealing process at 180 °C. A ductile shear mode is evident on the fracture surface when annealed at 0 h, as per Figure 16a. However, after the sample was annealed for 240 h, its microstructure transforms into a mixture of brittle fracture modes, with a small dimpled and cleaved pattern, as shown in Figure 16b.
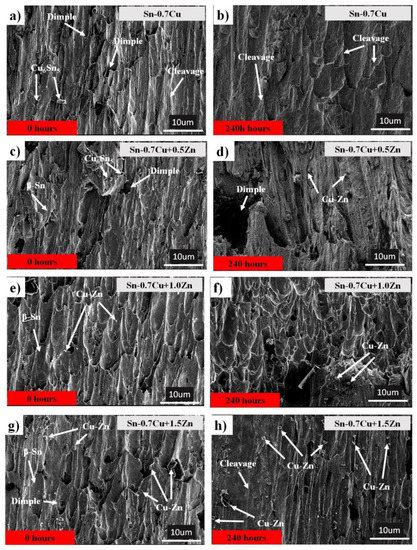
Figure 16.
Fractographies of (a,b) Sn-0.7Cu, (c,d) Sn-0.7Cu-0.5Zn, (e,f) Sn-0.7Cu-1.0Zn and, (g,h) Sn-0.7Cu-1.5Zn.
In the case of the Sn-0.7Cu-0.5Zn solder joint, after being annealed for 240 h, a dimple can be seen, which is a featureless fracture typical of the failure mode. Usually, a brittle fracture will occur in the shear samples when annealed at 180 °C. It is shown that the ductile fracture occurred in the bulk solder region, while a mixture and brittle fractures occurred in the region near the solder/intermetallic interface (Cu6Sn5 phase). Therefore, the strength adjacent to the solder/IMC interface is weak, decreasing shear strength with annealing time. Numerous studies indicate that excessive growth of IMC might promote brittle behaviour thus weakening the solder joint strength, and hence affect the long term solder joint reliability [27,28]. In the case of the Sn-0.7Cu-1.0Zn and Sn-0.7Cu-1.5Zn alloys, the brittle regions on the fracture surface can be attributed to the presence of particles and are directly correlated with the presence of primary Cu-Zn IMCs in the microstructure of the Sn-0.7Cu alloy, containing 1.0 wt.% and 1.5 wt.% of Zn before annealing, as can be seen in Figure 16e,g. When the annealing time increased to 240 h, more Cu-Zn phase can be found, and the fracture mode becomes more brittle, as shown in Figure 16f,h.
4. Conclusions
This study elucidated the effect of isothermal annealing on the primary and interfacial IMCs of Sn-0.7Cu solder with the addition of Zn. The mechanical properties have also been elucidated post-annealing for the Sn-0.7Cu-xZn solder alloys. The conclusions garnered from this work are listed below:
- The addition of Zn into Sn-0.7Cu decreases the area fraction of the eutectic Cu6Sn5 as it is reflowed and continued decreasing as it undergoes further annealing process. However, the addition of 1.0 wt.% and 1.5 wt.% of Zn maintained the area eutectic of Cu6Sn5 even after completing the annealing process.
- Zn’s minor addition significantly suppressed the growth of the interfacial IMC after the reflow and annealing process.
- The interfacial IMC layer of the as-reflowed Sn-0.7Cu was determined to be Cu6Sn5, and with the addition of 1.0 wt.% of Zn, changed to the Cu-Zn phase as-reflowed and after the annealing process.
- The activation energy for the intermetallic layers’ growth was determined to be 48.96 kJ mol−1 and 70.48 kJ mol−1 for the Sn-0.7Cu system and Sn-0.7Cu-1.5Zn systems, respectively.
- The addition of Zn increases the hardness of Sn-0.7Cu but will decrease the hardness after the annealing process. The shear strength of the Sn-0.7Cu alloys decreases with addition of Zn and continue to decrease after annealing process due to the increased presence of the Cu-Zn phase, leading to increased brittleness.
Author Contributions
Conceptualisation, methodology and writing, M.I.I.R.; original draft preparation, supervision and resources, M.A.A.M.S.; methodology, formal analysis and investigation, R.M.S.; review and editing, M.M.A.B.A.; D.S.C.H.; N.S. and M.N. All authors have read and agreed to the published version of the manuscript.
Funding
Neutron tomography studies of geopolymer ceramic used for reinforcement materials in solder alloy for a robust electric/electronic solder joint under reference No: JPT.S (BPKI)2000/016/018/019(29).
Institutional Review Board Statement
Not applicable.
Informed Consent Statement
Not applicable.
Data Availability Statement
The data presented in this study are available in this article.
Acknowledgments
The authors gratefully acknowledge the financial support from Ministry of Higher Education, Malaysia on Project use of ISIS Neutron and Muon Source.
Conflicts of Interest
The authors declare no conflict of interest.
References
- Said, R.M.; Salleh, M.A.A.M.; Derman, M.N.; Ramli, M.I.I.; Nasir, N.M.; Saud, N. Isothermal Aging Affect to the Growth of Sn-Cu-Ni-1 wt.% TiO2 Composite Solder Paste. Key Eng. Mater. 2016, 700, 123–131. [Google Scholar] [CrossRef]
- Çadırlı, E.; Böyük, U.; Engin, S.; Kaya HA SA, N.; Maraşlı, N.; Arı, M. Investigation of microhardness and thermo-electrical properties in the Sn–Cu hypereutectic alloy. J. Mater. Sci. Mater. Electron. 2010, 21, 468–474. [Google Scholar] [CrossRef]
- Mayappan, R.; Ahmad, Z.A. Effect of Bi addition on the activation energy for the growth of Cu5Zn8 intermetallic in the Sn–Zn lead-free solder. Intermetallics 2010, 18, 730–735. [Google Scholar] [CrossRef]
- Zhao, J.; Qi, L.; Wang, X.-M.; Wang, L. Influence of Bi on microstructures evolution and mechanical properties in Sn–Ag–Cu lead-free solder. J. Alloy. Compd. 2004, 375, 196–201. [Google Scholar] [CrossRef]
- Chou, C.Y.; Chen, S.W. Phase equilibria of the Sn–Zn–Cu ternary system. Acta Mater. 2006, 54, 2393–2400. [Google Scholar] [CrossRef]
- Wang, F.J.; Yu, Z.S.; Qi, K. Intermetallic compound formation at Sn–3.0 Ag–0.5 Cu–1.0 Zn lead-free solder alloy/Cu interface during as-soldered and as-aged conditions. J. Alloy. Compd. 2007, 438, 110–115. [Google Scholar] [CrossRef]
- Siahaan, E.; Soegijono, B. The Effect of Zinc Composition in Melting Point and Microstructure of Lead-Free Solder. Int. J. Basic Appl. Sci. 2014, 14, 17–20. [Google Scholar]
- De Sousa, I.; Henderson, D.W.; Patry, L.; Kang, S.; Shih, D.-Y. The Influence of Low Level Doping on the Thermal Evolution of SAC Alloy Solder Joints with Cu Pad Structures. In Proceedings of the 56th Electronic Components and Technology Conference 2006, San Diego, CA, USA, 30 May–2 June 2006; p. 8. [Google Scholar]
- Wang, H.; Wang, F.; Gao, F.; Ma, X.; Qian, Y. Reactive wetting of Sn0. 7Cu–xZn lead-free solders on Cu substrate. J. Alloy. Compd. 2007, 433, 302–305. [Google Scholar] [CrossRef]
- Gao, Y.; Hui, J.; Sun, X.; Zhao, F.; Zhao, J.; Cheng, C.; Luo, Z.; Wang, L. Role of Zinc on Shear Property Evolution between Sn-0.7Cu Solder and Joints. Procedia Eng. 2011, 16, 807–811. [Google Scholar] [CrossRef]
- Tian, Y.; Zhang, R.; Hang, C.; Niu, L.; Wang, C. Relationship between morphologies and orientations of Cu6Sn5 grains in Sn3.0Ag0.5Cu solder joints on different Cu pads. Mater. Charact. 2014, 88, 58–68. [Google Scholar] [CrossRef]
- Wang, K.K.; Gan, D.; Hsieh, K.C. Orientation relationships, interfaces, and microstructure of η-Cu6Sn5 formed in the early-stage reaction between Cu and molten Sn. Thin Solid Film. 2010, 519, 1380–1386. [Google Scholar] [CrossRef]
- Cho, M.G.; Kang, S.K.; Seo, S.K.; Shih, D.Y.; Lee, H.M. Interfacial Reactions and Microstructures of Sn-0.7 Cu-x Zn Solders with Ni-P UBM During Thermal Aging. J. Electron. Mater. 2009, 38, 2242–2250. [Google Scholar] [CrossRef]
- Cai, C.; An, R.; Wang, C.; Tian, Y. Suppressing Kirkendall Void Density in Circuit Interconnections by Strain Annealing. arXiv 2017, arXiv:1712.06856. [Google Scholar]
- Zhang, L.; Xue, S.B.; Zeng, G.; Gao, L.L.; Ye, H. Interface reaction between SnAgCu/SnAgCuCe solders and Cu substrate subjected to thermal cycling and isothermal aging. J. Alloy. Compd. 2012, 510, 38–45. [Google Scholar] [CrossRef]
- Kim, D.-G.; Jung, S.-B. Interfacial reactions and growth kinetics for intermetallic compound layer between In–48Sn solder and bare Cu substrate. J. Alloy. Compd. 2005, 386, 151–156. [Google Scholar] [CrossRef]
- Shen, J.; Zhao, M.; He, P.; Pu, Y. Growth behaviors of intermetallic compounds at Sn–3Ag–0.5 Cu/Cu interface during isothermal and non-isothermal aging. J. Alloy. Compd. 2013, 574, 451–458. [Google Scholar] [CrossRef]
- Shen, J.; Cao, Z.; Zhai, D.; Zhao, M.; He, P. Effect of isothermal aging and low density current on intermetallic compound growth rate in lead-free solder interface. Microelectron. Reliab. 2014, 54, 252–258. [Google Scholar] [CrossRef]
- Yu, S.-P.; Hon, M.-H.; Wang, M.-C. The adhesion strength of A lead-free solder hot-dipped on copper substrate. J. Electron. Mater. 2000, 29, 237–243. [Google Scholar] [CrossRef]
- Hamada, N.; Uesugi, T.; Takigawa, Y.; Higashi, K. Effect of Addition of Small Amount of Zinc on Microstructural Evolution and Thermal Shock Behavior in Low-Ag Sn–Ag–Cu Solder Joints during Thermal Cycling. Mater. Trans. 2013, 54, 796–805. [Google Scholar] [CrossRef]
- Zeng, G.; McDonald, S.D.; Mu, D.; Terada, Y.; Yasuda, H.; Gu, Q.; Salleh, M.M.; Nogita, K. The influence of ageing on the stabilisation of interfacial (Cu,Ni)6(Sn,Zn)5 and (Cu,Au,Ni)6Sn5 intermetallics in Pb-free Ball Grid Array (BGA) solder joints. J. Alloy. Compd. 2016, 685, 471–482. [Google Scholar] [CrossRef]
- Zeng, G.; McDonald, S.D.; Gu, Q.; Terada, Y.; Uesugi, K.; Yasuda, H.; Nogita, K. The influence of Ni and Zn additions on microstructure and phase transformations in Sn–0.7 Cu/Cu solder joints. Acta Mater. 2015, 83, 357–371. [Google Scholar] [CrossRef]
- Wang, F.; Ma, X.; Qian, Y. Improvement of microstructure and interface structure of eutectic Sn–0.7 Cu solder with small amount of Zn addition. Scr. Mater. 2005, 53, 699–702. [Google Scholar] [CrossRef]
- Deng, X.; Sidhu, R.S.; Johnson, P.; Chawla, N. Influence of reflow and thermal aging on the shear strength and fracture behavior of Sn-3.5Ag solder/Cu joints. Met. Mater. Trans. A 2005, 36, 55–64. [Google Scholar] [CrossRef]
- Nur Nadirah, M.K.; Nurulakmal, M.S. Effect of Zn addition on bulk microstructure of lead-free solder SN100C. Am. Inst. Phys. Conf. Ser. 2017, 1901, 060005. [Google Scholar]
- Ng, W.; Zeng, G.; Nishimura, T.; Sweatman, K.; McDonald, S.D.; Nogita, K. The Beneficial Effect of Zn Additions on The Microstructure of SnCu and SnCuNi Solder Joints to Cu Substrates. In Proceedings of the International Conference on Electronic Packaging and iMAPS All Asia Conference (ICEP-IAAC), Kyoto, Japan, 14–17 April 2015; pp. 809–813. [Google Scholar]
- Hu, X.; Xu, T.; Keer, L.M.; Li, Y.; Jiang, X. Microstructure evolution and shear fracture behavior of aged Sn3Ag0.5Cu/Cu solder joints. Mater. Sci. Eng. A 2016, 673, 167–177. [Google Scholar] [CrossRef]
- Hu, X.; Xu, T.; Keer, L.M.; Li, Y.; Jiang, X. Shear strength and fracture behavior of reflowed Sn3.0Ag0.5Cu/Cu solder joints under various strain rates. J. Alloy. Compd. 2017, 690, 720–729. [Google Scholar] [CrossRef]


Publisher’s Note: MDPI stays neutral with regard to jurisdictional claims in published maps and institutional affiliations. |
© 2021 by the authors. Licensee MDPI, Basel, Switzerland. This article is an open access article distributed under the terms and conditions of the Creative Commons Attribution (CC BY) license (http://creativecommons.org/licenses/by/4.0/).