
Fe-X-B-Cu (X = Nb, NiZr) Alloys Produced by Mechanical Alloying: Influence of Milling Device


Abstract
1. Introduction
2. Materials and Methods
3. Results and Discussion
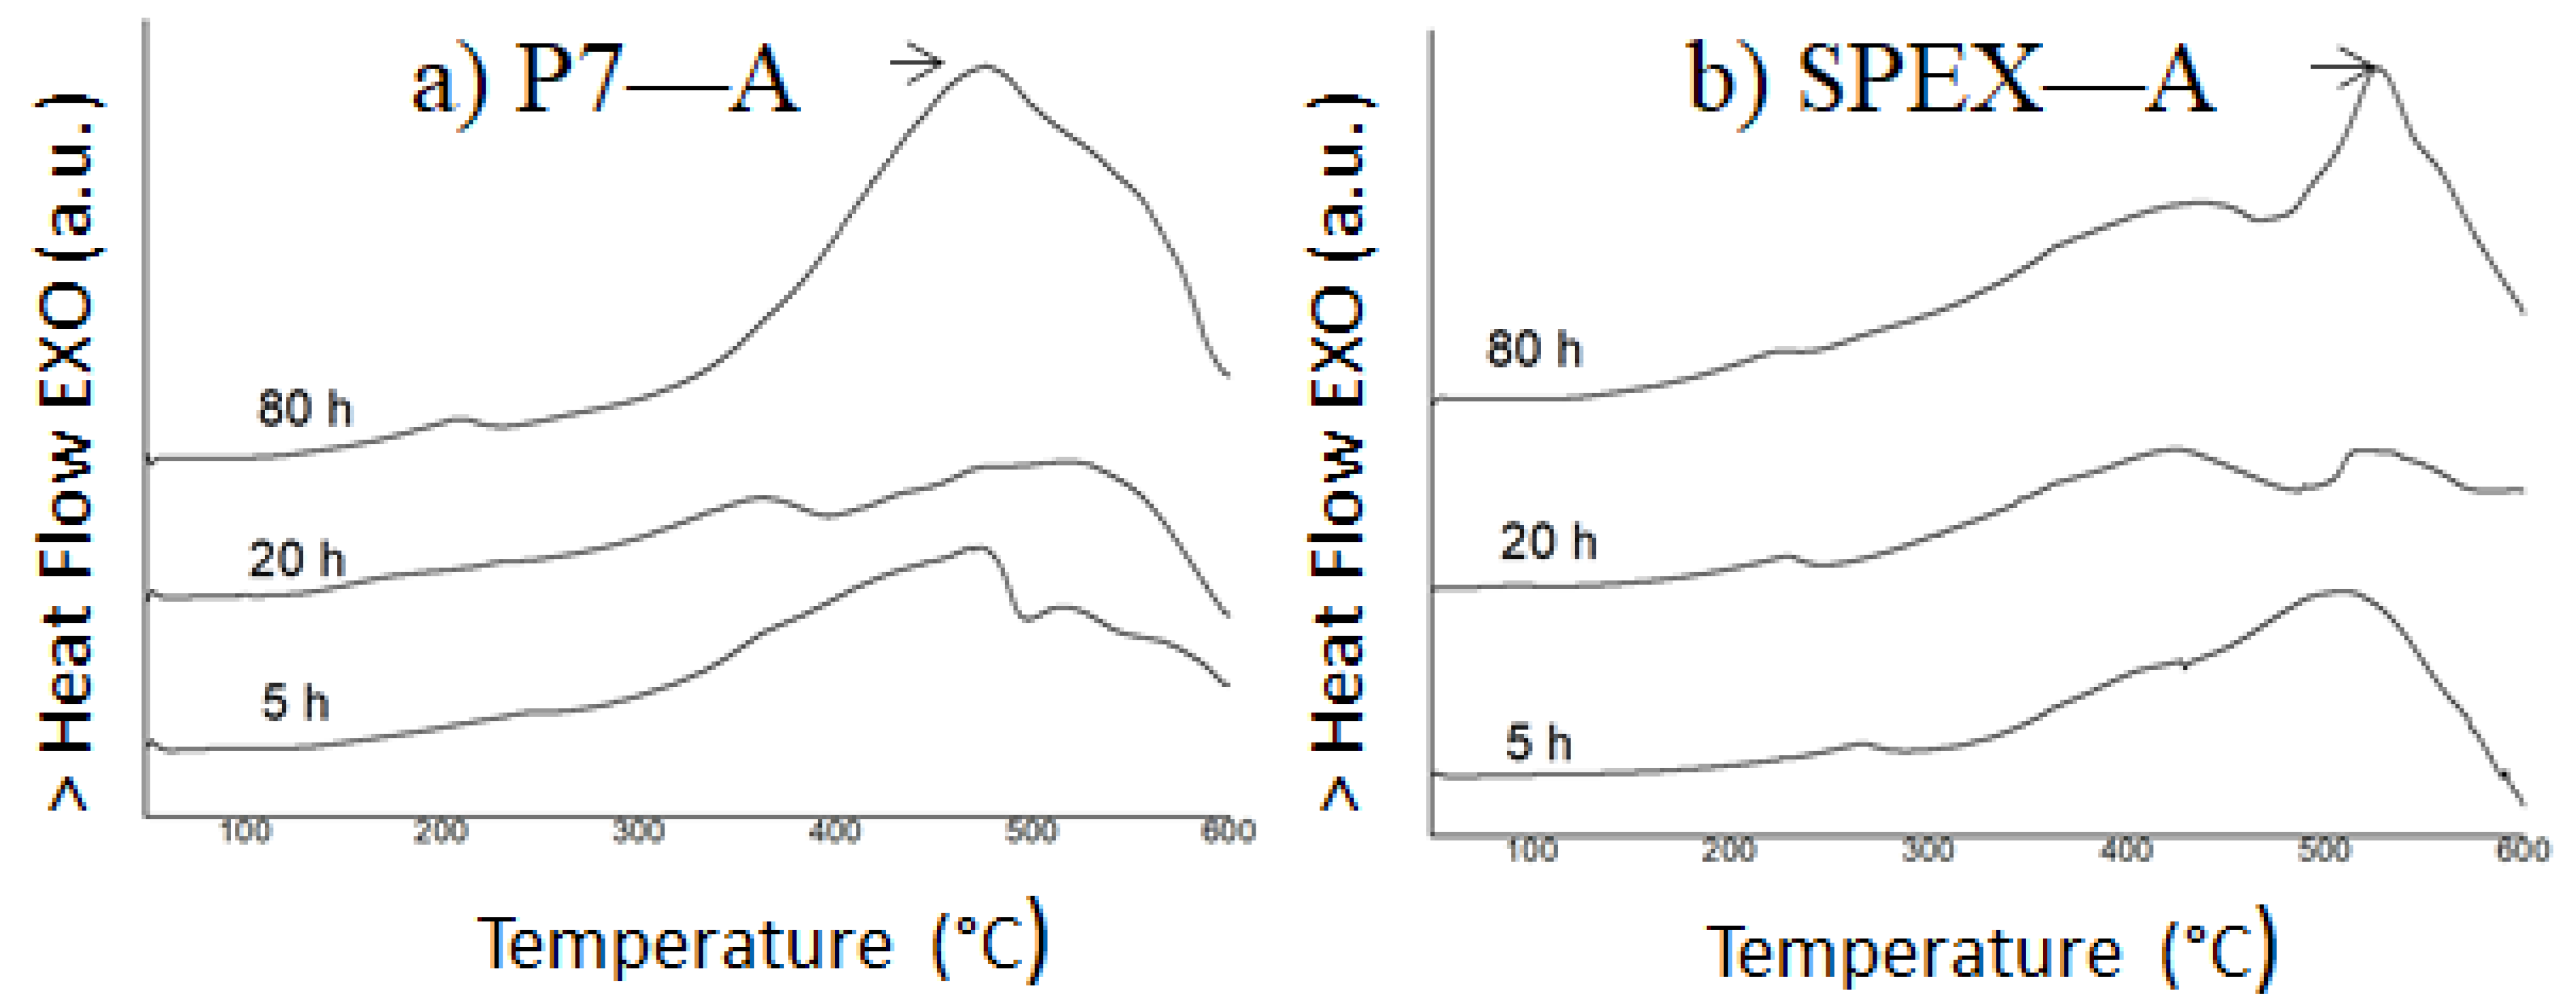
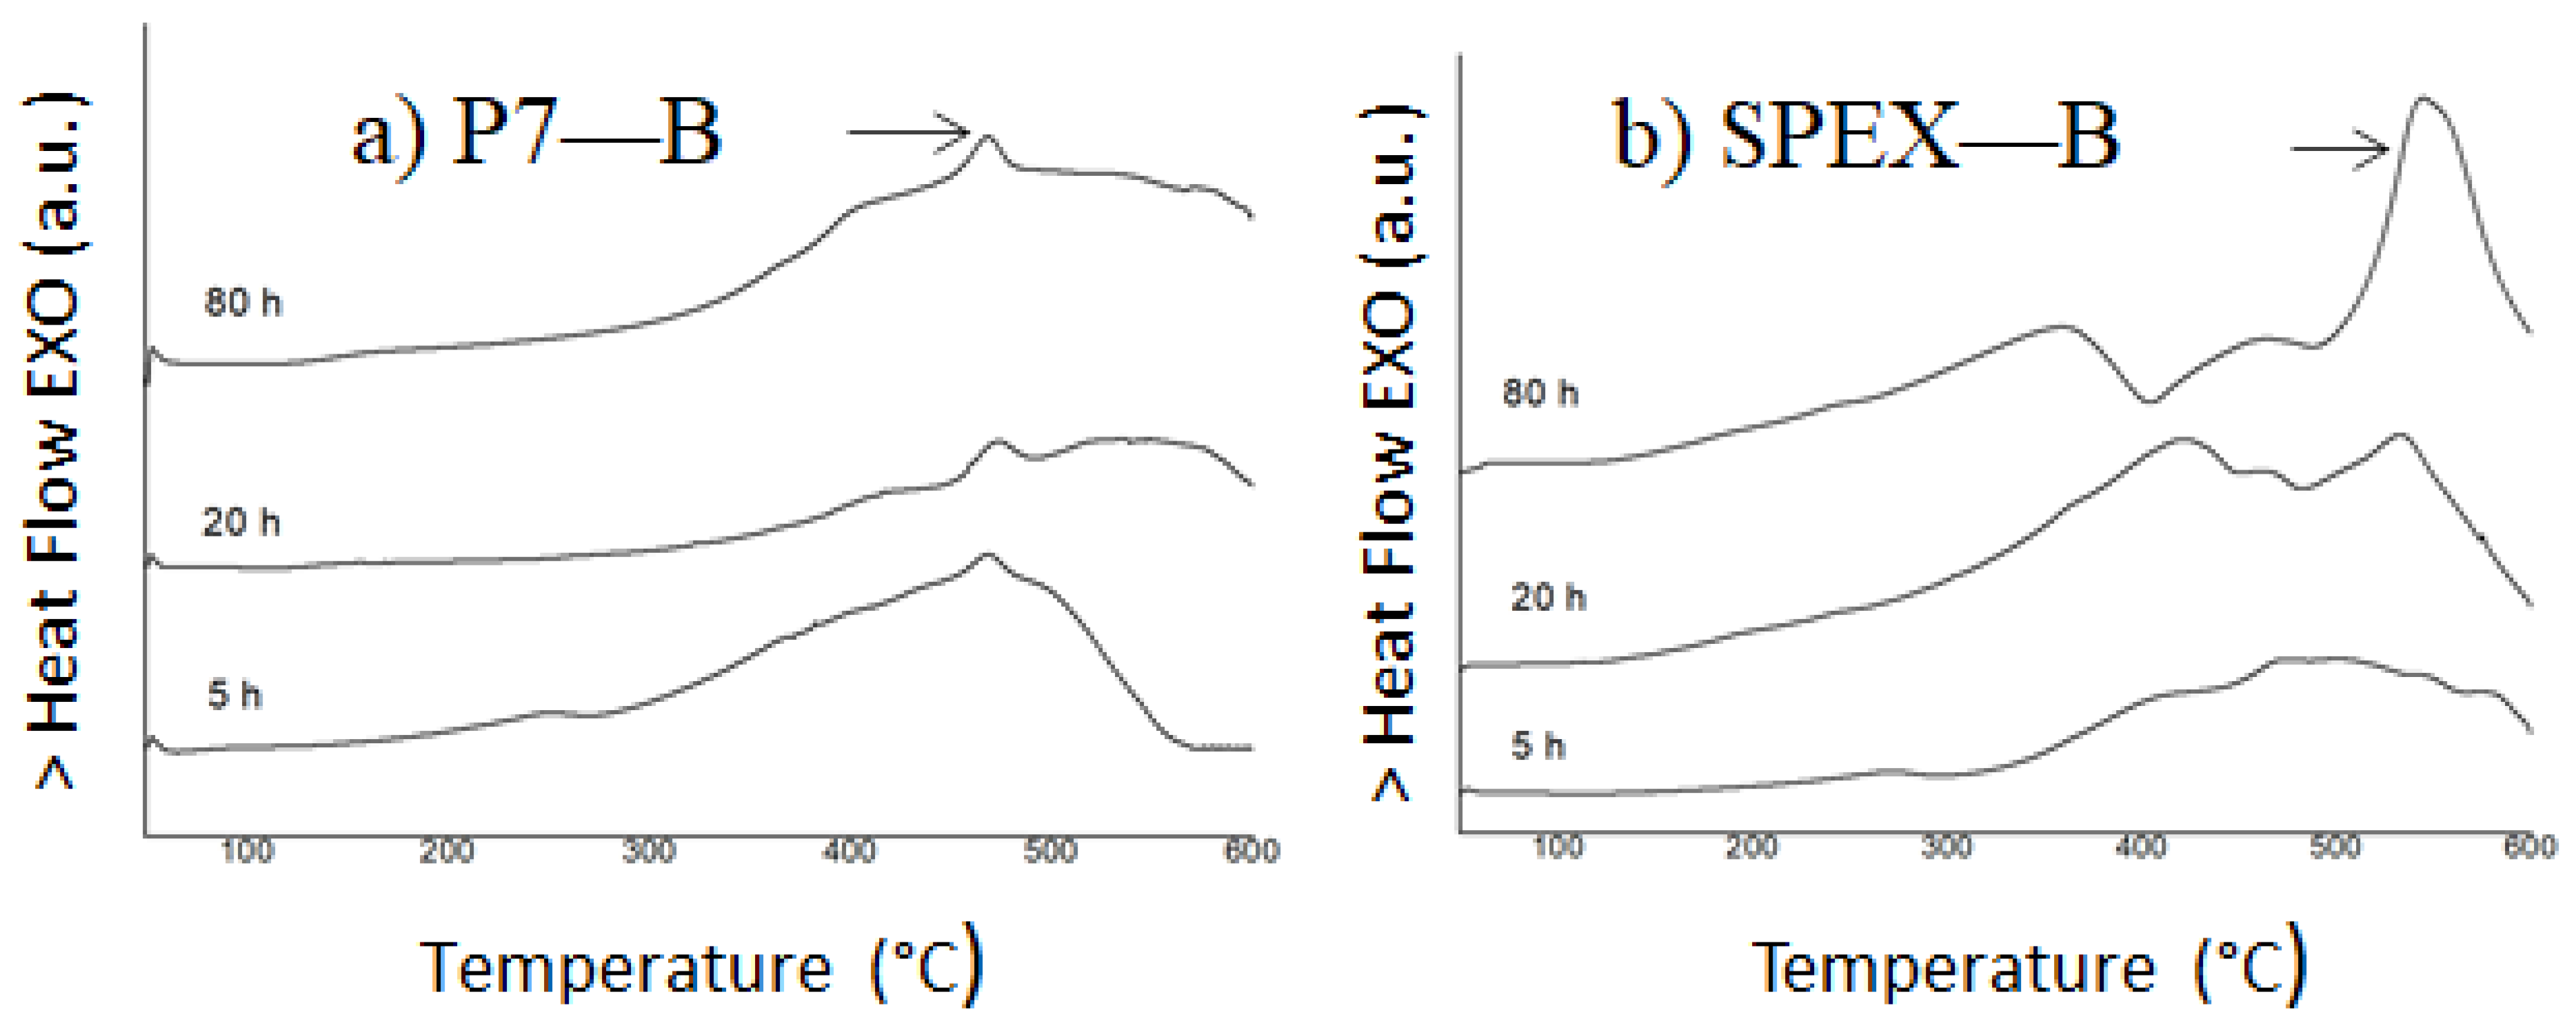
3.1. Microstructure and Thermal Analysis
3.2. Mills Comparison
- (a)
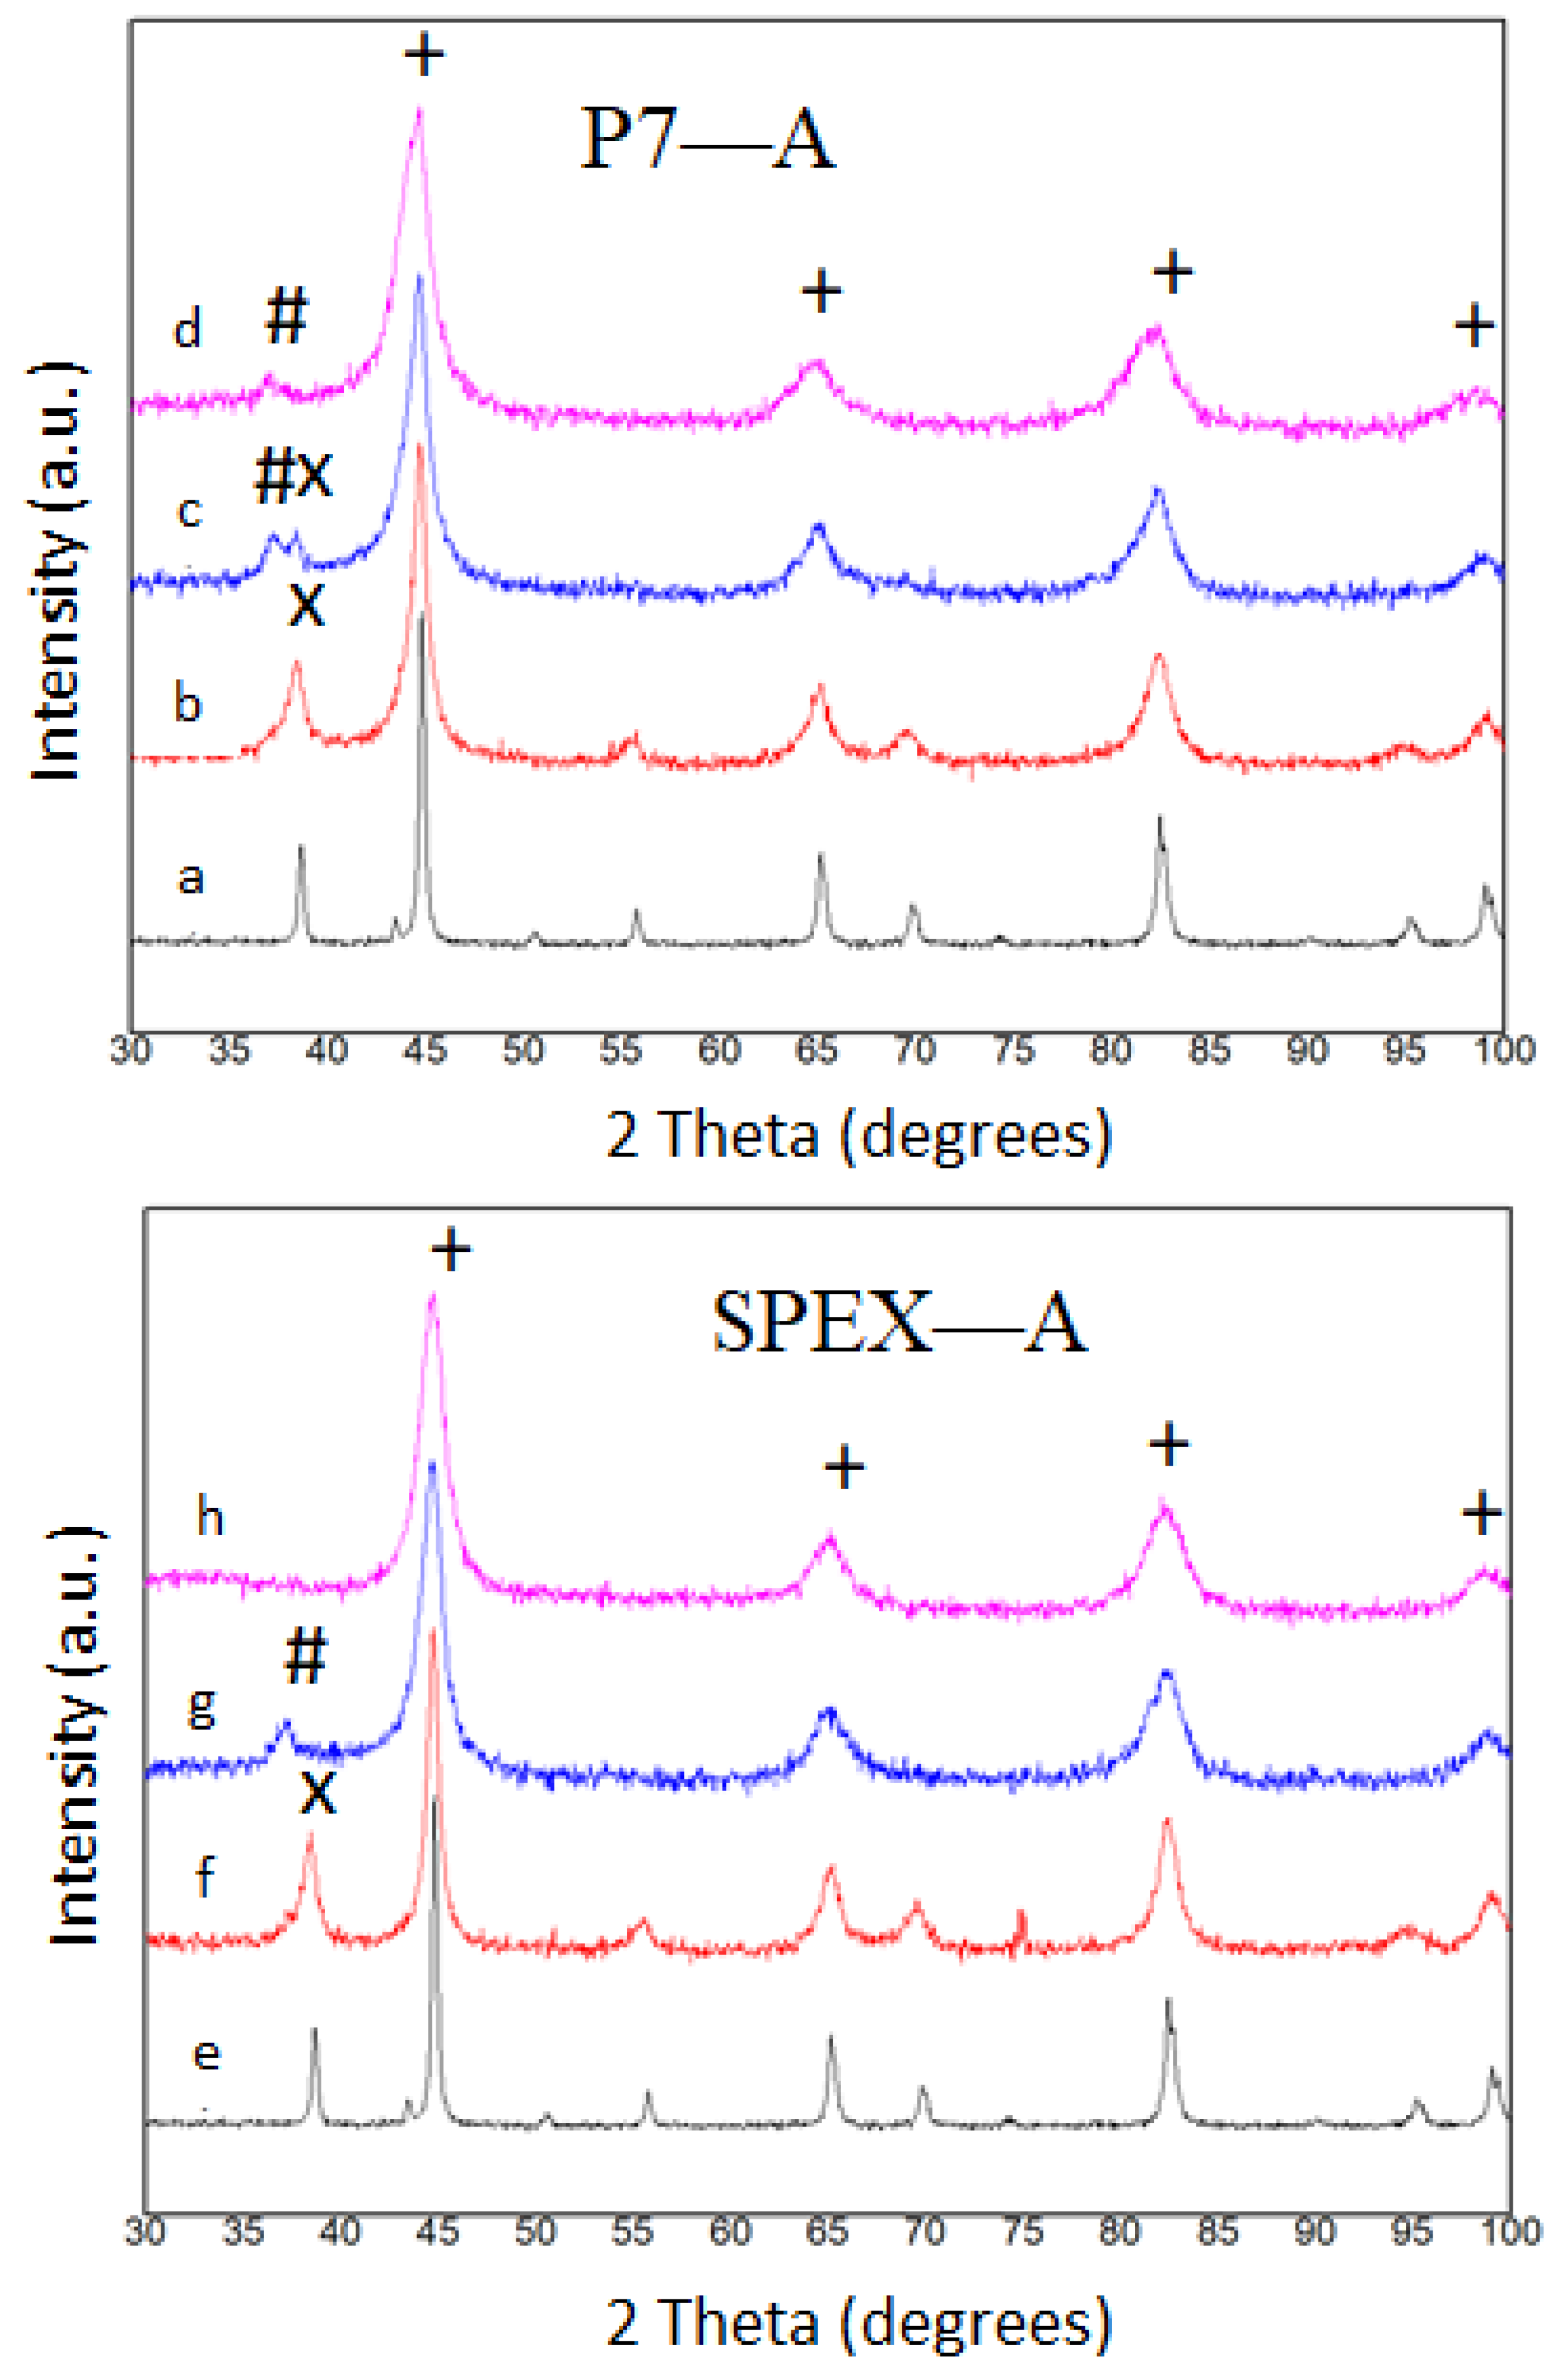
- In the composition with Nb milled in SPEX, only the Fe rich solid solution has been detected. Whereas, in the Nb alloy milled in P7, the major phase is the Fe rich bcc phase coexisting with a low amount of a Nb(B) phase.
- (b)
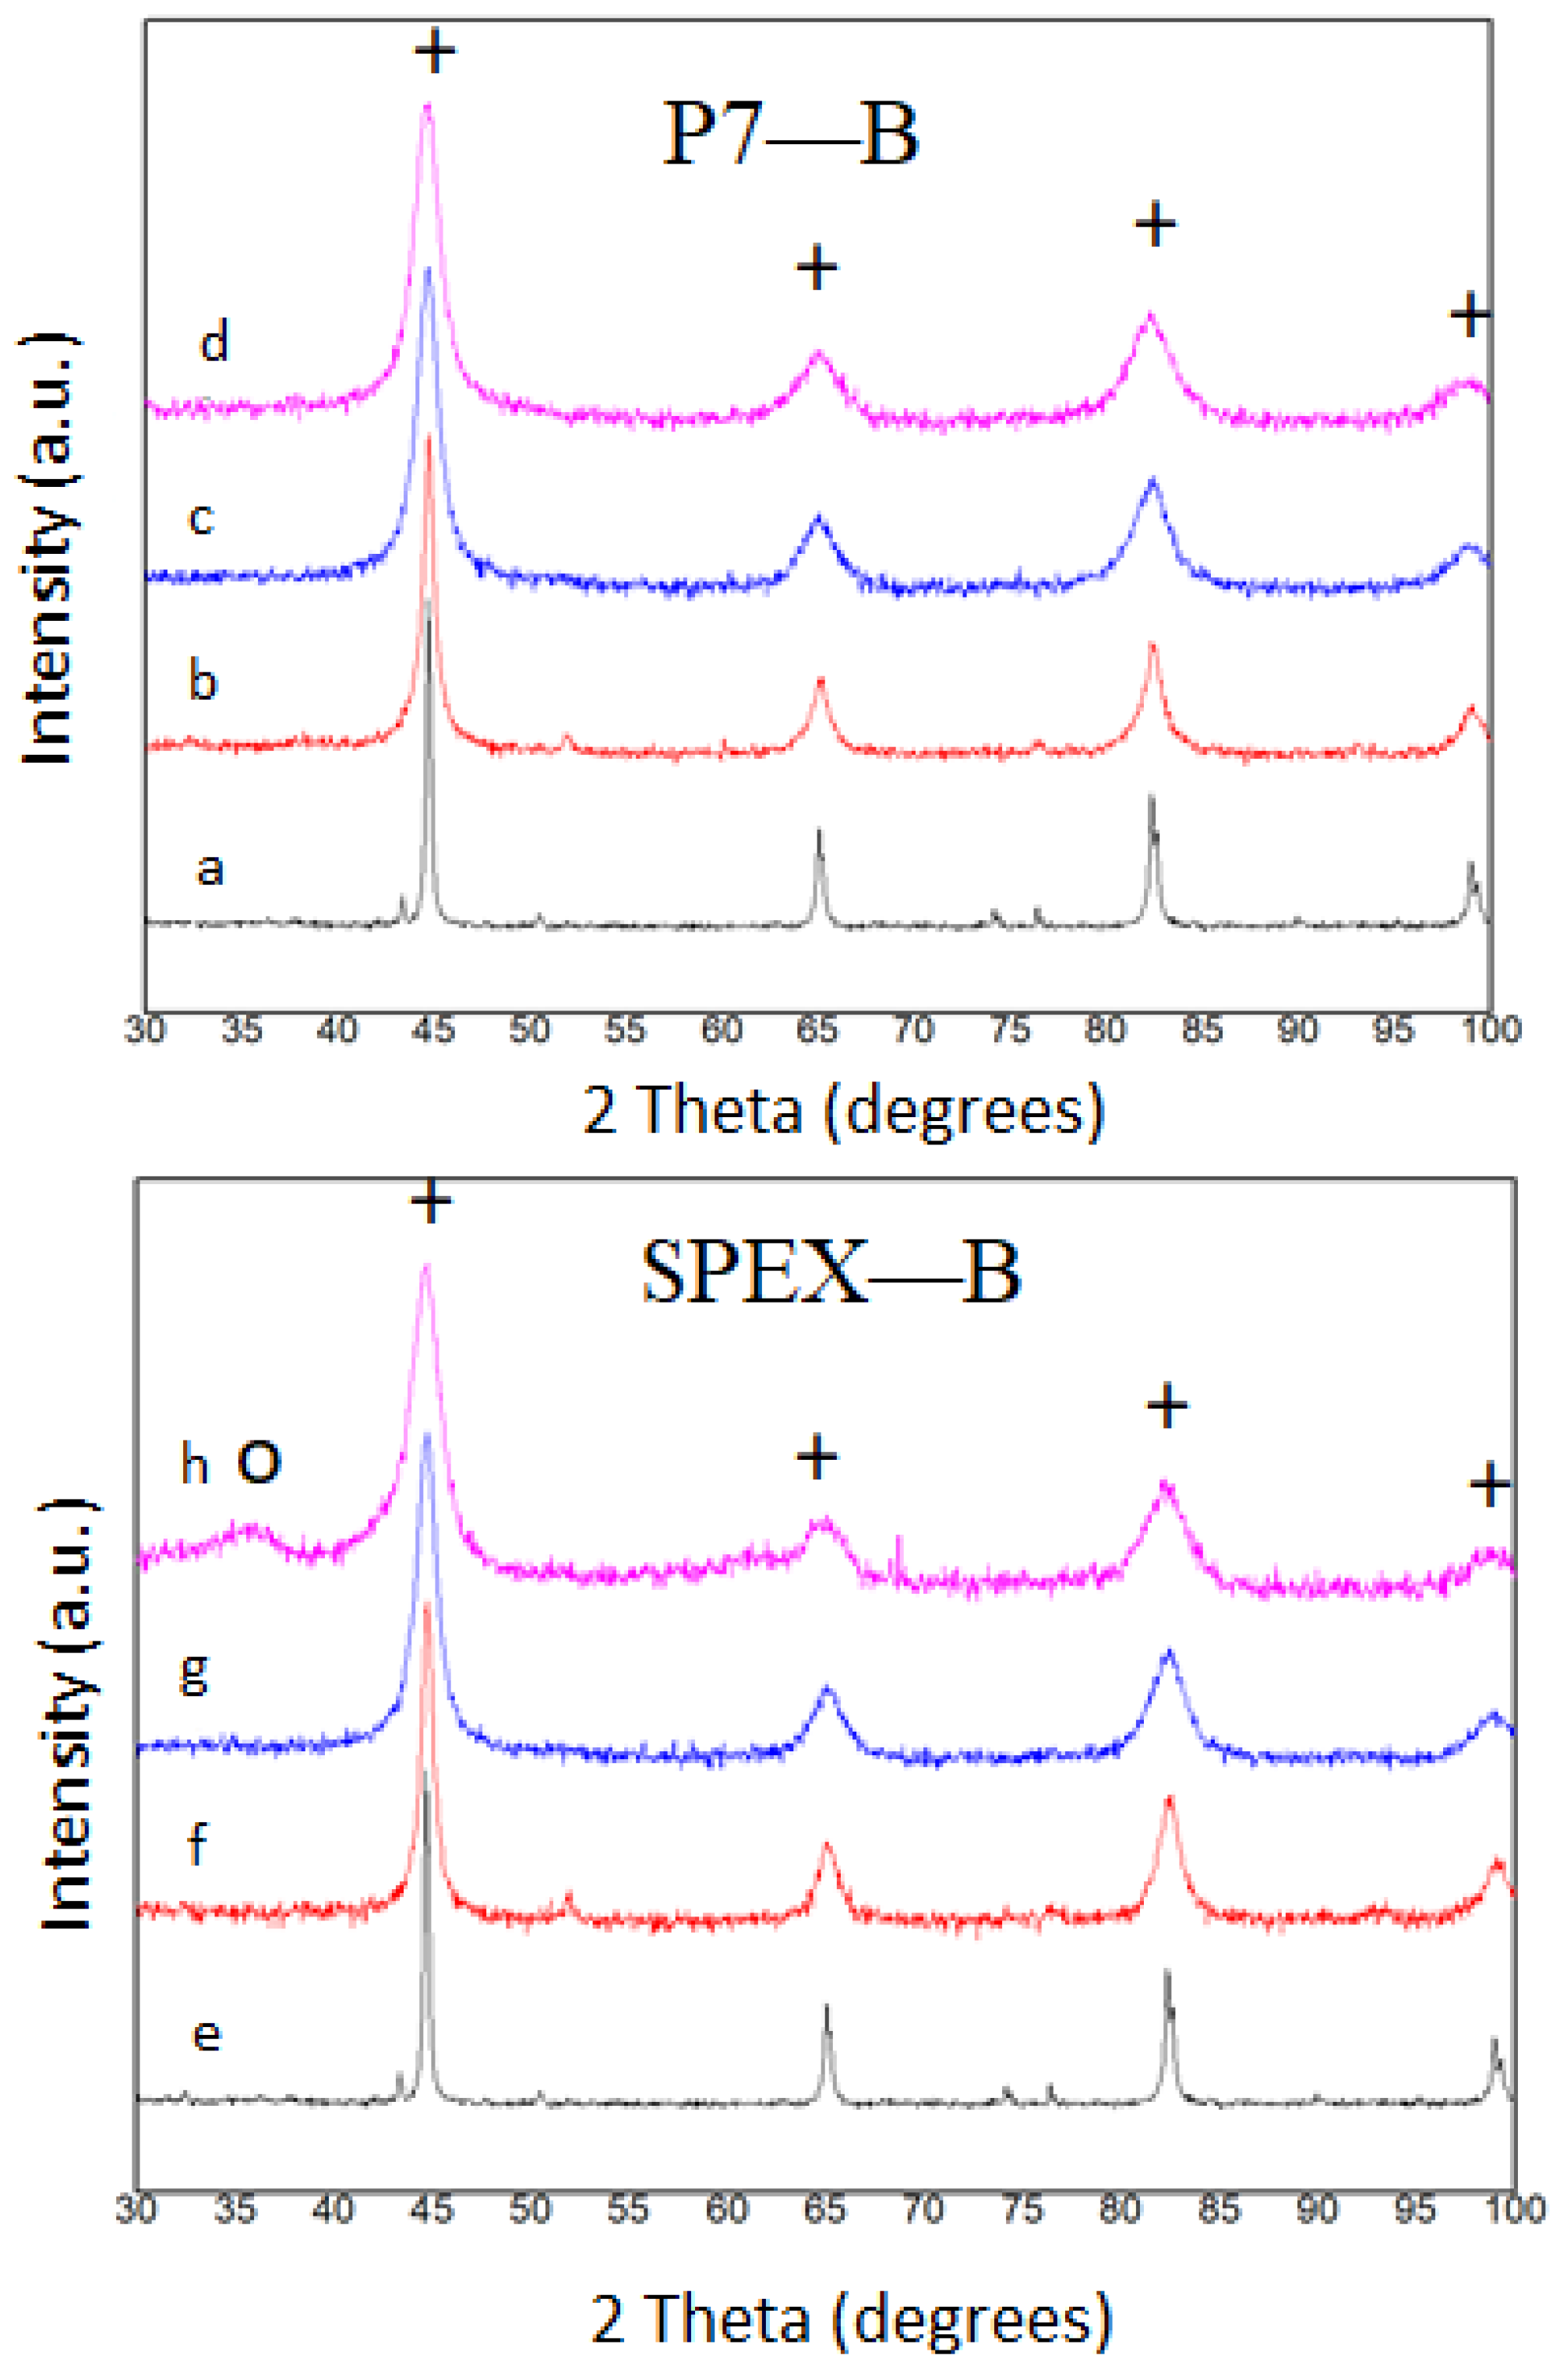
- In the composition with Zr milled in SPEX, the Fe rich solid solution coexists with a minor disordered phase. Whereas, in the alloy milled in P7, this phase was not formed.
4. Conclusions
Author Contributions
Funding
Institutional Review Board Statement
Informed Consent Statement
Data Availability Statement
Acknowledgments
Conflicts of Interest
References
- Kwon, S.; Kim, S.; Yim, H.; Kang, K.H.; Yoon, C.S. High saturation magnetic flux density of novel nanocrystalline core annealed under magnetic field. J. Alloys Comp. 2020, 826, 154136. [Google Scholar] [CrossRef]
- Alleg, S.; Ibrir, M.; Fenineche, N.E.; Azzaza, S.; Bensalem, R.; Suñol, J.J. Magnetic and structural characterization of the mechanically alloyed Fe75Si15B10 powders. J. Alloys Comp. 2010, 494, 109–115. [Google Scholar] [CrossRef]
- Parsons, R.; Zang, B.; Onodera, K.; Kishimoto, H.; Kato, A.; Suzuki, K. Soft magnetic properties of rapidly-annealed nanocrystalline Fe-Nb-B-(Cu) alloys. J. Alloys Comp. 2017, 723, 408–417. [Google Scholar] [CrossRef]
- Suryanarayana, C. Mechanical alloying and milling. Prog. Mater. Sci. 2001, 46, 1–184. [Google Scholar] [CrossRef]
- Suzuki, K.; Kataoka, N.; Inoue, A.; Makino, A.; Masumoto, T. High saturation magnetization and soft magnetic properties of bcc Fe-Zr-B alloys with ultrafine grain structures. Mater. Trans. 1990, 31, 743–746. [Google Scholar] [CrossRef]
- Fan, X.; Tang, Y.; Shi, Z.; Jiang, M.; Shen, B. The effect of Ni addition on microstructure and soft magnetic properties of FeCoZrBCu nanocrystalline alloys. AIP Adv. 2017, 7, 056107. [Google Scholar] [CrossRef]
- Alleg, S.; Chabi, T.; Bensebaa, N.; Saurina, J.; Escoda, L.; Hlil, E.K.; Suñol, J.J. Investigation on the critical behavior, magnetocaloric effect and hyperfine structure in the Fe72Nb8B20 powders. Materials 2020, 13, 4476. [Google Scholar] [CrossRef] [PubMed]
- Ipus, J.J.; Blázquez, J.S.; Franco, V.; Lozano-Pérez, S.; Conde, A. Role of the starting phase of boron on the mechanical alloying of FeNbB composition. J. Alloys Comp. 2013, 553, 119–124. [Google Scholar] [CrossRef]
- Chabi, T.; Bensebaa, N.; Alleg, S.; Azzaza, S.; Suñol, J.J.; Hlil, E.K. Effect of the boron content on the amorphization process and magnetic properties of the mechanically alloyed Fe92-xNb8Bx powders. J. Supercond. Novel Magn. 2019, 32, 893–901. [Google Scholar] [CrossRef]
- Pilar, M.; Suñol, J.J.; Bonastre, J.; Escoda, L. Influence of process control agents in the development of a metastable Fe-Zr based alloy. J. Non-Cryst. Solids 2007, 353, 848–850. [Google Scholar] [CrossRef]
- Djilali, Z.; Said, B. Study of the ball milling device for synthesizing nanocrystalline powder. J. Nano Res. 2017, 47, 60–70. [Google Scholar] [CrossRef]
- Lutterotti, L.; Matthies, S.; Wenk, H.R. Quantitative phase analysis. Newsl. CPD 1999, 21, 14–15. [Google Scholar] [CrossRef]
- Alleg, S.; Kartout, S.; Ibrir, M.; Azzaza, S.; Fenineche, N.E.; Suñol, J.J. Magnetic, structural and therml properties of the Finemet-type powders prepared by mechanical alloying. J. Phys. Chem. Solids 2013, 74, 550–557. [Google Scholar] [CrossRef]
- Eckert, J.; Holzer, J.C.; Krill, C.E.; Johnson, W.L. Structural and thermodynamic properties of nanocrystalline fcc metals prepared by mechanical attrition. J. Mater. Res. 1992, 7, 1751–1761. [Google Scholar] [CrossRef]
- Ibn Gharsallah, H.; Azabou, M.; Escoda, L.; Suñol, J.J.; López, I.; Llorca-Isern, N. The magnetic and structural properties of (Fe75Al25)100-xBxalloys prepared by mechanical alloying. J. Alloys Comp. 2017, 729, 776–786. [Google Scholar] [CrossRef]
- Takebayashi, T.; Kunieda, T.; Yoshinaga, N.; Ushioda, K.; Ogata, S. Comparison of the dislocation density in martensitic steels evaluated by some X-ray diffraction methods. ISIJ Inter. 2010, 50, 875–882. [Google Scholar] [CrossRef]
- Carrillo, A.; Escoda, L.; Saurina, J.; Suñol, J.J. Structural and magnetic behavior of Fe(Nb,Zr) rich alloys produced by mechanical alloying. AIP Adv. 2018, 8, 047704. [Google Scholar] [CrossRef]
- Abdoli, H.; Ghanbari, H.; Baghshahi, S. Thermal stability of nanostructured aluminium powder synthesized by high energy milling. Mater. Sci. Eng. A 2011, 528, 6702–6707. [Google Scholar] [CrossRef]
- Ipus, J.J. Microstructure and Thermomagnetic Behavior of (FeCo)(NbZr)(GeB) Alloys Prepared by Milling. Ph.D. Thesis, Universidad de Sevilla, Sevilla, Spain, 2009. [Google Scholar]
- Ye, F.; Lu, K. Crystallization kinetics of Al-La-Ni amorphous alloy. J. Non-Cryst. Solids 2000, 262, 228–235. [Google Scholar] [CrossRef]
- Liu, Y.; Chang, I.; Lees, M. Thermodynamic and magnetic properties of multicomponent (Fe,Ni)70Zr10B20 amorphous alloy powders made by mechanical alloying. J. Mater. Sci. Eng. 2001, 304–306, 992–996. [Google Scholar] [CrossRef]
- Suñol, J.J.; Güell, J.M.; Bonastre, J.; Alleg, S. Structural study of nanocrystalline Fe-Co-Nb-B alloys prepared by mechanical alloying. J. Alloys Comp. 2009, 483, 604–607. [Google Scholar] [CrossRef]
- Krakhmalev, P.V.; Yi, D.; Nyborg, L.; Yao, Y. Isothermal grain growth in mechanically alloyed nanostructured Fe80Ti8B12alloy. Mat. Lett. 2003, 57, 3671–3675. [Google Scholar] [CrossRef]
- Johnson, F.; Hughes, P.; Gallagher, R.; Harris, V. structure and magnetic properties of new FeCo-based nanocrystalline ferromagnets. IEEE Trans. Magn. 2001, 37, 2261–2263. [Google Scholar] [CrossRef]
- Ipus, J.J.; Blázquez, J.S.; Conde, C.F.; Borrego, J.M.; Franco, V.; Lozano-Pérez, S.; Conde, A. Relationship between mechanical amorphization and boron integration during processing of FeNbB alloys. Intermetallics 2014, 49, 98–105. [Google Scholar] [CrossRef]
- Chattopadhyay, P.; Manna, I.; Talapatra, S.; Pabi, S. A mathematical analysis of milling mechanics in a planetary ball mill. Mater. Chem. Phys. 2001, 68, 85–94. [Google Scholar] [CrossRef]
- Basset, D.; Matteazi, P.; Miani, F. Measuring the impact velocities of balls in high energy mills. Mater. Sci. Eng. A 1994, 174, 71–74. [Google Scholar] [CrossRef]
- Concas, A.; Pisu, M.; Lai, N.; Cao, G. Modelling of comminution in processes in Spex Mixer/Mill. Chem. Eng. Sci. 2006, 61, 3746–3760. [Google Scholar] [CrossRef]
- Dastanpoor, E.; Enayati, M.H. Effect of milling intensity on mechanical alloying of Cu-Zr-Al system. Ind. J. Eng. Mater. Sci. 2015, 22, 521–526. [Google Scholar]
- Gheisari, K.; Oh, J.T.; Javadpour, S.; Ghaffari, M.J. The effect of milling speed on the structural properties of mechanically alloyed Fe-45% Ni powders. J. Alloys Comp. 2009, 472, 416–420. [Google Scholar] [CrossRef]
- Magini, M. The role of energy transfer in mechanical alloying powder processing. Mater. Sci. Forum 2009, 88, 121–128. [Google Scholar] [CrossRef]
- Singh, S.; Godkhindi, M.M.; Krishmarao, R.V.; Murty, B.S. Effect of milling energy on mechanical activation of (Mo+Si3N4) powders during the synthesis of Si3N4-MoSi2in situ composites. J. Euro. Ceram. Soc. 2009, 29, 2069–2077. [Google Scholar] [CrossRef]
- Karthik, B.; Sai Gautam, G.; Karthikeyan, N.R.; Murty, B.S. Analysis of mechanical milling in Sismoloyer: An energy modeling approach. Metall. Mater. Trans. A Phys. Metall. Mater. Sci. 2012, 43, 1323–1327. [Google Scholar] [CrossRef]
- Ipus, J.J.; Blázquez, J.S.; Franco, V.; Millán, M.; Conde, A.; Oleszak, D.; Kulik, T. An equivalent time approach for scaling the mechanical alloying process. Intermetallics 2008, 16, 470–478. [Google Scholar] [CrossRef]
- Blázquez, J.S.; Ipus, J.J.; Conde, C.F.; Conde, A. Comparison of equivalent ball milling process on Fe70Zr30 and Fe70Nb30. J. Alloys Comp. 2012, 536, 9–12. [Google Scholar] [CrossRef]
- Martin, G.; Gaffet, E. Mechanical alloying: Far from equilibrium phase transitions. Colloq. Phys. 1990, 51, 71–77. [Google Scholar] [CrossRef]
- Nova, K.; Novak, P.; Prusa, F.; Kopecek, J.; Cech, J. Synthesis of intermetallics in Fe-Al-Si system by mechanical alloying. Metals 2019, 9, 20. [Google Scholar] [CrossRef]


| Sample/Milling Time | 0 h | 5 h | 20 h | 80 h |
|---|---|---|---|---|
| P7—A | 2.8608 ± 0.0001 | 2.8681 ± 0.0002 | 2.8731 ± 0.0002 | 2.8832 ± 0.0003 |
| SPEX—A | 2.8608 ± 0.0001 | 2.8659 ± 0.0001 | 2.8706 ± 0.0002 | 2.8694 ± 0.0002 |
| P7—B | 2.8608 ± 0.0001 | 2.8664 ± 0.0001 | 2.8699 ± 0.0002 | 2.8705 ± 0.0002 |
| SPEX—B | 2.8608 ± 0.0001 | 2.8642 ± 0.0002 | 2.8672 ± 0.0002 | 2.8719 ± 0.0003 |
| Sample/Milling Time | 0 h | 5 h | 20 h | 80 h |
|---|---|---|---|---|
| P7—A | 237 ± 8 | 19.9 ± 0.9 | 14 ± 1 | 9.9 0.4 |
| SPEX—A | 237 ± 8 | 36 ± 3 | 15 ± 1 | 15 ± 1 |
| P7—B | 237 ± 8 | 29.3 ± 0.9 | 15.7 ± 0.6 | 13.4 ± 0.5 |
| SPEX—B | 237 ± 8 | 16.5 ± 0.9 | 11.5 ± 0.7 | 9.5 ± 0.5 |
| Sample/Milling Time | 0 h | 5 h | 20 h | 80 h |
|---|---|---|---|---|
| P7—A | 0.028 ± 0.003 | 0.10 ± 0.02 | 0.41 ± 0.08 | 0.66 ± 0.05 |
| SPEX—A | 0.028 ± 0.003 | 0.22 ± 0.02 | 0.42 ± 0.03 | 0.61 ± 0.02 |
| P7—B | 0.028 ± 0.003 | 0.02 ± 0.01 | 0.47 ± 0.02 | 0.59 ± 0.06 |
| SPEX—B | 0.028 ± 0.003 | 0.19 ± 0.02 | 0.44 ± 0.04 | 0.40 ± 0.03 |
| Sample/Milling Time | 0 h | 5 h | 20 h | 80 h |
|---|---|---|---|---|
| P7—A | 0.0323 ± 0.003 | 1.10 ± 0.09 | 4.58 ± 0.08 | 9.72 ± 0.07 |
| SPEX—A | 0.0323 ± 0.003 | 1.12 ± 0.08 | 4.44 ± 0.03 | 6.22 ± 0.05 |
| P7—B | 0.0323 ± 0.003 | 0.07 ± 0.05 | 4.91 ± 0.12 | 7.32 ± 0.08 |
| SPEX—B | 0.0323 ± 0.003 | 1.10 ± 0.09 | 4.11 ± 0.09 | 7.08 ± 0.07 |
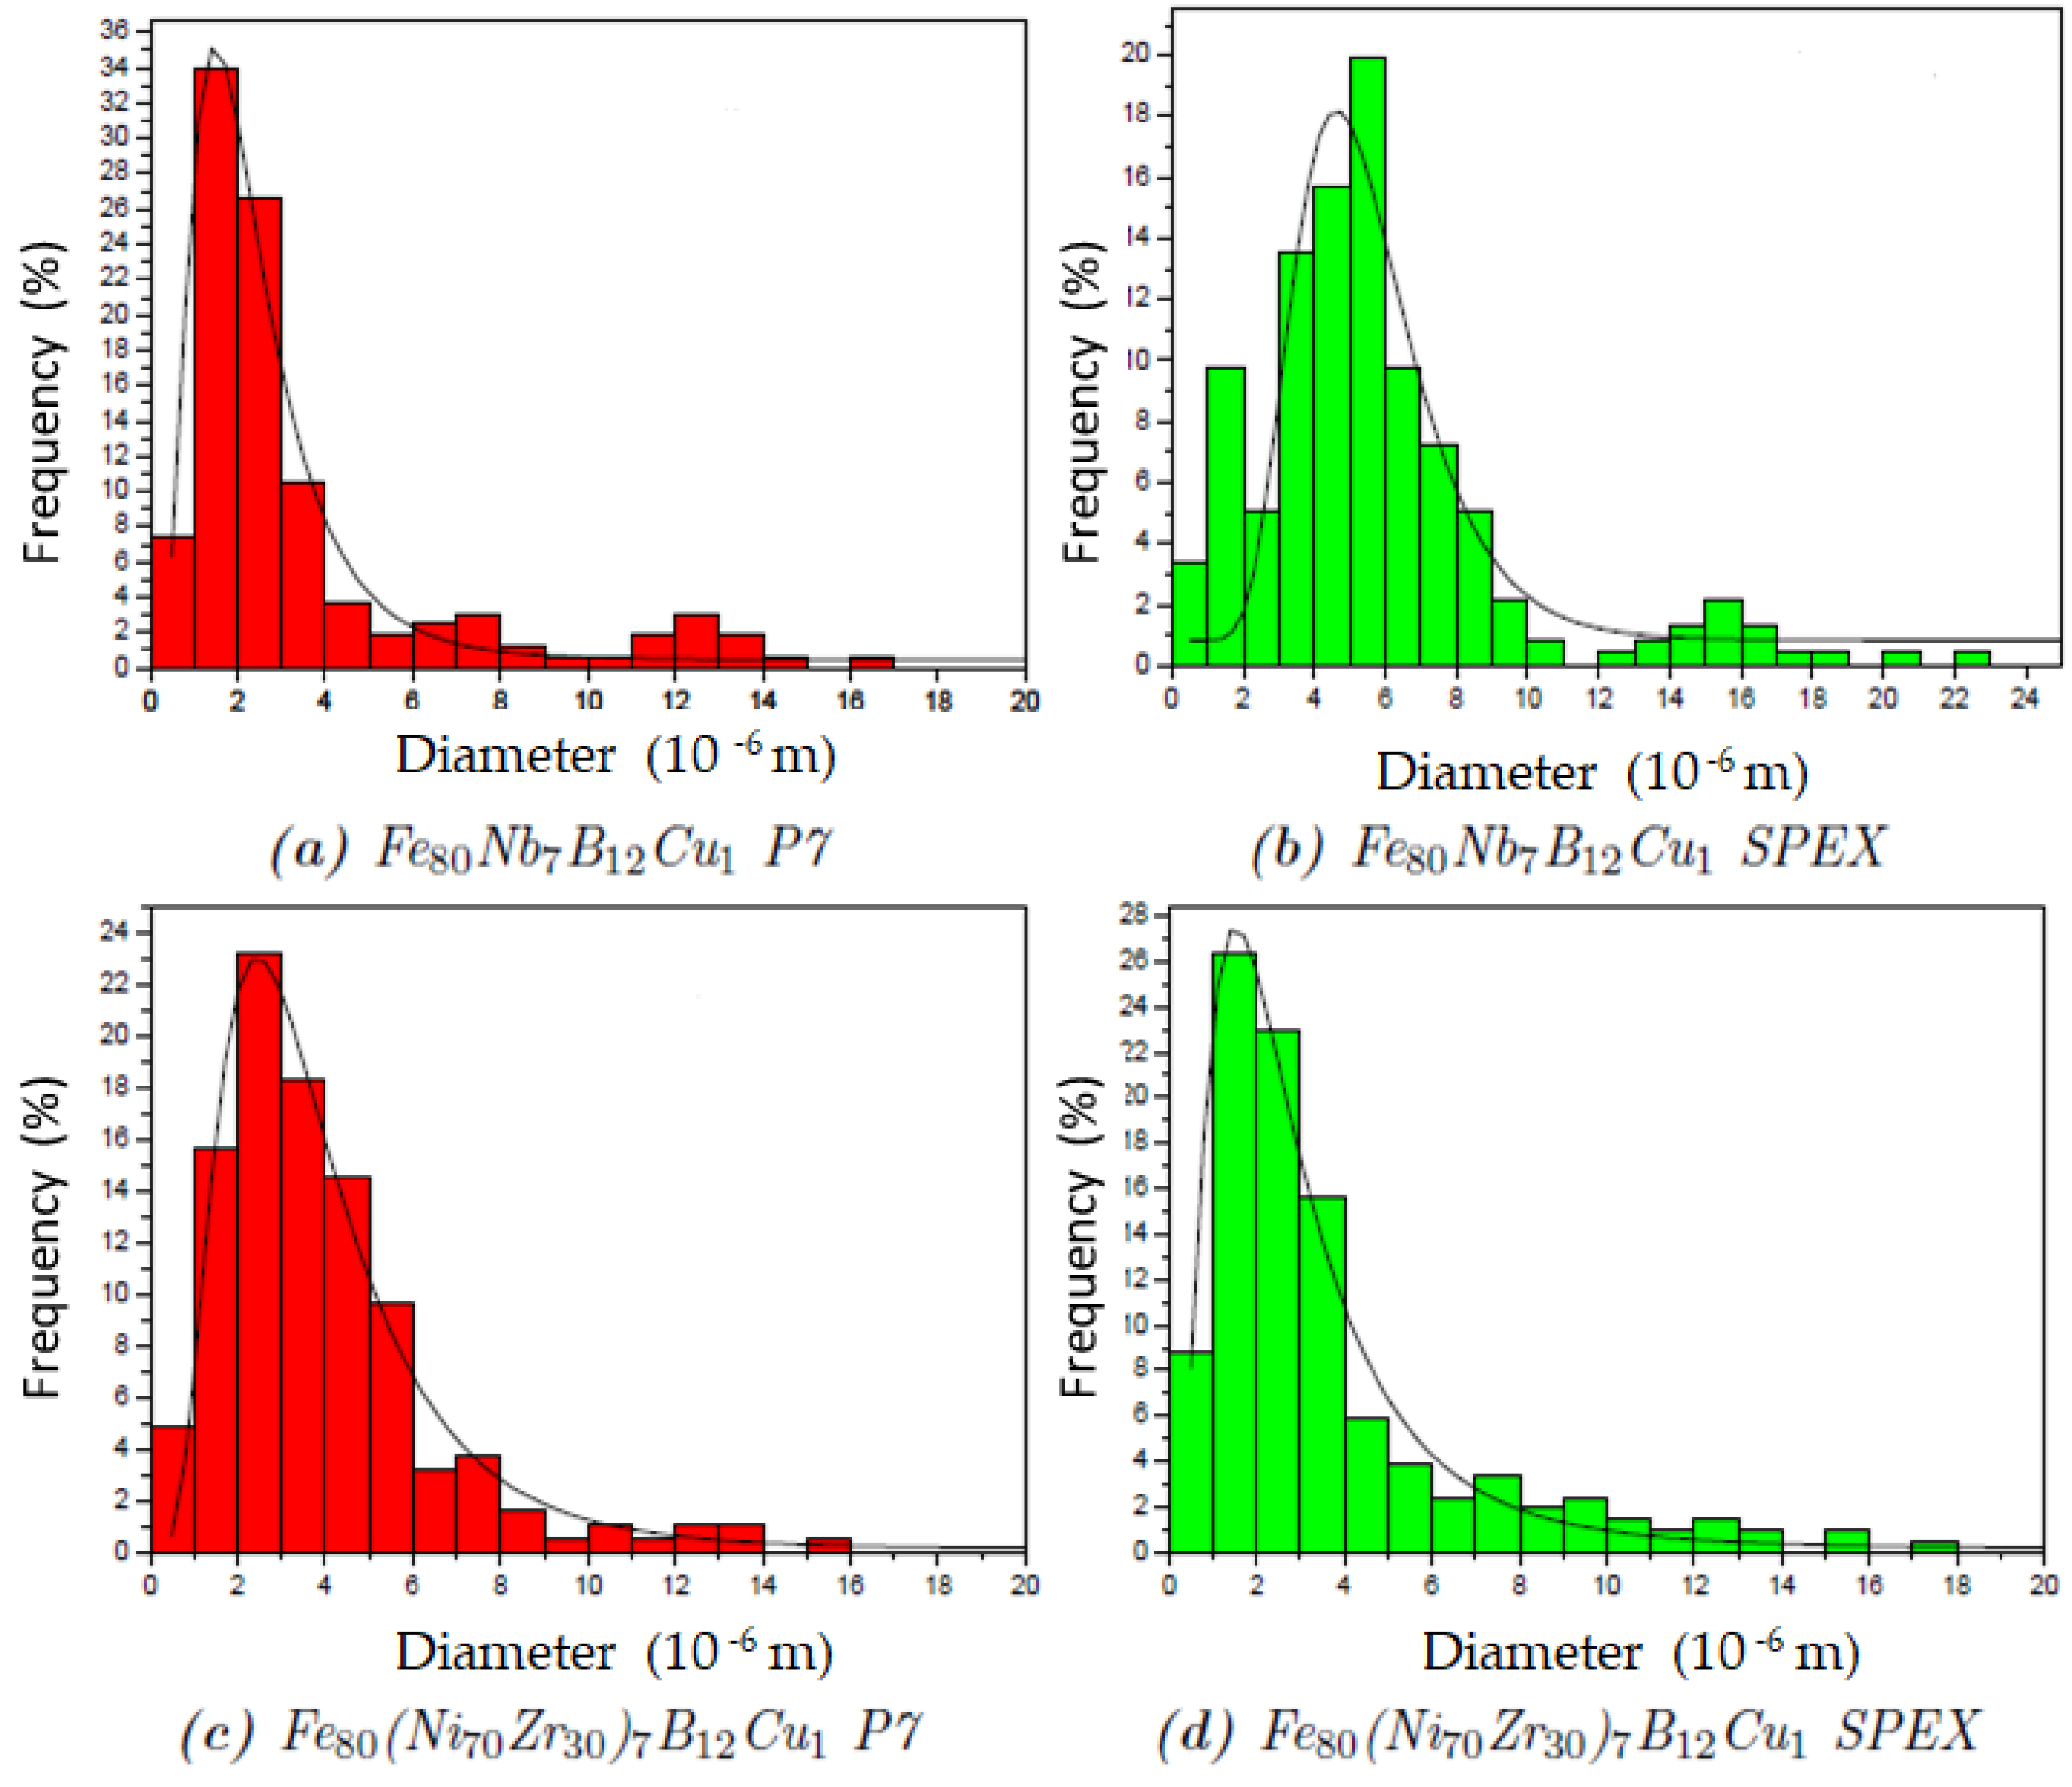
| Sample | μ /10−6 m | σ /10−6 m |
|---|---|---|
| P7—A | 2.4458 | 1.5367 |
| SPEX—A | 5.5279 | 1.9658 |
| P7—B | 3.9970 | 2.4863 |
| SPEX—B | 3.2053 | 2.5755 |
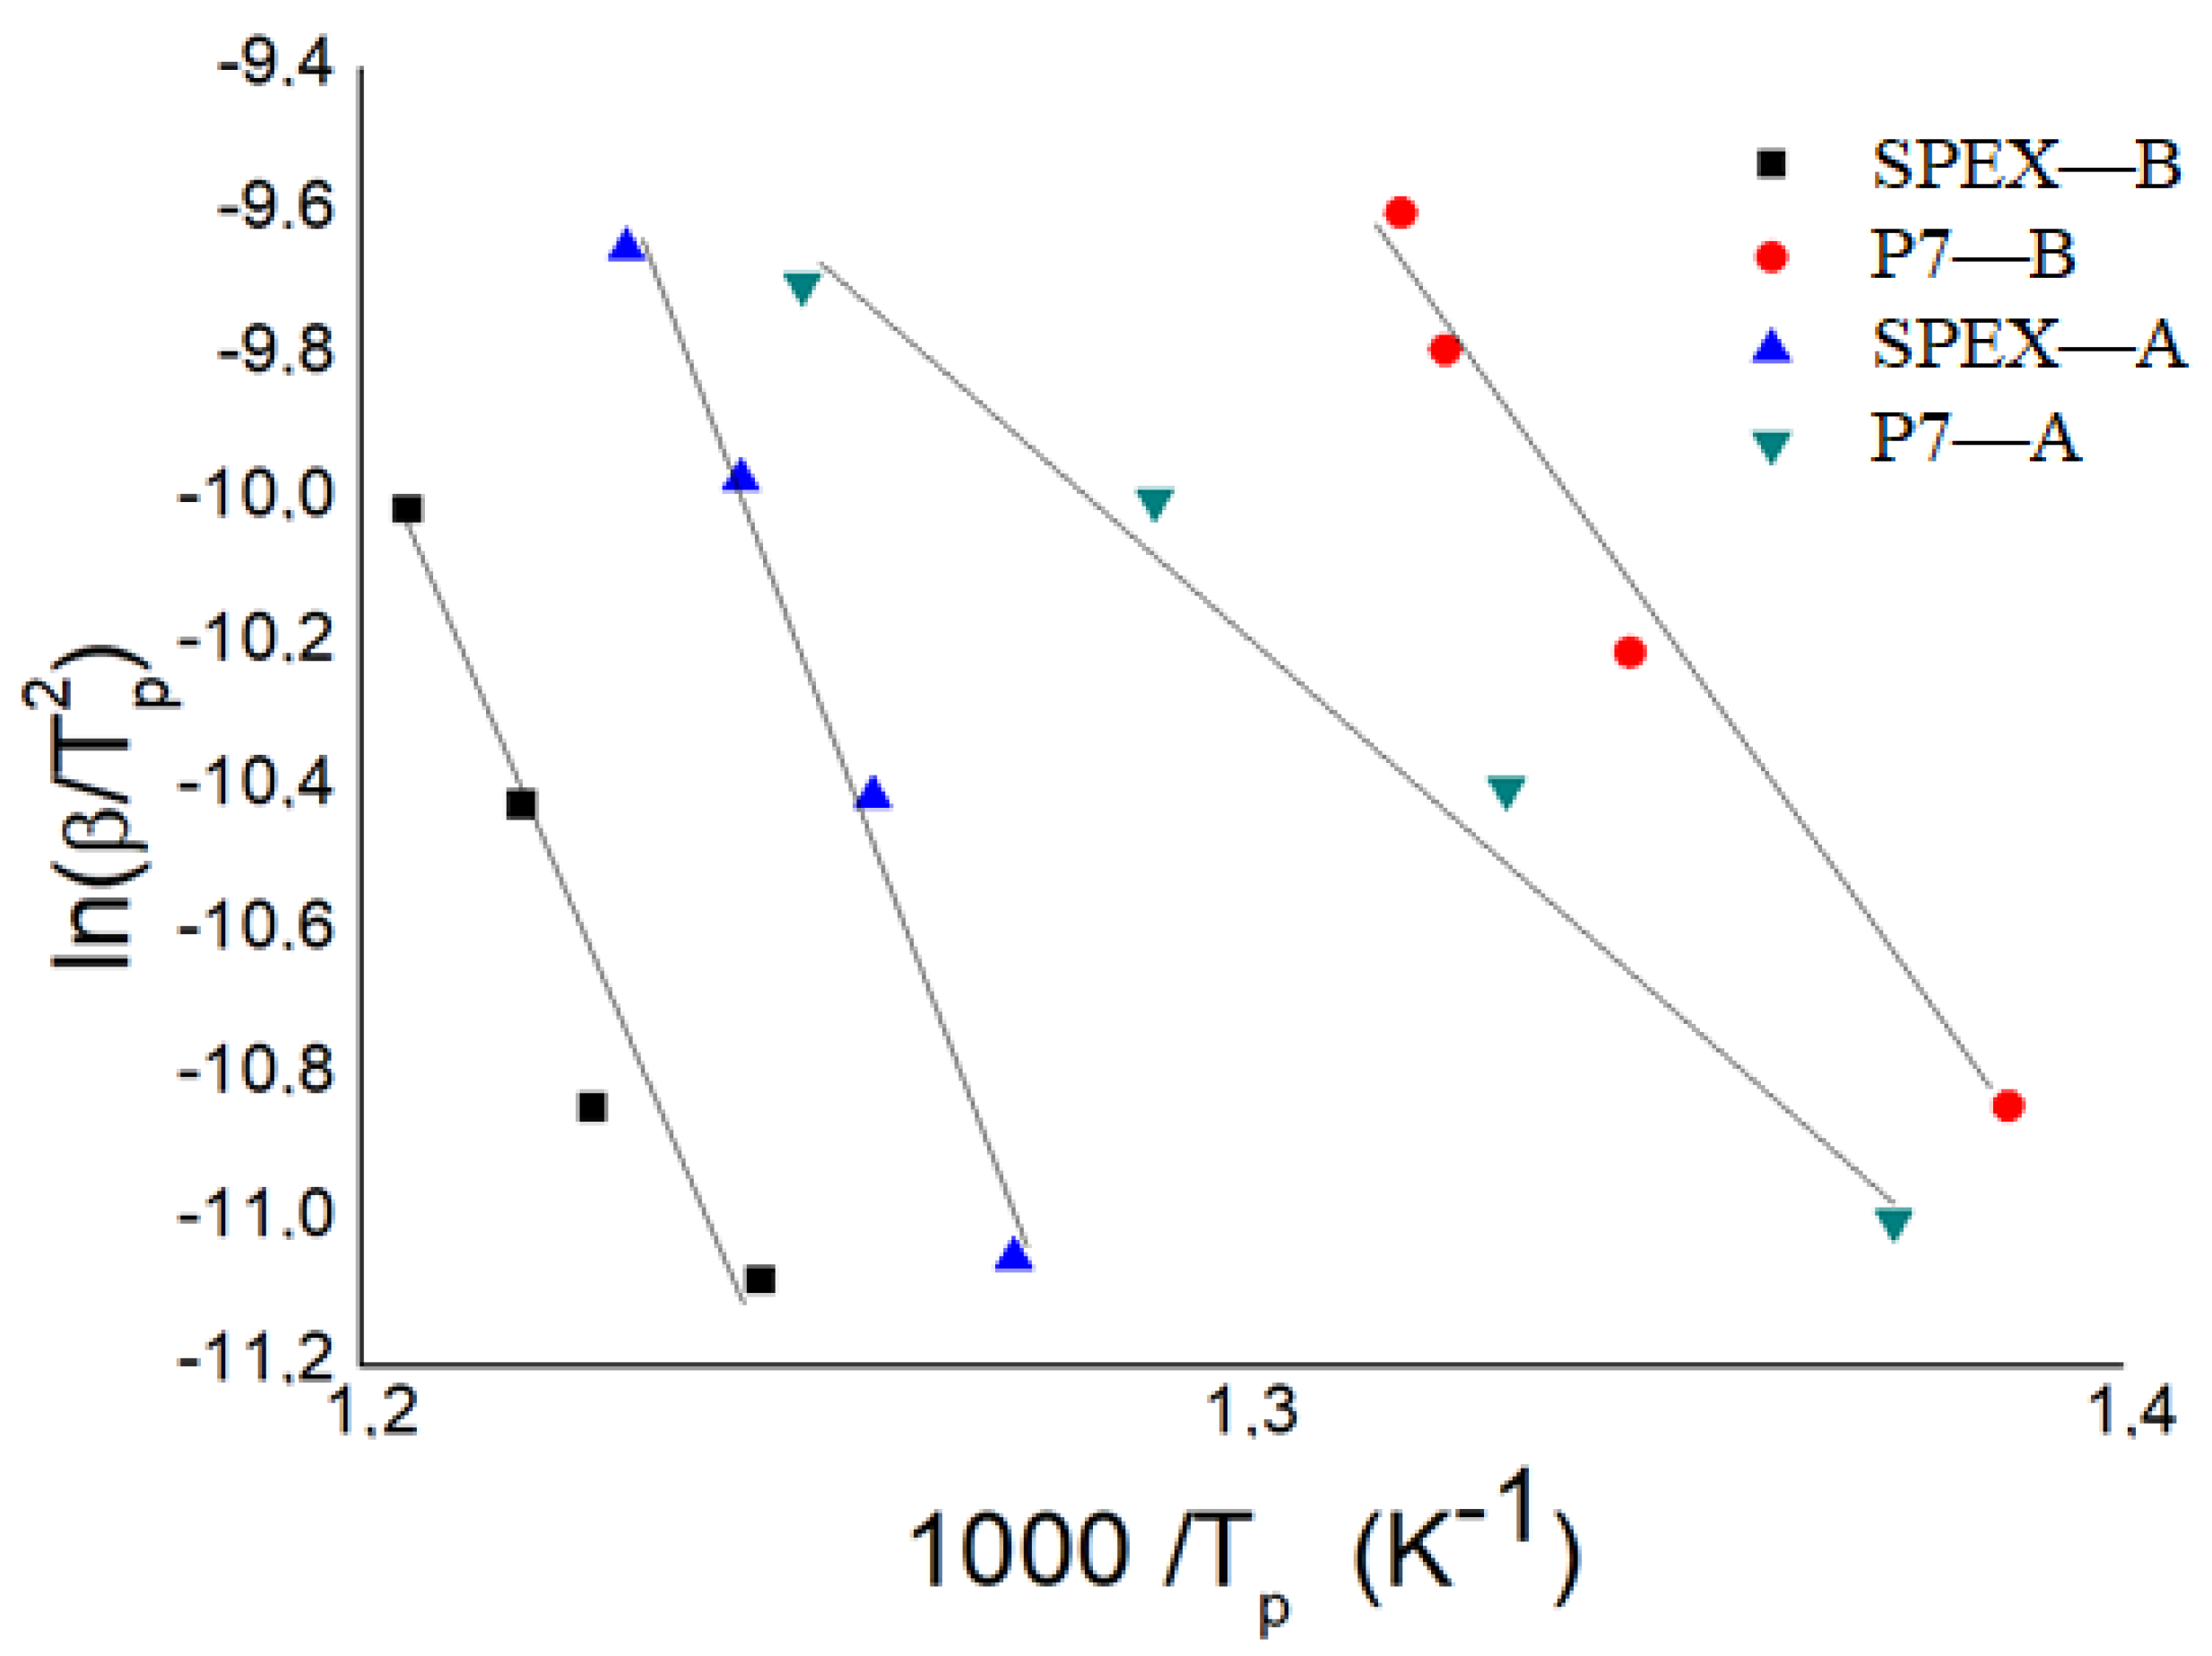
| Sample | E kJ mol−1 |
|---|---|
| P7—A | 87 ± 11 |
| SPEX—A | 263 ± 21 |
| P7—B | 144 ± 13 |
| SPEX—B | 225 ± 44 |
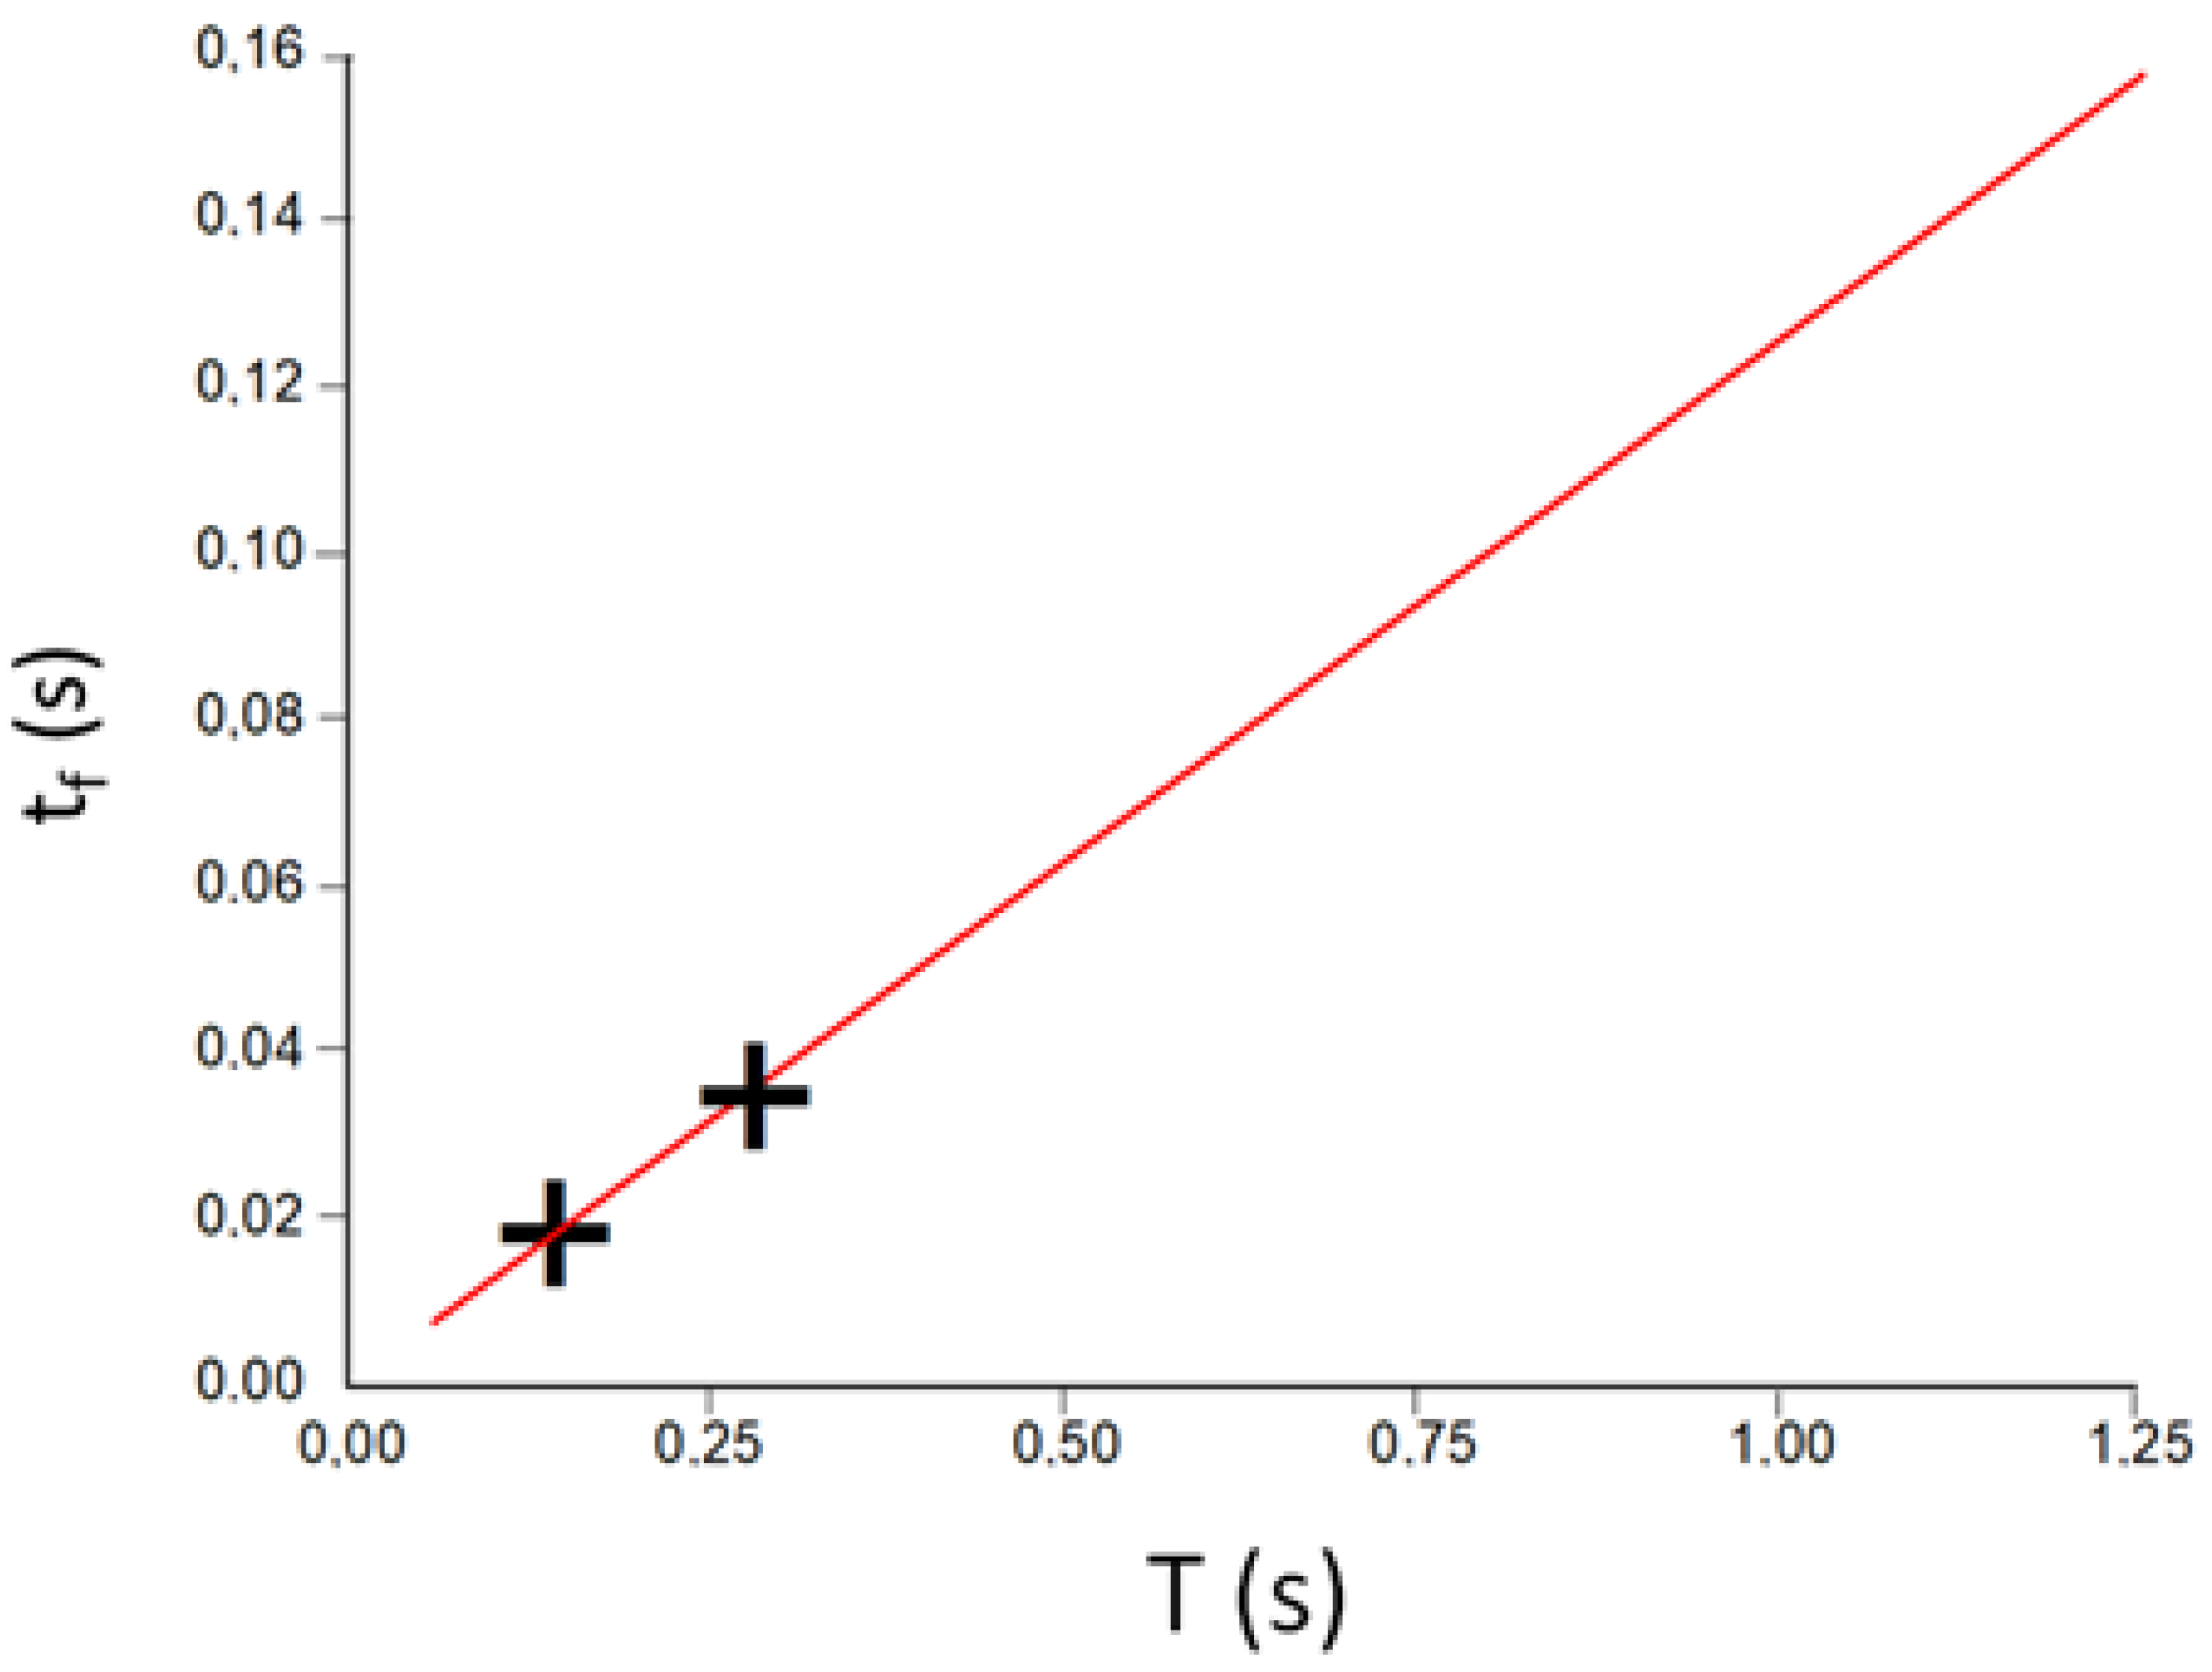
| Mill | Ball Velocity m/s | Kinetic Energy J | (E/m) J/g |
|---|---|---|---|
| P7 | 0.79 | 0.002 | 3752 |
| SPEX | 2.5 | 0.026 | 5193 |
Publisher’s Note: MDPI stays neutral with regard to jurisdictional claims in published maps and institutional affiliations. |
© 2021 by the authors. Licensee MDPI, Basel, Switzerland. This article is an open access article distributed under the terms and conditions of the Creative Commons Attribution (CC BY) license (http://creativecommons.org/licenses/by/4.0/).
Share and Cite
Carrillo, A.; Saurina, J.; Escoda, L.; Suñol, J.-J. Fe-X-B-Cu (X = Nb, NiZr) Alloys Produced by Mechanical Alloying: Influence of Milling Device. Metals 2021, 11, 379. https://doi.org/10.3390/met11030379
Carrillo A, Saurina J, Escoda L, Suñol J-J. Fe-X-B-Cu (X = Nb, NiZr) Alloys Produced by Mechanical Alloying: Influence of Milling Device. Metals. 2021; 11(3):379. https://doi.org/10.3390/met11030379
Chicago/Turabian StyleCarrillo, Albert, Joan Saurina, Lluisa Escoda, and Joan-Josep Suñol. 2021. "Fe-X-B-Cu (X = Nb, NiZr) Alloys Produced by Mechanical Alloying: Influence of Milling Device" Metals 11, no. 3: 379. https://doi.org/10.3390/met11030379
APA StyleCarrillo, A., Saurina, J., Escoda, L., & Suñol, J.-J. (2021). Fe-X-B-Cu (X = Nb, NiZr) Alloys Produced by Mechanical Alloying: Influence of Milling Device. Metals, 11(3), 379. https://doi.org/10.3390/met11030379