Abstract
REACH (Registration, Evaluation, Authorisation and Restriction of Chemicals) regulations demand for an expedient discovery of a Cr(VI)-free alternative corrosion protection for light alloys even though the green alternatives might never be as cheap as current harmful technologies. In the present work, flash- plasma electrolytic oxidation coatings (FPEO) with the process duration < 90 s are developed on AZ31B alloy in varied mixtures of silicate-, phosphate-, aluminate-, and fluoride-based alkaline electrolytes implementing current density and voltage limits. The overall evaluation of the coatings’ anticorrosion performance (electrochemical impedance spectroscopy (EIS), neutral salt spray test (NSST), paintability) shows that from nine optimized FPEO recipes, two (based on phosphate, fluoride, and aluminate or silicate mixtures) are found to be an adequate substitute for commercially used Cr(VI)-based conversion coating (CCC). The FPEO coatings with the best corrosion resistance consume a very low amount of energy (~1 kW h m−2 µm−1). It is also found that the lower the energy consumption of the FPEO process, the better the corrosion resistance of the resultant coating. The superb corrosion protection and a solid environmentally friendly outlook of PEO-based corrosion protection technology may facilitate the economic justification for industrial end-users of the current-consuming process as a replacement of the electroless CCC process.
1. Introduction
Since the early 1920′s, Cr-based conversion coatings have been almost exclusively used as corrosion protection for metals and metal alloys (mostly steel but also Cu, Mg, and Al). Cr-based protection is not only very efficient, but also very well-known since it has been deeply characterized for many years; therefore, it is so readily applied for Mg alloys in industry. Recently, according to REACH regulations, chromium (VI) (highly toxic and carcinogenic) was forbidden to use and must be replaced by new environmentally friendly technologies. A promising approach to anticorrosion coatings formation, also working well for light metals, is electrochemical treatment in the high-voltage region called plasma electrolytic oxidation (PEO) or micro-arc oxidation (MAO). In contrast to low-voltage “classic” anodizing, after reaching a certain potential threshold (the dielectric breakdown potential), the strong micro-discharges and plasma formation can form on the metal surface, which leads to ceramic-like layer formation [1,2]. Although the energy input is considerable, PEO coatings exhibit great properties, e.g., very resistive, perfectly adhered to substrate, high thickness, very good paintability (due to the porosity of the top layer), fast growth rate, and intensive incorporation of electrolytes species [3,4]. The latter fact is very important for Mg alloys since Pilling-Bedworth ratio Vox/Vm = 0.81 for pure MgO [5], which means Mg surface cannot be fully covered with magnesium oxide (the main product of anodizing below breakdown potential).
A wide variation of electrolyte composition available for PEO allows for easy coating properties modification [4,6]. Besides KOH or NaOH as main components of electrolytes (alkaline environment is necessary to carry out PEO of Mg), additives like phosphates, silicates, fluorides, aluminates, zirconates, permanganates, etc., are used [4,6,7] to enrich the coating composition and influence the discharge process and coating morphology. The addition of aluminates as a reagent (e.g., NaAlO2) leads to formation of MgAl2O4 in PEO coatings, characterized by much greater stability and higher Pilling-Bedworth ratio compared with MgO [7,8], and results in enhanced anticorrosion performance. Moreover, it was shown that the aluminate-based electrolyte has better structural features (spherical-shaped craters and the lowest level of surface porosity) than phosphate- and silicate-based electrolytes [9]. The addition of fluorides to electrolytes leads to generation of a more compact layer and nobler corrosion potential associated with MgF2 phase formation [10,11,12,13]. Phosphates are commonly used both in research [14,15,16,17] and in commercial PEO electrolytes like Anomag CR1 and CR2 (Henkel AG & Co. KGaA, Dusseldorf, Germany). The presence of Na3PO4 in the electrolyte has been shown to promote the coating growth rate, uniform distribution of micro-discharges [14], lower porosity [18], and take part in a self-healing mechanism, which is particularly interesting [19]. Sodium silicate, Na2SiO3, allows for the formation of Mg2SiO4, which was shown to be the most corrosion-resistant to Cl− attack in comparison to amorphous material, MgO and Mg3(PO4)2 [20]. The tribocorrosion performance of PEO coatings from silicate-based electrolyte was characterized by a better performance than the phosphate-based one [21]. Comparison of the effect of phosphate, aluminate, molybdate, and silicate sodium salts on anticorrosion performance revealed that the latter provided the biggest improvement due to a higher coating thickness and less open porosity [15]. In similar studies, silicate-based electrolyte shows the highest corrosion resistance at short immersion time (2 days), while at long immersion time (9 days), this was provided by the aluminate-containing coating [22].
When designing an electrolyte and an electrical regime for a PEO coating for Mg, the research is mainly concerned with corrosion resistance, with little importance given to the energy consumption. Typically, the process duration is kept long enough to ensure thick (>15 μm) and compact coatings that provide greater protective properties. In the view of PEO technology as a possible “green” alternative to cheaper, albeit polluting and hazardous, chemical conversion processes, this approach has to change. PEO process and electrolyte design must enable the shortest possible “flash” treatment and ensure a uniform and dense coating with the greatest possible corrosion resistance for a relatively thin layer [23,24].
The objective of this work was to develop Cr-free flash-PEO coatings for magnesium AZ31B alloy with similar or better performance than Cr(VI) conversion coatings (CCC) that could become an alternative corrosion protection system choice for industrial applications. For this reason, flash-PEO coatings obtained from (i) aluminate-, phosphate-, and silicate-based electrolytes, or (ii) their mixtures without or (iii) with fluoride have been screened for Mg AZ31B alloy. Very short durations of flash-PEO were used (≤90 s) in order to limit the energy consumption as much as possible. The multidimensional screening, including electrochemical impedance spectroscopy (EIS), specific energy consumption and industrial-type neutral salt spray (NSST), and paint adhesion tests were implemented in order to verify the suitability of PEO coatings’ performance for the needs of industrial applications. The PEO coatings were compared with reference CCC coating (MTU Aero Engines, Munich, Germany).
2. Materials and Methods
2.1. PEO Coatings Fabrication
AZ31B magnesium alloy (SMW Engineering, wt.%: 0.0028 Fe, 0.0103 Si, 0.24 Ce, 0.76 Zn, 0.0008 Ca, 0.19 Mn, 2.72 Al, Mg bal.) was used as a substrate. The substrate surface was cleaned and pre-treated in a two-step procedure: (i) 15 min immersion in alkaline surfactant solution (Bonderite C-AK 4181 L, 90 g/L) at 80–90 °C, and (ii) 4 min acidic etching in H2SO4-based solution at room temperature (Bonderite C-IC 3610, 10 g/L). The etching rate of Mg substrate was kept above 10 g/m2, according to the supplier instructions. Computer-controlled DC power supply (SM 400-AR-8, Delta Elektronika, Zierikzee, Netherlands) with registration of current and voltage signals in time was used to carry out the PEO process. The anodizing system was equipped with a 316 L stainless-steel counter electrode and a 2 L double-jacket glass cell with continuous stirring, and the temperature was maintained at 20 °C using a thermostat. The composition of the electrolytes and the applied electrical parameters for the process are summarized in Table 1. The end of the PEO processes (sparking extinction) was reached after 45–90 s. Deionized water and isopropanol were used for sample rinsing followed by drying in warm air.

Table 1.
Summary of PEO treatment parameters and resulted coatings’ thicknesses.
2.2. Coating Characterization
An eddy-current meter (ISOSCOPE FMP10, Fischer, Sindelfingen, Deutschland) equipped with a FTA3.3H (Fischer, Sindelfingen, Deutschland) probe was used to determine coatings’ thicknesses (summarized in Table 1), taking an average of 10 surface points’ measurements.
The EIS spectra were recorded using a three-electrode electrochemical cell filled with 0.5 wt.% NaCl solution, connected to a computer-controlled potentiostat (GillAC ACM Instruments, Cark, England). The counter graphite and reference silver/silver chloride (Ag/AgCl in 3 M KCl) electrodes were used. The working area of the tested electrode was limited to 1 cm2. The tests were performed after 15 min or 24 h immersion time using a sinusoidal signal of 10 mV amplitude with respect to open circuit potential (OCP), and a frequency sweep from 30 kHz to 10 mHz (50 points in total) was applied. Tests were performed in duplicate using two different samples in order to ensure repeatability. Spectra were simulated using ZView software (Scribner Associates Inc., Southern Pines, NC, USA).
3-component epoxy primer (mixed by weight: 276:87:85 g of Epoxy Primer 37076:Hardener 92133:Thinner C25/90S) was applied on one side of the coated samples using a drawbar to form a ~25 µm-thick layer. Paint was cured at 80 °C for 1 h.
The NSST was carried out for 24 h on painted and for 1 week on non-painted samples, using a 400 L salt spray chamber (CCM-MX, CCI-Sociedad Española para el Control de Calidad e Instrumentación, S.L., Mataro) with a 5% NaCl fog in accordance with ASTM B117 standard. The back side and edges of the painted samples were masked, and the coated and painted side was scratched before salt spray testing. The 1.5 cm scratch was made in the center of the samples with a certificated tool (ISO 17872) with 0.5 mm tungsten carbide tip. Test rating was evaluated according to ASTM D 1654 standard. Before the measurement, the corrosion products were gently removed with abrasive P1200 grit paper. The corrosion progress was assessed by image analysis (ImageJ software (NIH, Bethesda, MD, USA)) for non-painted samples as corroded surface area and for painted samples as the corroded distance defined as “one sided” scribe creepage, that is from the original scribe line to the creepage front. For all salt spray tests, triplicate samples were used.
After NSST, the depth of corrosion progression into the substrate as well the coatings’ morphologies were examined using scanning electron microscopy (SEM, JEOL JSM-6400, JEOL Ltd., Tokyo, Japan) equipped with an energy dispersive X-ray (EDS) microanalysis facility. Accelerating voltage was 20 kV and the working distance was 15 mm. Elements’ concentrations were determined from three different samples’ area analysis. The coated materials’ cross-sections were prepared by the embedding of the specimens in epoxy resin followed by gradual grinding with SiC abrasive paper from P120 to P1200 and polishing with 1 μm diamond paste.
For determination of crystal phases composition of the coatings, Philips X’Pert X-ray diffractometer (Cu Kα = 1.54056 Å) was used. XRD analyses were performed using HighScore Plus software (Malvern Panalytical Ltd., Malvern, UK).
Surface texture was studied with Alicona InfiniteFocusSL (Alicona Imaging GmbH, Raaba/Graz, Austria), a focus variation optical profilometer with 50× surface magnification.
Paint adhesion of CCC and PEO coatings was tested by 6 lines cross-cut with 1 mm spacing, applied using a certified tool designed for this test (in accordance with EN ISO 2409), followed by application and pulling off of adhesive tape from the surface. Dry adhesion was tested on samples after painting and curing and wet adhesion following 7 days NSST exposure of painted samples. All paint adhesion tests were repeated on three specimens and the rating was calculated as an average result.
3. Results
3.1. Electrical Response of Flash-PEO
Varied DC PEO conditions were evaluated, setting the voltage limit at 350 or 400 V and keeping the processes’ duration below 90 s and final coating thickness up to 5 µm. The process parameters were optimized to keep the energy consumption as low as possible. The voltage–time responses acquired during the studied PEO processes (Figure 1) show characteristic shape of galvanostatic anodizing conditions with: (i) fast initial voltage growth corresponding to barrier MgO layer formation, (ii) subsequent voltage slope reduction associated with the commencement of plasma micro-discharges, and (iii) reaching the set voltage. From the moment the set voltage was reached, a gradual extinction of sparking was observed until the current flow was completely stopped by dielectric barrier formation or, alternatively, the process was stopped earlier in order to avoid too strong and destructive micro-discharges observed on samples’ sharp edges.
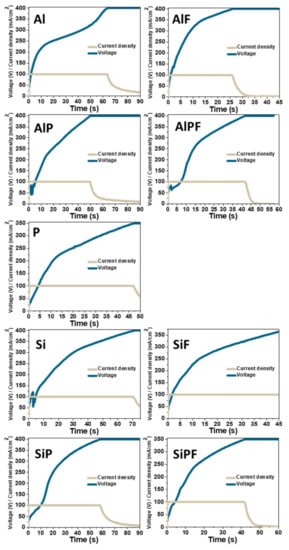
Figure 1.
Current density/voltage–time curves registered during PEO processes in varied electrolytes.
All fabricated coatings had a perfectly uniform appearance and thickness of 2–5 µm (Table 1). Interestingly, the addition of fluoride to Al, Si, AlP, and SiP electrolytes caused much quicker growth of PEO layer, while the time of the process was much shorter, e.g., AlP duration of 90 s and thickness of 2 µm vs. AlPF 60 s and thickness of 5 µm. In the electrolyte based on P, the addition of fluorides caused formation of a poor-quality and non-uniform PEO coating, and for this reason, it was no longer taken to the next steps of the examination.
3.2. FPEO and CCC Performance under Corrosive Media
The electrochemical impedance spectroscopy (EIS) measurements were carried out to evaluate the anticorrosion properties of the CCC reference sample and PEO coatings. Taking the values of total impedance modulus |Z|10 mHz from Bode plots allows for quantitative discrimination between the anticorrosion performance of the coatings in corrosive media. A summary of the reached total impedance modulus values presented in terms of the coatings’ thickness and energy consumption is shown in Figure 2.

Figure 2.
(a) Plot summarizing the values of total impedance modulus obtained from the Bode plots from CCC reference sample and studies PEO coatings following 15 min immersion in 0.5% NaCl in relation to the layer thickness. (b) Summary of the FPEO processes’ energy consumption calculated per 1 µm of obtained coating thickness in relation to final thickness of the layers. (c) Comparison of energy consumption vs. the final coatings’ thickness.
From Figure 2a, it is clear that the CCC reference sample performs better than only two of the PEO coatings (Al and AlF samples) but shows much worse performance compared with the seven other PEO coatings. The total impedance modulus values for these coatings exceeded that of the CCC sample by one to even more than two orders of magnitude. The best results were obtained for AlPF and SiPF recipes. In context of the coating thickness, it may be concluded that it is probably important but not the determining parameter for corrosion protection. For instance, CCC having about 11 µm thickness, about twice greater than the thickest PEO coating, does not provide the best anticorrosion performance. On the other hand, in the group of 2 and 3 µm-thick PEO coatings, there are both high and low corrosion-resistant coatings. These facts confirm that a composition and structure of protective layer are more important than thickness. However, since the best results were obtained for the 5 µm thick PEO coatings, thickness still has quite a high influence on the final coating properties, ensuring good protection from corrosion.
The graphical representation summarizing energy consumption in relation to thicknesses of the obtained PEO coatings is presented in Figure 2b. It needs to be highlighted that our goal was not to get the thinnest coating possible, just not thicker than CCC. The energy consumption of the coating formation was calculated based on the current density– and voltage–time plots. All of the PEO processes required relatively low energy, in the range 0.66–4.3 kW h m−2 µm−1, to form the 2–5 µm-thick protective layers in 45–90 s; moreover, most of the recipes (7 of 9) do not reach 2 kW h m−2 µm−1. These values might be considered satisfactory and economically reasonable for the industries that seek to introduce the PEO process as a method of corrosion protection of Mg alloys. The extremely short time of treatment and low energy consumption of the process allows it to be classified as a “flash”-PEO (FPEO herein).
It is important to mention that a thin coating does not necessarily lead to a low energy consumption. For example, the lowest energy (AlPF and SiPF) coatings are the thickest of all of them (5 µm) and are the most corrosion-resistant. It can also be recognized that the thinnest Al and AlP coatings required relatively more energy for the PEO process and show poor corrosion protection. The rest of the two- and three-componential electrolytes show similar energy consumption. Notably, fluoride addition always leads to significant lowering of used energy in comparison to the F−-free analogue solutions (Figure 2b).
An interesting correlation was found between total impedance modulus and energy consumption (Figure 2c). Clearly, the lower the energy consumption, the better corrosion resistance. That is undoubtedly related to the current drop observed at an early stage during PEO process. The current drop is caused by the impedance of the coating that quickly reaches the highest possible value for the defined voltage limit. In other words, it means that all the intermetallic particles were uniformly oxidized, so that the coating is homogeneous, and the resultant anticorrosion performance is high.
3.3. NSST of Unpainted and Painted Scratched Coatings
After preliminary EIS screening of the anticorrosion properties of FPEO coatings, the best four recipes (SiP, SiPF, AlP, AlPF) have been chosen for more detailed investigations. Three non-painted samples of each FPEO coating and CCC were used for the NSST experiment. The total duration of exposure to salt fog (5% NaCl) was 24 h, with meantime check-up break after 12 h. The pictures of samples before and after the test with corresponding evaluation of corroded surface area percentage and the resulted rating (according to ASTM D 1654 standard) are shown in Figure 3. The final result represents the average value calculated for three repeats.
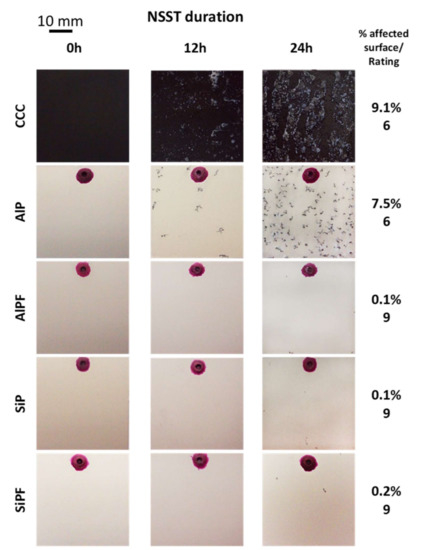
Figure 3.
Macrographs of selected FPEO coatings and CCC before and after NSST of unpainted samples. Rating according to ASTM D 1654 calculated after 24 h (average of three specimens).
It is clear that three out of four types of the non-painted FPEO coatings (AlPF, SiP, SiPF) showed a superb corrosion resistance. These were completely intact by corrosion after 12 h, while CCC already showed a lot of corrosion stains and occasional pits. After 24 h, some very small and few corrosion sites appeared on the surface of successful FPEO coatings. According to ASTM D 1654, the total corroded areas of 0.1% (for AlPF, SiP) and 0.2% (SiPF) gave these coatings 9 points in a 10-point scale rating, while 9.1% of the corroded area of CCC was rated as 6.
Since Mg is strongly susceptible to corrosion, it must be coated with a paint in most practical applications. For this reason, NSST studies on painted and scratched coatings are the best way for simulating the corrosion progress in real systems exposed to environment. Only the best three recipes selected from NSST of non-painted samples (AlPF, SiP, SiPF) were taken for this test. As before, three samples of each type were taken into consideration to calculate the average final rating. The macrographs of painted and scratched FPEO and CCC coatings before and after 1 week of NSST are presented in Figure 4.
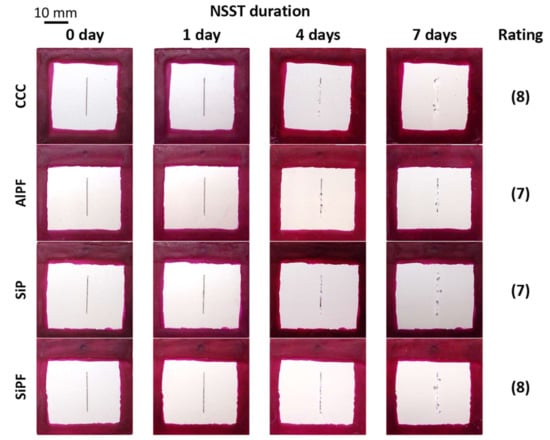
Figure 4.
Macrographs of corrosion progress on CCC, AlPF, SiP, and SiPF painted and scratched samples during one week of NSST with corresponding rating evaluations.
Creepage analysis based on the top views of the coatings’ surfaces confirms that the corrosion resistance of the painted CCC coating (rating 8) is slightly better than that of AlPF and SiP (rating 7), and comparable with that of SiPF (rating 8). Regardless of the resulted ratings, the calculated average filiform corrosion lengths from three samples differed insignificantly in the cases of CCC (0.987 mm), SiPF (0.937 mm), and AlPF (1.097 mm), and only for SiP was the average value of 1.623 mm relatively higher than the others.
Taking into account a combination of the presented results so far: (i) the highest total impedance modulus with the (ii) the lowest energy consumption, (iii) an excellent anticorrosion performance of non-painted sample (rating 9), and (iv) comparably good results of painted samples in NSSTs (ratings 8 and 7), SiPF and AlPF coatings stood out as potential candidates for CCC replacement. The SiPF, which is equal in energy consumption to AlPF, slightly inferior to it in non-painted, but better in painted state after NSST, has been fully characterized and published elsewhere [24]. Therefore, the following sections investigate deeper the AlPF coating in comparison to CCC. Since painted AlPF specimens were rated lower than CCC in NSST, it was particularly interesting to examine the difference in depth of corrosion and undercoating propagation in the cross-sections of an average of the three specimens for each coating. SEM cross-sectional micrographs of the painted and scratched specimens after 1 week of NSST (Figure 5) disclosed that corrosion attack in CCC was clearly deeper than in the AlPF specimens. Higher magnification images at the edge of the scratch show perfect adhesion of AlPF coating to the substrate. Micrographs taken far away from the scratch under the paint show the beginning of corrosion pits’ formation in CCC coating, indicating its inferior barrier properties.
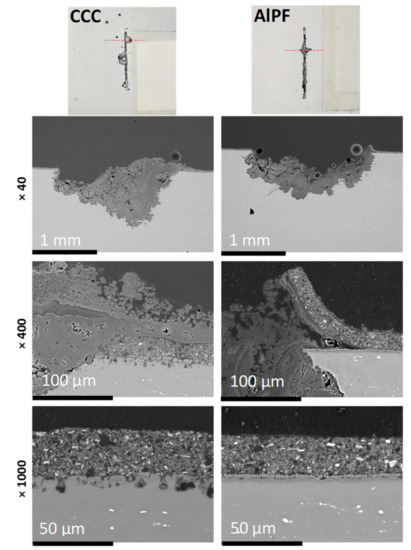
Figure 5.
Macrographs of corrosion progress on AlPF and CCC painted and scratched samples after one week of NSST and after removal of the corrosion products with corresponding rating evaluations. SEM backscattered electrons imaging (BEI) cross-sectional micrographs illustrate the corrosion progress of the AlPF and CCC painted and scratched samples after one week of NSST: 40× general view of the scratched surfaces, 400× edge of the scratch, 1000× far away from the scratch.
3.4. AlPF Coating Composition
The chemical composition of AlPF coating investigated by EDS has disclosed and increased content of electrolyte species Al, F, and P (14.4, 4.7, and 4.2 at.%, respectively) and 26 at.% of oxygen. XRD analysis shows strong signals form Mg and intermetallic βMg17Al12, corresponding to material substrate, as well as MgO, MgF2, and Al2O3 crystalline phases from the coating (Figure 6). The formation of Al2O3 is attributed to the decomposition of the aluminate species of the electrolyte under plasma discharge; although its presence is not significant, it may have contributed to the enhanced corrosion resistance of the coating, due to formation of Al(OH)3 that seals the pores during coating hydration in immersion tests and NSST. The prominent presence of MgF2, a low soluble phase that is known to passivate Mg, contributes to good barrier properties of the coating.
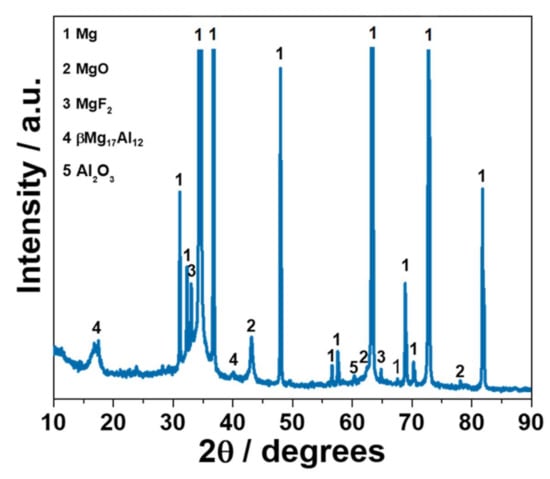
Figure 6.
X-ray diffraction (XRD) patterns of AlPF coatings.
3.5. Corrosion Damage Morphology
The degradation morphologies of the CCC and AlPF (Figure 7) coatings before and after immersion in 0.5% NaCl followed by EIS measurements were evaluated by scanning electron microscopy (SEM).
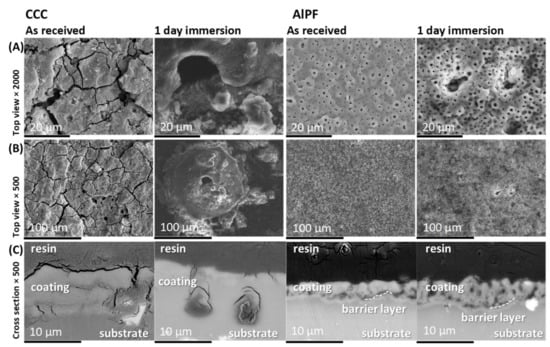
Figure 7.
SEM microphotographs of top views (secondary electron images (SEI)) and cross-sections (BEI) of CCC and AlPF coatings before and after 1 day of immersion in 0.5% NaCl and EIS measurement.
The as-received CCC has a typical cracked morphology of a conversion layer which is about 11 µm thick. After 1 day of immersion and EIS measurement, relatively large corrosion pits develop under the CCC layer, as visible in the cross-section image, and some dissolution of the CCC layer is also visible.
The as-received AlPF coating shows a typical porous PEO morphology (top view) with a two-layered structure comprising a thick outer porous layer and a thin barrier layer perfectly adhered to the substrate (cross-section). The coating thickness is approximately 5 µm. The corrosion attack is likely to progress through relatively deep and large micro-discharge craters that have formed in a few isolated locations in some of the specimens during flash-PEO treatment and are visible in a 1-day immersion micrograph (Figure 7). These features are further characterized and their effect on coating degradation is discussed in the following sections.
3.6. Electrochemical Impedance Response of Selected Coatings
Figure 8 shows Bode plots of EIS spectra of the CCC and AlPF coatings following the immersion in 0.5% NaCl solution for 15 min and 24 h. In all cases, the behavior could be described with two time-constants. However, in order to take into account the different character of coating degradations, different physical meanings were ascribed to the elements of the nested Randles equivalent circuits (Figure 8e) used to fit the experimental data depending on the exposure time and the type of coating. In all the circuits, (i) Rs accounts for the resistance of the electrolyte, (ii) constant phase elements (CPE) were used instead of capacitances in order to account for the non-ideal behavior of the system, and (iii) good fits of the experimental data were obtained with the chi-squared values in the range of 0.001–0.0001 and individual errors < 10%. For the AlPF-coated specimen, the two relaxation processes observed after 15 min of immersion can be ascribed to the response of the outer porous layer at high–medium frequencies (CPEout/Rout) and the intact inner barrier at low frequencies (CPEin/Rin). After 24 h of immersion, the protective properties of the PEO coating clearly diminished and the response appeared to contain more than two time-constants. This indicates that the electrolyte can easily penetrate through the outer part of the PEO coating, which also leads to a chemical degradation of the coating. Due to a strong overlapping, it became impossible to discriminate between the inner and outer coating part responses and the CPEcoat/Rcoat unit was used to represent the general coating response. The response at low frequencies was ascribed to the appearance of the electrochemical activity at the substrate (CPEdl/Rp), represented by the double electric layer capacitance at the electrolyte/metal interface and the polarization resistance.
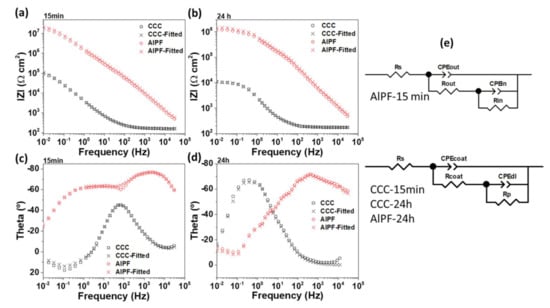
Figure 8.
Bode plots (empty symbols) for AlPF coating and CCC after (a,c) 15 min and (b,d) 24 h immersion in 0.5% NaCl with fittings (cross symbols) simulated with equivalent circuits (e).
In case of CCC coating, the response at high/medium frequencies is associated with the presence of the coating (Rcoat/CPEcoat) and the one at low frequencies is ascribed to the electrochemical activities in the substrate/electrolyte interface (CPEdl/Rp). The corresponding electrochemical parameters of the equivalent circuits used to fit the experimental data are presented in Table 2. With regards to those, it is particularly worth to note the strong dielectric properties of the FPEO coating (CPEout values) of more than two orders of magnitude difference in Rcoat values and Rp values of the CCC and AlPF coatings after 24 h of immersion.
Table 2.
EIS fitted data of flash-PEO and CCC-coated AZ31B alloy following immersion in 0.5 wt.% NaCl (R given in Ω cm2, CPE given in S s−n cm−2).
Overall, the presented EIS data clearly prove that PEO coatings show much better corrosion performance compared to CCC, which can be related to the microstructure and composition of the coating. Although both coatings show similar (about one order of magnitude) drop of corrosion protection expressed by total impedance modulus, the |Z|10 mHz for AlPF is at all times two orders of magnitude greater than that of CCC, which is related to its greater barrier effect and capacitive behavior at low frequencies.
3.7. Optical Profilometry Micrographs and Surface Roughness
To evaluate another important aspect affecting anticorrosion coating performance, the surface textures of the CCC and AlPF coatings in the as-received condition and after EIS measurements following 24 h immersion in 5% NaCl were characterized by optical profilometry (Figure 9, Table 3).
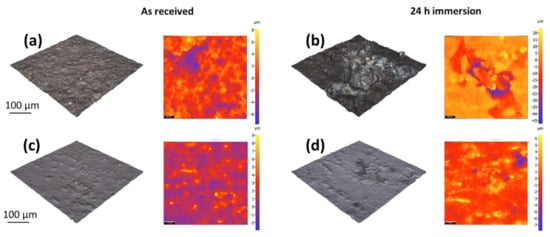
Figure 9.
Optical profilometry micrographs and surface roughness parameters of the CCC (a, b) and AlPF PEO (c, d) coatings, including three-dimensional (3D)-rendered images and two-dimensional (2D) topographical maps and corresponding calculated surface parameters.
Table 3.
Surface texture parameters of CCC and AlPF coatings before and after immersion in 0.5 wt.% NaCl for 24 h and EIS measurements.
The as-received AlPF coating shows a more uniform surface and its calculated roughness parameters, Sa and Sv, are approximately twice as low as those for CCC. Sv, in particular, can be associated with the crater depth and crack depth in AlPF and CCC coatings, respectively. ~4 µm craters (Table 3) evidently correspond to the likes of those disclosed in Figure 7 for AlPF coating.
Overall, the inherent porosity of FPE and microcracks in CCC are beneficial for paint adhesion. Clearly, following 24 h of immersion and the EIS test, the CCC experienced a significant damage, visible in three-dimensional (3D)-rendered images and topographical maps with height variations of the order of ±35 µm. The drastic, 3–5 times increase in Sp, Sv, Sz, and S10z parameters (Table 3) can be ascribed to pitting and building up of corrosion products on the surface around the pits.
The AlPF coating, on the other hand, shows only a modest increase in all four parameters, with the pit depth (Sv) not exceeding ~8 µm. These pits are likely originating at the bottom of the craters (left by intense micro-discharges) that were previously described. These features explain the degree of the drops in the total impedance moduli after 24 h immersion for AlPF and CCC coatings.
3.8. Dry and Wet Paint Adhesion
As was mentioned previously, good paint adhesion of the newly developed coatings is a prerequisite parameter limiting coatings’ applicability. For this reason, dry and wet paint adhesion tests were conducted by cross-cut pull-off tests (Figure 10).
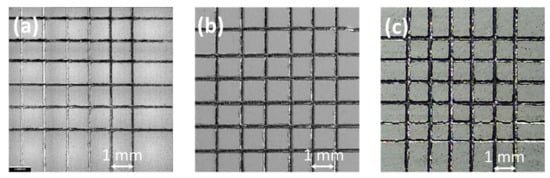
Figure 10.
Cross-cut paint adhesion test results on (a) dry and (b) wet (after 1 week of NSST) AlPF coatings and (c) wet CCC.
The obtained results show an excellent paint adhesion to CCC as well as to AlPF, which is related to the top-layer porosity of FPEO coatings advantageous for paint absorption. The coatings passed both dry and wet tests with maximum rating (0) in accordance with EN ISO 2409, from three repeats, as no paint pull-off occurred along the cross-cut lines. This demonstrates that AlPF coating is a fully adequate alternative to CCC from paint adhesion and corrosion resistance standpoints.
4. Conclusions
- DC flash-PEO coatings were successfully developed for AZ31B Mg alloy employing design of the electrolyte composition and implementing current density and voltage limits.
- The energy consumption of the PEO processes remained relatively low, ~1 kW h m−2 µm−1 for SiPF and AlPF, which makes only 5 kW h m−2 of energy required to produce the overall 5 µm-thick coatings.
- A correlation between the energy consumption of the FPEO process and corrosion resistance was found, demonstrating that the lower the energy consumption of the respective FPEO process, the better corrosion resistance of the resulted coating.
- The preliminary EIS screening of anticorrosion properties of the FPEO coatings had an adequate and reliable correlation with NSST results for both painted and non-painted samples.
- The overall evaluation of the coatings’ corrosion protection (EIS, NSST, paintability) confirmed that two FPEO coatings (SiPF and AlPF) can be an adequate substitute for CCC.
- Implementation of PEO coatings’ protection is still pending the economic justification of the use of a current-consuming process instead of an electroless one. It is necessary to draw attention to the fact that a green solution may never be as cheap as current harmful technologies but can offer competitive advantages in terms of corrosion protection.
Author Contributions
Conceptualization, E.W., E.M. and R.A.; methodology, E.W., E.M. and R.A.; software, E.M. and R.A.; validation, E.W. and M.M.; formal analysis, E.W.; investigation, E.W.; resources, E.M. and R.A.; data curation, E.W.; writing—original draft preparation, E.W., M.M., E.M. and R.A.; writing—review and editing, E.W., M.M., E.M. and R.A.; visualization, E.W.; supervision, E.W., E.M. and R.A.; project administration, E.M.; funding acquisition, E.M. and R.A. All authors have read and agreed to the published version of the manuscript.
Funding
The authors gratefully acknowledge the support of the ALMAGIC project (H2020 Clean Sky 2, Grant agreement Nº 755515), RTI2018-096391-B-C33 (MCIU/AEI/FEDER, UE), and ADITIMAT-CM (S2018/NMT-4411). M. Mohedano is grateful for the support of RYC-2017-21843.
Data Availability Statement
The data are not publicly available due to their exploitation in ongoing research.
Conflicts of Interest
The authors declare no conflict of interest.
References
- Yerokhin, A.L.; Nie, X.; Leyland, A.; Matthews, A.; Dowey, S.J. Plasma electrolysis for surface engineering. Surf. Coat. Technol. 1999, 122, 73–93. [Google Scholar] [CrossRef]
- Chen, D.; Wang, R.; Huang, Z.; Wu, Y.; Zhang, Y.; Wu, G.; Li, D.; Guo, C.; Jiang, G.; Yu, S.; et al. Evolution processes of the corrosion behavior and structural characteristics of plasma electrolytic oxidation coatings on AZ31 magnesium alloy. Appl. Surf. Sci. 2018, 434, 326–335. [Google Scholar] [CrossRef]
- Sankara Narayanan, T.S.N.; Park, I.S.; Lee, M.H. Strategies to improve the corrosion resistance of microarc oxidation (MAO) coated magnesium alloys for degradable implants: Prospects and challenges. Prog. Mater. Sci. 2014, 60, 1–71. [Google Scholar] [CrossRef]
- Blawert, C.; Dietzel, W.; Ghali, E.; Song, G. Anodizing treatments for magnesium alloys and their effect on corrosion resistance in various environments. Adv. Eng. Mater. 2006, 8, 511–533. [Google Scholar] [CrossRef]
- Guo, K.W. A Review of Magnesium/Magnesium Alloys Corrosion and its Protection. Recent Patents Corros. Sci. 2010, 2, 13–21. [Google Scholar] [CrossRef]
- Barati Darband, G.; Aliofkhazraei, M.; Hamghalam, P.; Valizade, N. Plasma electrolytic oxidation of magnesium and its alloys: Mechanism, properties and applications. J. Magnes. Alloy. 2017, 5, 74–132. [Google Scholar] [CrossRef]
- Lv, G.H.; Chen, H.; Wang, X.Q.; Pang, H.; Zhang, G.L.; Zou, B.; Lee, H.J.; Yang, S.Z. Effect of additives on structure and corrosion resistance of plasma electrolytic oxidation coatings on AZ91D magnesium alloy in phosphate based electrolyte. Surf. Coat. Technol. 2010, 205, S36–S40. [Google Scholar] [CrossRef]
- Ma, Y.; Nie, X.; Northwood, D.O.; Hu, H. Systematic study of the electrolytic plasma oxidation process on a Mg alloy for corrosion protection. Thin Solid Films 2006, 494, 296–301. [Google Scholar] [CrossRef]
- Rehman, Z.U.; Ahn, B.H.; Jeong, Y.S.; Song, J.I.; Koo, B.H. The influence of various additives on the properties of PEO coatings formed on AZ31 Mg Alloy. Surf. Rev. Lett. 2016, 23, 1650006. [Google Scholar] [CrossRef]
- Guo, H.F.; An, M.Z. Growth of ceramic coatings on AZ91D magnesium alloys by micro-arc oxidation in aluminate-fluoride solutions and evaluation of corrosion resistance. Appl. Surf. Sci. 2005, 246, 229–238. [Google Scholar] [CrossRef]
- Wang, L.; Chen, L.; Yan, Z.; Wang, H.; Peng, J. Effect of potassium fluoride on structure and corrosion resistance of plasma electrolytic oxidation films formed on AZ31 magnesium alloy. J. Alloys Compd. 2009, 480, 469–474. [Google Scholar] [CrossRef]
- Kazanski, B.; Kossenko, A.; Zinigrad, M.; Lugovskoy, A. Fluoride ions as modifiers of the oxide layer produced by plasma electrolytic oxidation on AZ91D magnesium alloy. Appl. Surf. Sci. 2013, 287, 461–466. [Google Scholar] [CrossRef]
- Mu, W.; Han, Y. Characterization and properties of the MgF2/ZrO2 composite coatings on magnesium prepared by micro-arc oxidation. Surf. Coat. Technol. 2008, 202, 4278–4284. [Google Scholar] [CrossRef]
- Sah, S.P.; Aoki, Y.; Habazaki, H. Influence of phosphate concentration on plasma electrolytic oxidation of AZ80 magnesium alloy in alkaline aluminate solution. Mater. Trans. 2010, 51, 94–102. [Google Scholar] [CrossRef]
- Ghasemi, A.; Raja, V.S.; Blawert, C.; Dietzel, W.; Kainer, K.U. The role of anions in the formation and corrosion resistance of the plasma electrolytic oxidation coatings. Surf. Coat. Technol. 2010, 204, 1469–1478. [Google Scholar] [CrossRef]
- Ma, H.; Li, D.; Liu, C.; Huang, Z.; He, D.; Yan, Q.; Liu, P.; Nash, P.; Shen, D. An investigation of (NaPO3)6 effects and mechanisms during micro-arc oxidation of AZ31 magnesium alloy. Surf. Coat. Technol. 2015, 266, 151–159. [Google Scholar] [CrossRef]
- Luo, H.; Cai, Q.; Wei, B.; Yu, B.; Li, D.; He, J.; Liu, Z. Effect of (NaPO3)6 concentrations on corrosion resistance of plasma electrolytic oxidation coatings formed on AZ91D magnesium alloy. J. Alloys Compd. 2008, 464, 537–543. [Google Scholar] [CrossRef]
- Hadzima, B.; Kajánek, D.; Jambor, M.; Drábiková, J.; Březina, M.; Buhagiar, J.; Pastorková, J.; Jacková, M. Peo of az31 mg alloy: Effect of electrolyte phosphate content and current density. Metals 2020, 10, 1521. [Google Scholar] [CrossRef]
- Mori, Y.; Koshi, A.; Liao, J.; Asoh, H.; Ono, S. Characteristics and corrosion resistance of plasma electrolytic oxidation coatings on AZ31B Mg alloy formed in phosphate—Silicate mixture electrolytes. Corros. Sci. 2014, 88, 254–262. [Google Scholar] [CrossRef]
- Lu, X.; Prasad, S.; Scharnagl, N.; Störmer, M.; Starykevich, M.; Mohedano, M.; Blawert, C.; Zheludkevich, M.L.; Ulrich, K. Degradation behavior of PEO coating on AM50 magnesium alloy produced from electrolytes with clay particle addition. Surf. Coat. Technol. 2015, 269, 155–169. [Google Scholar] [CrossRef]
- Pezzato, L.; Vranescu, D.; Sinico, M.; Gennari, C.; Settimi, A.G.; Pranovi, P.; Brunelli, K.; Dabalà, M. Tribocorrosion properties of PEO Coatings produced on AZ91 magnesium alloy with silicate- or phosphate-based electrolytes. Coatings 2018, 8, 202. [Google Scholar] [CrossRef]
- Toulabifard, A.; Rahmati, M.; Raeissi, K.; Hakimizad, A.; Santamaria, M. The effect of electrolytic solution composition on the structure, corrosion, and wear resistance of peo coatings on az31 magnesium alloy. Coatings 2020, 10, 937. [Google Scholar] [CrossRef]
- Wierzbicka, E.; Pillado, B.; Mohedano, M.; Arrabal, R.; Matykina, E. Calcium doped flash-peo coatings for corrosion protection of Mg alloy. Metals 2020, 10, 916. [Google Scholar] [CrossRef]
- Wierzbicka, E.; Vaghefinazari, B.; Lamaka, S.V.; Zheludkevich, M.L.; Mohedano, M. Flash-PEO as an alternative to chromate conversion coatings for corrosion protection of Mg alloy. Corros. Sci. 2021, 180, 109189. [Google Scholar] [CrossRef]


Publisher’s Note: MDPI stays neutral with regard to jurisdictional claims in published maps and institutional affiliations. |
© 2021 by the authors. Licensee MDPI, Basel, Switzerland. This article is an open access article distributed under the terms and conditions of the Creative Commons Attribution (CC BY) license (http://creativecommons.org/licenses/by/4.0/).