Article

Dissolution and Online Monitoring of Nd and Pr Oxides in NdF3–PrF3–LiF Electrolytes

SINTEF Industry, P.O. Box 4760 Torgarden, NO-7465 Trondheim, Norway
*
Author to whom correspondence should be addressed.
Metals 2021, 11(2), 326; https://doi.org/10.3390/met11020326
Submission received: 15 January 2021 / Revised: 9 February 2021 / Accepted: 9 February 2021 / Published: 13 February 2021

Abstract

:
Concentrations of dissolved rare earth metal oxides, Nd2O3, and Pr2O3 or their mixtures in different fluoride electrolytes composed of NdF3, PrF3, and LiF at ca. 1040 °C were monitored using a graphite probe inserted into the electrolyte during the dissolution process. Fast voltage sweeps of 100 V/s were applied to the graphite probe, and the current response was measured. As the oxide concentration in the diffusion layer towards the electrode depletes, a passive layer is, at a certain point, formed on the probe, resulting in a current drop. The magnitude of the peak current attained before the formation of the passive layer reflects the concentration of the dissolved oxide and, thus, is applied to determine the oxide concentration. The oxide concentration in the electrolyte samples determined using the inert gas fusion technique showed a good correlation to the peak current determined by the probe.

1. Introduction

The current high demand for neodymium (Nd) and praseodymium (Pr) and their alloys is attributed to their superior magnetic flux density needed for developing very strong permanent magnets [1,2]. These rare earth (RE) metals are mostly extracted from their oxides via molten salt electrolysis. The electrolytic production of Nd and Pr has advantages, such as high purity of end product, low energy consumption, and high efficiency [2,3,4]. The efficiency and environmental footprint of the electrolysis process, however, largely depend on the effective dissolution of the rare earth metal oxide (REO) in the electrolyte. The most suitable electrolyte composition for dissolving REO consists of rare earth fluoride (REF), alkali metal fluoride (AF), and in some cases small amounts of alkali earth metal fluorides (AEF) [2,3,5]. In general, the solubility of the REO increases with increasing content of REF in the fluoride electrolyte [5]. Alkali metal fluoride, usually LiF, is added to reduce the liquidus temperature and improve the ionic conductivity [5] of the electrolyte.
Suitable levels of REO dissolved in the fluoride electrolyte are important for smooth operations during production [2]. This is because oxide depletion in molten fluorides generates perfluorocarbon (PFC) gases, notably CF4 and C2F6 [1,2,6], with very high global warming potentials compared with CO2. Table 1 presents the main cell reactions during the Nd/Pr electrolysis process with their reversible potentials at 1040 °C. The formation of PFC gases occurs at significantly higher potentials than the CO/CO2 formation.
Thus, for efficient and environmentally friendly production, the levels of REO electroactive species dissolved in the fluoride electrolyte must be well controlled. Proper control of oxide levels in the fluoride electrolyte can, however, be challenging for the rare earth metal industry due to the current lack of state-of-the-art monitoring technology as compared with, for example, electrowinning of aluminium metal. The use of modified linear sweep voltammetry to determine the concentrations of dissolved aluminium oxide species in cryolite (Na3AlF6) melts has been reported for primary aluminium production [7,8,9,10,11]. However, no such studies have been reported for RE metal production.
Two principles, namely, voltage and current ramping, may be used to determine the oxide concentration in molten fluoride-based electrolytes with carbon anodes. This phenomenon is triggered by the depletion of dissolved oxide species on the surface of the carbon anode, resulting in the decomposition of the fluoride melt with the generation of PFC gases [10,12]. To explain the principles, the common U = R·I equation, where U is voltage, R is resistance, and I is current, can be used. By ramping the voltage U, the current I will also increase as long as the resistance is constant. If the resistance at the electrode increases (e.g., due to PFC gas generation, which also tends to create gas blockage or electrode passivation), the current will decrease. On the other hand, if the current is ramped, increased resistance, as described above, will cause the voltage U to increase until a point where the power supply reaches its voltage limitation. Hence, the oxide concentration can be related to a rapid increase in the voltage or a rapid decrease in the current, depending on what is controlled, the current or the voltage.
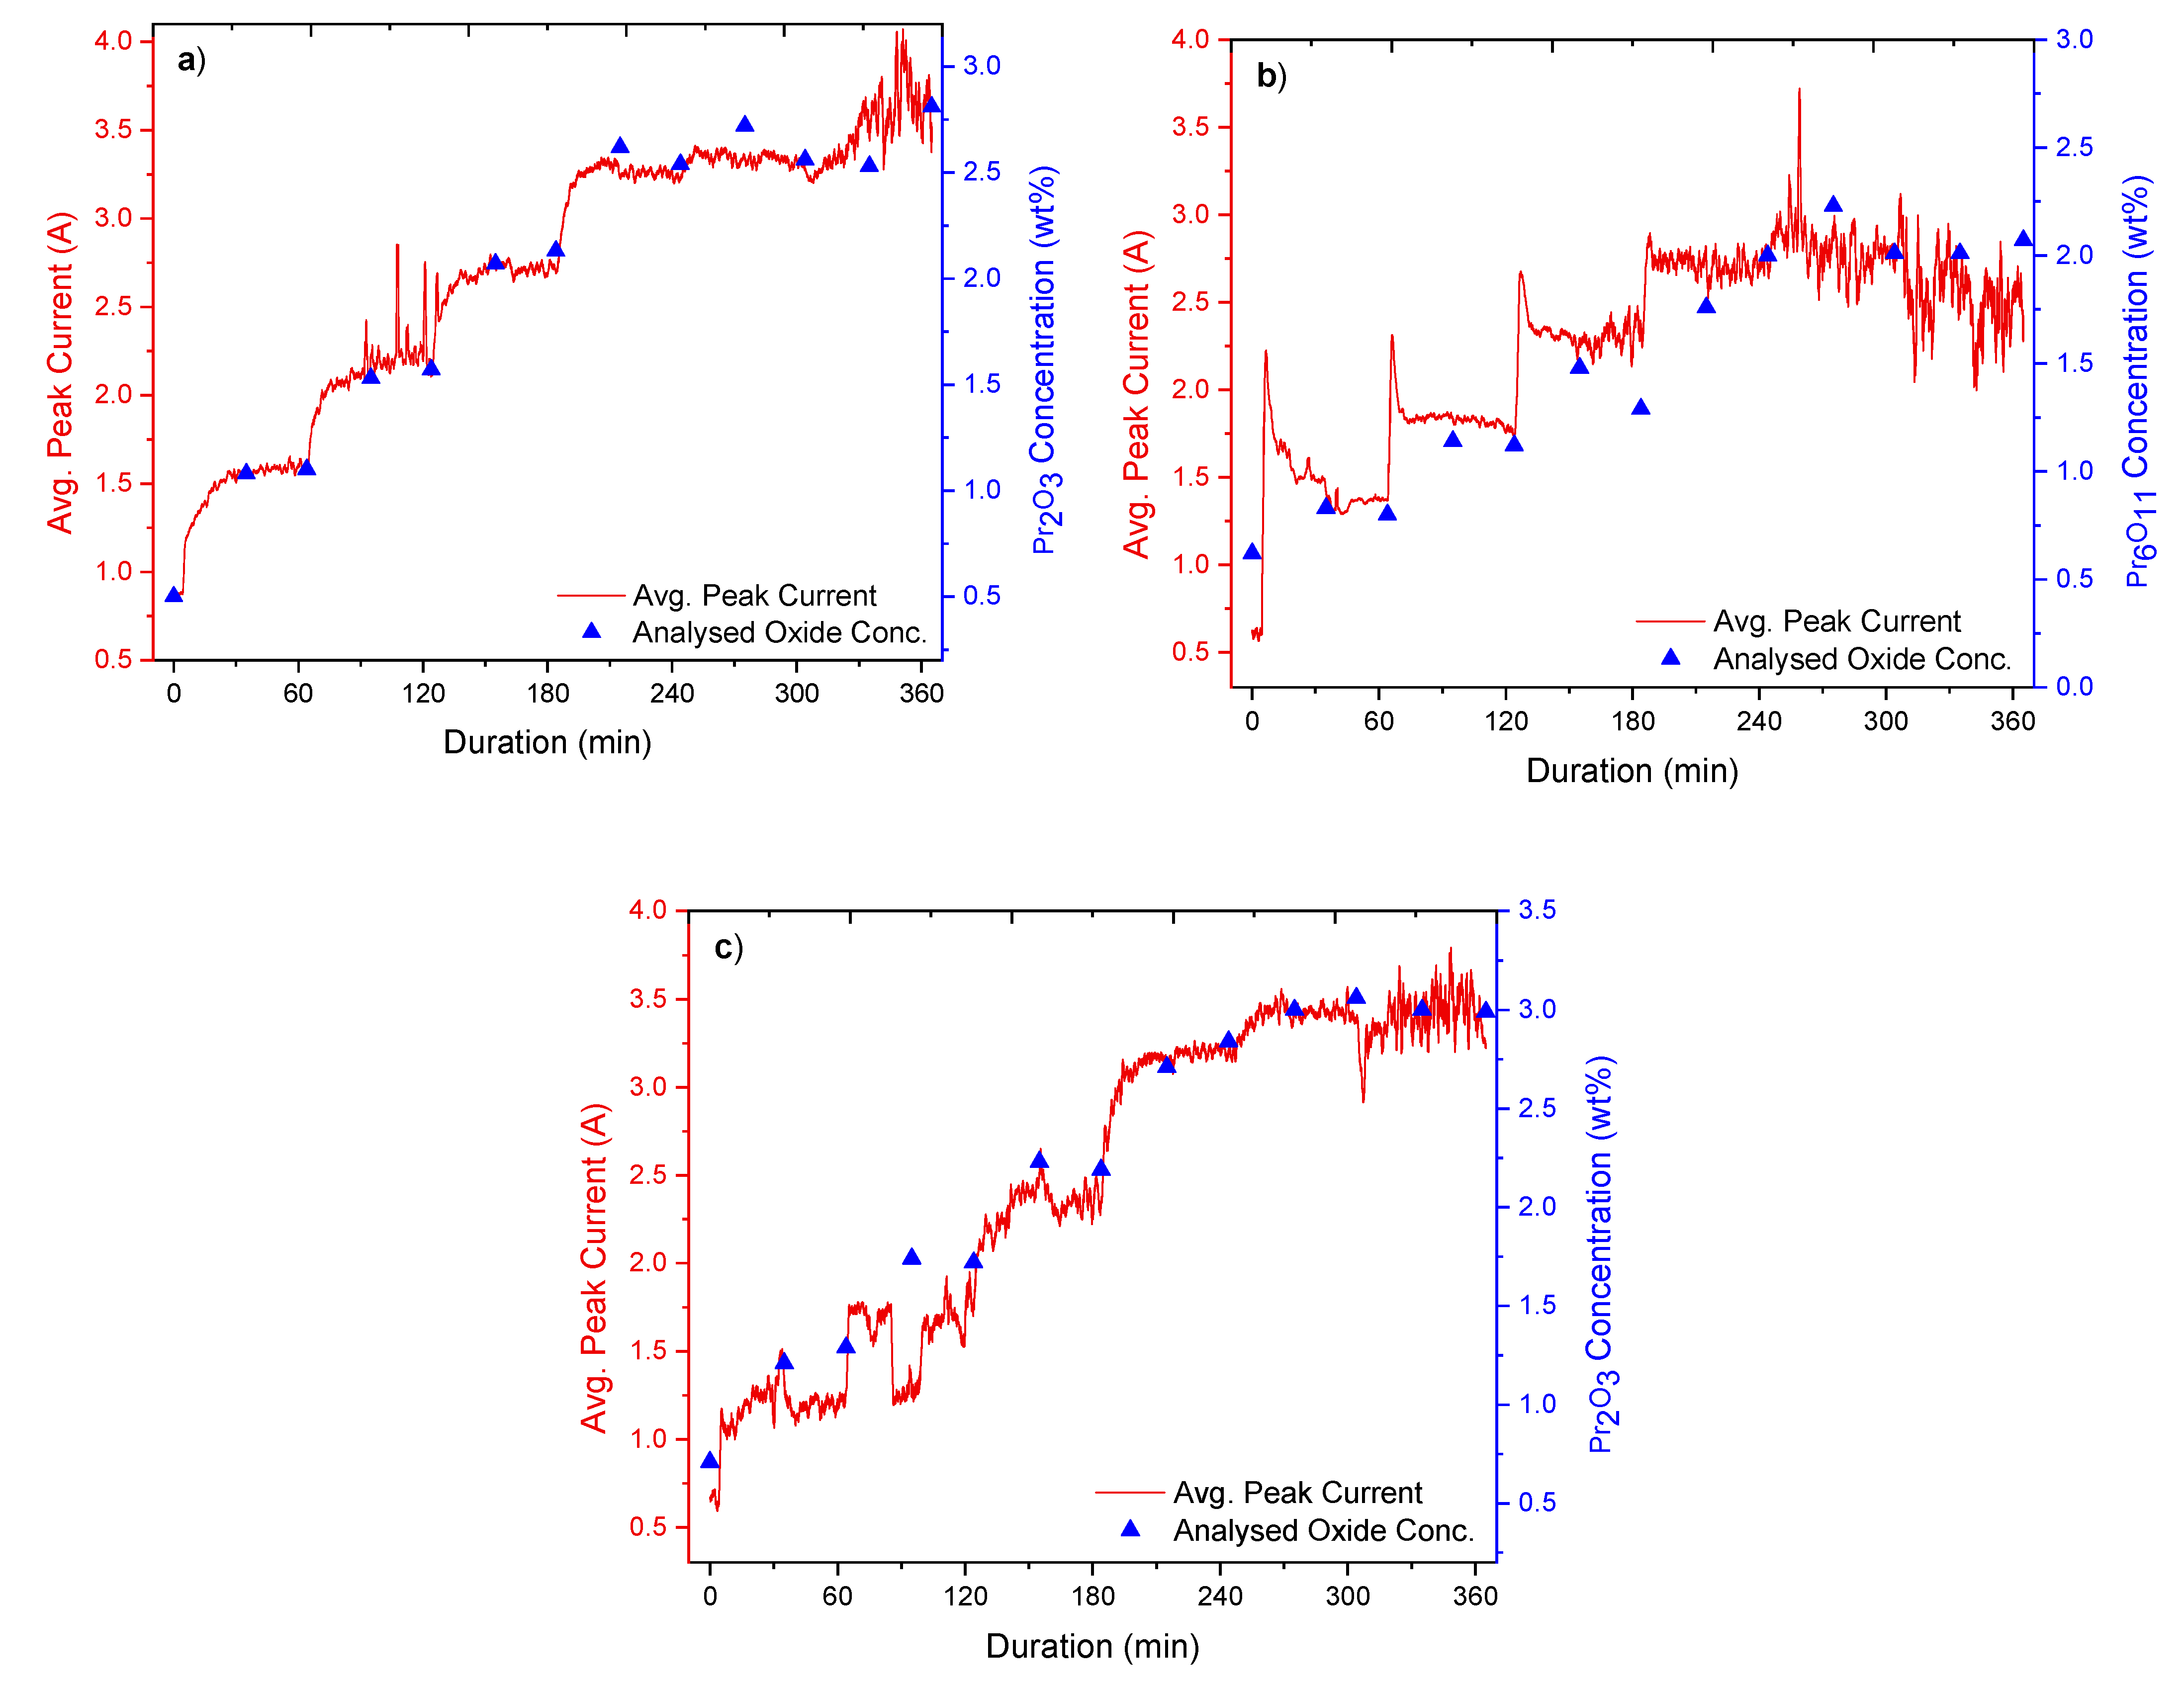
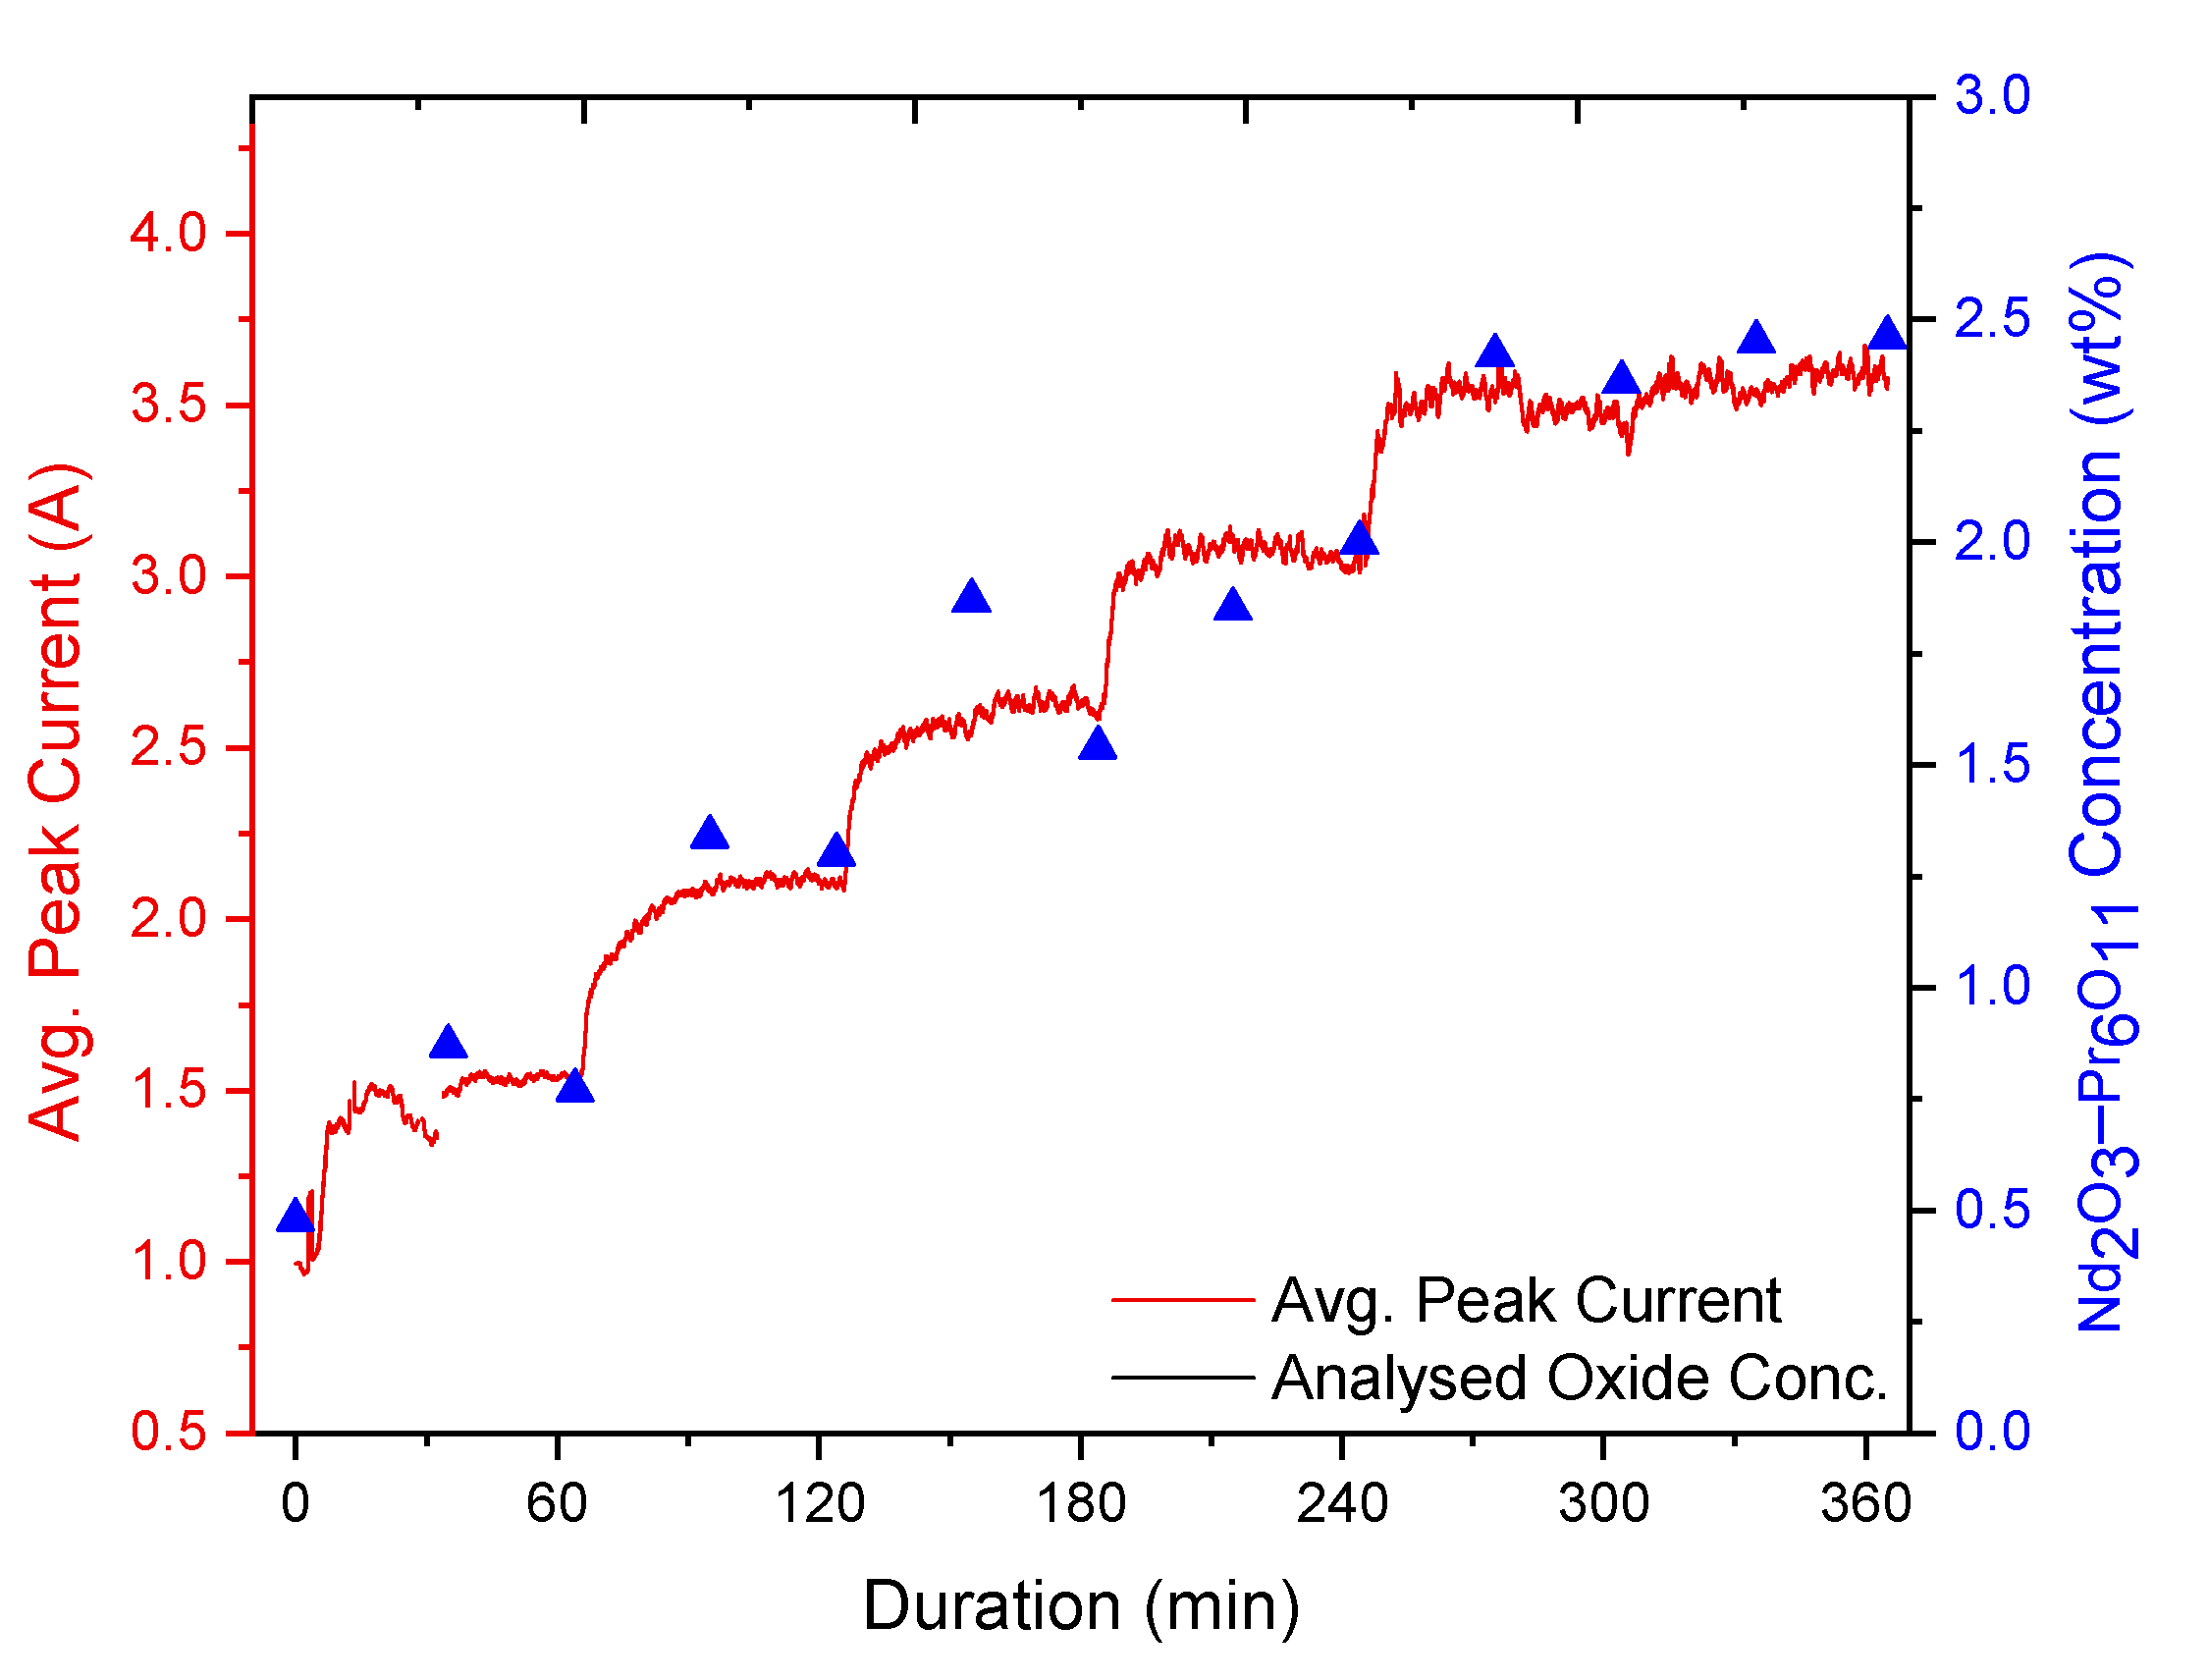
Investigations involving electrolytes for aluminium production have shown that the peak current prior to the passive layer formation increases with increasing oxide concentration [8,10,11,13]. Thus, it is possible to correlate the concentration of the dissolved oxide species with the observed peak current. This makes the voltammetric technique suitable for determining oxide concentrations in fluoride melts using appropriate calibrations gathered from analysed oxide concentration in similar fluoride melts [8].
The present paper reports on a study of the dissolution of REOs in their corresponding LiF–REF electrolyte. The study aims to provide an online means of monitoring oxide concentrations and, as such, controlling the concentration of dissolved REO species during RE metal electrowinning. This involves incorporating fast voltage sweep voltammetry using a graphite probe as a working electrode. The solubility values of Pr and Nd oxides in their corresponding fluoride electrolytes are also determined.

2. Materials and Methodology

The present study was based on the principle of fast voltage ramping to an electrode assembly consisting of a graphite anode and a graphite cathode in fluoride electrolytes. By monitoring the current passing through the electrode assembly during each sweep, the rapid drop in current when the anode surface is depleted in oxide is recorded.
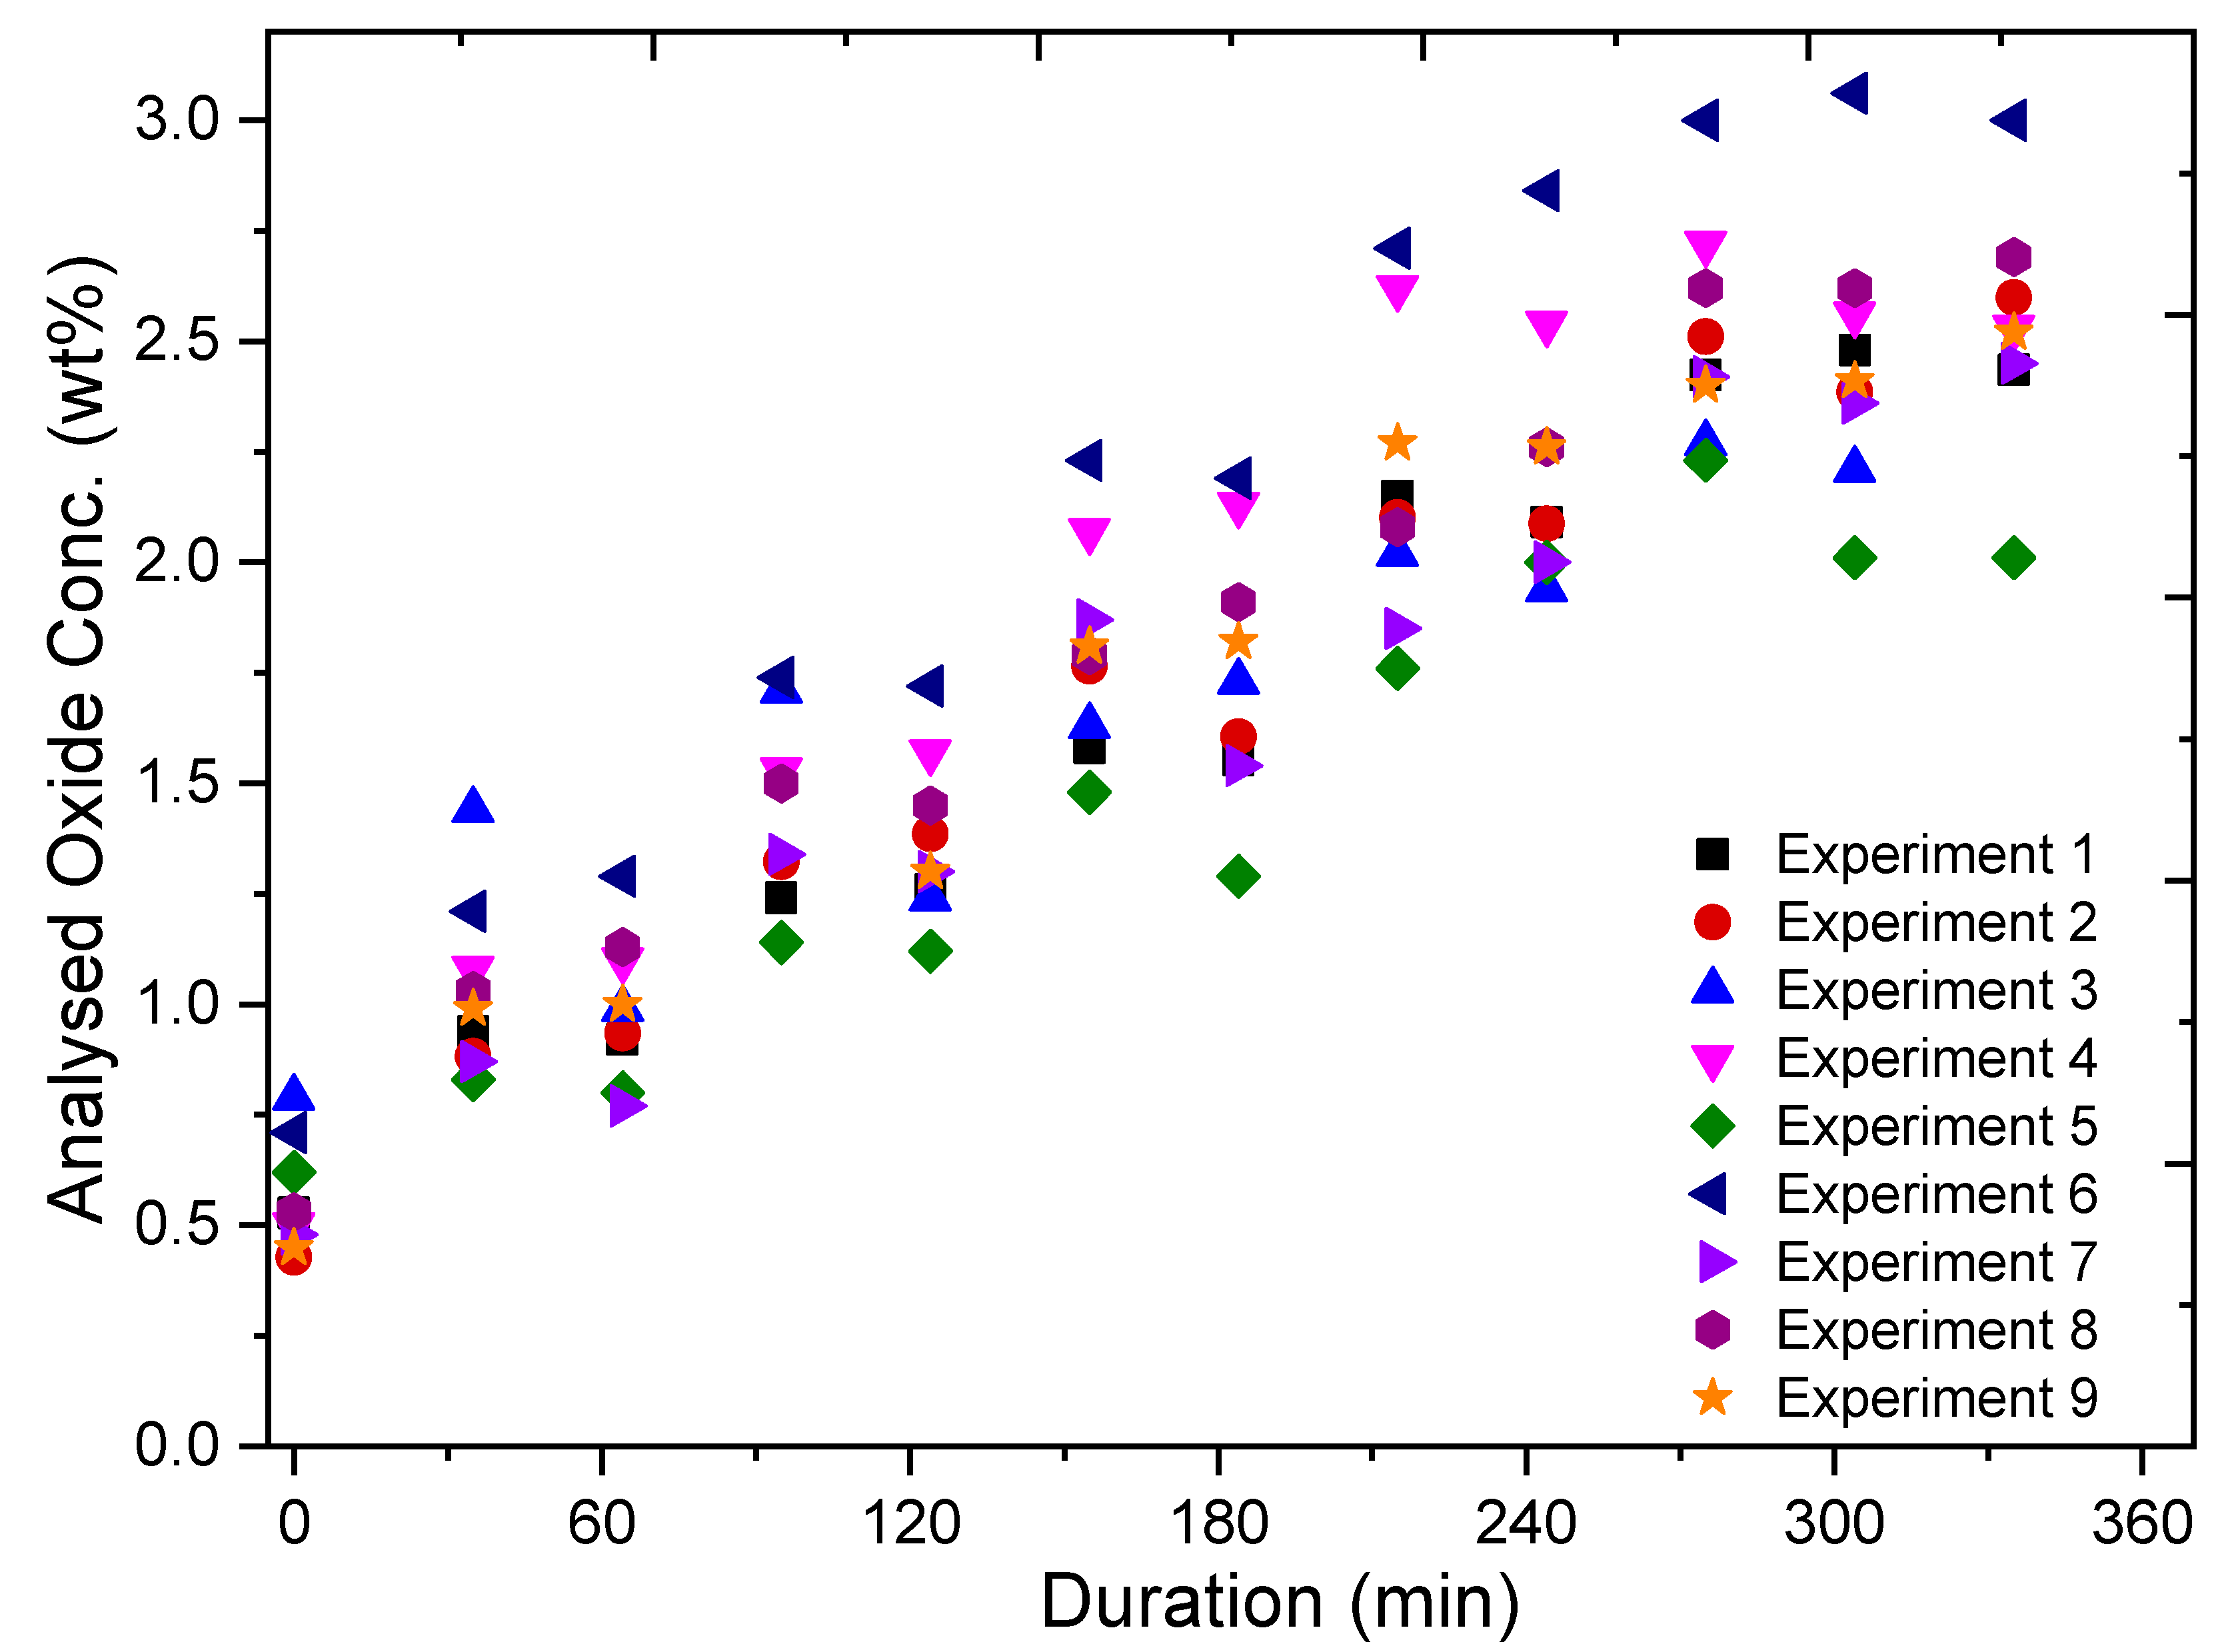
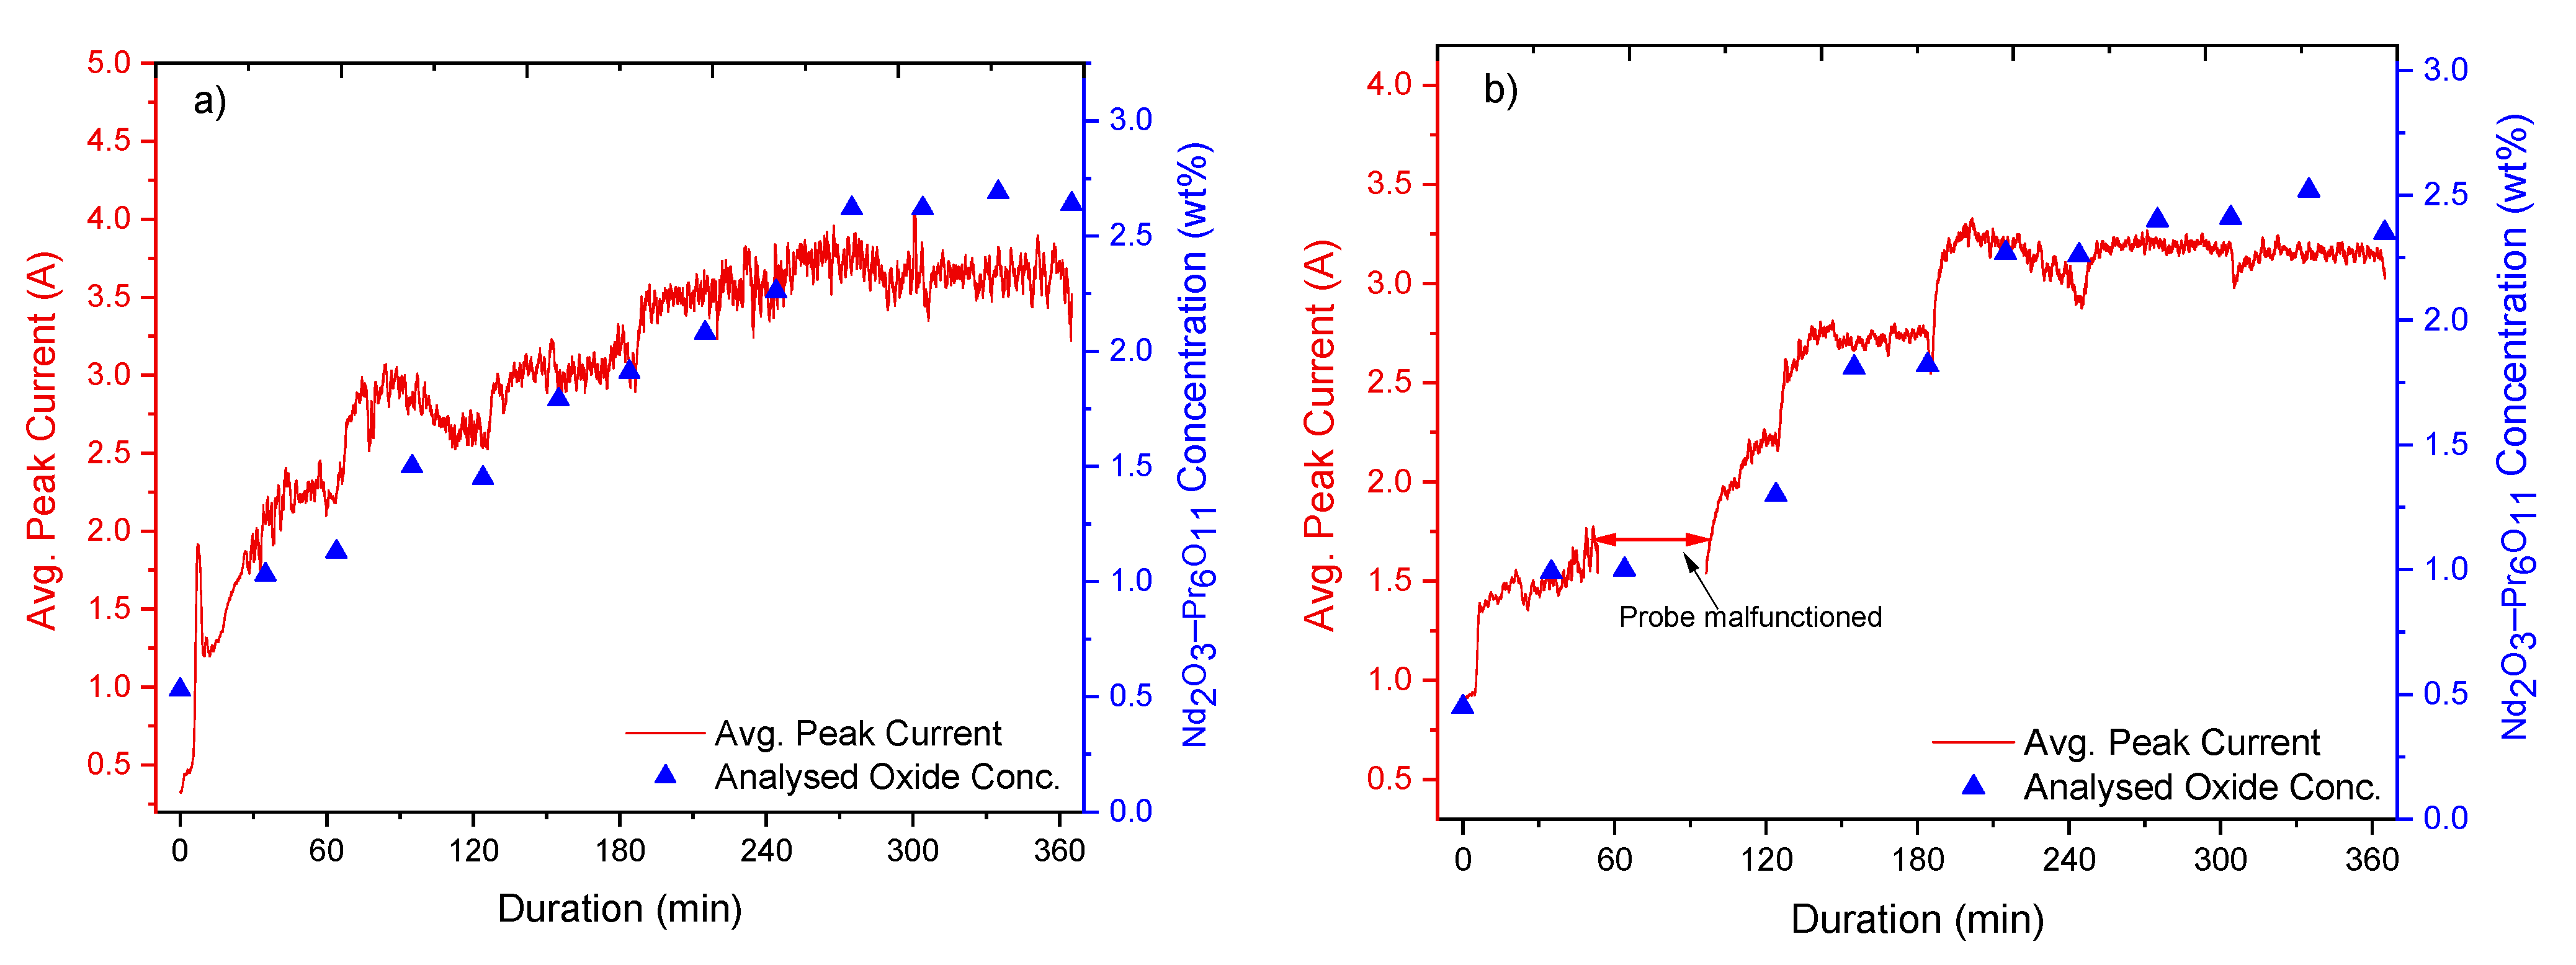
The experiments involved the addition of REOs into their respective fluoride electrolytes, which had been heated up to ca. 1040 °C. Additions were done every 60 min throughout the whole 6 h duration of the experiments, while measurements of the current response from fast voltage ramping were taken continuously. Sampling of the electrolyte was done before every new addition and in the middle between each addition. These samples were later analysed by the inert gas fusion technique using a LECO (ON836) apparatus for determining the oxygen content. The principle of the inert gas fusion technique involves temperature ramping of an electrolyte sample in a high-purity graphite crucible up to about 3000 °C in an inert gas atmosphere. During temperature ramping, the oxygen in the sample reacts with the graphite crucible to form CO and CO2, which are then quantified to obtain the oxygen content. From the oxygen content, the REO concentrations are then determined.
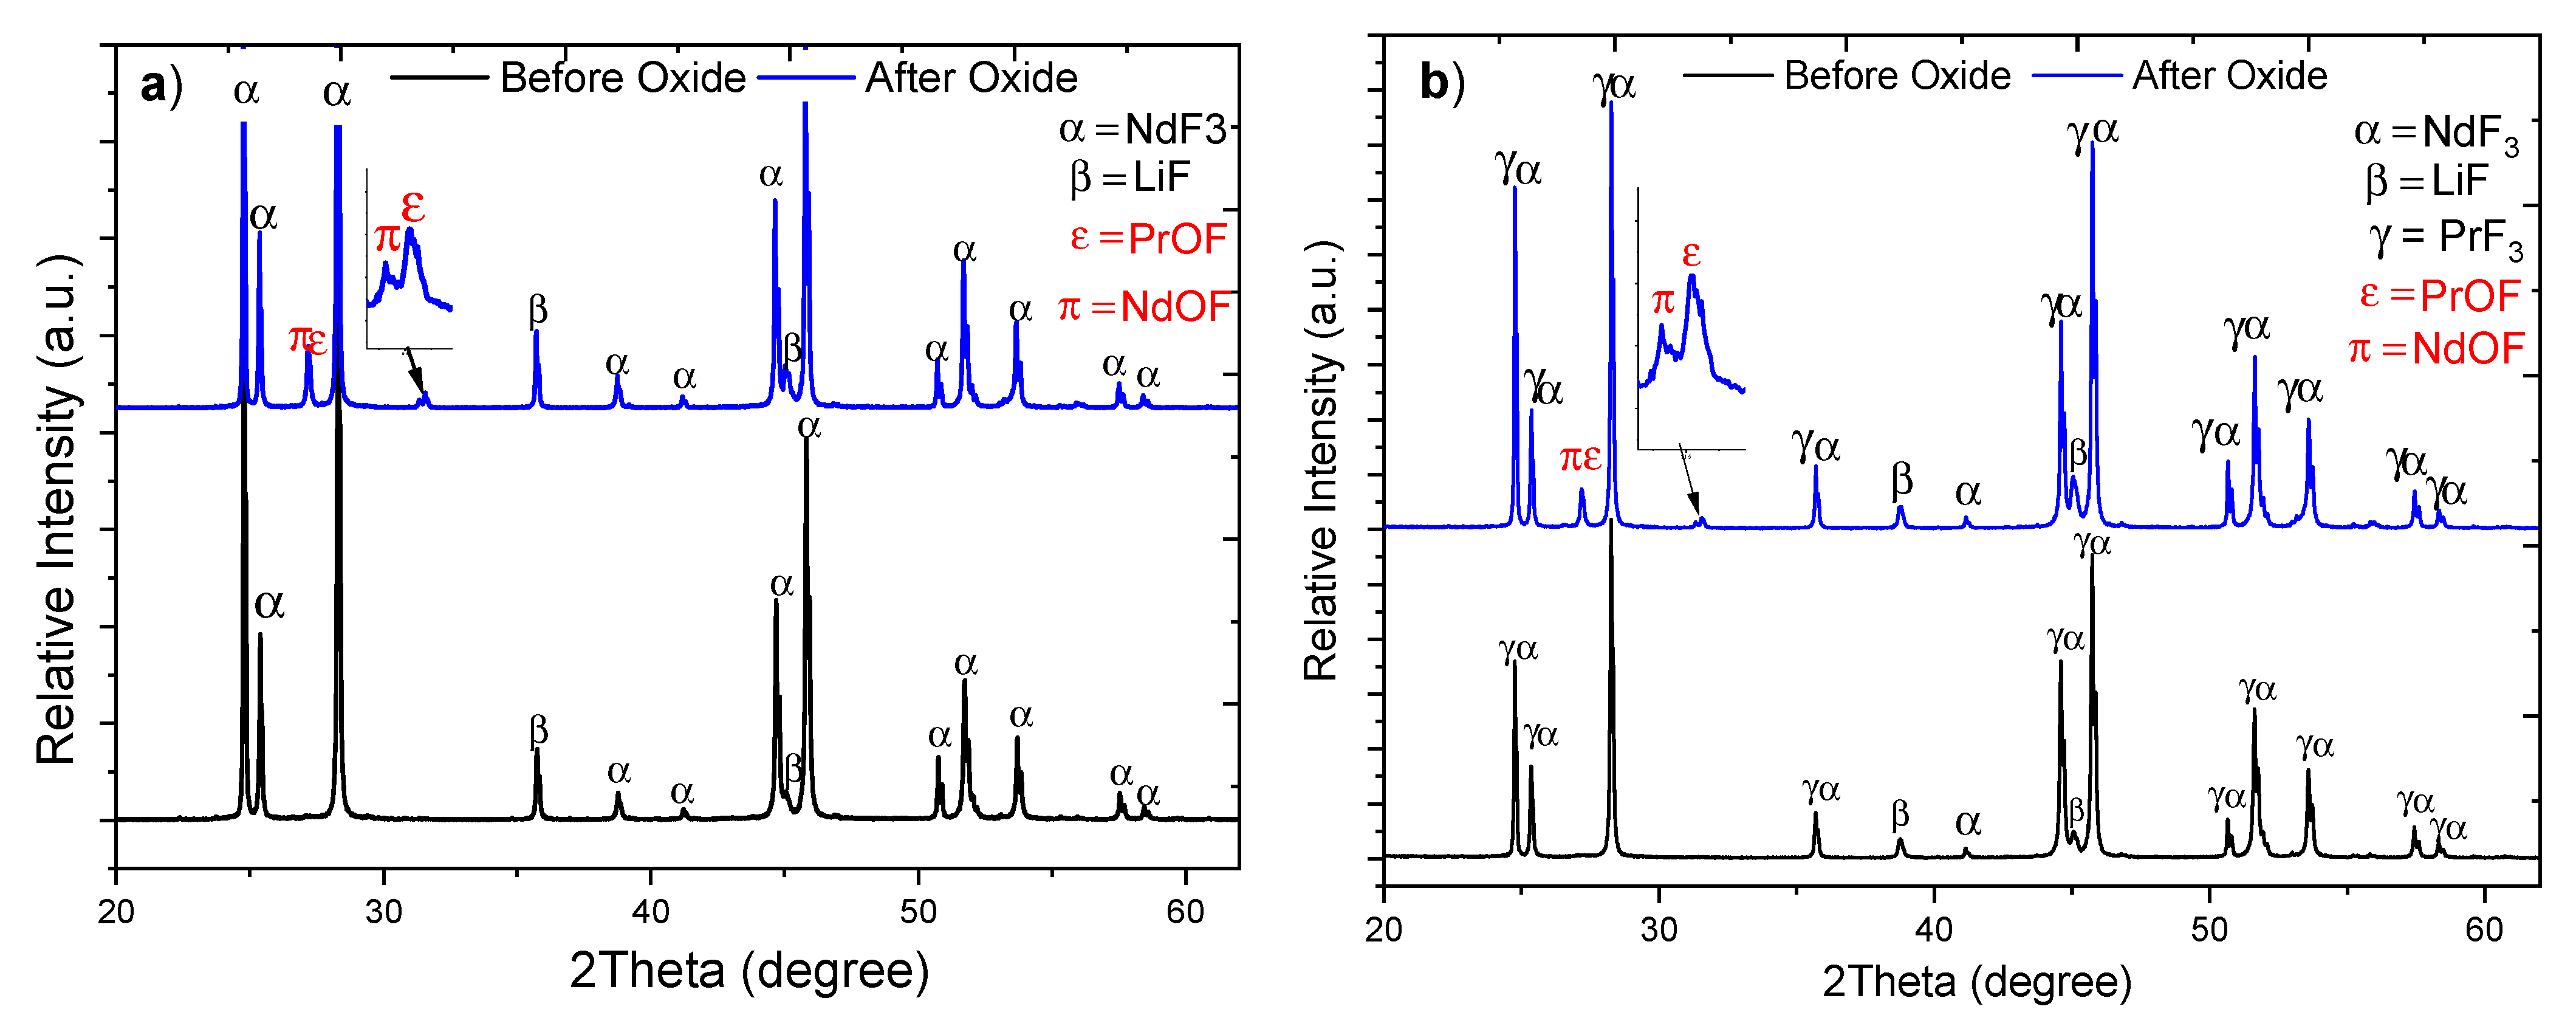
XRD analyses of solidified electrolyte samples were done to investigate the phases present after solidification. A Bruker D8 Advance Davinci 1 X-ray diffractometer was used to obtain the diffractograms. The different phase compositions represented by the different diffractograms were determined by employing the DIFFRAC.EVA Version 5.2.0.3 evaluation software program from Bruker and using the International Centre for Diffraction Data (ICDD) Powder Diffraction File™ (PDF®) database, PDF-4+, 2019, as given in Table 2.
The concentration of the electrolyte was kept at 50 mol% REF and 50 mol% LiF for all the tests except for one test where the LiF content was increased to 80 mol% (REF–LiF eutectic composition). The chemicals used for the tests are NdF3 (in-house, 98%), PrF3 (Jiayuan Advanced Materials, 99.9%), LiF (Sigma-Aldrich, 99%), Nd2O3 (Alfa Aesar, 99.9%), Pr6O11 (Alfa Aesar, 99.9%), Nd2O3-Pr6O11 (in-house, 98%), and Pr2O3 (Alfa Aesar, 99.9%). All the chemicals were kept under dry conditions and preheated to ca. 120 °C before use. Table 3 summarises the chemicals and the amounts used.
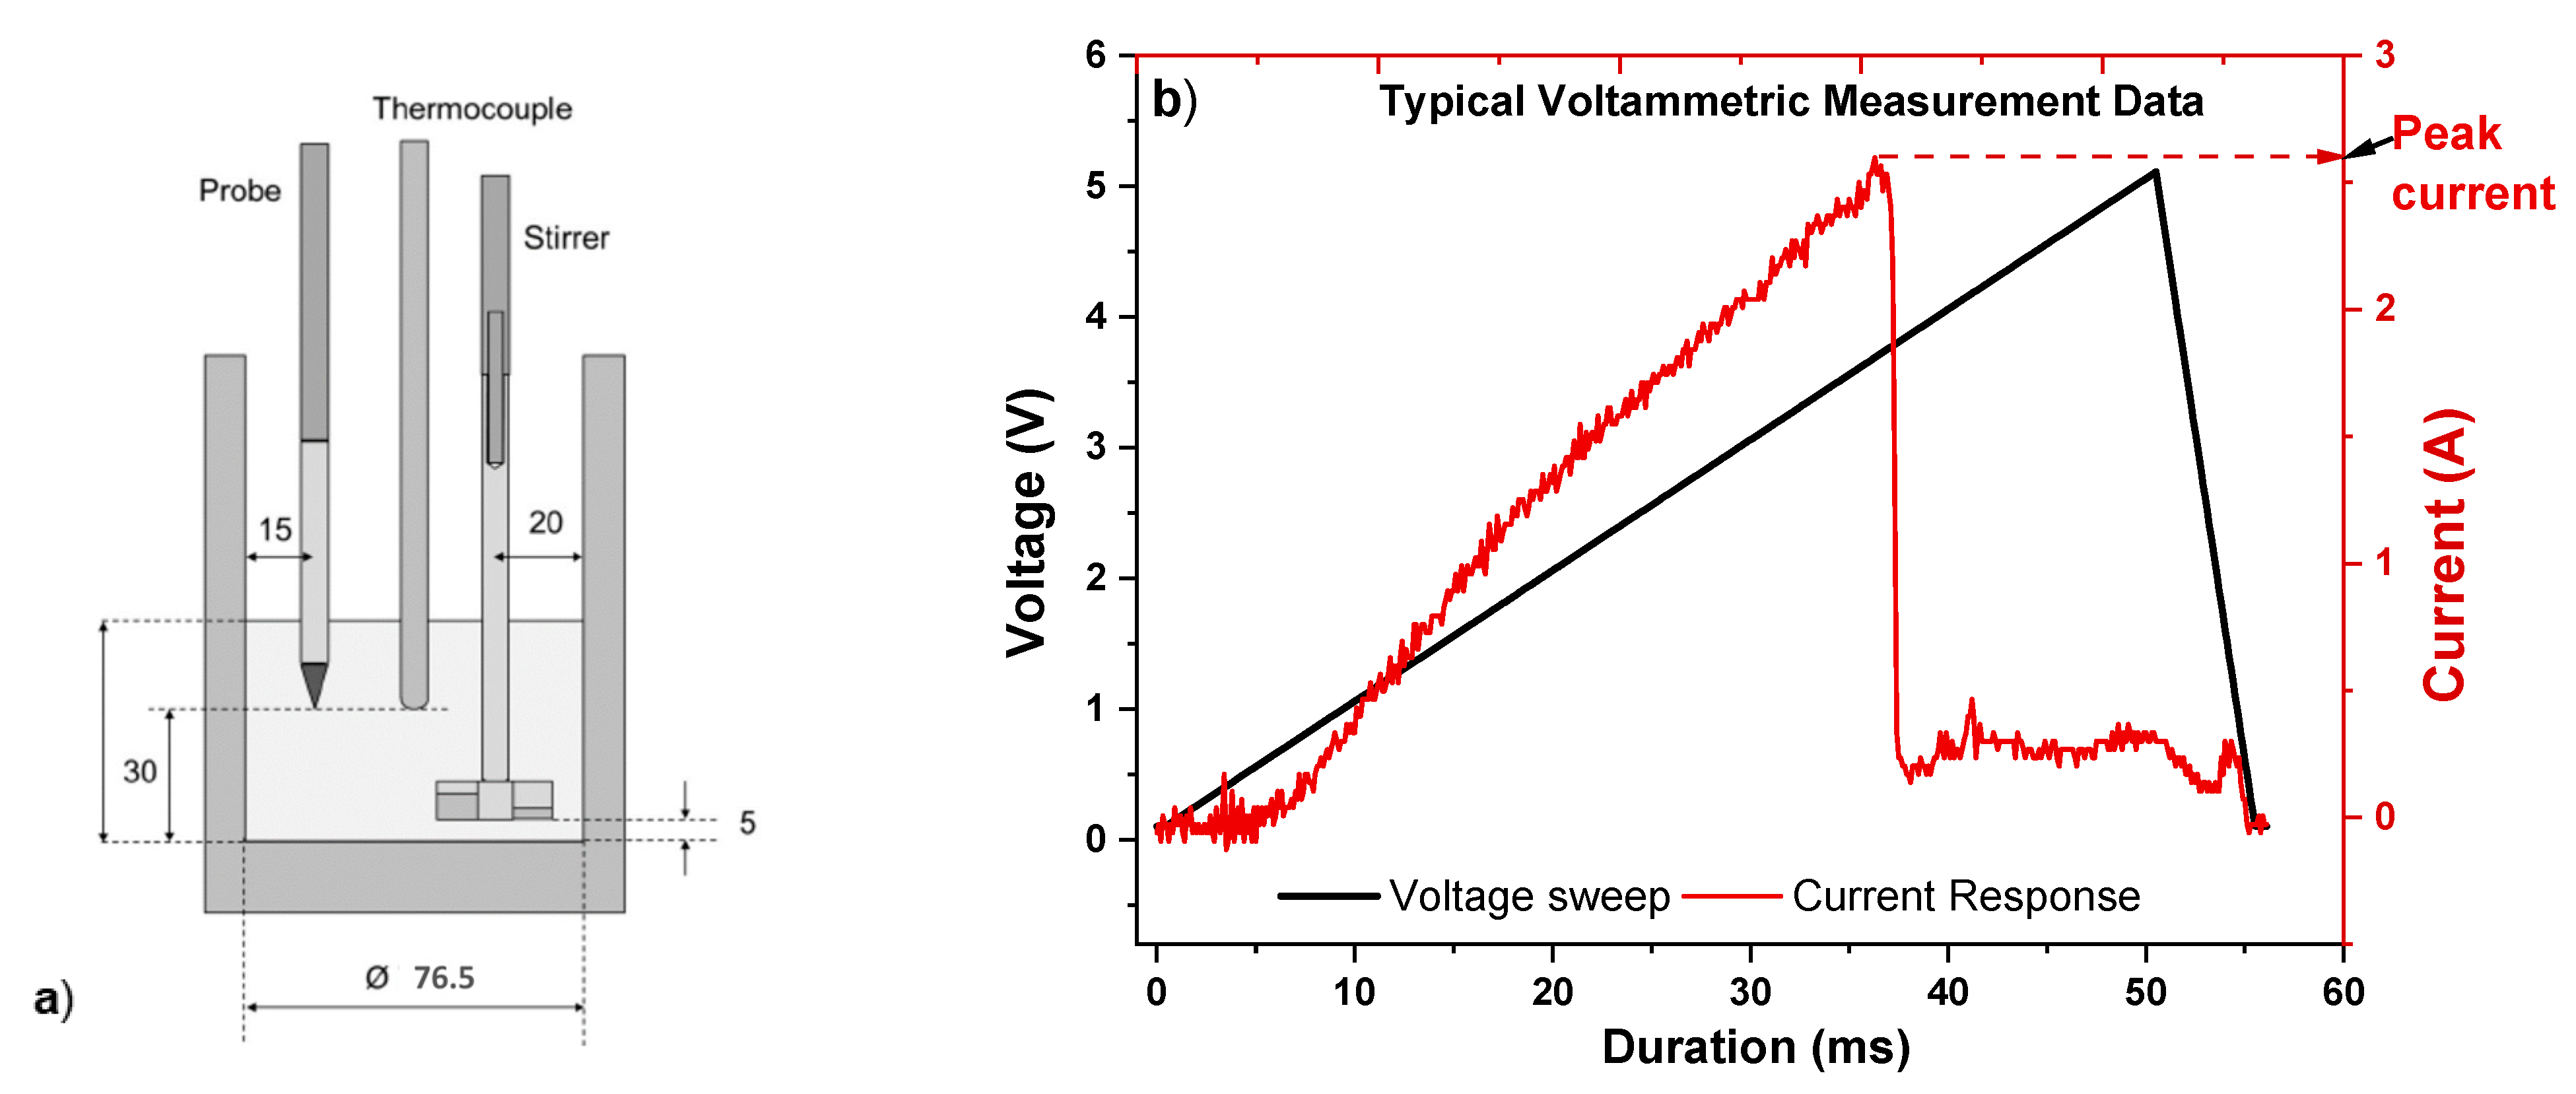
The experimental setup consisted of a pure graphite crucible with an internal diameter of ca. 77 mm filled with 1 kg electrolyte placed in a furnace together with a type S thermocouple as well as a graphite probe and a graphite stirrer. The experimental setup as well as a representation of a typical voltammetric measurement data is displayed in Figure 1.
The setup was purged with argon during the whole experiment. The stirrer and the graphite probe were rotated at 80 and 100 rpm, respectively. Rotation of the probe was done to avoid oxide concentrating around the tip, creating noise in the data. A voltage was applied between the working electrode (graphite probe) and the counter electrode (graphite crucible) such that the probe was polarised anodically. Fast voltage sweeps of 100 V/s were applied to the graphite probe through a computer-controlled voltage sweep generator (inductive proximity sensors, Alumina Sensor Model 003D from New Zealand), and the current response was recorded using a National Instruments acquisition card (NI 9205). A summary of the measurement sequence is given below:
(1)
The probe is conditioned by carrying out several linear voltage sweeps at 100 V/s before the measurements.
(2)
Predetermined amounts of the REO are added to the fluoride electrolyte every 60 min.
(3)
Fast voltage sweeps (100 V/s) are applied every 2 s, and the peak current is recorded. A typical voltammetric measurement plot showing the peak current is given in Figure 1b.
The analysed REO concentration in the electrolyte is obtained by using the inert gas fusion technique to calibrate and verify the REO concentration derived from the peak current recorded during the measurements.
Figure 1b shows a typical current response during fast voltage sweep applied to the graphite probe. In the first stage of anodic polarisation, the current increases with the probe voltage. At 37 ms, a rapid drop of current occurs, indicating anode passivation. The peak current prior to the passivation, as shown in Figure 1b, is recorded for further analysis. Due to the large number of voltage sweeps recorded during the experiments, data processing was implemented using LabVIEW.

3. Results

The oxide concentration in the electrolyte was increased via feeding every 60 min. Disregarding the occasional noise in the data, all the plots showed a gradual increase in the peak current as a function of oxide additions over the whole period of the tests until oxide saturation was reached. Thus, the peak current could be correlated with the analysed oxide concentration measured by the inert gas fusion technique. Table 4 gives the maximum oxide concentration measured for each electrolyte composition. A plot showing the analysed oxide concentrations of the electrolytes for the nine experiments at different time intervals is given in Figure 2.

3.1. Nd2O3 Dissolution in NdF3–LiF Electrolyte at 1040 °C

Data from the dissolution of Nd2O3 in two different equimolar NdF3–LiF electrolytes and one 20/80 mol% NdF3–LiF electrolyte, experiments 1, 2, and 3, respectively, are represented by Figure 3. All the plots in Figure 3, as well as those in the sections below, show the average peak current as a dark red line with values on the left y-axis, whereas the analysed oxide concentrations of the electrolyte samples taken every 30 min using the LECO apparatus appear as blue filled triangles with values on the right y-axis. The gradual increase in the peak current as the oxide concentration, analysed using the LECO apparatus, increases can be observed. Measurements by LECO gave maximum oxide concentrations of ca. 2.5, 2.6, and 2.3 wt% for experiments 1, 2 and 3, respectively.

3.2. Pr2O3/Pr6O11 Dissolution in an Equimolar REF–LiF Electrolyte at 1040 °C

Test results from the dissolution of praseodymium oxides (Pr2O3 and Pr6O11) in fluoride electrolytes composed of LiF combined with either PrF3 or NdF3, as was done in experiments 4, 5, and 6, are given in Figure 4. The results show that the praseodymium oxides dissolve in both PrF3–LiF and NdF3–LiF systems. Maximum oxide concentrations of 2.8 and 2.2 wt% were measured by LECO for the dissolution of Pr2O3 and Pr6O11 in 50/50 mol% NdF3–LiF electrolytes, respectively. The dissolution of Pr2O3 in an electrolyte composed of 50/50 mol% PrF3–LiF gave a maximum oxide concentration of 3.1 wt%. A good dependency of the peak current on the analysed oxide concentration could be seen.

3.3. Nd2O3–Pr6O11 Dissolution in a 50 mol% NdF3–50 mol% LiF Electrolyte at 1040 °C

Dissolving a mixture of neodymium and praseodymium oxides (77.5 wt% Nd2O3–22.5 wt% Pr6O11) in an equimolar NdF3–LiF electrolyte, as was done in experiment 7, resulted in a maximum oxide concentration of ca. 2.5 wt% as displayed in Figure 5. The peak current increased proportionally with the oxide concentration.

3.4. Nd2O3–Pr6O11 Dissolution in a 37.5 mol% NdF3–12.5 mol% PrF3–50 mol% LiF Electrolyte at 1040 °C

Figure 6 presents data from experiments 8 and 9, where a mixture of neodymium and praseodymium oxides (77.5 wt% Nd2O3–22.5 wt% Pr6O11) was dissolved in an electrolyte comprising NdF3, PrF3, and LiF. An increase in the peak current was observed to correspond with an increase in the oxide concentration. The maximum oxide concentrations were measured by LECO to be 2.7 and 2.5 wt% for experiments 8 and 9, respectively. Furthermore, the graphite probe malfunctioned during experiment 9 and had to be replaced. Despite this technical issue, a good fit between the measured and analysed oxide concentrations was observed.

3.5. X-ray Diffraction Analysis

To investigate the oxide phases formed during the dissolution process, samples were collected during the experiments and analysed using X-ray powder diffraction after solidification. Results from the analysis show the presence of RE metal oxyfluorides corresponding to the RE fluorides present. Figure 7 displays the diffractograms from samples taken from experiments 4 and 8. The same peaks corresponding to oxyfluorides were observed from the analysis of the solidified electrolytes from these two experiments despite the differences in electrolyte compositions and REO added. It was also seen that the oxyfluoride peaks appeared only after the REO additions as no such phases were observed for the samples taken before REO additions even though LECO showed a starting oxide concentration of about 0.5 wt%.

4. Discussion

All the measurements indicate an increase in the peak current with increasing oxide concentration until saturation is reached, just as observed during investigations involving alumina in cryolitic electrolyte systems [8,10,11,13]. It can thus be concluded that the REOs behave similarly to alumina in their corresponding fluoride electrolytes. Hence, the voltammetric techniques originally applied to determine alumina concentrations can also be applied for REO concentrations. Moreover, the relatively good correlation between the peak current data and the analysed oxide concentration determined using the inert gas fusion technique shows that the voltammetric technique offers an opportunity for online monitoring of the REO concentration during the RE metal electrolysis.
The analysed oxide concentrations at saturation, determined by the inert gas fusion technique with LECO, gave results comparable to previous studies [2,5] and therefore confirm the applicability of the probe and the LECO method used in the present work. The dissolution of praseodymium oxides in neodymium fluoride electrolytes with appreciable solubility is a very important observation as it has been reported that the REOs only tend to dissolve well in their corresponding REF electrolytes [5]. The similarities in the atomic structure of these two RE metals, Pr and Nd, might explain the relatively high solubility of praseodymium oxide in the neodymium fluoride-based electrolyte. Further, the data from experiments 4 and 6, where Pr2O3 was dissolved in equimolar NdF3–LiF and PrF3-LiF electrolytes, respectively, show that solubility is not significantly different when praseodymium oxide is dissolved in either the corresponding praseodymium or the neodymium fluoride electrolytes. It is also seen that there is an exchange between the added oxides and the rare earth fluorides in the original electrolyte composition; hence, an equilibrium composition will be established depending on the oxides added and the composition of the original electrolyte.
The X-ray diffraction analysis data presented in Figure 7 suggest the formation of oxyfluorides during the dissolution stage after oxide additions. The fact that no peaks corresponding to oxyfluorides were observed in the solidified electrolytes taken prior to oxide additions suggests that the initial oxide concentration of the electrolyte prior to REO addition does not play any role in the oxyfluoride formation. Moreover, the fact that neodymium oxyfluorides are formed even when the corresponding oxide is absent, as seen for experiment 4, suggests that the oxyfluoride formation process occurs by either oxide or fluoride exchange with available fluorides or oxides in the electrolyte, respectively.

5. Conclusions

The technique presented in these studies has shown that REO concentration in REF electrolytes can be monitored using fast voltage sweeps.
Using the present technique for online monitoring of REO concentration in the corresponding REF electrolytes during the electrolysis process will allow better control of the oxide levels, thereby helping to curtail the harmful greenhouse gases emitted during oxide depletion.

Author Contributions

Conceptualisation, H.G., A.P.R. and S.S.; methodology, H.G.; software, H.G.; validation, A.P.R., A.M.M. and W.G.; formal analysis, A.P.R. and S.S.; investigation, H.G. and A.S.; resources, A.M.M. and W.G.; data curation, H.G., S.S. and W.G.; writing—original draft preparation, S.S.; writing—review and editing, S.S., A.P.R., A.M.M. and W.G.; visualisation, S.S.; project administration, A.P.R.; funding acquisition, A.P.R. All authors have read and agreed to the published version of the manuscript.

Funding

This research received funding from the European Union’s Horizon 2020 and Innovation Programme under Grant Agreement No. 776559, which is very much appreciated.

Institutional Review Board Statement

Not applicable to this article.

Informed Consent Statement

Not applicable to this article.

Data Availability Statement

Data sharing is not applicable to this article.

Acknowledgments

Financial support from the European Union’s Horizon 2020 and Innovation Programme under Grant Agreement No. 776559 is very much appreciated.

Conflicts of Interest

The authors declare no conflict of interest.

References

  1. Milicevic, K.; Feldhaus, D.; Friedrich, B. Conditions and Mechanisms of Gas Emissions from Didymium Electrolysis and Its Process Control. In Light Metals; Springer: Berlin/Heidelberg, Germany, 2018; pp. 1435–1441. [Google Scholar]
  2. Guo, X.; Sun, Z.; Sietsma, J.; Blanpain, B.; Guo, M.; Yang, Y. Quantitative Study on Dissolution Behavior of Nd2O3 in Fluoride Melts. Ind. Eng. Chem. Res. 2018, 57, 1380–1388. [Google Scholar] [CrossRef] [PubMed] [Green Version]
  3. Abbasalizadeh, A.; Malfliet, A.; Seetharaman, S.; Sietsma, J.; Yang, Y. Electrochemical Extraction of Rare Earth Metals in Molten Fluorides: Conversion of Rare Earth Oxides into Rare Earth Fluorides Using Fluoride Additives. J. Sustain. Met. 2017, 3, 627–637. [Google Scholar] [CrossRef] [Green Version]
  4. Abbasalizadeh, A.; Sridar, S.; Chen, Z.; Sluiter, M.; Yang, Y.; Sietsma, J.; Seetharaman, S.; Kumar, K.H. Experimental investigation and thermodynamic modelling of LiF-NdF3-DyF3 system. J. Alloy. Compd. 2018, 753, 388–394. [Google Scholar] [CrossRef]
  5. Guo, X.; Sietsma, J.; Yang, Y. Solubility of Rare Earth Oxides in Molten Fluorides. In Proceedings of the European Rare Earth Resources Conference (ERES2014), Milos, Greece, 4–7 September 2014; pp. 149–155. [Google Scholar]
  6. Aarhaug, T.A.; Ferber, A.; Kjos, O.S.; Gaertner, H. Online Monitoring of Aluminium Primary Production Gas Composition by Use of Fourier-Transform Infrared Spectrometry. In Light Metals; Springer: Berlin/Heidelberg, Germany, 2014; pp. 647–652. [Google Scholar]
  7. Kibby, R.M.; Marshall, H.C., Jr.; Richards, N.E. Alumina Concentration Meter. U.S. Patent 3471390, 7 October 1969. [Google Scholar]
  8. Haverkamp, R.G.; Welch, B.J. Measurement of Alumina in Reduction Pots. U.S. Patent 6010611, 4 January 2000. [Google Scholar]
  9. Crottaz, O.; Haverkamp, R.G.; Yellepeddi, R.; de Nora, V. Development of Techniques for Measuring the Composition of Low Temperature Electrolytes. In Light Metals; Springer: Berlin/Heidelberg, Germany, 2001; pp. 1195–1199. [Google Scholar]
  10. Haverkamp, R.G.; Rolseth, S.; Thonstad, J.; Gudbrandsen, H. Voltammetry and electrode reactions in AlF3-rich electrolyte. In Light Metals; Springer: Berlin/Heidelberg, Germany, 2001; pp. 481–486. [Google Scholar]
  11. Haverkamp, R.G.; Welch, B.J.; McMullen, A. Real Time Alumina Measurement in Industrial Cells. In Light Metals; Springer: Berlin/Heidelberg, Germany, 2001; pp. 1193–1194. [Google Scholar]
  12. Thonstad, J.; Fellner, P.; Haarberg, G.M.; Hives, J.; Kvande, H.; Sterten, A. Aluminium Electrolysis: Fundamentals of the Hall-Héroult Process, 3rd ed.; Aluminium-Verlag Marketing and Kommunikation GmbH: Düsseldorf, Germany, 2001. [Google Scholar]
  13. Nikolaev, A.; Pavlenko, O.; Zaikov, Y.; Suzdaltsev, A. Electrochemical sensor for monitoring the alumina dissolution and concentration in a cryolite-alumina melt. J. Electrochem. Soc. 2020, 167, 126511. [Google Scholar] [CrossRef]
Figure 1. Experimental setup and data: (a) experimental setup for the dissolution test, dimensions are in millimetres; (b) typical voltammetric measurement data from the dissolution tests.
Metals 11 00326 g001
Figure 2. Analysed oxide concentration of electrolyte measured with the LECO apparatus for the electrolyte sampled at 30 min intervals for all the 9 experiments.
Metals 11 00326 g002
Figure 3. Data from the dissolution of Nd2O3 in different compositions of NdF3–LiF electrolytes: (a,b) Nd2O3 in an equimolar NdF3–LiF electrolyte as in experiments 1 and 2; (c) Nd2O3 in 20/80 mol% NdF3–LiF electrolyte as in experiment 3.
Metals 11 00326 g003
Figure 4. Data from the dissolution of praseodymium oxides (Pr2O3 and Pr6O11) in equimolar NdF3–LiF and PrF3–LiF electrolytes: (a,b) data from the dissolution of Pr2O3 and Pr6O11 in equimolar NdF3–LiF electrolytes as in experiments 4 and 5, respectively; (c) data from the dissolution of Pr2O3 in an equimolar PrF3–LiF electrolyte as in experiment 6.
Metals 11 00326 g004
Figure 5. Data from the dissolution of a mixture of neodymium and praseodymium oxides (77.5 wt% Nd2O3–22.5 wt% Pr6O11) in an equimolar NdF3–LiF electrolyte.
Metals 11 00326 g005
Figure 6. (a,b) Data from the dissolution of neodymium and praseodymium oxides (77.5 wt% Nd2O3–22.5 wt% Pr6O11) in a 37.5 mol% NdF3–12.5 mol% PrF3–50 mol% LiF electrolyte as was done in experiments 8 and 9.
Metals 11 00326 g006
Figure 7. X-ray diffractograms: (a) phases present in the solidified electrolyte from dissolving Pr2O3 in an equimolar NdF3–LiF electrolyte (experiment 4) showing PrOF and NdOF; (b) phases present in the solidified electrolyte from dissolving neodymium and praseodymium oxides (77.5 wt% Nd2O3–22.5 wt% Pr6O11) in a 37.5 mol% NdF3–12.5 mol% PrF3–50 mol% LiF electrolyte (experiment 8) showing PrOF and NdOF.
Metals 11 00326 g007
Table 1. Main cell reactions and their reversible potentials at 1040 °C. Data from HSC Chemistry v. 10.0.3.9 (Outotec).
ReactionΔG (kJ)E (V)
1. Nd2O3 + 3C = 2Nd(l) + 3CO(g)755.5−1.31
2. Nd2O3 + 1.5C = 2Nd(l) + 3. 1.5CO2(g)845.1−1.46
3. Pr2O3 + 3C = 2Pr(l) + 3CO(g)752.4−1.30
4. Pr2O3 + 1.5C = 2Pr(l) + 1.5CO2(g)842.0−1.45
5. NdF3 + 0.75C = Nd(l) + 0.75CF4(g)812.4−2.81
6. PrF3 + 0.75C = Pr(l) + 0.75CF4(g)820.8−2.84
Table 2. Powder Diffraction File (PDF) references used for the XRD analysis.
PhaseFormulaPDF Reference
Neodymium fluorideNdF3PDF 04-016-3239 (ICDD, 2019)
Praseodymium fluoridePrF3PDF 04-016-3238 (ICDD, 2019)
Lithium fluorideLiFPDF 04-007-3587 (ICDD, 2019)
Neodymium oxide fluorideNdOFPDF 00-050-0635 (ICDD, 2019)
Praseodymium oxide fluoridePrOFPDF 04-019-3488 (ICDD, 2019)
Table 3. Composition of 1 kg fluoride electrolyte and the total amount of REO added in each experiment.
Experiment NumberNdF3 (wt%)PrF3 (wt%)LiF (wt%)Nd2O3 (g)Nd2O3–Pr6O11 (g)Pr6O11 (g)Pr2O3 (g)
188.58011.4230000
288.58011.4230000
365.98034.0215000
488.58011.4200030
588.58011.4200300
6088.4111.5900030
788.58011.4203000
866.6821.8611.4603000
966.6821.8611.4603000
Table 4. Maximum oxide concentration values using the inert gas fusion technique with LECO for the 9 experiments.
Experiment No.CompositionSolubility (wt%)
1Nd2O3 in 50/50 mol% NdF3–LiF2.5
2Nd2O3 in 50/50 mol% NdF3–LiF2.6
3Nd2O3 in 20/80 mol% NdF3–LiF2.3
4Pr2O3 in 50/50 mol% NdF3–LiF2.8
5Pr6O11 in 50/50 mol% NdF3–LiF2.2
6Pr2O3 in 50/50 mol% PrF3–LiF3.1
7Nd2O3–Pr6O11 in 50/50 mol% NdF3–LiF2.5
8Nd2O3–Pr6O11 in PrF3–NdF3–LiF (12.5/37.5/50 mol%)2.7
9Nd2O3–Pr6O11 in PrF3–NdF3–LiF (12.5/37.5/50 mol%)2.5
Publisher’s Note: MDPI stays neutral with regard to jurisdictional claims in published maps and institutional affiliations.

