Abstract
Surface quality and dimensional tolerances of the selective laser melting (SLM) process are not good enough for many industrial applications and grinding as a common finishing process introduces many surface modifications. Investigation on the effect of grinding induced surface residual stress (RS) on early stages of stress corrosion cracking (SCC) of SLM manufactured 316L austenitic stainless steel was conducted. Potentiodynamic and galvanostatic tests in a 3.5% NaCl aqueous solution, XRD, SEM and energy-dispersive X-ray spectroscopy (EDX) analysis were performed. For annealed and specimens with a low RS magnitude, the dominant observation was pit initiation from existing pores and growth in the build direction. For specimens with medium RS level, SCC initiation from pore sites and propagation along melt pool boundaries and for specimens with the highest detected RS, crack initiation from melt pool boundaries, grains, machining marks, and pore sites were observed. Cracks propagated in different directions, i.e., along melt pool boundaries, near-surface transgranular, and transgranular through columnar microstructure. Galvanostatic tests showed three distinctive regions that corresponded to crack and pit initiation and growth. The synergistic effect of high dislocation density along melt pool boundaries, stress concentration in pore sites, molybdenum segregation, and surface RS was the cause of SCC susceptibility of specimens with high RS magnitude.
1. Introduction
Selective laser melting (SLM) is one of the additive manufacturing (AM) methods that have been widely used for the manufacturing of metallic components with complex geometries [1,2]. High heating and cooling rates, due to the interaction of a highly concentrated laser beam with the micro-sized particles, coupled with the thermal effects of previously manufactured layers, leads to the formation of a unique columnar–hierarchical and highly textured microstructure, which is different from other traditional manufacturing methods such as casting and forging [3,4]. Various parameters, such as laser power, the thickness of each layer, scanning speed, hatch spacing, scanning pattern, etc., can significantly affect the microstructure and quality of manufactured parts [5,6,7,8,9]. During the past decade, extensive efforts have been made to reduce metallurgical defects such as entrapped gas, not melted particles, micro-cracks, balling, and oxidation to enhance the mechanical characteristics and to obtain the quality of the manufactured parts by the SLM process that required for industrial needs [9,10,11,12]. Despite all these efforts, corrosion mechanisms and the probability of stress corrosion cracking (SCC) in SLM manufactured parts after final processing with other manufacturing methods is one of the research topics that need more clarification.
SCC is caused by the synergistic effect of tensile stresses, susceptible material, and a critical environment [13]. Reported issues of the SLM method which may affect corrosion resistance include, but are not limited to, the presence of microsegregation of alloying elements, porosities, anisotropy, surface roughness, inclusions, and residual stresses (RS) [14,15]. Pores could be present in SLM manufactured parts as a result of entrapped gas during the process near un-melted particles. Over the past decades, it has been fully understood that pores are the places for the accumulation of aggressive ions which form a local aggressive environment that causes the breakdown of the passive layer and the occurrence of pitting corrosion. However, in the presence of tensile stresses, corrosion-induced defects such as pits could also act as precursors for SCC initiation as a result of stress concentration [16,17].
The surface roughness of most AM methods, and more specifically the SLM method, is much higher than other traditional manufacturing processes such as milling and grinding [18,19]. Thus, a secondary process such as selective laser re-melting, shot-peening, sandblasting, or other more controllable methods such as grinding and/or milling, is necessary to increase surface quality and geometrical tolerances [20,21].
Grinding and machining processes in general involve substantial plastic deformation due to the metal removal. As a consequence of the high plastic deformation, other effects that have a great influence on corrosion behavior of Austenitic Stainless Steels (ASS) occur, i.e., strain-induced martensitic phase transformation [22], a high magnitude of tensile RS on a very thin layer on the surface [23,24,25,26], and other modifications [27]. Over the past decade, many researchers have investigated different aspects of the effect of machining on SCC and pitting susceptibility of ASS. It is well-reported that a higher magnitude of RS makes the surface more susceptible to SCC occurrence [28,29,30,31,32]. On the other hand, recent investigations reported that tensile RS has no direct effect on SCC of ASS made by manufacturing methods such as hot or cold rolling and it only makes the surface more active compared to annealed specimens. This higher activity results in a more favorable initiation of corrosion pits on the surface that could act as stress concentration sites and precursors for SCC initiation under working loads [33,34,35].
Until now, the relationship between the machining induced modifications, more specifically surface RS magnitude with the corrosion behavior and SCC susceptibility of SLM manufactured parts, have not been well-investigated. There are limited research resources and a lack of data about the interaction of surface modifications induced by machining processes with intrinsic microstructure and defects of the SLM process. This paper aims to clarify the effect of grinding-induced RS on corrosion behavior and SCC susceptibility of SLM manufactured specimens after grinding with different process parameters.
The first part of the current study is addressed to the analysis of as-received SLM specimens to attain enough primary knowledge about the possible microstructural defects of the samples under testing. In the second part, the corrosion behavior of the machined specimens with various process parameters was investigated for an in-depth understanding of the effect of surface modifications on overall corrosion susceptibility. The third and the last part is dedicated to the investigation of the machining-induced RS effects on SCC susceptibility and crack initiation mechanisms of annealed and ground specimens. Specimens were analyzed with a scanning electron microscope (SEM), X-ray diffraction (XRD), and energy-dispersive X-ray spectroscopy (EDX) to gain a better understanding of SCC susceptibility and related mechanisms of crack initiation.
2. Materials and Methods
2.1. Specimen Preparation
Specimens were made from EOS 316L austenitic stainless-steel powder with a chemical composition corresponding to ASTM F138 “Standard Specification for Wrought 18Cr-14Ni-2.5Mo Stainless Steel Bar and Wire for Surgical Implants (UNS S31673)” [36]. They were manufactured with an EOSINT M280 machine (EOS GmbH, Krailling, Germany) with a Yb-fiber laser with a maximum power of 200 W. The process parameters used for the experiments were provided by the manufacturer of the SLM machine (EOS GmbH, Krailling, Germany) for 316L stainless steel. The SLM process took place under a controlled atmosphere with high purity Argon gas to reduce the effect of oxidation on the microstructure of the specimens. The chosen dimension for the specimens was 10 mm × 25 mm with a thickness of 9 mm, after cutting with a wire cut machine from the platform. Following the SLM process, samples were solution annealed in an Argon-controlled atmosphere at 1050 °C for 30 min and air quenched, to reduce the thermal RS produced by the SLM process and to avoid any possible sensitization effects.
In order to choose the combination of various grinding parameters to produce almost the same surface quality, 10 preliminary specimens were ground with changing grinding parameters such as feed rate, rotational speed, and depth of cut. Surface roughness was measured on each condition and the results showed that with a constant rotational speed and feed rate, and changing the depth of cut, it was possible to obtain almost the same surface roughness of Ra = 0.25 µm with negligible variation and different magnitudes of tensile residual stresses on the surface.
Specimens were ground with a grinding wheel with a grit size of 80 on a flat grinding machine with a constant rotational speed of 5000 rpm with three different depths of cut of 30, 60 and 90 µm. The chosen process parameters introduced different RS magnitudes with almost the same surface condition as explained before. After each grinding process, the grinding wheel was cleaned and flattened with special high strength steel (HSS) tool attached to the machine. The process included coolant media to reduce the thermal effects of the grinding process on the samples. All the specimens were cleaned ultrasonically and washed with ethanol in order to remove any contamination from the surface. To give the same surface roughness during the corrosion and SCC susceptibility tests, specimens that were analyzed as annealed samples were also ground with the lowest depth of cut and then annealed with the same procedure for accurate comparison of the results with the data obtained from ground specimens under the same surface roughness.
2.2. Residual Stress Measurement
The X-ray diffraction (XRD) method was applied for RS measurement on the surface. Surface grinding produces tensile RS and the highest magnitude is on a very thin layer about 10 to 50 µm, on the surface [32]. The XRD method has a depth of penetration within the same range for austenitic stainless steels [37]. Moreover, measuring RS with the XRD method is sensitive to surface conditions. Roughness for the ground specimens was good enough to produce reliable results from the XRD measurements. For as-built specimens, the electropolishing method was used to remove a thin layer from the surface to lower surface roughness and for successful RS measurement. The guideline adopted for RS measurements with the XRD method was the National physical laboratory (NPL) good practice no.52 for all the specimens [37]. A Spider TM X GNR portable diffractometer working at 30 kV and 90 µA was used for measurements with a radiation source of Chromium with a Kβ filter of Vanadium. The sin2 (ψ) method was adopted with 9 ψ angles between 0° and 43°. The austenite peak {311} was set for the diffraction peak. The RS was measured in 3 different positions on each specimen. These positions were marked before measurements and the RS was measured in the longitudinal direction, parallel to machining marks on the XY plane transverse to the SLM build direction.
2.3. Corrosion and SCC Susceptibility Tests
For all the electrochemical tests, the electrolyte was 3.5% sodium chloride solution in distilled water at room temperature. The surface in contact with the solution for the electrochemical measurements was a circle with a diameter of 6 mm for all the specimens.
Potentiodynamic polarization measurements were performed with an Amel 2549 instrument as described in ASTM G 59–97 standard with the three-electrode method [38]. Platinum mesh as counter electrode and saturated calomel electrode (SCE) as reference electrode was used. The potential measurements were performed between −250 mV below and 1000 mV higher than the open circuit potential with respect to the Calomel electrode potential (VSCE), with a scan rate of 0.5 mV per s.
Galvanostatic tests were done for accelerated SCC susceptibility investigation. The current used for the galvanostatic measurements was 0.001 mA. This current was chosen to have a more aggressive condition for investigation of SCC susceptibility of the specimens and to be almost in the same trans-passive region for all the specimens with different RS magnitudes. During the galvanostatic tests, specimens with similar RS magnitude were tested with different immersion times for a better understanding of the evolution of the possible cracks. For each similar range of RS magnitudes, both Potentiodynamic polarization measurements and galvanostatic tests were performed at least 2 times to ensure the reproducibility of the analysis data. After Galvanostatic SCC susceptibility tests, specimens were analyzed by optical microscope, Scanning Electron Microscope (SEM), and Energy Dispersive X-ray Microanalysis (EDX) methods. Specimens were initially cut cross-sectionally in the direction of the machining marks, i.e., the longitudinal direction in which RS measurement was performed, from the observed surface corrosion defects.
2.4. Microstructural and Chemical Characterization
Microstructure, compositional mapping, surface roughness measurement, and melt pool measurements of the as-built specimens were first analyzed to give a better understanding of the SLM process effects on different aspects of manufactured specimens. For all the ground specimens, after SCC tests, a precise initial cutting from the observed surface defects and further polishing with caution according to the metallographic sample preparation procedure, up to 0.05 µm aluminum oxide suspension, was performed. A Leica Cambridge LEO 440 SEM machine in secondary electron mode with an accelerating voltage of 15 keV was used for all SEM microstructural analysis. EDAX (AMETEK Materials Analysis Division, Mahwah, NJ, USA) energy dispersive X-ray microanalysis (EDXMA) was used for EDX compositional mapping of the as-built specimens. The analysis was also performed to check for possible compositional variation near corrosion defects after SCC tests. Moreover, a Leica DMRE optical microscope coupled with image analysis software (Image J V1.53, National Institute of Health, Gaithersburg, MD, USA) was used to quantify the porosity, surface roughness, and to perform the microstructural analysis of the as-built specimens.
3. Results and Discussion
3.1. SLM Specimen Characterization
The cross-sectional optical image of the as-built specimen with the corresponding measured melt pool size is presented in Figure 1. As shown in Figure 1b, the average melt pool height was 54.5 µm with a semi-elliptical shape, which shows the typical radial heat transfer from the laser incident point [39]. The height of the melt pool is the evidence of the thickness of the layer used for each SLM process. Pore density measurement on the surface of the specimen showed that the porosity density is low, and the specimens were almost full density. Figure 2 shows the surface optical image of the as-built specimen and the corresponding pore density measurement. Most of the pores were small except for a few big ones and, due to their circular shape, they were formed as the result of entrapped gas inside of the layers during the manufacturing process. Moreover, in Figure 3 the surface roughness analysis of the barrier of the specimen is displayed with measured roughness values, skewness, and Kurtosis vs. the profile length. A 2-mm length of the sample was analyzed. Two image values did not evolve during the measurements. The surface roughness Ra value was measured as 14.75 µm with a kurtosis value of Rku = 2.55 and skewness of Rsk = 1.54. As a reference, for a normal distribution of the data, the kurtosis value should be three and skewness should be zero. In Figure 3b it is evident that the high Kurtosis is related to tail distributed values. Moreover, a positive skewness is related to the non-symmetric distribution of the highs and lows in Figure 3a. High Ra value shows that the surface roughness is not good and using a secondary finishing process is crucial to obtain a better surface quality.
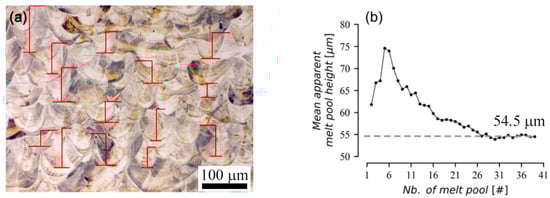
Figure 1.
Selective laser melting SLM processed specimens melt pool size (a) cross-sectional optical image in build direction, melt pools shown with red line (b) mean apparent melt pool height vs. number of melt pools (# is the number of melt pool).
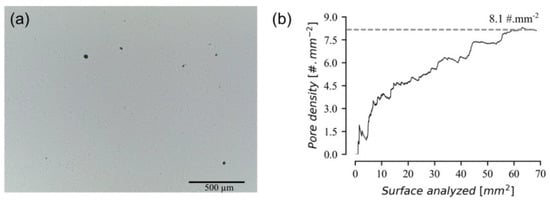
Figure 2.
Pore density measurements (a) surface optical image (b) corresponding pore density vs. analyzed surface (# is the number of pores observed).
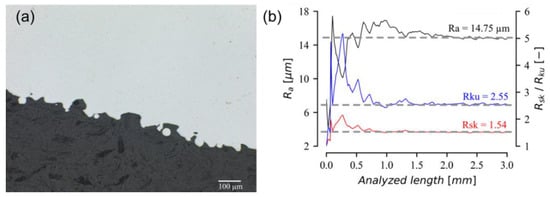
Figure 3.
Surface roughness analysis (a) cross-sectional optical image of the surface in build direction (b) surface roughness values vs. analyzed length.
Figure 4 shows the cross-section SEM images of as-built SLM specimens with different magnification and SEM–EDX mapping of the chemical composition in different positions. As shown in Figure 4b,c both hierarchical and fine columnar microstructure with small spherical pores were observed. The columnar grain growth was continued between two neighbor melting pools and, inside of grains, sub-micron scale cellular dislocation networks were also detected. The dominant structure of as-built specimens was hierarchical, and the overall microstructure was fully austenitic with almost full density. There were also inclusions present in the microstructure, as shown in Figure 4c, which is mostly related to oxide inclusions through the process.
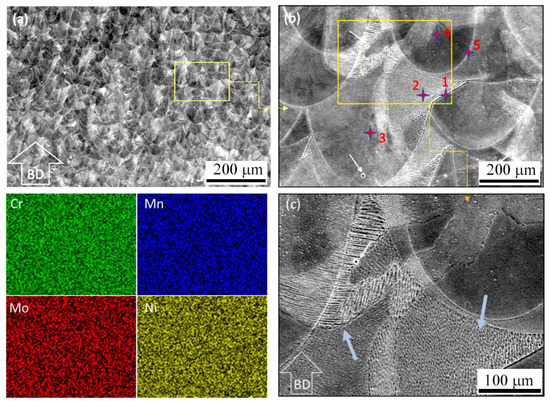
Figure 4.
(a) Cross-sectional SEM analysis, yellow rectangle corresponding to the region magnified (b,c) the hierarchical and fine columnar microstructure with a few small pores and inclusions. SEM–energy-dispersive X-ray spectroscopy (EDX) mapping of the chemical composition for the corresponding yellow rectangle shown for Cr, Mn, Mo and Ni elements, showing well distributed alloying elements. Red starts corresponding to place where point EDX analysis were done and summarized in Table 1.
During the solidification of each melt pool, the cooling rate has a great influence on the grain size and morphology of the microstructure. Discrete and fine needle-shaped microstructure in some regions is a product of high cooling as reported by Qiu et al. [40]. The SEM-EDX mapping results showed that there were no dramatic chemical composition variations in microscale and as-built material was almost homogeneous and fully austenitic. The only observed compositional variation was related to Molybdenum. Moreover, to gain a better quantification of the chemical composition changes, five regions were chosen for EDX analysis, as marked in Figure 4b. The results are summarized in Table 1. Mo weight percentage was lower by a maximum of 0.7 wt.% difference from the melt pool boundary to near the melt pool region that showed a compositional variation of Mo along the melt pool boundaries. For other elements, the change in weight percentage in different areas was negligible.

Table 1.
EDX–SEM compositional analysis (wt.%) of the regions shown in Figure 4b (standard deviation 0.3–0.5 wt.%).
3.2. Residual Stress Analysis
RS measurement of as received and ground specimens with the corresponding depth of cut is summarized in Table 2. Due to the high surface roughness of the as-received specimens, data scattering was observed during RS measurement. The RS of the as-built specimens was measured on the last built surface of the samples. The measured stress was 130 ± 9 MPa in compression in the longitudinal direction. After the solution annealing of the as-built specimens under a controlled Argon atmosphere, the RS magnitude on the same measured point was 65 ± 12 Mpa in compression. This showed that, after annealing, the compressive RS of the specimens lowered and, because of air quenching (to avoid sensitization), thermal stresses formed in the samples, and the sum of thermal tensile RS and previous compressive RS were again in compressive form but with much lower magnitude.
Table 2.
XRD residual stress measurements for annealed and ground specimens with various depth of cut (RS; Residual Stress).
Grinding introduced tensile RS on the surface for all the specimens with different depths of cut. As reported by many researchers, the presence of tensile RS on the surface of the specimens is due to the heavy plastic deformation, metal removal from the surface, and the high thermal gradient caused by the friction of the grinding wheel with the specimen surface [24,25,41]. RS measured was higher for the specimens with a higher depth of cut. During the measurements along the surface of each specimen, a slight difference in RS magnitude was observed, but for all specimens and on all measurement points, the stress was tensile.
3.3. Corrosion Behavior through Potentiodynamic Polarization Tests
Potentiodynamic polarization tests were performed in 3.5% sodium chloride aqueous solution at room temperature to understand the effect of machining induced surface RS on the active–passive behavior of the SLM manufactured specimens. Tests were done on both annealed and ground specimens and the only changing parameter between different specimens was the magnitude of RS. The Potentiodynamic polarization curves measured during the tests are shown in Figure 5. Corrosion potential and corrosion current density were almost the same for specimens with different RS magnitudes with slightly higher potential for the specimens with higher RS. Pitting potential decreased from 595 mVSCE for annealed specimens to 402 mVSCE. For the specimens with the highest tensile RS of 466 MPa. Moreover, in specimens with higher RS magnitudes, the passivation region of the polarization curves was unstable and there were many sudden increases in current density and returning to a lower amount. The instability of the passive region was also observed in annealed specimens and increased in number and potential range for specimens with higher RS magnitudes. High instability potential for the specimens with 306 MPa and 465 MPa tensile RS was around 160 mVSCE and for specimens with 203 MPa tensile RS was 358 mVSCE.
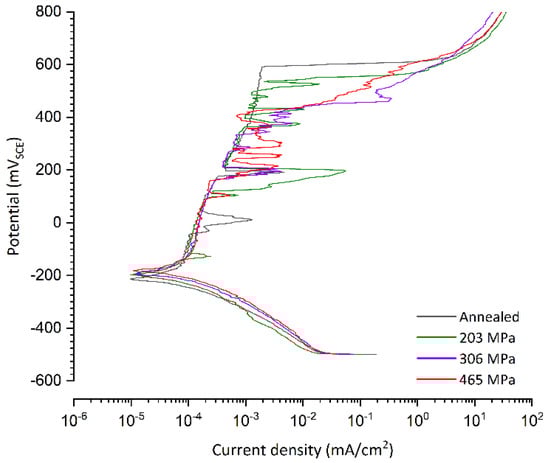
Figure 5.
Potentiodynamic polarization measurements for specimens with different residual stress magnitude.
Pitting susceptibility is reported to be sensitive to various parameters such as surface roughness, surface impurities, and defects [32,42], but in the current investigation, the process parameters of grinding were the same for all the specimens and the surface roughness was the same with minor variations. Moreover, one of the main characteristics of the SLM manufacturing method is the elimination of MnS inclusions as a result of high solidification rates [43,44]. In addition, the intrinsic fine microstructure of the SLM method leads to undemanding diffusion of Cr to the surface that makes the formation of the oxide layer on the surface more uniform and compact and enhances the overall corrosion resistance compared to other methods [45,46,47]. On the other hand, all specimens were manufactured with the same SLM process parameters that make the pore density the same for all specimens.
None of the mentioned parameters could be the reason for the reduction in pitting resistance for specimens with higher RS magnitude. Thus, the only parameter left that could explain the observed experimental results is the variation of RS through specimens which has a remarkable effect on the corrosion behavior.
The formation and dissolution of the passive layer take place simultaneously [48,49,50,51]. When the rate of dissolution is higher than the formation rate, the breakdown of the passive layer occurs in the areas with higher disorders. The factors that contribute to increasing the rate of dissolution are the straining of the metal, thermal stresses, turbulence fluid flow during melting and solidification, and susceptible surface defects. Local layer dissolution occurs due to the chemical reactions between the passive layer and aggressive chloride ions in the solution. In the absence of applied or residual tensile stress, the passive layer gradually continues to become thinner and, finally, the breakdown occurs. Thus, the breakdown could take a long run owing to the simultaneous formation of the layer. On the other hand, in the presence of tensile stresses on the surface, mechanical rupture occurs on the passive film after the dissolution of the layer reaches a critical thickness which plays a vital role in the breakdown of the passive layer on the surface. Consequently, a higher magnitude of tensile stresses means that mechanical rupture can occur at higher thicknesses which makes the surface more vulnerable to SCC and pitting occurrence in lower dissolution rates. In the opposite case, for the presence of compressive stresses, the layer dissolves until the complete breakdown of the layer. Then, elastic or plastic (depending on the magnitude of compressive stresses) movement of adjacent atoms due to compressive stresses around the broken point leads to self-healing of the surface. Therefore, during the Potentiodynamic polarization tests, pitting potential is much lower for the specimens with higher tensile RS and stable pitting occurs at lower potentials. Over the past years, many researchers reported the same effect in the presence of compressive RS which can slow the breakdown of the passive layer and pit/crack initiation [52,53,54,55].
3.4. Galvanostatic Behavior
Galvanostatic tests were performed to investigate the effect of grinding-induced RS on SCC susceptibility by accelerating corrosion attack on the surface. For each group of specimens with similar surface RS magnitude, the tests were conducted with different immersion times to detect the evolution of SCC initiation and propagation. As explained before, galvanostatic tests were done with a current density of 0.003538 mA/Cm2 (current of 0.001 mA on a surface with a diameter of 6 mm) and results are shown in Figure 6. The maximum detected potential for annealed specimens was 559.7 mV, and samples with 207 MPa stress levels were quite similar to annealed specimens with a potential of 553.4 mV. The maximum potential was much lower for specimens with a higher RS magnitude.
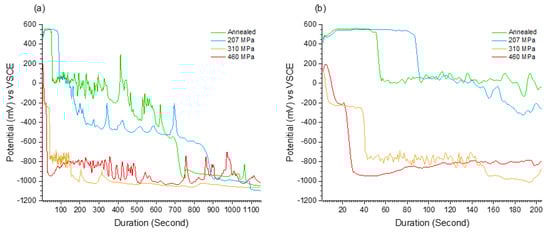
Figure 6.
Galvanostatic results for specimens with different residual stress (RS) magnitudes showing 3 distinctive regions (a) the whole test time (b) the first 200 s.
For all specimens with different stress levels, the potential dropped dramatically after a definite period. The time before the first drop in potential was much longer for the annealed and 207 MPa specimens than 310 Mpa and 460 Mpa specimens. For annealed, 207 Mpa and 310 Mpa specimens, a further significant potential drop was observed. After that, the potential stabilized. Instead, for the 460 Mpa specimen, after the first potential drop, the potential continued to exhibit a metastable behavior that is visible in the figure as a strong oscillation of the potential. The metastable potential for specimens with 217 Mpa was lower than for annealed specimens. Moreover, the potential of the metastable region was much lower for specimens with a higher RS magnitude. Specimens with 460 MPa RS showed longer metastable behavior with lower peaks during the final minutes of the test. The presence of three distinctive regions is clear from the galvanostatic data. The potential and duration for each region with the corresponding RS magnitude are summarized in Table 3.
Table 3.
Potential and duration of different stages during galvanostatic measurements for various RS magnitudes.
The galvanostatic behavior of the analyzed samples can be divided into three regions as illustrated in Figure 7: incubation, metastable and stable regions. For annealed and specimens with low RS magnitude, the incubation region was much longer compared to higher RS cases. For specimens with RS levels lower than a critical amount, the stress level is not enough for the activation of the mechanical rupture of the passive film. In this case, pitting corrosion occurs because of the thinning of the passive film due to the dissolution of the passive film. Thus, it takes more time compared to the condition with the presence of high RS for the breakdown of the passive layer. Another important reason for the shorter incubation time exhibited by specimens with high RS magnitude is related to the early stages of SCC initiation. New surfaces of cracks at the initiation stage were not protected by a passive oxide layer which accelerates the corrosion attack and leads to shorter incubation time. In the specimens with higher RS magnitude, longer metastable behavior is due to the simultaneous occurrence of SCC propagation and pitting corrosion. In the stable region, corrosion attack continues without a barrier for all specimens with different RS magnitude, and the activation potential needed for the corrosion attack is much lower than the potential at the beginning of the galvanostatic measurements. This could be as a result of complete dissolution of the machining affected layer in local places and reaching the thickness of the pits to the base metal. Thus, the corrosion behavior detected was almost the same for all specimens. In the previous investigation on rolled and machined sheets of 316L Austenitic stainless steel, the same behavior was detected [35], which shows that after passing the machining-affected layer the corrosion behavior is the same for all specimens irrespective of surface RS magnitude.
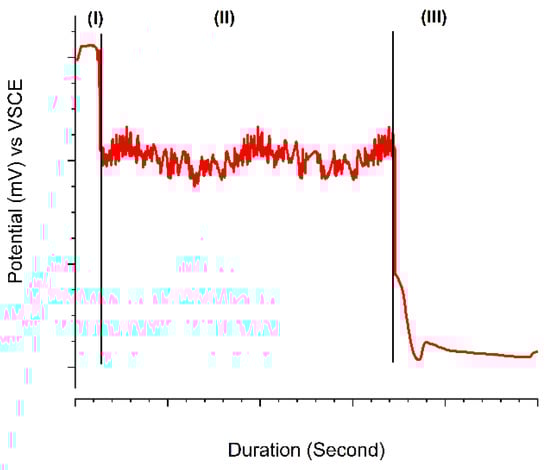
Figure 7.
Schematic figure with corresponding stages of galvanostatic tests for specimens with different residual stress magnitude. Region 1 is the incubation region, region 2 is metastable pitting and SCC initiation and region 3 is the stable pitting and SCC propagation region namely. The duration and potential of each region vary with the variation of tensile RS on the surface.
3.5. Microstructural Analysis
3.5.1. Machining Surface Analysis after Galvanostatic Tests
Figure 8 shows the surface of the specimens after 200 s of Galvanostatic tests. As shown in the figure, there was no sign of cracks on the surface of all the specimens. The main difference between specimens was the density of small pits, which is higher for the samples with higher RS magnitude. The surface analysis showed that new pits formation inclined to initiate in the machining direction, whereas the annealed samples did not follow this trend and pits were concentrated in local places. Overall, pit density was higher in specimens with higher RS magnitudes. For annealed specimens, pitting was mostly limited to fewer sites and, over time, the growth was in the same local points. For a longer immersion duration, initiated pits grew on the surface for all specimens, as shown in Figure 9.
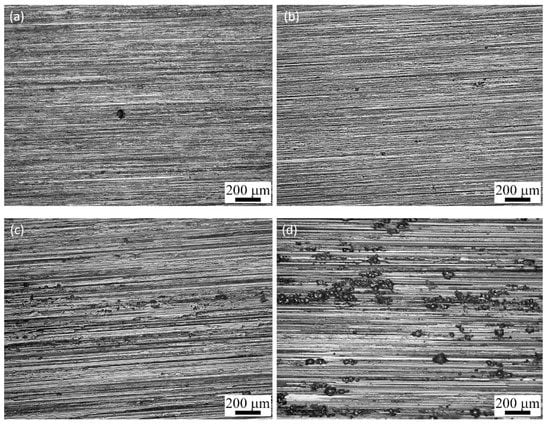
Figure 8.
Surface optical images after 200 s of Galvanostatic testing in 3.5% sodium chloride aqueous solution for (a) annealed (b) 207 MPa (c) 310 MPa (d) 460 MPa.
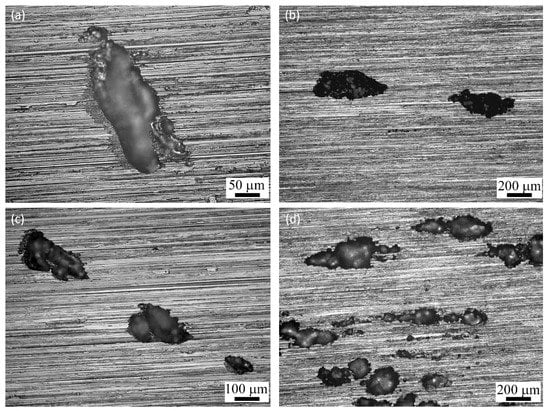
Figure 9.
Surface optical images of the surface after 1000 s of Galvanostatic test in 3.5% sodium chloride aqueous solution for (a) annealed (b) 207 MPa (c) 310 MPa (d) 460 MPa.
3.5.2. SCC Initiation
SEM cross-section analysis of the specimens with different RS magnitudes took place after various immersion times. Specimens were further analyzed by terminating the test in different time steps and investigating the cross-sectioned surfaces. The duration of the galvanostatic tests before SEM analysis was based on observed changes in potential vs. time figures. The analysis revealed a complex interaction of the RS magnitude with the morphology of cracks during SCC initiation stage. Figure 10 shows the cross-section of the annealed and 207 MPa specimens after different immersion times. The main corrosion form was pitting, and pits showed the tendency to grow in the build direction which agrees with surface microstructural images.
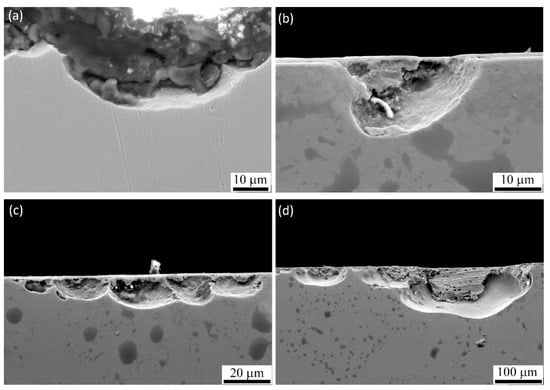
Figure 10.
SEM image of specimens (a) annealed after 70 s (b) annealed after 700 s (c) 207 MPa RS magnitude specimen after 120 s and (d) after 1000 s showing the tendency of pits to grow in the build direction instead of longitudinally for annealed specimens and increasing the depth of surface pits for the 207 MPa sample.
Interesting results were revealed for specimens with higher RS magnitude. For both 310 MPa shown in Figure 11 and 460 MPa specimens shown in Figure 12, SCC cracks were detected. In the specimens with 310 MPa RS magnitude, cracks were initiated from small pits that were the place of existing porosities and grew along the melt pool boundaries, as shown in Figure 11b. For specimens with 460 MPa RS, the situation was more intense, and cracks were initiated along multiple directions i.e., melt pool boundaries, near-surface parallel to the surface of the specimen and transgranular cracks. Moreover, at high RS magnitudes, the initiation of the cracks was not limited to surface pits. Existing pores and melt pool boundaries on the surface also activated as precursors for SCC initiation, as shown in Figure 12 and Figure 13.
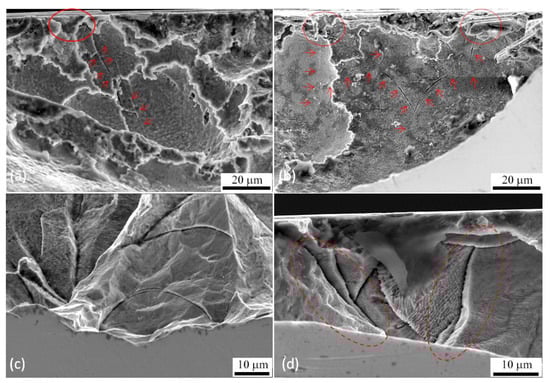
Figure 11.
SEM Images of specimens with 310 MPa RS magnitude at different immersion times and magnifications (a) after 150 s showing the initiation of the crack from surface pits shown in red circle and crack initiation shown with red arrows (b) after 400 s with the evidence of stress corrosion cracking (SCC) propagation along the melt pool boundaries and dominant surface pores and pits as precursors for SCC initiation shown in red arrows (c,d) crack propagation in early stages of corrosion attack on the surface with higher magnification showing selective corrosion and SCC attack along the columnar grains and melt pool boundaries which is shown in elliptical red zones.
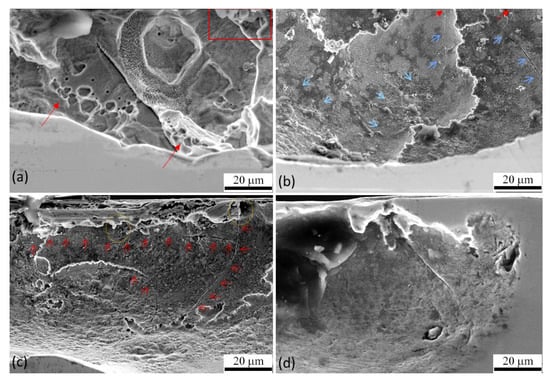
Figure 12.
SEM images of specimens with 460 MPa RS magnitude with various immersion times (a) early stage of corrosion attack after 100 s showing micro pitting shown with red arrows inside of the primary pit and SCC initiation along the melt pool boundaries (b) SCC initiation from the melt pool boundaries on the surface shown with arrows (c) highly cracked pit surface after 250 s of immersion time with evidence of transgranular SCC beneath the surface which is shown with red arrows, in the longitudinal direction, crack initiation from surface melt pool boundaries and propagation in both melt pool boundaries and transgranular form (d) crevice corrosion from existing surface pore with the sign of transgranular SCC propagation along the build direction and near-surface longitudinal direction.
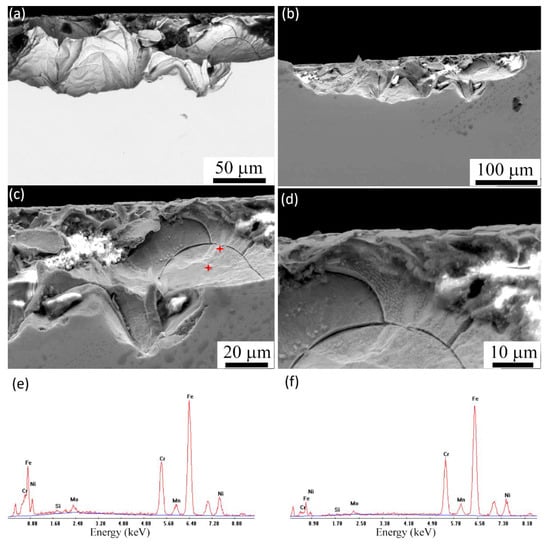
Figure 13.
SEM images of specimens with 460 MPa RS magnitude after galvanostatic test condition with the immersion time of 500 s; (a) backscatter electron mode image with clear evidence of SCC cracks along melt pool direction, transgranular crack propagation, tearing due to high RS magnitude, and SCC branching in both melt pool direction and transgranular form. (b–d) Secondary electron mode images with different magnifications showing SCC crack branching along the melt pool boundaries (e,f) EDX–SEM analysis of the point shown on image (c) with red stars, showing slight segregation of Molybdenum the near melt pool.
Since in the author’s previous investigation, cracks were not detected in even high RS magnitudes in cold rolled sheets after grinding [35]; to understand the reasons for the detection of SCC cracks in SLM specimens with high RS, it is important to consider the synergistic effect of various factors. First, the intrinsic pores on the surface of SLM specimens act as stress concentration sites in the presence of tensile stresses and this causes higher stress levels within pores [56,57]. Higher tensile stress magnitudes lead to higher stress intensity in pore sites and these zones become more prone to SCC.
Second, SCC initiation and growth are related to the inherent microstructure of the SLM process due to the Marangoni effect and highly concentrated melting and solidification of the melt pools [58,59]. In the current work, galvanostatic tests combined with SEM cross-sectional analysis showed that SCC cracks initiation and propagation occurred within a short period along the melt pool boundaries. Figure 13 shows SCC cracks with higher magnification for specimens with 460 MPa tensile RS, which is the clear evidence for brittle fracture of the material along the melt pool boundaries, without any sign of ductile fracture. In contrast, heat flow direction during the solidification of each melt pool leads to directional grain growth that introduces thermal RS through the solidification. Excessive cooling rate combined with directional solidification and thermal RS produces a high density of dislocations along the melt pool boundaries as investigated by Lou et al. [60]. Higher dislocation density along the melt pool boundaries leads to higher vulnerability of these sites to SCC initiation and propagation and this leads to a preferential path of crack propagation along melt pool boundaries. From the experimental data obtained in this investigation, it is apparent that for higher Tensile RS magnitudes these sites could be activated as SCC crack initiation places.
Third, strain-induced martensite and nanocrystalline grain structure on the surface—as a result of the grinding process—leads to even higher surface susceptibility to the corrosion attacks and SCC initiation [32,61]. This means that the machining affected layer is brittle compared to the base metal and the distance needed for crack initiation is lower because of nanocrystalline microstructure. Hence, it is apparent from the explained factors that higher tensile RS magnitude could dramatically increase the risk of crack initiation in SLM specimens after grinding.
The question that has remained unanswered is the priority of the cases as a function of stress magnitude. From the SEM images shown in Figure 11 and Figure 12, it is apparent that the stress concentration sites are the first sensitive local places for the SCC initiation, and in the case of higher tensile RS conditions, other sites are also activated. As shown in Figure 11, for specimens with RS magnitude of 310 MPa, cracks initiated mostly from pores and machining defects, but for specimens with a higher RS of 460 MPa in Figure 12 and Figure 13, cracks also initiated from melt pool boundaries on the surface. This demonstrates that, in the presence of tensile RS on the surface, the first vulnerable places for SCC initiation are the pore sites and the surface defects induced by machining. Melt pool boundaries are activated as preferential sites for SCC crack initiation at higher stress magnitudes.
3.5.3. SCC Propagation
As shown in Figure 12a,b the transgranular cracks were propagated in the columnar microstructure of the specimens. The dominant crack propagation path for specimens with high RS magnitude was in two main directions, along the melt pool boundaries and in the longitudinal direction near the surface as shown in Figure 12b,c.
The crack propagation path during the early stages after SCC initiation could be related to inverse segregation of Mo at melt pool boundaries reported in Figure 4 and Table 1. This result is ascribable by solute redistribution during the solidification of each melt pool as reported in recent investigations [40,62,63]. Further EDX analysis of regions near to SCC cracks shown in Figure 13e,f and Table 4, make in evidences the slight Mo segregation during the very rapid solidification. Since Mo is added to austenitic stainless steels to improve the corrosion resistance of the active sites [64], inverse segregation of this alloying element leads to a lower corrosion resistance at the melt pool boundaries. As a result, the melt pool boundaries are sensitive areas for selective corrosion attacks and SCC initiation and propagation. In the presence of high tensile RS, cracks propagated along the melt pool boundaries.
Table 4.
EDX–SEM compositional analysis (wt.%) of the regions shown in Figure 13c,e,f (standard deviation 0.3–0.5 wt.%).
However, in the specimens with 460 MPa stress, transgranular SCC was also observed and propagation was favored through the grains rather than along the grain boundaries. Furthermore, as suggested by Spencer et al., propagation of SCC in transgranular form occurs as a result of the generation of dislocations on slip planes followed by the preferential oxidation of these slip planes and finally the brittle fracture of the oxides in the presence of the critical stress magnitude [65]. Moreover, propagation of the existing cracks through fine columnar grains is much easier compared to hierarchical grains and this leads to a preferential transgranular SCC propagation along fine columnar grains for SLM manufactured specimens. Figure 14 is an illustration of the events happening during the SCC tests for different levels of RS that summarizes the overall relation of RS magnitude with SCC initiation sites and propagation.
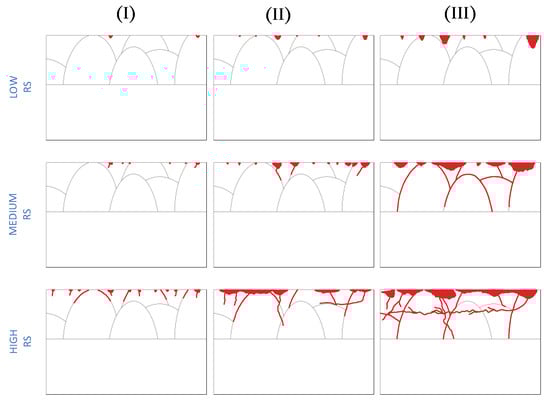
Figure 14.
Schematic illustration of pitting and SCC initiation and propagation for specimens with different RS magnitudes showing preferential position and path for each level (I, II, III corresponding to different stages of galvanostatic observed events).
4. Conclusions
The main objective of this paper was to investigate the effect of grinding-induced tensile RS on the susceptibility of SLM processed 316L austenitic stainless steel to SCC. The obtained comprehensive results are summarized as follows:
- Galvanostatic measurements showed three distinctive regions, namely incubation, metastable, and stable regions, followed by a sudden potential drop on each stage.
- There was a significant correlation between the measured RS magnitude and the time and potential of incubation and metastable regions. For higher RS magnitudes the potential drops occurred dramatically in a shorter period.
- For annealed specimens and specimens with a low magnitude of RS, the dominant corrosion defect observed was pitting without any sign of SCC.
- For specimens with higher RS magnitudes, cracks were initiated from porosities, machining marks, melt pool boundaries, and transgranular form within grains. The most remarkable correlation was the priority of initiation sites with the magnitude of tensile RS.
- Cracks were initiated from surface pores for medium magnitudes of RS and melt pool boundaries and machining marks for specimens with the highest measured RS magnitude.
- SCC propagation was along the melt pool boundaries that showed high susceptibility of melt pool boundaries to SCC propagation followed by transverse propagation in a longitudinal direction near to the surface and transgranular propagation.
- Transgranular propagation in build direction was observed for specimens with high RS magnitude that was mostly in the columnar microstructure.
- High solidification rate and inverse segregation of Molybdenum along the melt pool boundaries combined with the machining induced tensile RS lead to the high susceptibility of SLM microstructure and especially melt pool boundaries to SCC initiation and propagation.
Author Contributions
Conceptualization, A.Y. and M.D.; investigation, A.Y., M.L. and C.G.; data curation, A.Y.; writing—original draft preparation, A.Y.; writing—review and editing, A.Y. and M.D; supervision, M.D. All authors have read and agreed to the published version of the manuscript.
Funding
This research received no external funding.
Institutional Review Board Statement
Not Applicable.
Informed Consent Statement
Not Applicable.
Data Availability Statement
The raw data with the findings of this article cannot be shared since there is in-progress research on this topic.
Acknowledgments
Authors acknowledge support from the National Institute for Nuclear Physics, Padova division (Italy) for their kind collaboration. We also thank Jocelyn Delahaye for his collaboration in the as-received specimens quality assessment.
Conflicts of Interest
The authors declare no conflict of interest.
References
- Bourell, D.L. Perspectives on Additive Manufacturing. Annu. Rev. Mater. Res. 2016, 46, 1–18. [Google Scholar] [CrossRef]
- Rosen, D.W. A review of synthesis methods for additive manufacturing. Virtual Phys. Prototyp. 2016, 11, 305–317. [Google Scholar] [CrossRef]
- DebRoy, T.; Wei, H.L.; Zuback, J.S.; Mukherjee, T.; Elmer, J.W.; Milewski, J.O.; Beese, A.M.; Wilson-Heid, A.; De, A.; Zhang, W. Additive manufacturing of metallic components—Process, structure and properties. Prog. Mater. Sci. 2018, 92, 112–224. [Google Scholar] [CrossRef]
- Herzog, D.; Seyda, V.; Wycisk, E.; Emmelmann, C. Additive manufacturing of metals. Acta Mater. 2016, 117, 371–392. [Google Scholar] [CrossRef]
- Roberts, I.A.; Wang, C.J.; Esterlein, R.; Stanford, M.; Mynors, D.J. A three-dimensional finite element analysis of the temperature field during laser melting of metal powders in additive layer manufacturing. Int. J. Mach. Tools Manuf. 2009, 49, 916–923. [Google Scholar] [CrossRef]
- Li, Y.; Gu, D. Parametric analysis of thermal behavior during selective laser melting additive manufacturing of aluminum alloy powder. Mater. Design 2014, 63, 856–867. [Google Scholar] [CrossRef]
- Sames, W.J.; Unocic, K.A.; Dehoff, R.R.; Lolla, T.; Babu, S.S. Thermal effects on microstructural heterogeneity of Inconel 718 materials fabricated by electron beam melting. J. Mater. Res. 2014, 29, 1920–1930. [Google Scholar] [CrossRef]
- Shen, N.; Chou, K. Numerical thermal analysis in electron beam additive manufacturing with preheating effects. In Proceedings of the 23rd Solid Freeform Fabrication Symposium, Austin, TX, USA, 6–8 August 2012; pp. 774–784. [Google Scholar]
- Jia, Q.; Gu, D. Selective laser melting additive manufacturing of Inconel 718 superalloy parts: Densification, microstructure and properties. J. Alloys Compd. 2014, 585, 713–721. [Google Scholar] [CrossRef]
- Kong, D.; Ni, X.; Dong, C.; Lei, X.; Zhang, L.; Man, C.; Yao, J.; Cheng, X.; Li, X. Bio-functional and anti-corrosive 3D printing 316L stainless steel fabricated by selective laser melting. Mater. Des. 2018, 152, 88–101. [Google Scholar] [CrossRef]
- Li, R.; Liu, J.; Shi, Y.; Wang, L.; Jiang, W. Balling behavior of stainless steel and nickel powder during selective laser melting process. Int. J. Adv. Manuf. Technol. 2012, 59, 1025–1035. [Google Scholar] [CrossRef]
- Sanviemvongsak, T.; Monceau, D.; Macquaire, B. High temperature oxidation of IN 718 manufactured by laser beam melting and electron beam melting: Effect of surface topography. Corros. Sci. 2018, 141, 127–145. [Google Scholar] [CrossRef]
- Sieradzki, K.; Newman, R. Stress-corrosion cracking. J. Phys. Chem. Solids 1987, 48, 1101–1113. [Google Scholar] [CrossRef]
- Sander, G.; Tan, J.; Balan, P.; Gharbi, O.; Feenstra, D.; Singer, L.; Thomas, S.; Kelly, R.; Scully, J.; Birbilis, N. Corrosion of Additively Manufactured Alloys: A Review. Corrozsion 2018, 74, 1318–1350. [Google Scholar] [CrossRef]
- Örnek, C. Additive manufacturing—A general corrosion perspective. Corros. Eng. Sci. Technol. 2018, 53, 531–535. [Google Scholar] [CrossRef]
- Turnbull, A. Corrosion pitting and environmentally assisted small crack growth. Proc. R. Soc. A Math. Phys. Eng. Sci. 2014, 470, 20140254. [Google Scholar] [CrossRef]
- Dietzel, W.; Turnbull, A. Stress Corrosion Cracking; GKSS-Forschungszentrum Geesthacht GmbH: Geesthacht, Germany, 2007. [Google Scholar]
- Tian, Y.; Tomus, D.; Rometsch, P.; Wu, X. Influences of processing parameters on surface roughness of Hastelloy X produced by selective laser melting. Addit. Manuf. 2017, 13, 103–112. [Google Scholar] [CrossRef]
- Strano, G.; Hao, L.; Everson, R.M.; Evans, K.E. Surface roughness analysis, modelling and prediction in selective laser melting. J. Mater. Process. Technol. 2013, 213, 589–597. [Google Scholar] [CrossRef]
- Vaithilingam, J.; Goodridge, R.D.; Hague, R.J.; Christie, S.D.; Edmondson, S. The effect of laser remelting on the surface chemistry of Ti6al4V components fabricated by selective laser melting. J. Mater. Process. Technol. 2016, 232, 1–8. [Google Scholar] [CrossRef]
- Damon, J.; Dietrich, S.; Vollert, F.; Gibmeier, J.; Schulze, V. Process dependent porosity and the influence of shot peening on porosity morphology regarding selective laser melted AlSi10Mg parts. Addit. Manuf. 2018, 20, 77–89. [Google Scholar] [CrossRef]
- Haušild, P.; Davydov, V.; Drahokoupil, J.; Landa, M.; Pilvin, P. Characterization of strain-induced martensitic transformation in a metastable austenitic stainless steel. Mater. Des. 2010, 31, 1821–1827. [Google Scholar] [CrossRef]
- Kruszyński, B.W.; Wójcik, R. Residual stress in grinding. J. Mater. Process. Technol. 2001, 109, 254–257. [Google Scholar] [CrossRef]
- Balart, M.; Bouzina, A.; Edwards, L.; Fitzpatrick, M. The onset of tensile residual stresses in grinding of hardened steels. Mater. Sci. Eng. A 2004, 367, 132–142. [Google Scholar] [CrossRef]
- Hauk, V.; Oudelhoven, R.; Vaessen, G. The state of residual stress in the near surface region of homogeneous and heterogeneous materials after grinding. Met. Mater. Trans. A 1982, 13, 1239–1244. [Google Scholar] [CrossRef]
- Withers, P. Residual stress and its role in failure. Rep. Prog. Phys. 2007, 70, 2211. [Google Scholar] [CrossRef]
- Bruschi, S.; Pezzato, L.; Ghiotti, A.; Dabalà, M.; Bertolini, R. Effectiveness of using low-temperature coolants in machining to enhance durability of AISI 316L stainless steel for reusable biomedical devices. J. Manuf. Process. 2019, 39, 295–304. [Google Scholar] [CrossRef]
- Acharyya, S.; Khandelwal, A.; Kain, V.; Kumar, A.; Samajdar, I. Surface working of 304L stainless steel: Impact on microstructure, electrochemical behavior and SCC resistance. Mater. Charact. 2012, 72, 68–76. [Google Scholar] [CrossRef]
- Zhou, S.; Turnbull, A. Effect of stress transients on the crack propagation rate in steam turbine disc steel. Corrosion 2006, 62, 508–513. [Google Scholar] [CrossRef]
- Bland, L.G.; Locke, J.S.W. Chemical and electrochemical conditions within stress corrosion and corrosion fatigue cracks. npj Mater. Degrad. 2017, 1, 1–8. [Google Scholar] [CrossRef]
- Zhang, W.; Fang, K.; Hu, Y.; Wang, S.; Wang, X. Effect of machining-induced surface residual stress on initiation of stress corrosion cracking in 316 austenitic stainless steel. Corros. Sci. 2016, 108, 173–184. [Google Scholar] [CrossRef]
- Turnbull, A.; Mingard, K.; Lord, J.; Roebuck, B.; Tice, D.; Mottershead, K.; Fairweather, N.; Bradbury, A. Sensitivity of stress corrosion cracking of stainless steel to surface machining and grinding procedure. Corros. Sci. 2011, 53, 3398–3415. [Google Scholar] [CrossRef]
- Volpe, L.; Burke, M.G.; Scenini, F. Understanding the role of Diffusion Induced Grain Boundary Migration on the preferential intergranular oxidation behaviour of Alloy 600 via advanced microstructural characterization. Acta Mater. 2019, 175, 238–249. [Google Scholar] [CrossRef]
- Chang, L.; Volpe, L.; Wang, Y.L.; Burke, M.G.; Maurotto, A.; Tice, D.; Lozano-Perez, S.; Scenini, F. Effect of machining on stress corrosion crack initiation in warm-forged type 304L stainless steel in high temperature water. Acta Mater. 2019, 165, 203–214. [Google Scholar] [CrossRef]
- Yazdanpanah, A.; Biglari, F.R.; Arezoodar, A.F.; Dabalà, M. Role of grinding induced surface residual stress on probability of stress corrosion cracks initiation in 316L austenitic stainless steel in 3.5% sodium chloride aqueous solution. Corros. Eng. Sci. Technol. 2020, 1–12. [Google Scholar] [CrossRef]
- ASTM. F138-08 Standard Specification for Wrought 18Chromium-14Nickel-2.5 Molybdenum Stainless Steel Bar and Wire for Surgical Implants (UNS S31673). ASTM F138 (Medical Device Standards and Implant Standards). 2003. Available online: https://www.astm.org/DATABASE.CART/HISTORICAL/F138-08.htm (accessed on 20 January 2021).
- Fitzpatric, M.; Fry, A. Measurement Good Practice Guide No. 52 Determination of Residual Stresses by X-ray Diffraction-Issue 2; NPL-National Physics Laboratory: London, UK, 2013. [Google Scholar]
- ASTM. G 59-97 (2014)—Standard Test Method for Conducting Potentiodynamic Polarization Resistance Measurements; ASTM International: West Conshohocken, PA, USA, 2014. [Google Scholar]
- Gunenthiram, V.; Peyre, P.; Schneider, M.; Dal, M.; Coste, F.; Fabbro, R. Analysis of laser–melt pool–powder bed interaction during the selective laser melting of a stainless steel. J. Laser Appl. 2017, 29, 022303. [Google Scholar] [CrossRef]
- Qiu, C.; Kindi, M.A.; Aladawi, A.S.; Hatmi, I.A. A comprehensive study on microstructure and tensile behaviour of a selectively laser melted stainless steel. Sci. Rep. 2018, 8, 1–16. [Google Scholar] [CrossRef] [PubMed]
- Ghosh, S.; Kain, V. Effect of surface machining and cold working on the ambient temperature chloride stress corrosion cracking susceptibility of AISI 304L stainless steel. Mater. Sci. Eng. A 2010, 527, 679–683. [Google Scholar] [CrossRef]
- Hong, T.; Nagumo, M. Effect of surface roughness on early stages of pitting corrosion of type 301 stainless steel. Corros. Sci. 1997, 39, 1665–1672. [Google Scholar] [CrossRef]
- Lou, X.; Song, M.; Emigh, P.W.; Othon, M.A.; Andresen, P.L. On the stress corrosion crack growth behaviour in high temperature water of 316L stainless steel made by laser powder bed fusion additive manufacturing. Corros. Sci. 2017, 128, 140–153. [Google Scholar] [CrossRef]
- Lou, X.; Andresen, P.L.; Rebak, R.B. Oxide inclusions in laser additive manufactured stainless steel and their effects on impact toughness and stress corrosion cracking behavior. J. Nucl. Mater. 2018, 499, 182–190. [Google Scholar] [CrossRef]
- Sander, G.; Thomas, S.; Cruz, V.; Jurg, M.; Birbilis, N.; Gao, X.; Brameld, M.; Hutchinson, C. On the corrosion and metastable pitting characteristics of 316L stainless steel produced by selective laser melting. J. Electrochem. Soc. 2017, 164, C250–C257. [Google Scholar] [CrossRef]
- Kong, D.; Dong, C.; Ni, X.; Li, X. Corrosion of metallic materials fabricated by selective laser melting. npj Mater. Degrad. 2019, 3, 1–14. [Google Scholar] [CrossRef]
- Zhu, Z.G.; Nguyen, Q.B.; Ng, F.L.; An, X.H.; Liao, X.Z.; Liaw, P.K.; Nai, S.M.L.; Wei, J. Hierarchical microstructure and strengthening mechanisms of a CoCrFeNiMn high entropy alloy additively manufactured by selective laser melting. Scr. Mater. 2018, 154, 20–24. [Google Scholar] [CrossRef]
- Lin, L.; Chao, C.; Macdonald, D. A point defect model for anodic passive films II. Chemical breakdown and pit initiation. J. Electrochem. Soc. 1981, 128, 1194–1198. [Google Scholar] [CrossRef]
- Macdonald, D.D. The point defect model for the passive state. J. Electrochem. Soc. 1992, 139, 3434. [Google Scholar] [CrossRef]
- Fattah-Alhosseini, A.; Soltani, F.; Shirsalimi, F.; Ezadi, B.; Attarzadeh, N. The semiconducting properties of passive films formed on AISI 316 L and AISI 321 stainless steels: A test of the point defect model (PDM). Corros. Sci. 2011, 53, 3186–3192. [Google Scholar] [CrossRef]
- Macdonald, D.D. The history of the point defect model for the passive state: A brief review of film growth aspects. Electrochim. Acta 2011, 56, 1761–1772. [Google Scholar] [CrossRef]
- Peyre, P.; Carboni, C.; Forget, P.; Beranger, G.; Lemaitre, C.; Stuart, D. Influence of thermal and mechanical surface modifications induced by laser shock processing on the initiation of corrosion pits in 316L stainless steel. J. Mater. Sci. 2007, 42, 6866–6877. [Google Scholar] [CrossRef]
- Liu, X.; Frankel, G. Effects of compressive stress on localized corrosion in AA2024-T3. Corros. Sci. 2006, 48, 3309–3329. [Google Scholar] [CrossRef]
- Van Boven, G.; Chen, W.; Rogge, R.; Sutherby, R. The Effect of Residual Stress on Pitting and Stress Corrosion Cracking of High Pressure Natural Gas Pipelines. Acta Mater. 2007, 55, 29–43. [Google Scholar] [CrossRef]
- Chao, Q.; Cruz, V.; Thomas, S.; Birbilis, N.; Collins, P.; Taylor, A.; Hodgson, P.D.; Fabijanic, D. On the enhanced corrosion resistance of a selective laser melted austenitic stainless steel. Scr. Mater. 2017, 141, 94–98. [Google Scholar] [CrossRef]
- Zehnder, A.T. Fracture Mechanics; Lecture Notes in Applied and Computational Mechanics; Springer: Berlin/Heidelberg, Germany, 2012; ISBN 978-94-007-2594-2. [Google Scholar]
- Anderson, T.L. Fracture Mechanics: Fundamentals and Applications; CRC Press: Boca Raton, FL, USA, 2017. [Google Scholar]
- Antony, K.; Arivazhagan, N. Studies on energy penetration and marangoni effect during laser melting process. J. Eng. Sci. Technol. 2015, 10, 509–525. [Google Scholar]
- Rombouts, M.; Kruth, J.P.; Froyen, L.; Mercelis, P. Fundamentals of Selective Laser Melting of alloyed steel powders. CIRP Ann. 2006, 55, 187–192. [Google Scholar] [CrossRef]
- Man, C.; Duan, Z.; Cui, Z.; Dong, C.; Kong, D.; Liu, T.; Chen, S.; Wang, X. The effect of sub-grain structure on intergranular corrosion of 316L stainless steel fabricated via selective laser melting. Mater. Lett. 2019, 243, 157–160. [Google Scholar] [CrossRef]
- Martin, M.; Weber, S.; Izawa, C.; Wagner, S.; Pundt, A.; Theisen, W. Influence of machining-induced martensite on hydrogen-assisted fracture of AISI type 304 austenitic stainless steel. Int. J. Hydrogen Energy 2011, 36, 11195–11206. [Google Scholar] [CrossRef]
- Wang, X.; Carter, L.N.; Pang, B.; Attallah, M.M.; Loretto, M.H. Microstructure and yield strength of SLM-fabricated CM247LC Ni-Superalloy. Acta Mater. 2017, 128, 87–95. [Google Scholar] [CrossRef]
- Wang, Y.M.; Voisin, T.; McKeown, J.T.; Ye, J.; Calta, N.P.; Li, Z.; Zeng, Z.; Zhang, Y.; Chen, W.; Roehling, T.T.; et al. Additively manufactured hierarchical stainless steels with high strength and ductility. Nat. Mater. 2018, 17, 63–71. [Google Scholar] [CrossRef] [PubMed]
- Marcus, P. Corrosion Mechanisms in Theory and Practice; CRC Press: Boca Raton, FL, USA, 2011. [Google Scholar]
- Spencer, D.T.; Edwards, M.R.; Wenman, M.R.; Tsitsios, C.; Scatigno, G.G.; Chard-Tuckey, P.R. The initiation and propagation of chloride-induced transgranular stress-corrosion cracking (TGSCC) of 304L austenitic stainless steel under atmospheric conditions. Corros. Sci. 2014, 88, 76–88. [Google Scholar] [CrossRef]


Publisher’s Note: MDPI stays neutral with regard to jurisdictional claims in published maps and institutional affiliations. |
© 2021 by the authors. Licensee MDPI, Basel, Switzerland. This article is an open access article distributed under the terms and conditions of the Creative Commons Attribution (CC BY) license (http://creativecommons.org/licenses/by/4.0/).