Abstract
The foaming process is an important part of the electric arc furnace (EAF) steelmaking process. It can promote thermal efficiency and reduce refractory consumption. FeO is a key material used during the foaming process. Unlike with other components used in forming foaming slag, the amount of FeO can be controlled by oxygen or carbon injection. Therefore, adjusting the content of FeO is the most economical foaming mode adopted for the EAFs steelmaking process. In this study, the influence of FeO content on the physical properties of slag was discussed. The melting temperature of the slag was evaluated using three methods: viscosity experiment, using Thermo-Calc simulation software, and high-temperature optical method. The experimental results revealed that the viscosity of slag increases as FeO content decreases. The results also revealed that foam height ratio exhibited a positive correlation with the viscosity of slag.
1. Introduction
The electric arc furnace (EAF) steelmaking process involves the consumption of high amounts of electric energy. As scraps are being increasingly recycled, the demand for EAFs has gradually increased. Thus, it has become increasingly important to save energy during the EAF steelmaking process. Several important techniques such as scrap preheating, stirring, oxygen or carbon injection, usage of the air-tight system, usage of hot charge (e.g., hot metal), and slag foaming are used to reduce electric energy consumption in EAFs. Among these techniques, foaming slag is the most useful and economically beneficial.
The slag foaming process significantly affects the thermal efficiency and refractory lining/electrode consumption of EAFs. These effects have been confirmed by many researchers [1,2,3,4]. In addition, the foaming process can remove oxygen from FeO present in slag. It can also increase the recycling rate of iron. The main factor affecting the foaming process is CO gas generated during melting. It is produced when the carbon content of steel reacts with FeO in slag. The carbon content in molten steel can be controlled by injected oxygen and carbon (with FeO in the slag), as shown below:
The above reactions occur at the steel–slag interface. CO gas enters the slag and increases its volume for efficient foaming. The duration for which the CO gas remains in the slag affects its foaming ability. It can be explained by the foaming index (Σ) as follows [5,6,7,8,9]:
where Δh (cm) is foaming height, j (cm/s) is superficial gas velocity, k is a constant, μ represents viscosity of the slag, ρ denotes density of the slag, and σ is surface tension of the slag. Therefore, viscosity is one of the major factors affecting the slag foaming process. Many studies have been carried out with a focus on the effect of the foaming process or the viscosity. Luz et al. [10] reported the effect of viscosity on the foaming process. Bhoi et al. [11] reported that FeO reduction could increase the viscosity of slag and promote foaming ability. Kim et al. [12] evaluated the foaming index and foaming constant in different slag systems. Lee et al. [13] reported in detail the viscous behavior of slag with varying FeO content. Martinsson et al. [14] investigated the relationship between the viscosity and foaming ability of the CaO-SiO2-FeO slag systems. Although the effects of some of these factors on the slag foaming process have been previously investigated, only a few studies have reported the influence of viscosity changes (with calcium silicate solidified phase particles) on the foaming process. Few researchers have analyzed the experimental data and described in detail the effect of viscosity and foaming on the slag foaming process [11,14,15].
Based on these aspects, this work aims to discuss the effects of viscosity changes and solidified particles on the slag foaming phenomenon.
2. Materials and Methods
2.1. Slag Sampling and Characterization
The slag samples used in this study were prepared from mixtures of analytical grade Al2O3, CaO, SiO2, FeO, and MgO. Table 1 shows the chemical composition of the slags. The slags were pre-melted in an induction furnace and quenched into water. The chemical compositions of the slags were analyzed using a WDXRF (Wavelength-dispersive X-ray Fluorescence Spectrometer, Rigaku supermini 200, Rigaku, Tokyo, Japan). The Fe2+ chemical titration method was followed for characterization. Thermo-Calc software (Slag 3.2 database, Thermo-Calc 4.0, Thermo-Calc Software AB, Stockholm, Sweden) was used to simulate the solid fraction and melting temperature of the slag samples.

Table 1.
The composition of the slag samples.
The characteristics of the samples were analyzed at high temperatures using a viscometer (Brookfield DV IIIRV, AMETEK Brookfield, Middleboro, MA, USA), and high-temperature optical images were recorded. The data were analyzed using Thermo-Calc software, and the melting temperature and flow properties of the slags were compared.
The setup followed for viscosity analysis is shown in Figure 1. The experiments were conducted in a Si-Mo electric resistance furnace (SJ High Technology Company, Taipei, Taiwan). The furnace was heated at a rate of 10 °C/min until the temperature reached 1350 °C. Following this, the sample was heated at 2 °C/min until the temperature reached 1600 °C. Molten slag was prepared under a high-purity Ar atmosphere in a molybdenum crucible (inside diameter: 45 mm, outside diameter: 55 mm, height: 120, inside depth: 110 mm). The flow rate was maintained at 5 L/min. The molybdenum rotor was slowly put into the crucible after the slag melted (rotor diameter: 30 mm). The distance was set at 5 mm from the bottom of the crucible. The rotor speed was set at 20 rpm, and the viscosity was measured in the temperature range of 1350–1600 °C.
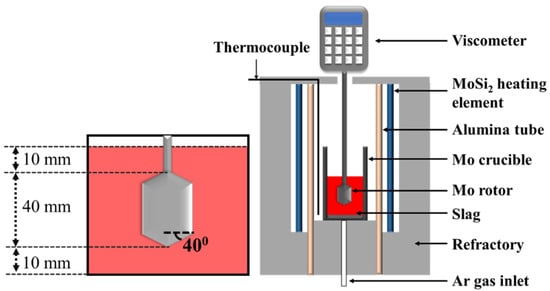
Figure 1.
Schematic representation of the setup used for analyzing the viscosity of samples.
The high-temperature optical image was recorded in a Si-Mo electric resistance furnace (SJ High Technology Company, Taipei, Taiwan). The setup followed for the high-temperature optical image is shown in Figure 2. The slag samples were crushed and sieved to produce powdered samples (75 μm). The powder was pressed into a cylinder (radius: 3 mm and height: 3 mm) and placed on a platinum board. The furnace was heated at a rate of 10 °C/min until the temperature reached 1350 °C. Following this, the heating rate was maintained at 2 °C/min until the temperature of 1595 °C was reached. Optical imaging equipment was used to continuously record changes in sample height and temperature. The experiment was stopped at a temperature of 1595 °C. Sample height was analyzed to define melting behavior.
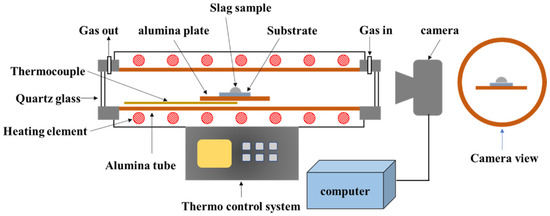
Figure 2.
Schematic representation of the setup used for high-temperature optical image.
2.2. Foaming Experiment
The foaming experiment was performed in an induction furnace (Jia Shing Electricuty Construction Co., Kaohsiung, Taiwan). The experimental setup is shown in Figure 3. A slag sample (100 g) was put in the molybdenum crucible and heated to a specified temperature. Two B-type thermocouples, in contact with the crucible wall and the bottom of the sample, respectively, were used to record the temperature. After the sample melted, the electrode was used to measure the initial liquid height. Under a constant flow rate, the electrode was dropped again, and foaming height was measured.
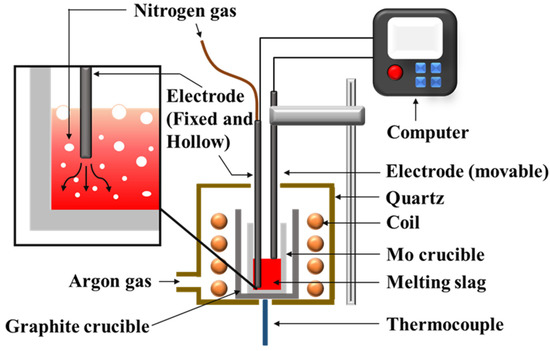
Figure 3.
Schematic representation of the setup used for the foaming experiment.
3. Results and Discussion
3.1. Thermo-Calc Phase Diagram Simulation
In this study, the FeO-CaO-SiO2-Al2O3-MgO slag system was simulated using Thermo-Calc software. The simulation results are provided in Figure 4, where the x-axis represents the CaO concentration, and the y-axis represents the temperature. MgO and Al2O3 contents were set at 5%. The temperature was maintained in the range of 1500–1800 °C. The results revealed that when C/S value was low, the major precipitate phase was Ca2SiO4. When C/S value increased, Ca2SiO4 transformed into Ca3SiO5. At high C/S values, purely solid CaO formed the major precipitate phase. The saturation level of MgO decreased as FeO weight fraction increased. In addition, according to the MgO saturation equation provided in the literature of Luz [16], the MgO content of this work in all samples were below the saturation level at temperatures between 1400 and 1600 °C.
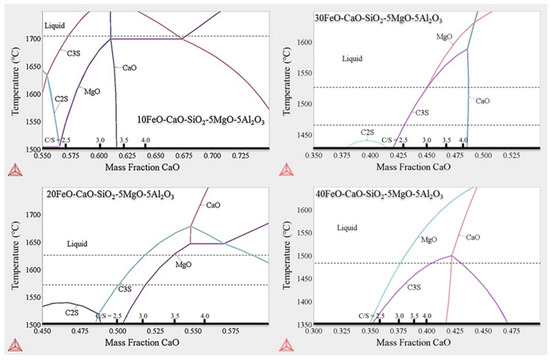
Figure 4.
Results obtained with Thermo-Calc software package.
The dotted lines in Figure 4 represent the melting points of the different samples under different C/S values. The results are shown in Table 2. In samples with higher FeO content (A2, A3, B2, and B3), the solid fraction decreased as FeO content increased. A1 and B1 maintained a solid fraction at contents >20%.
Table 2.
The solid fraction and melting point of each sample simulated by Thermo-Calc software.
3.2. Viscosity Analysis and High-Temperature Optical Image Observation
Figure 5 and Table 3 present the viscosity analysis results. In this study, the slag with C/S = 2.1–2.2 and C/S = 2.6–2.7 was used to control the viscosity at a temperature of 1550 °C with varying FeO contents. According to the results of Thermo-Calc simulation software, both FeO and Basicity will affect the solidified phase content, which was also reflected in viscosity data. The viscosity decreased with increasing FeO content at a constant temperature and constant basicity (C/S). The results also revealed that viscosity increased as the C/S value increased at constant FeO content. The viscosity of A1 and B1 were above 1300 cP at 1550 °C. The viscosities of A2, A3, B2, and B3 at 1460 °C were <100 cP. Figure 6 presents the results of studying the FeO-CaO-SiO2-Al2O3-MgO slag system under different C/S values and varying FeO contents. The viscosities tended to decrease with increasing FeO content (under all C/S values investigated). According to viscosity measurement studies reported by Seok et al. [17] for the FeO-CaO-SiO2-Al2O3-MgO slag system, the addition of FeO can promote the formation of low melting point compounds such as fayalite (Fe2SiO4). This is because free Fe2+ and O2− were introduced into the silicate melts. The mixing entropy increased when FeO was added. Lee et al. [18] reported that FeO content influences the Gibbs free energy of FeO-CaO-SiO2-Al2O3-MgO slags.
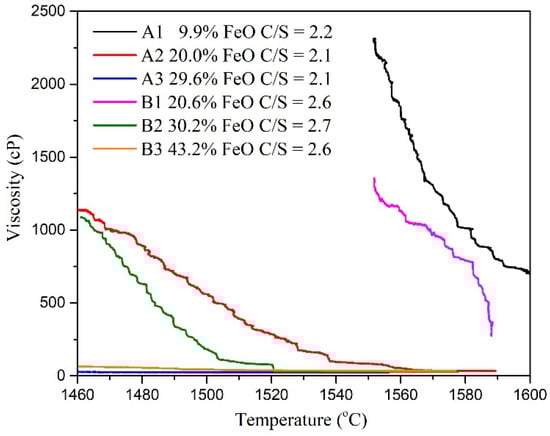
Figure 5.
Relationship between temperature and viscosity.
Table 3.
Viscosity of each sample at different temperatures.
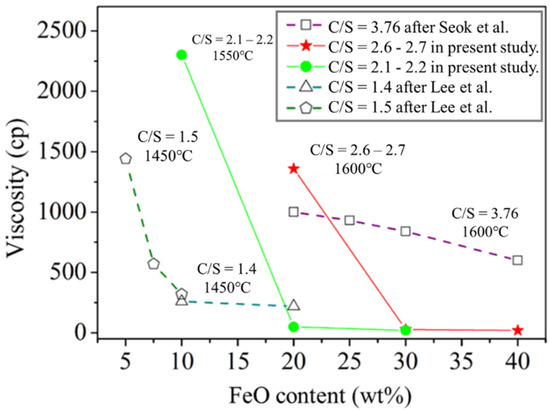
Figure 6.
Relationship between FeO content and viscosity.
High-temperature optical images were recorded. DIN 51,730 was used to determine the melting behavior of the slag samples. The 1/2 height and 1/3 height in Figure 7 represent the half ball temperature and flow temperature, respectively. The results are presented in Figure 7 and Table 4. The melting temperature was simulated using Thermo-Calc software, and the temperature at which viscosity was 100 cP was recorded following the viscosity analysis procedure outlined herein. The temperature at which liquid slag samples were fully formed is labelled as the “flat” temperature. At this temperature, precipitates were absent in the slag samples. At the “flat” or melting temperature, the viscosity of the slag sample was ≈100 cP.
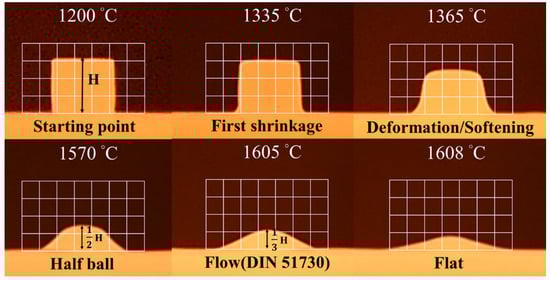
Figure 7.
High-temperature optical images of sample B1.
Table 4.
Results of the high-temperature optical image observation, temperature of slags at viscosity 100 cp, and melting temperature simulated by Thermo-Calc software.
3.3. Viscosity Analysis and High-Temperature Optical Image Observation
The foaming index can also be expressed as follows [19]:
where ΔV denotes the increased volume of foaming slag (m3) and Q represents the rate of gas production (m3/sec). As the cross-sectional area of the furnace body remains almost constant, the foaming index is divided by the cross-sectional area. Foaming can be described as Formula (3). The formula of the foaming index reveals a positive correlation between viscosity and foaming height. The slag samples A1 and B1 were characterized by high viscosity (compared to the other slag samples). Thus, A1 and B1 could potentially exhibit better foaming ability. Figure 8 and Figure 9 reveal the foaming height of A1 and B1, respectively. The X index represents voltage, and the Y index represents the internal height of the crucible. Initially, the electrode was placed in a nonconductive area where the voltage was 800 mV. As the electrode dropped to contact the liquid surface, the voltage rose to 5000 mV. The black dotted line represents the initial liquid surface height. The red and blue lines represent the foaming height measured for the first and second times, respectively.
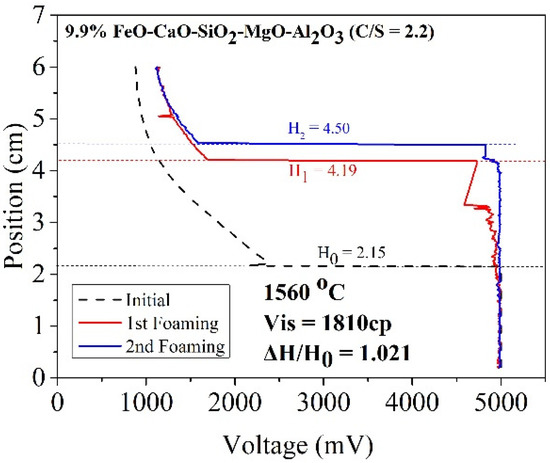
Figure 8.
Foaming height of sample A1.
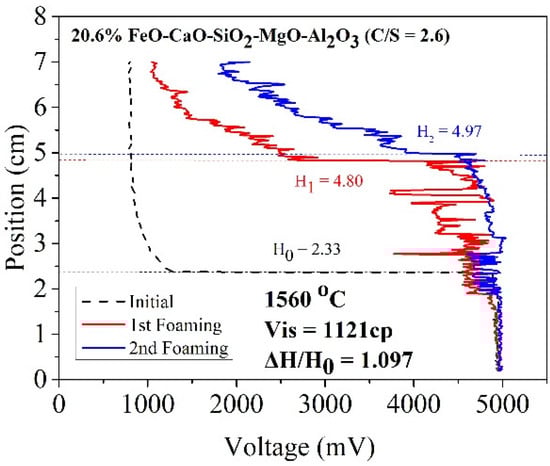
Figure 9.
Foaming height of sample B1.
According to the work of Ito et al. [5,6], foaming index and foaming height are positively correlated. In this study, gas velocity was constant for each foaming experiment. Therefore, the foaming ability in this study could show as foam height ratio (△H/H0) [10]. Table 5 shows the foam height ratio of slag samples in the temperature range of 1500–1600 °C. The foam height ratio of A1 and B1 was 1.021 and 1.097, respectively, at 1560 °C. This was because solid particles with a high melting point formed precipitates in the slag. The particles increased the viscosity of the slag samples and promoted the foaming ability of slags. When FeO was used as a co-solvent, the viscosity increased with increasing FeO content. However, temperature also affected the foam height ratio. When the temperature increased, more precipitated particles melted, decreasing the foaming height ratio value.
Table 5.
Foam height ratio of each sample at different temperatures.
The correlation between viscosity and foam height ratio for the slag samples used in this study are shown in Figure 10. The foam height ratio was proportional to viscosity in the range of 25–1810 cP. The relation can be expressed as follows:
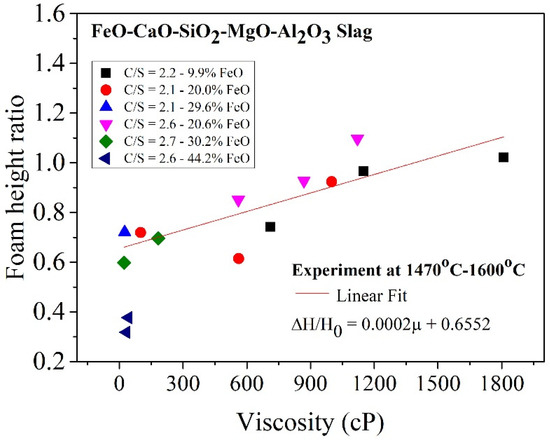
Figure 10.
Relationship between viscosity and foam height ratio.
Figure 11 shows the foaming mechanism. The bubbles in the low-viscosity slag easily overflowed because of the lack of solid particles. As the number of solid particles increased, the resistance of the bubbles increased, making it difficult for the bubbles to escape. This enhanced foaming ability.
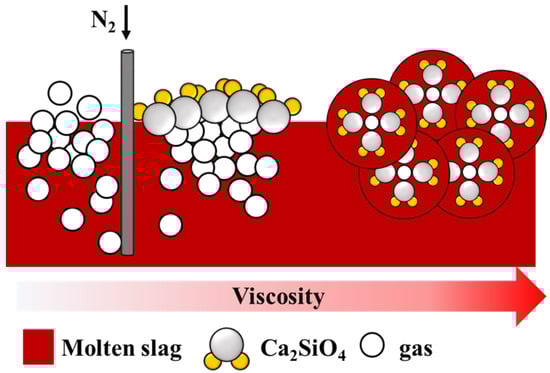
Figure 11.
Foaming mechanism between gas and particles.
4. Conclusions
Based on the results, the following conclusions can be drawn:
- The viscosity of the slag sample increased as FeO content decreases. At a slag composition of 9.9% FeO, 53% CaO, 24.2% SiO2, 6.2% Al2O3, and 6.7% MgO, the maximum viscosity was recorded at 1550 °C. When FeO content was >29.6%, the viscosity rapidly dropped to <100 cP.
- The results from the foaming experiment revealed that for the FeO-CaO-SiO2-MgO-Al2O3 slag system in the viscosity range of 25–1810 cP, the foam height ratio and viscosity exhibited a linear relationship which can be expressed as:
- Viscosity increased with increasing solid phase fraction in the slag. The experimental results revealed that the slag-containing solid fraction exhibited better foaming ability. In the six slag samples studied, the slag sample B1 (20%FeO-49.5% CaO-19.3% SiO2–5% Al2O3–5.7% MgO) exhibited the best foaming ability, and the foam height ratio was 109.7%.
Author Contributions
Conceptualization, W.-T.C., C.-M.L., and Y.-L.S.; formal analysis, W.-T.C., C.-C.L., and Y.-L.S.; funding acquisition, W.W.; investigation, J.-M.S. and Y.-E.C.; methodology, W.-T.C. and Y.-E.C.; project administration, W.W.; supervision, W.W.; validation, C.-M.L., J.-M.S., and Y.-E.C.; writing—original draft, W.-T.C.; writing—review and editing, C.-M.L. and J.-M.S. All authors have read and agreed to the published version of the manuscript.
Funding
This work was supported by the Ministry of Science and Technology, Taiwan, under proects numbered MOST 106-2218-E-005-020, MOST 107-2218-E-005-002 and MOST 107-2218-E-005-008.
Institutional Review Board Statement
Studies not involving humans or animals.
Informed Consent Statement
Studies not involving humans.
Data Availability Statement
Data available in a publicly accessible repository.
Acknowledgments
The authors would like to thank the members of the Department of Materials Science and Engineering at National Chung Hsing University.
Conflicts of Interest
The authors declare no competing financial interests.
References
- Kwong, K.S.; Bennett, J.P. Recycling practices of spent MgO-C refractories. J. Miner. Mater. Charact. Eng. 2002, 1, 69–78. [Google Scholar] [CrossRef]
- Kozhukhov, A.A.; Fedina, V.V. Study of the foaming of steelmaking slag and its effect on the thermal performance of an electric-arc furnace. Metallurgist 2012, 56, 169–172. [Google Scholar] [CrossRef]
- Kipepe, T.M.; Pan, X. Energy improvement in induction furnace using foaming slag with variation of carbon injection. J. Energy South. Afr. 2015, 26, 64–73. [Google Scholar] [CrossRef]
- Morales, R.D.; Rubén, L.G.; López, F.; Camacho, J.; Romero, J.A. The slag foaming practice in EAF and its influence on the steelmaking shop productivity. ISIJ Int. 1995, 35, 1054–1062. [Google Scholar] [CrossRef]
- Ito, K.; Fruehan, R.J. Study on the foaming of CaO-SiO2-FeO slags: Part I. Foaming parameters and experimental results. Metall. Trans. B 1989, 20, 509–514. [Google Scholar] [CrossRef]
- Ito, K.; Fruehan, R.J. Study on the foaming of CaO-SiO2-FeO slags: Part II. Dimensional analysis and foaming in iron and steelmaking processes. Metall. Trans. B 1989, 20, 515–521. [Google Scholar] [CrossRef]
- Stadler, S.A.; Eksteen, J.J.; Aldrich, C. Physical modelling of slag foaming in two-phase and three-phase systems in the churn-flow regime. Miner. Eng. 2006, 19, 237–245. [Google Scholar] [CrossRef]
- Pilon, L.; Fedorov, A.G.; Viskanta, R. Steady-state thickness of liquid–gas foams. J. Colloid Interface Sci. 2001, 242, 425–436. [Google Scholar] [CrossRef]
- Jiang, R.; Fruehan, R.J. Slag foaming in bath smelting. Metall. Trans. B 1991, 22, 481–489. [Google Scholar] [CrossRef]
- Luz, A.P.; Tomba Martinez, A.G.; López, F.; Bonadia, P.; Pandolfelli, V.C. Slag foaming practice in the steelmaking process. Ceram. Int. 2018, 44, 8727–8741. [Google Scholar] [CrossRef]
- Bhoi, B.; Jouhari, A.K.; Ray, H.S.; Misra, V.N. Smelting reduction reactions by solid carbon using induction furnace: Foaming behaviour and kinetics of feo reduction in CaO–SiO2–FeO slag. Ironmak. Steelmak. 2006, 33, 245–252. [Google Scholar] [CrossRef]
- Kim, H.S.; Min, D.J.; Park, J.H. Foaming behavior of CaO–SiO2–FeO–MgOsatd–x (x = Al2O3, MnO, P2O5, and CaF2) slags at high temperatures. ISIJ Int. 2001, 41, 317–324. [Google Scholar] [CrossRef]
- Lee, S.; Min, D.J. Viscous behavior of FeO-bearing slag melts considering structure of slag. Steel Res. Int. 2018, 89, 1800055. [Google Scholar] [CrossRef]
- Martinsson, J.; Glaser, B.; Sichen, D. Study on apparent viscosity of foaming slag—cold model and high temperature experiments. In Advances in Molten Slags, Fluxes, and Salts: Proceedings of the 10th International Conference on Molten Slags, Fluxes and Salts 2016; Springer: Berlin/Heidelberg, Germany, 2016. [Google Scholar]
- Pretorius, E.B.; Carlisle, R.C. Foamy slag fundamentals and their practical application to electric furnace steelmaking. In Proceedings of the 56th Electric Furnace Conference, New Orleans, LA, USA, 15–18 November 1998. [Google Scholar]
- Luz, A.P.; Ávila, T.A.; Bonadia, P.; Pandolfelli, V.C. Slag foaming: Fundamentals, experimental evaluation and application in the steelmaking industry. Refract. Worldforum 2011, 3, 91–98. [Google Scholar]
- Seok, S.H.; Jung, S.M.; Lee, Y.S.; Min, D.J. Viscosity of highly basic slags. ISIJ Int. 2007, 47, 1090–1096. [Google Scholar] [CrossRef]
- Lee, Y.S.; Min, D.J.; Jung, S.M.; Yi, S.H. Influence of basicity and FeO content on viscosity of blast furnace type slags containing FeO. ISIJ Int. 2004, 44, 1283–1290. [Google Scholar] [CrossRef]
- Pilon, L.; Viskanta, R. Minimum superficial gas velocity for onset of foaming. Chem. Eng. Process. Process Intensif. 2004, 43, 149–160. [Google Scholar] [CrossRef]


Publisher’s Note: MDPI stays neutral with regard to jurisdictional claims in published maps and institutional affiliations. |
© 2021 by the authors. Licensee MDPI, Basel, Switzerland. This article is an open access article distributed under the terms and conditions of the Creative Commons Attribution (CC BY) license (http://creativecommons.org/licenses/by/4.0/).