Abstract
Phosphate rock has been considered as one of the most significant secondary rare-earth resource, and the utilization of rare earth elements (REEs) in phosphate rock has attracted increasing attention. In this study, the leaching kinetics of REEs from a phosphate ore from China was studied with the variation of temperature and phosphoric acid concentration under the conditions: ratio of liquid to solid of 12 mL/g, stirring speed of 120 r/min, and phosphate particle size of −0.074 mm amounts 61.1%. The results suggest that there were two distinct stages in leaching process and kinetics of both stages followed shrinking core model. At fast reaction stage, the semi-empirical equation describing the kinetics was 1 − 3(1 − α)2/3 + 2(1 − α) = 1.885CH3PO40.89exp(−11220/8.31T)t. The semi-empirical equation for slow reaction stage was 1 − 3(1 − α)2/3 + 2(1 − α) = 0.299CH3PO42.50exp(−18720/8.31T)t. Using shrinking core model and time-to-a-given-fraction method, we found that leaching rate of fast reaction stage was controlled by solid product layer diffusion, and both solid product layer diffusion and chemical reaction determined slow reaction stage.
1. Introduction
Rare earth elements (REEs) play an increasingly important role in the global economy and ‘green technology’ due to their unique magnetic, phosphorescent, and catalytic properties [1,2]. Monazite ((RE)PO4), bastnaesite ((RE)FCO3), ion adsorption clays (e.g., illite (K,H)Al2(Si,Al)4O10(OH)2·nH2O), montmorillonite ((Ca,Na,H)(Al,Mg,Fe,Zn)2(Si, Al)4O10(OH)2·nH2O), kaolinite (Al2Si2O5(OH)4), etc.), loparite ((RE)(Ti,Nb,Ta,Fe)O3), and xenotime (YPO4) are the most economically significant source of REEs [3,4,5]. However, the exploration and processing of secondary sources of REEs has attracted great interest because of the increasing demand for REEs. Phosphate rock is considered as one of the most promising potential secondary sources of REEs due to advantages of reserves, cost, and environmental issues [6]. In phosphate rock, REEs present majorly in the form of isomorphous substitution for Ca and deposit as the REE-phosphate that can be easily released into leaching solution by mineral acids [7,8].
The phosphate ore containing REEs currently under investigation is located in the southwest of China and contains 1.3 billion tons of phosphate rock with the content of rare earth oxides of 0.05–0.13 wt%. The reserves of rare earth oxides are 1.45 million tons. The main gangue mineral is dolomite (CaMg(CO3)2), and other gangue minerals include clay, quartz (SiO2), etc.
Various mineral acids, including H2SO4 [9,10,11], HNO3 [12,13], HCl [9,14], and H3PO4 [13,15,16], are used in the decomposition process of phosphate rock to recover phosphorous and REEs. In the H2SO4 leaching process, 75% of REEs are lost in phosphogypsum, whereas more than 80% of REEs can be leached in HNO3 and HCl processes [10]. In addition, HNO3 and HCl leaching process are challenged by the difficulty from Ca2+ removal process [15]. Regarding H3PO4 leaching process, a REEs recovery of 94.3% was achieved under the optimal conditions of attacking phosphate rock using 30% P2O5 acid with an L/S ratio of 10:1 and a stirring speed of 250 r/min at 25 °C for 4 h. In the H3PO4 process, phosphate was decomposed by H3PO4, forming Ca(H2PO4)2, REE(H2PO4)3, and insoluble substance [15]. After filtering, REEs were recovered by precipitation, crystallization, solvent extraction, and ion exchange [17,18,19]. H2PO4− was recovered by H2SO4, producing phosphoric acid and high-quality gypsum. H3PO4 process does not introduce extra ion impurities in the leaching system and does not produce phosphogypsum in the leaching product, drawing increasing attention in the recent years [20,21]. Research on leaching of REEs from phosphate rock by phosphoric acid focus on finding the optimal leaching conditions or comparing the phosphoric acid with other mineral acid in the leaching process. Systematic studies on leaching kinetics of REEs in phosphoric acid from phosphate rock is still scarce. Therefore, it is critical to explore the leaching kinetics of REEs from phosphate by phosphoric acid to increase the leaching ratio and rate.
2. Experimental
2.1. Materials and Reagents
The phosphate ore containing REEs was obtained from Guizhou Zhijin in China. It was crushed and wet ground to get samples for acid leaching and SEM-EDS, and further grinding was conducted to obtain samples for chemical analysis and X-ray diffraction (XRD) measurement. From chemical analysis (XRF) of the phosphate ore in Table 1 and XRD pattern in Figure 1, raw phosphate ore mainly constituted fluorapatite (Ca5(PO4)3F), dolomite and quartz, and the content of P2O5 was around 17%. Based on data in Table 1 and Table 2, REEs content in Zhijin phosphate ore was 0.10wt%, about two times the average REEs content in general phosphate ores [6], and La, Ce, Nd, and Y were the main rare earth elements in the sample. Mineral Liberation Analyser (MLA) results show that no independent rare earth minerals occurred in this phosphate ore. Using SEM-EDS, REEs were mainly found in fluorapatite and dolomite. Analytical grade phosphoric acid (>85%H3PO4) produced by Tianjing Chemical Works was used for acid leaching of REEs. All other chemicals used were of analytical reagent grade. Distilled water was used in all the experiments.

Table 1.
Chemical analysis of Zhijin phosphate ore (wt%).
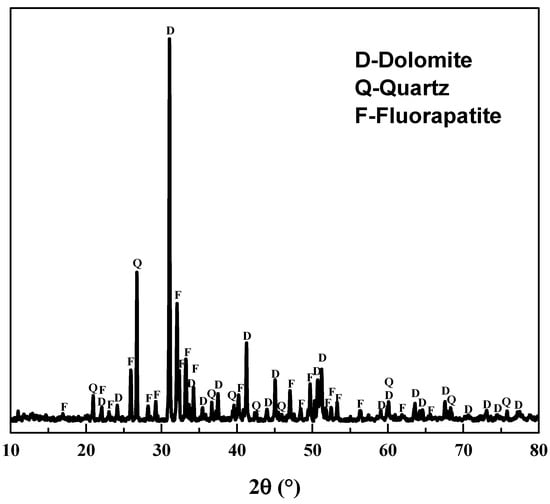
Figure 1.
XRD pattern of the raw phosphate ore.
Table 2.
Partitioning of REO in Zhijin phosphate ore (×10−6).
2.2. Leaching Experiments
For the acid leaching experiments, 150 mL phosphoric acid solution with the desired concentration was prepared in a 250 mL flask and heated on a temperature-controlled water bath equipped with a magnetic stirrer that was able to maintain the temperature with an accuracy of ±1 °C. Then, 12.5 g phosphate ore (−0.074 mm amounts 61.1%) was added to the flask to reach ratio of liquid to solid of 12 mL/g. Stirring speed of 120 r/min was maintained for Teflon-coated stirring bar. After leaching for a desired period of time, the suspensions were filtered, and the residue was washed three times for analysis. For each condition, at least three repeated tests were performed, and the average leaching efficiencies were reported in this work. The effects of temperature (35, 45, 55, and 65 °C) and phosphoric acid concentration (20%, 25%, 30%, and 35%) on the leaching kinetics were assessed.
2.3. Analysis
In the digesting process, 100 mg sample was digested in 20 mL of perchloric acid and 20 mL of hydrofluoric acid at 180 °C until all liquids evaporated. Then, 11 mL of nitric acid and 20 mL of deionized water were added to the digestion tube at 120 °C until a total volume of 10 mL remained. After that, the liquid was diluted to 30 mL with deionized water for ICP-MS analysis. An Inductively Coupled Plasma Mass Spectrometry (ICP-MS, PerkinElmer, Waltham, MA, USA) was used to determine the content of REEs. The analytical precision for ICP-MS in terms of the relative standard deviation of replicate analyses was less than 5%.
3. Results and Discussion
REEs in Zhijin phosphate ore present in the form of isomorphous substitution for Ca and deposit as the REE-phosphate and REE-dolomite that can be easily released into leaching solution by mineral acids. In the process of phosphoric acid leaching, REEs in phosphate ore dissolved in acidic solution following reaction Equations (1) and (2):
The leaching efficiencies of REEs as a function of time at different temperature was studied and the results were plotted in Figure 2. The leaching efficiencies of REEs were increased sharply in the first three minutes and increased gradually with the prolonging of time. The data suggests a relatively fast leaching process during the first 3 min followed by a slow process, similar to the leaching of lanthanum, praseodymium, and neodymium in sulfuric acid from rare earth element slag [10,22,23,24], indicating that two reaction mechanisms may be occurring during the leaching of REEs. As the rise of temperature, the leaching efficiencies of REEs promoted gradually. However, it only increased slightly when temperature increased from 55 to 65 °C. Considering the cost, 55 °C was utilized in the following experiment.
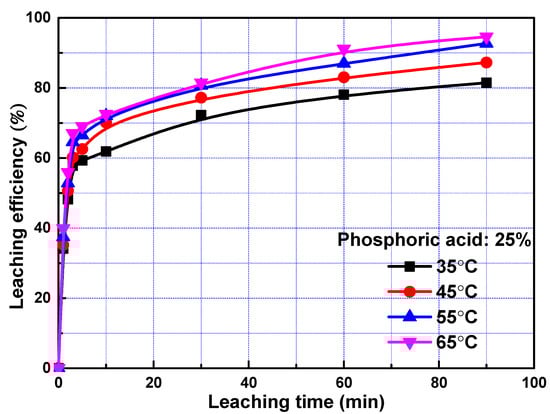
Figure 2.
Leaching efficiency of rare earth elements (REEs) as a function of time at different temperature.
To exam the effect of phosphoric acid concentration on leaching kinetics, leaching efficiency of REEs as a function of time at different phosphoric acid concentration was investigated, and the results were present in Figure 3. Concentration of 20%, 25%, 30%, and 35% were used, corresponding to 2.27, 2.92, 3.61, and 4.34 mol/L phosphoric acid, respectively. The leaching efficiencies of REEs increased with the increase of phosphoric acid concentration, and the influence of phosphoric acid concentration was more significant when the phosphoric acid concentration was low, owning to the fact that the H+ concentration was not sufficient in this case. Similar to results in Figure 2, the leaching efficiencies increased remarkedly with the increase of leaching time within 3 min and increased slowly with further increase of leaching time.
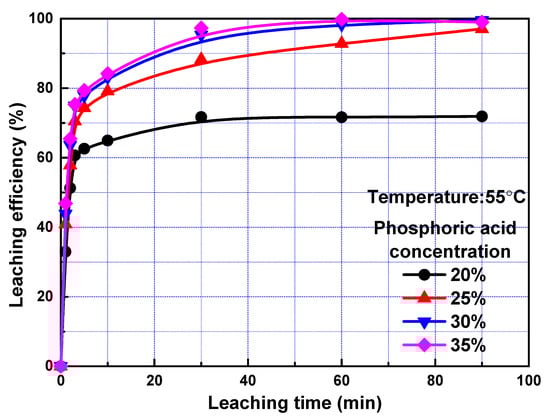
Figure 3.
Leaching efficiency of REEs as a function of time at different phosphoric acid concentration.
According to results presented, the following optimal parameters were suggested for leaching of REEs from Zhijin phosphate ore: T = 55 °C, CH3PO4 = 30%, and duration of 60 min. The chemical composition of the leachate in this case is shown as follows (g/L): REO = 0.082, CaO = 31.95, MgO = 6.28, Fe2O3 = 0.74, Al2O3 = 0.39, F = 1.41, S = 0.30. According to ICP-MS analysis, the extraction degree of the main REEs in this phosphate ore, i.e., lanthanum, cerium, neodymium, and yttrium, were 99.38%, 97.05%, 96.53%, and 99.12%, respectively. The chemical composition of the solid residue was presented in Table 3. Compared to Table 1, content of P, Ca, Mg, F decreased substantially in the solid phase, meanwhile content of Si, Fe, Al, and S increased, suggesting that P, Ca, Mg, and F were more readily to be leached out than Si, Fe, Al, and S during the leaching of REEs from phosphate ore by phosphoric acid.
Table 3.
Chemical compositions of the solid residue after leaching of REEs from Zhijin phosphate ore by phosphoric acid at T = 55 °C, CH3PO4 = 30%, and duration of 60 min.
The leaching of REEs from phosphate ore is a typical solid-liquid reaction. The solid-liquid reaction rate is generally controlled by one of the following steps, i.e., (1) diffusion through the film layer, (2) diffusion through the ash/product layer, (3) chemical reaction at the surface of the core of unreacted particles [25]. The slowest step is the rate determining step, which governs the whole leaching rate.
The morphology of fluorapatite and dolomite particle before and after leaching for 90 min was determined by SEM-EDX and the images were shown in Figure 4. The particle size range of fluorapatite and dolomite were around 50 μm. After 90 min of leaching, the particle size of fluorapatite and dolomite reduced to 10–20 μm in the leaching residue, and apparent erosion was found on the particles surface.
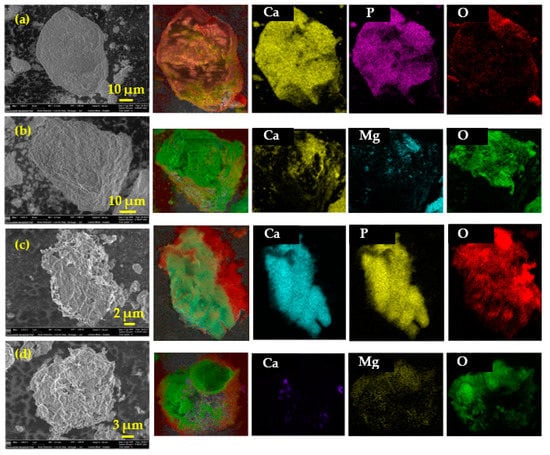
Figure 4.
SEM and EDX mapping images of fluorapatite and dolomite before leaching (a,b) and after 90 min of leaching (c,d).
Two distinct stages, namely, fast reaction stage (Leaching time less than 3 min) and slow reaction stage (leaching time more than 3 min), were occurred during the leaching of REEs by phosphoric acid from phosphate ore. Therefore, kinetics of leaching was analysed in two stages separately.
3.1. Fast Reaction Stage
According to the results above, the shrinking particle model, widely used in heterogeneous leaching kinetics processes due to its simplicity, was applied to describe the leaching kinetics [26,27,28,29]. If the step of the liquid film diffusion determines the leaching process, the corresponding integral rate equation was expressed as Equation (3). If leaching rate was controlled by the chemical reaction, the integral rate equation was Equation (4). If leaching rate was controlled by the step of diffusion through solid layer around the unreacted core, the integral rate equation was Equation (5). If leaching rate was governed by the interfacial transfer and diffusion through the product layer, the integral rate equation was Equation (6).
where α is the leaching efficiency; kl is the apparent rate constant for diffusion through the fluid film; kr is the apparent rate constant for the surface chemical reaction; kd is apparent rate constant for diffusion through solid ash layer; kid is the apparent rate constant for interfacial transfer and diffusion through the product layer; and t is the leaching time.
To determine kinetic parameters and search the rate-controlling step of leaching process, the date obtained in the leaching experiments within 3 min were analysed utilizing Equations (3)–(6). To obtain rate constants in the fast reaction stage, left sides of Equations (3)–(6) were plotted vs. reaction time according to data collected in the leaching experiments. The slopes of fitted straight lines was the rate constants. The rate constants and correlation coefficients of regression were listed in Table 4. Largest regression coefficients were obtained for the type of product layer diffusion control. Relatively lower regression coefficients were obtained for types of film diffusion control, chemical reaction control, and interfacial transfer and diffusion through the product layer, indicating that diffusion through product layer is the rate-controlling step in the fast reaction stage. Linear relationship between 1 − 3(1 − α)2/3 + 2(1 − α) and leaching time within first 3 min with different temperature and different phosphoric acid concentration were presented in Figure 5 and Figure 6 respectively. The reaction rate constant can be described by the following Arrhenius equation:
where k0 is the pre-exponential factor; E is the apparent activation energy, kJ/mol; T is the reaction temperature, K; and R is the universal gas constant, 8.314 J/(molK).
Table 4.
Apparent rate constants for kinetics models and correlation coefficients at fast reaction stage.
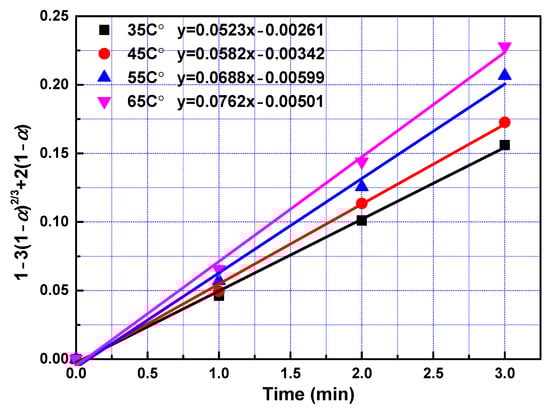
Figure 5.
The relationship between 1 − 3(1 − α)2/3 + 2(1 − α) and leaching time during the fast reaction stage at a different temperature.
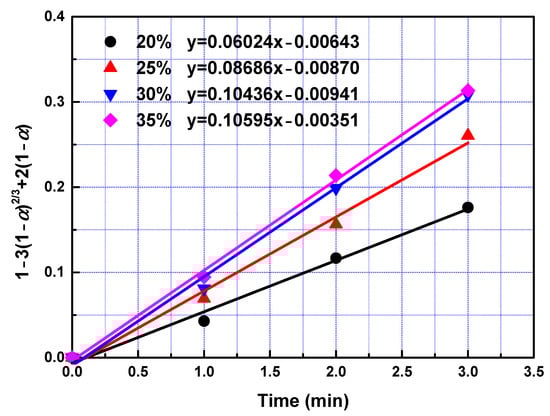
Figure 6.
The relationship between 1 − 3(1 − α)2/3 + 2(1 − α) and leaching time during the fast reaction.
To examine the effect of reaction temperatures, the apparent activation energy was calculated to be 11.22 kJ/mol with Equation (7) from the slope shown in Figure 7. The value of activation energy in the leaching process may be characterized to predict the controlling step. The activation energy of a diffusion-controlled process is typically below 12 kJ/mol, while for a chemically controlled process, it is usually greater than 40 kJ/mol; when activation energy is between 12 and 40 kJ/mol, the process is controlled by both diffusion and chemical reaction [30,31]. The value of the activation energy indicates that the fast reaction stage was controlled by diffusion through solid layer around the unreacted core, which is in accord with the kinetics model fitting results.
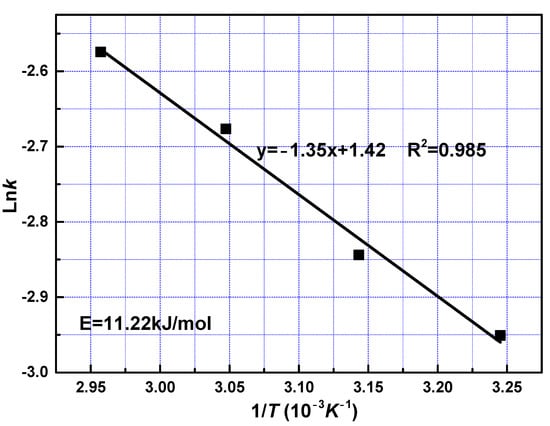
Figure 7.
Arrhenius plot for leaching of REEs from phosphate ore at fast reaction stage.
To examine the effect of phosphoric acid concentration, the reaction constant was the reaction order with respect to phosphoric acid was calculated at 0.89 from the slope shown in Figure 8.
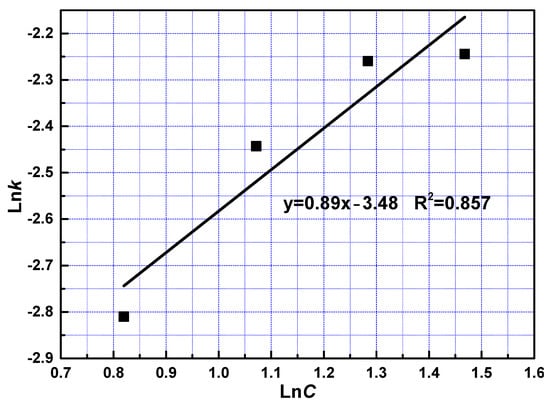
Figure 8.
The relationship between lnC and lnk at fast reaction stage.
By substituting the Arrhenius Equation (7) into Equation (5), Equation (5) can be rewritten in the following form:
where n is the reaction order of the H3PO4 concentration. In the fast reaction stage n is 0.89 and E is 11220 J/mol. Thus, leaching of REEs from phosphate ore can be described by the following equation:
Figure 9 plots the relationship between 1 − 3(1 − α)2/3 + 2(1 − α) and CH3PO40.89exp(−11220/8.31T)t, from which the value of k0 was obtained. Through fitting, a straight line was drawn with correlation efficient of 0.967. From the slope of this line, value of k0 was determined as 1.885. Therefore, the following semi-empirical equation was obtained:
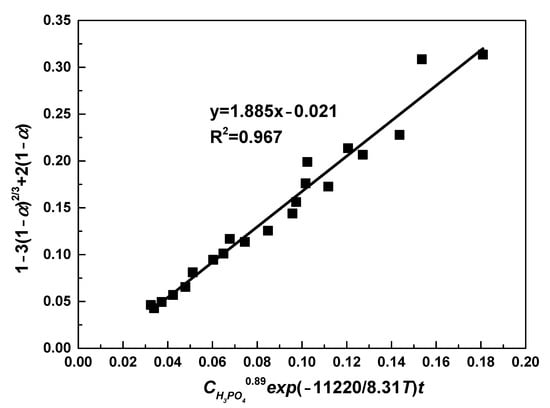
Figure 9.
The relationship between 1 − 3(1 − α)2/3 + 2(1 − α) and CH3PO40.89exp(−11220/8.31T)t.
3.2. Slow Reaction Stage
After the fast reaction stage, amount of REEs on mineral particle surface becomes insignificant. Ash layers acting as resistances for phosphoric acid solution remain on the surface after leaching for 3 min. In addition, phosphoric acid concentration decreased. Thus, the reaction rate reduced. Leaching kinetics at slow reaction stage was analysed in the same way as that for fast reaction stage. The rate constants and correlation coefficients of regression were listed in Table 5. Largest regression coefficients were also obtained for the type of product layer diffusion control, suggesting that diffusion through solid was the determining step at the slow reaction stage.
Table 5.
Apparent rate constants for kinetics models and correlation coefficients at slow reaction stage.
Data fitting with Equation (5) in different conditions were plotted in Figure 10 and Figure 11. The apparent activation energy was calculated at 18.72 kJ/mol with Arrhenius equation from the slope shown in Figure 12. The value of activation energy suggested that both solid layer diffusion and chemical reaction controlled the slow reaction stage. Solid layer diffusion player a much more significant role compared to chemical reaction since the value of 18.72 kJ/mol approaches to the value of 12 kJ/mol greatly. It was reasonable that the slow reaction stage was controlled by both solid layer diffusion and chemical reaction. First, the amount of REEs on mineral particle surface becomes insignificant and ash layers acting as resistances for phosphoric acid solution remain on the surface. Therefore, solid layer diffusion substantially affected the leaching rate. Secondly, acid concentration decreased as leaching proceeded, chemical reaction rate decreased, and chemical reaction thus contributed to the rate-controlling effect.
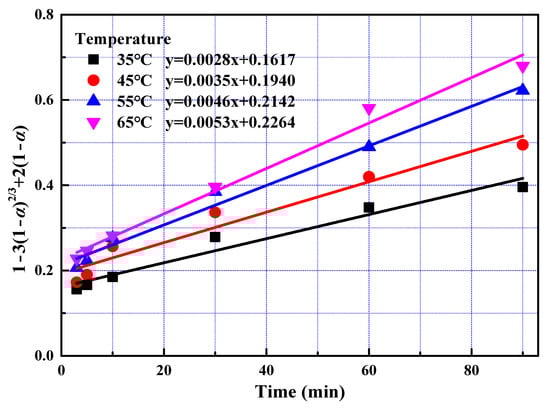
Figure 10.
The relationship between 1 − 3(1 − α)2/3 + 2(1 − α) and leaching time during the slow reaction stage at different temperatures.
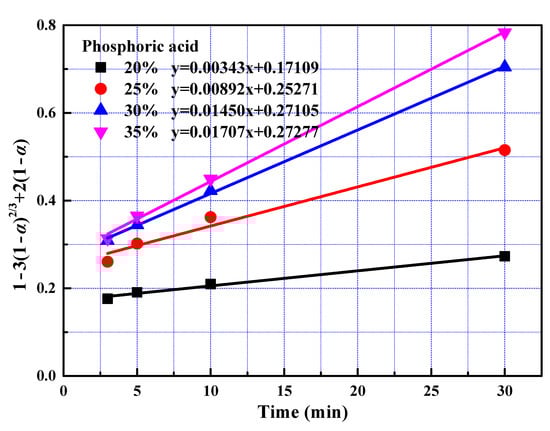
Figure 11.
The relationship between 1 − 3(1 − α)2/3 + 2(1 − α) and leaching time during the slow reaction stage at different phosphoric acid concentration.
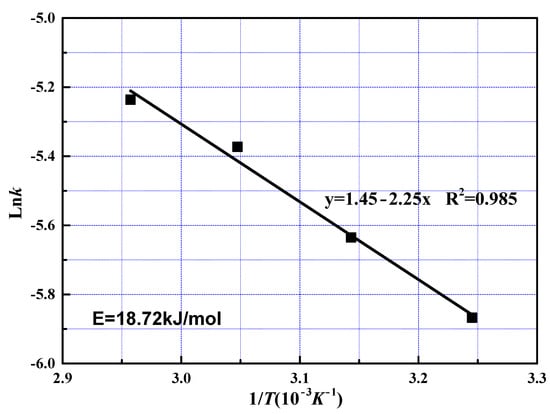
Figure 12.
Arrhenius plot for leaching of REEs from phosphate ore at the slow reaction stage.
The reaction order with respect to phosphoric acid was determined at 2.50 from the slope shown in Figure 13. The value of reaction order in fast reaction stage was much smaller than that at slow reaction stage, owning to the fact that excessive phosphoric acid was added into the reactor at the fast reaction stage [23].
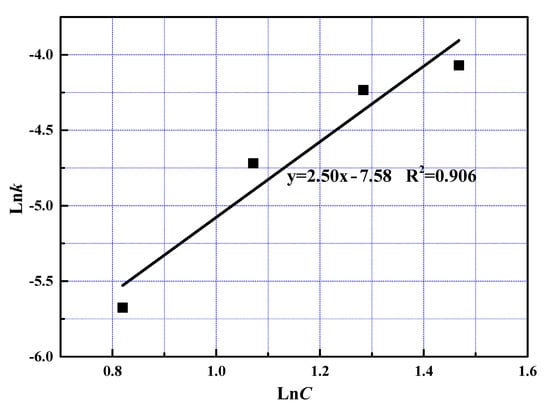
Figure 13.
The relationship between lnC and lnk at slow reaction stage.
At the slow reaction stage, n is 2.50 and E is 18720J/mol. Thus, leaching of REEs from phosphate ore can be described by the following equation:
Figure 14 plots the relationship between 1 − 3(1 − α)2/3 + 2(1 − α) and CH3PO42.50exp(−18720/8.31T)t, from which the value of k0 was obtained. Through fitting, a straight line was drawn with correlation efficient of 0.953. From the slope of this line, value of k0 was determined as 0.299. Therefore, the following semi-empirical equation was obtained:
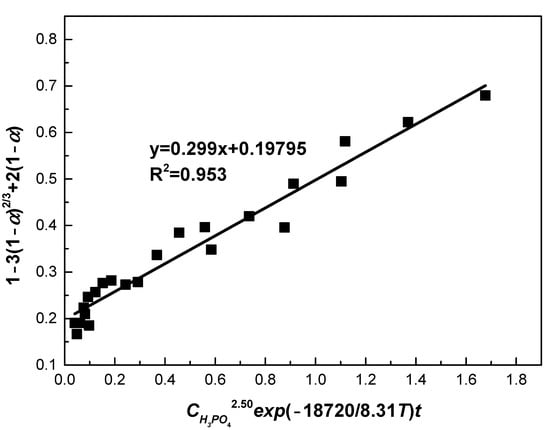
Figure 14.
The relationship between 1 − 3(1 − α)2/3 + 2(1 − α) and CH3PO42.50exp(−18720/8.31T)t.
3.3. Determination of Reaction Energy Using the Time-to-a-Given-Fraction Method
Shrinking core model is widely used to determine activation energies and reaction mechanisms based on empirical equations in hydrometallurgical kinetics analysis. However, an average activation energy is determined, which may obscure the reaction mechanisms [32]. Thus, the time-to-a-given fraction method was used to evaluate the effect of time on the apparent activation energy [33]. The time required to obtain a certain degree of leaching and the apparent activation energy Ea is calculated by the following Equation:
Plots of ln(t) as a function of 1/T for various selected REEs extractions are present in Figure 15. From the slope, Ea with extraction degree of 20%, 40%, 60%, and 80% were determined as 5.99, 10.29, 10.74, and 29.50 kJ/mol, respectively. At the initial stage, low activation energy of 6.99–10.74 kJ/mol is observed, suggesting the stage was governed by diffusion through product layer. It is in accordance with the result at the fast reaction stage in Section 3.1. With an extraction degree greater than 60%, the activation energy increased to 29.50 kJ/mol. This value was greater than activation energy obtained by the shrinking core model at the slow reaction stage. The activation energy was still in the range 12 to 40 kJ/mol, suggesting that the process is controlled by both diffusion and chemical reaction. It is in agreement with the result at the slow reaction stage in Section 3.2.
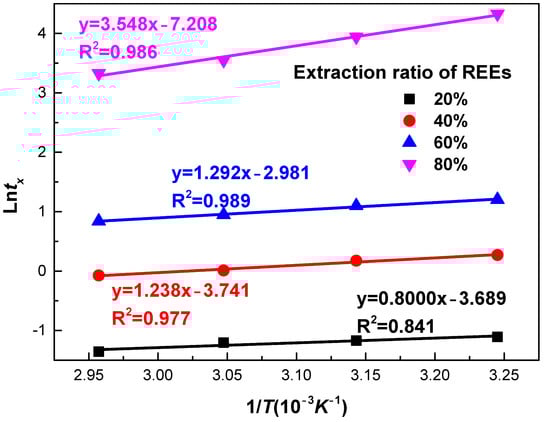
Figure 15.
Experimental temperature data for phosphate ore plotted as time-to-different percentages of REEs extraction from experimental data (x = 0.2 to x = 0.8) versus 1/T using the time-to-a-given-fraction method for activation energy determination.
It has been reported that precipitation, crystallization, solvent extraction, and ion exchange could be used to recover REEs from leaching solutions originated from phosphate rock by acid decomposition [15]. The precipitation process introduces significant amount of impurity ion in the product of REEs and consumes a lot of precipitants. Crystallization suffers from high energy consumption and stringent apparatus requirements. Solvent extraction and ion exchange have drawbacks of complicacy of technology and application. Since the solubility of REEs at 90 °C in phosphate acid solution is very low, the most promising method to recover REEs in this case is to selective precipitate of REEs by heating up the leachate and H3PO4 can be recovered at an ambient temperature [15].
4. Conclusions
The leaching kinetics of REEs from a phosphate ore from China were studied with the variation of temperature and phosphoric acid concentration under the conditions: the ratio of liquid to solid of 12 mL/g, stirring speed of 120r/min, and phosphate particle size of −0.074 mm amounts 61.1%. The optimal REEs leaching efficiency of around 98% was achieved with a temperature of 55 °C, phosphoric acid concentration of 30%, and duration of 60 min.
Leaching of REEs from phosphate ore in phosphoric acid divided into two stages, i.e., fast reaction stage within 3 min, and slow reaction stage with the prolonging of time. Kinetics of the phosphate ore leaching process was investigated using shrinking core models. At a fast reaction stage, the semi-empirical equation describing the kinetics was 1 − 3(1 − α)2/3 + 2(1 − α) = 1.885CH3PO40.89exp(−11220/8.31T)t. The semi-empirical equation for slow reaction stage was 1 − 3(1 − α)2/3 + 2(1 − α) = 0.299CH3PO42.50exp(−18720/8.31T)t. The initial fast reaction stage was rapidly completed in 3 min, and the apparent activation energy was determined at 11.22 and around 6.99–10.74 kJ/mol by shrinking core model and time-to-a-given-fraction method, respectively. The leaching rate at the fast reaction stage was controlled by solid product layer diffusion.
With the prolonging of leaching time, the leaching process was slowed down due to the blocking of the penetration of phosphoric acid by ash layer and the decrease of phosphoric acid concentration. The apparent activation energy was calculated at 18.72 and 29.50 kJ/mol using shrinking core model and time-to-a-given-fraction method, respectively. The leaching process was controlled by both solid product layer diffusion and chemical reaction, and chemical reaction only contributed to the rate-controlling effect to a small extent.
Author Contributions
Conceptualization, D.H.; Data curation, Z.L., H.Z. and H.L.; Formal analysis, J.D. and H.Z.; Funding acquisition, D.H.; Investigation, Z.X.; Methodology, Z.L. and Z.X.; Project administration, D.H.; Resources, D.H.; Supervision, D.H.; Validation, J.D. and D.H.; Visualization, H.L.; Writing—original draft, Z.X.; Writing—review & editing, Z.L. All authors have read and agreed to the published version of the manuscript.
Funding
This research was funded by Hubei Tailings (Slag) Resource Utilization Engineering Technology Research Center Project, grant number No. 2019ZYYD070, China Geological Survey Project, grant number No. DD20190626, and Open Foundation of State Environmental Protection Key Laboratory of Mineral Metallurgical Resources Utilization and Pollution Control (HB201912).
Conflicts of Interest
The authors declare no conflict of interest.
References
- Gergoric, M.; Ravaux, C.; Steenari, B.M.; Espegren, F.; Retegan, T. Leaching and recovery of rare-earth elements from neodymium magnet waste using organic acids. Metals 2018, 8, 721. [Google Scholar] [CrossRef]
- Castro, L.; Blázquez, M.L.; González, F.; Muñoz, J.A. Bioleaching of Phosphate Minerals Using Aspergillus niger: Recovery of Copper and Rare Earth Elements. Metals 2020, 10, 978. [Google Scholar] [CrossRef]
- Brückner, L.; Elwert, T.; Schirmer, T. Extraction of Rare Earth Elements from Phospho-Gypsum: Concentrate Digestion, Leaching, and Purification. Metals 2020, 10, 131. [Google Scholar] [CrossRef]
- Balinski, A.; Atanasova, P.; Wiche, O.; Kelly, N.; Reuter, M.A.; Scharf, C. Selective Leaching of Rare Earth Elements (REEs) from Eudialyte Concentrate after Sulfation and Thermal Decomposition of Non-REE Sulfates. Minerals 2019, 9, 522. [Google Scholar] [CrossRef]
- Yang, X.; Honaker, R. Leaching Kinetics of Rare Earth Elements from Fire Clay Seam Coal. Minerals 2020, 10, 491. [Google Scholar] [CrossRef]
- Wu, S.; Wang, L.; Zhao, L.; Zhang, P.; El-Shall, H.; Moudgil, B.; Zhang, L. Recovery of rare earth elements from phosphate rock by hydrometallurgical processes–A critical review. Chem. Eng. J. 2018, 335, 774–800. [Google Scholar] [CrossRef]
- Puchelt, H.; Emmermann, R. Bearing of rare earth patterns of apatites from igneous and metamorphic rocks. Earth Planet. Sc. Lett. 1976, 31, 279–286. [Google Scholar] [CrossRef]
- Awadalla, G.S. Geochemistry and microprobe investigations of Abu Tartur REE-bearing phosphorite, Western Desert, Egypt. J. Afr. Earth Sci. 2010, 57, 431–443. [Google Scholar] [CrossRef]
- Kim, R.; Cho, H.; Han, K.N.; Kim, K.; Mun, M. Optimization of acid leaching of rare-earth elements from Mongolian apatite-based ore. Minerals 2016, 6, 63. [Google Scholar] [CrossRef]
- Battsengel, A.; Batnasan, A.; Narankhuu, A.; Haga, K.; Watanabe, Y.; Shibayama, A. Recovery of light and heavy rare earth elements from apatite ore using sulphuric acid leaching, solvent extraction and precipitation. Hydrometallurgy 2018, 179, 100–109. [Google Scholar] [CrossRef]
- Liang, H.; Zhang, P.; Jin, Z.; De Paoli, D.W. Rare Earth and Phosphorus Leaching from a Flotation Tailings of Florida Phosphate Rock. Minerals 2018, 8, 416. [Google Scholar] [CrossRef]
- Banihashemi, S.R.; Taheri, B.; Razavian, S.M.; Soltani, F. Selective Nitric Acid Leaching of Rare-Earth Elements from Calcium and Phosphate in Fluorapatite Concentrate. JOM 2019, 71, 4578–4587. [Google Scholar] [CrossRef]
- Bandara, A.M.T.S.; Senanayake, G. Dissolution of calcium, phosphate, fluoride and rare earth elements (REEs) from a disc of natural fluorapatite mineral (FAP) in perchloric, hydrochloric, nitric, sulphuric and phosphoric acid solutions: A kinetic model and comparative batch leaching of major and minor elements from FAP and RE-FAP concentrate. Hydrometallurgy 2019, 184, 218–236. [Google Scholar] [CrossRef]
- Amine, M.; Asafar, F.; Bilali, L.; Nadifiyine, M. Hydrochloric Acid Leaching Study of Rare Earth Elements from Moroccan Phosphate. J. Chem. 2019, 2019, 1–6. [Google Scholar] [CrossRef]
- Wu, S.; Zhao, L.; Wang, L.; Huang, X.; Zhang, Y.; Feng, Z.; Cui, D. Simultaneous recovery of rare earth elements and phosphorus from phosphate rock by phosphoric acid leaching and selective precipitation: Towards green process. J. Rare Earth 2019, 37, 652–658. [Google Scholar] [CrossRef]
- Stone, K.; Bandara, A.M.T.S.; Senanayake, G.; Jayasekera, S. Processing of rare earth phosphate concentrates: A comparative study of pre-leaching with perchloric, hydrochloric, nitric and phosphoric acids and deportment of minor/major elements. Hydrometallurgy 2016, 163, 137–147. [Google Scholar] [CrossRef]
- Wang, L.; Long, Z.; Huang, X.; Yu, Y.; Cui, D.; Zhang, G. Recovery of rare earths from wet-process phosphoric acid. Hydrometallurgy 2010, 101, 41–47. [Google Scholar] [CrossRef]
- Reddy, B.R.; Kumar, B.N.; Radhika, S. Solid-Liquid Extraction of Terbium from Phosphoric Acid Medium using Bifunctional Phosphinic Acid Resin, Tulsion CH-96. Solvent Extr. Ion Exch. 2009, 27, 695–711. [Google Scholar] [CrossRef]
- Cetiner, Z.S.; Wood, S.A.; Gammons, C.H. The aqueous geochemistry of the rare earth elements. Part XIV. The solubility of rare earth element phosphates from 23 to 150 C. Chem. Geol. 2005, 217, 147–169. [Google Scholar] [CrossRef]
- Lefires, H.; Medini, H.; Megriche, A.; Mgaidi, A. Dissolution of calcareous phosphate rock from Gafsa (Tunisia) using dilute phosphoric acid solution. Int. J. Nonferrous Metall. 2014, 3, 1–7. [Google Scholar] [CrossRef][Green Version]
- Van der Sluis, S.; Meszaros, Y.; Marchee, W.G.; Wesselingh, H.A.; Van Rosmalen, G.M. The digestion of phosphate ore in phosphoric acid. Ind. Eng. Chem. Res. 1987, 26, 2501–2505. [Google Scholar] [CrossRef]
- Kim, C.J.; Yoon, H.S.; Chung, K.W.; Lee, J.Y.; Kim, S.D.; Shin, S.M.; Kim, S.H. Leaching kinetics of lanthanum in sulfuric acid from rare earth element (REE) slag. Hydrometallurgy 2014, 146, 133–137. [Google Scholar] [CrossRef]
- Yoon, H.S.; Kim, C.J.; Chung, K.W.; Lee, J.Y.; Shin, S.M.; Lee, S.J.; Yoo, S.J. Leaching kinetics of neodymium in sulfuric acid of rare earth elements (REE) slag concentrated by pyrometallurgy from magnetite ore. Korean. J. Chem. Eng. 2014, 31, 1766–1772. [Google Scholar] [CrossRef]
- Kim, C.J.; Yoon, H.S.; Chung, K.W.; Lee, J.Y.; Kim, S.D.; Shin, S.M.; Lee, S.I. Leaching Kinetics of Praseodymium in Sulfuric Acid of Rare Earth Elements (REE) Slag Concentrated by Pyrometallurgy from Magnetite Ore. Korean Chem. Eng. Res. 2015, 53, 46–52. [Google Scholar] [CrossRef][Green Version]
- Ashraf, M.; Zafar, Z.I.; Ansari, T.M. Selective leaching kinetics and upgrading of low-grade calcareous phosphate rock in succinic acid. Hydrometallurgy 2005, 80, 286–292. [Google Scholar] [CrossRef]
- Senanayake, G. Review of rate constants for thiosulphate leaching of gold from ores, concentrates and flat surfaces: Effect of host minerals and pH. Miner. Eng. 2007, 20, 1–15. [Google Scholar] [CrossRef]
- Santos, F.M.; Pina, P.S.; Porcaro, R.; Oliveira, V.A.; Silva, C.A.; Leão, V.A. The kinetics of zinc silicate leaching in sodium hydroxide. Hydrometallurgy 2010, 102, 43–49. [Google Scholar] [CrossRef]
- Dickinson, C.F.; Heal, G.R. Solid–liquid diffusion controlled rate equations. Thermochim. Acta 1999, 340, 89–103. [Google Scholar] [CrossRef]
- Levenspiel, O. Chemical reaction engineering. Ind. Eng. Chem. Res. 1999, 38, 4140–4143. [Google Scholar] [CrossRef]
- Abdel-Aal, E.A. Kinetics of sulfuric acid leaching of low-grade zinc silicate ore. Hydrometallurgy 2000, 55, 247–254. [Google Scholar] [CrossRef]
- Yang, Z.; Li, H.Y.; Yin, X.C.; Yan, Z.M.; Yan, X.M.; Xie, B. Leaching kinetics of calcification roasted vanadium slag with high CaO content by sulfuric acid. Inter. J. Miner. Process. 2014, 133, 105–111. [Google Scholar] [CrossRef]
- Valeev, D.; Kunilova, I.; Shoppert, A.; Salazar-Concha, C.; Kondratiev, A. High-pressure HCl leaching of coal ash to extract Al into a chloride solution with further use as a coagulant for water treatment. J. Clean. Prod. 2020, 276, 123206. [Google Scholar] [CrossRef]
- Hidalgo, T.; Kuhar, L.; Beinlich, A.; Putnis, A. Kinetics and mineralogical analysis of copper dissolution from a bornite/chalcopyrite composite sample in ferric-chloride and methanesulfonic-acid solutions. Hydrometallurgy 2019, 188, 140–156. [Google Scholar] [CrossRef]


Publisher’s Note: MDPI stays neutral with regard to jurisdictional claims in published maps and institutional affiliations. |
© 2021 by the authors. Licensee MDPI, Basel, Switzerland. This article is an open access article distributed under the terms and conditions of the Creative Commons Attribution (CC BY) license (http://creativecommons.org/licenses/by/4.0/).