Abstract
Oxygen-enhanced combustion (OEC) is a useful method for improving the efficiency of thermal plants and for decreasing greenhouse gas (GHG) emissions. Basic and modified burner designs utilizing OEC in the aluminum melting process in a rotary tilting furnace were studied. A combined approach comprising experimental measurement and simulation modeling was adopted aimed at assessing GHG emissions production. Reduction of up to 60% fuel consumption of the total natural gas used in the laboratory-scale furnace was achieved. The optimal oxygen concentration in the oxidizer regarding the amount of total GHG emissions produced per charge expressed as CO2 equivalent was 35% vol. Its further increase led only to marginal fuel savings, while the nitrogen oxide emissions increased rapidly. Using the modified burner along with OEC led to around 10% lower CO2 emissions and around 15% lower total GHG emissions, compared to using a standard air/fuel burner. CFD simulations revealed the reasons for these observations: improved mixing patterns and more uniform temperature field. Modified burner application, moreover, enables furnace productivity to be increased by shortening the charge melting time by up to 16%. The presented findings demonstrate the feasibility of the proposed burner modification and highlight its better energy and environmental performance indicators, while indicating the optimal oxygen enrichment level in terms of GHG emissions for the OEC technology applied to aluminum melting.
1. Introduction
Global energy and environmental policies push manufacturers towards increasing the efficiency of thermal plants, which reduces greenhouse gas (GHG) emissions from technical processes [1,2]. In recent decades, oxy-combustion technology or combustion employing elevated oxygen concentrations in the oxidizing agent has been proposed as a promising means of achieving this objective [3]. This type of combustion, referred to as oxygen-enhanced combustion (OEC), has many benefits including increased processing rates [4], higher heat transfer efficiency [5,6], improved flame characteristics [7], reduced production of GHG emissions [8], reduced equipment cost, and last but not least, improved product quality. It also represents an interesting route for decarbonization via carbon capture and storage [9]. OEC technology has found its application in the steel industry for reheat [10], soaking pits [11,12], or ladles [13]. It is used in other sectors as well: in the non-metallic industry and glass industry for melting charge material [4], in the petroleum and refining sector [4], and in power production [14]. Combustion of fossil fuels plays a major role in these applications for process heat provision. However, it is accompanied with the formation of several unwanted products, including GHG emissions. At present, it is important to look for ways of increasing the efficiency of thermal plants in order to reduce the emissions produced. OEC technology is also used in secondary aluminum production in rotary tilting furnaces, which process aluminum scraps and dross [15,16]. The potential for increasing the thermal efficiency of Al-melting furnaces by implementing OEC technology has been described by Jepson [17]. Increased thermal efficiency of rotary tilting furnaces by means of OEC technology was also the subject of previous research by the authors of this article. Results of our analysis of how burner nozzle parameters influence the aluminum melting process were presented in [18], and an improved design for a rotary tilting furnace door was also proposed and experimentally tested [19]. However, the environmental impact of the utilization of OEC technology in rotary tilting furnaces has not been sufficiently described so far.
Industrial-scale rotary tilting furnaces are commonly heated with oxy-fuel to achieve high temperatures in the melting process. The rotary tilting furnace charge consists of a mixture of non-ferrous wastes and dross, mostly based on aluminum and alumina [20]. Natural gas, liquefied petroleum gas (LPG) or heating oil can be used as fuels. In melting furnaces, 50–70% of the heat energy released through fuel combustion turns into the heat content of flue gases, part of the heat is retained in the refractory and steel structure, and yet another part of it is radiated out through the opening. The efficiency of the furnace is reduced by air infiltration and incorrectly set amounts of excess combustion air (oxidizer) sent to the burners. Air infiltration has a significant impact on NOx emission formation. Oxygen-enhanced combustion decreases the concentration of nitrogen in the furnace, but on the other hand it can increase the formation of thermal NOx [21]. Decreased fuel consumption has a significant impact on CO2 emissions. A change in the oxygen concentration in the oxidizer leads to a change in the mixing patterns of the fuel and the combustion oxidizer agent. This impacts the CO emissions as well. The processes of GHG emissions formation during oxygen-enriched combustion in rotary tilting furnaces are not yet well understood, which leaves a wide scope for researchers to undertake analyses related to this topic.
Reflecting the need for better insight into the influence of OEC technology application on environmental impacts (GHG emissions) and energy (fuel) consumption through changes in furnace operation parameters, the present study aims at contributing to the current knowledge in this field by doing the following:
- assessing the trends in gaseous emission concentrations and their total amount created per charge melted in a model laboratory-scale furnace with varying oxygen contents in the oxidizer;
- estimating the energy-saving potential resulting from OEC technology application;
- estimating the optimal furnace operation regime in terms of both performance criteria (environment and energy).
The authors of this article designed and created an experimental laboratory-scale model of a rotary tilting furnace to investigate the impact of OEC on GHG emissions formation. OEC was applied with oxygen content in the oxidizing agent ranging from 21% to 50% vol. A simulation model for analysis of GHG emissions production was created and validated with results from experimental measurement.
The rest of this paper is organized as follows: First, a description of the laboratory-scale furnace used in the experiments and the instrumentation employed is provided. The simulation model is described, followed by the results obtained and the related discussion. The Conclusion sums up the key findings.
2. Experimental Model
Experimental equipment (Figure 1) was constructed to monitor the melting and intensification processes of the gaseous fuel combustion process. For the design of the experimental model, a functioning model of a tilting rotary furnace was built at a geometrical scale of 1:5.2, with an inside diameter of 305 mm and length of 607 mm. The experimental model was placed at an angle of inclination of 7% during the measurements. K-type thermocouples (NiCr-NiAl) PTTK-TKb-60-2-SP (Meratex s.r.o., Košice, Slovakia) were used to measure temperatures at 13 points in the furnace. The measurement uncertainty of these thermocouples given by the manufacturer is at the level of +/−2.5 °C at the temperature of 1200 °C. One of the aims of the research was to use thermocouples to continuously monitor the changes in the temperature field in the combustion chamber, lining, stack and charge. The distribution of thermocouples in the furnace and distance from the burner in the X-axis is shown in Figure 2 and defined in Table 1.
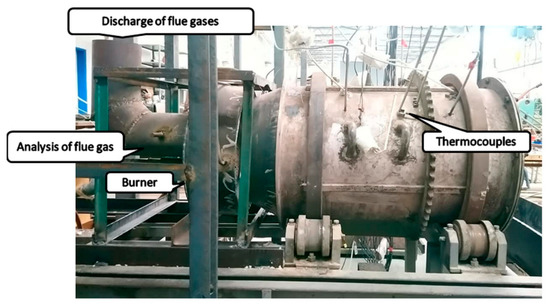
Figure 1.
Experimental model of tilting rotary furnace.
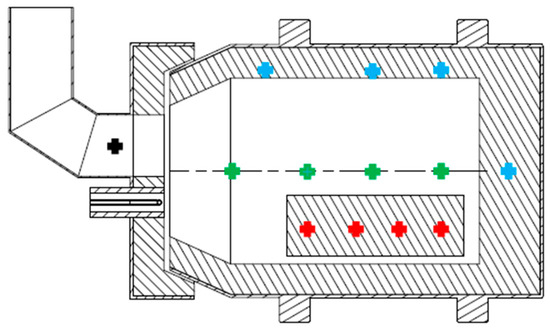
Figure 2.
Distribution of thermocouples in the furnace (blue) lining, (green) combustion chamber, (red) charge material, (black) stack.

Table 1.
Distances of individual thermocouples from the burner.
The experimental model did not rotate during the experiments. It was set up statically due to the placement of thermocouples around the circumference of the casing and their fixed connection to the measuring panel. Flue-gas analysis was performed using a Testo-350XL flue-gas analyzer (K-Test, s.r.o., Košice, Slovakia). Flow rates of all gaseous media were measured using Bronkhorst-designed MASS-VIEW (AREKO s.r.o., Bratislava, Slovakia) series thermal mass flow meters/regulators. These devices operate on the principle of direct thermal mass flow measurement [22]. The specific models used during these experiments were MV-308, MV-106 and MV-306 (AREKO s.r.o., Bratislava, Slovakia).
Other relevant parameters related to furnace operation were recorded by the furnace control system. More detailed description of the experimental model features and process instrumentation used is provided elsewhere [19].
The aim of the research was to analyze the impact of OEC with oxygen content range between 21% and 50% in the oxidizing agent on the aluminum melting process, heat transfer and temperature distribution inside the furnace, flue-gas temperature, and emissions produced. At the same time, the impact of the proposed burner modification was analyzed, as described in more detail in article [18]. The objective of the modification was to optimize the burner nozzle parameter relating to the flame velocity of the combustible mixture. Additionally, analysis of the possibility of reducing air infiltration into the combustion chamber by means of a novel furnace door design was performed [19].
The experimental measurements were carried out using a burner rated at 13.5 kW fuel energy input power for natural gas combustion. The basic geometric characteristics of the burner are provided in Figure 3. Aluminum ingots with total weight 15 kg were used as furnace charge. Table 2 shows the gas, air and oxygen flow rates required to achieve the desired oxygen concentration in the oxidizing agent. Natural gas was supplied by the distribution network. The composition of this natural gas during the experiments is presented in Table 3.
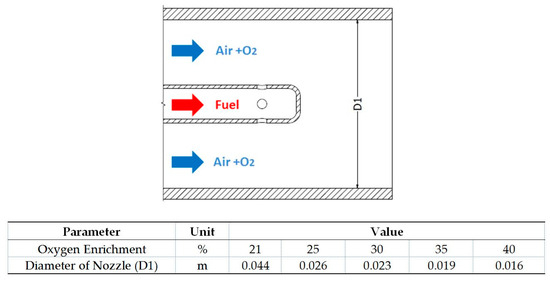
Figure 3.
Burner modification parameters.
Table 2.
Flow rate of inlet media depending on oxygen concentration in the oxidizing agent.
Table 3.
Natural gas composition in % vol. (adapted from [23]).
3. Mathematical Modeling of Emissions Formation
The standards for determining the amount of emissions from a heat source state two basic conversion relationships, one from the analysis of combustion products and the other from the amount and type of fuel used. The model created by the authors determines the amount of gaseous emissions produced during the smelting of aluminum in a furnace in accordance with Slovak Regulation No. 410/2012 Z. z. The results of the simulation model were verified for a plant for smelting pure aluminum using natural gas as fuel. The amount of emissions produced in an aluminum melting furnace heated with natural gas, E, is a function of three main variables as shown in Equation (1):
where is the total amount of heated and melted metallic material (kg; kgs−1), is the average temperature in the combustion chamber of the furnace (°C, K), and is the concentration of oxygen in the oxidant (%).
The total amount of melted charge material was determined using the combined thermal-design analogy of the laboratory-scale model with the industrial-scale furnace, which its construction was based on. Other parameters depended on the type of fuel used and the combustion conditions. As this was an atmospheric furnace, the change in the overall pressure conditions in the furnace was not taken into account.
The reaction temperature of combustion (theoretical flame temperature) of natural gas is the temperature of the exothermic reaction, which takes place adiabatically and isothermally under standard flow system conditions, where in steady state the reactants are present exactly at the stoichiometric ratio. The heat released raises the temperature of the products from the initial temperature of the reactants. The theoretical or adiabatic flame temperature is the temperature calculated from the calorific value of fuels with respect to the above-mentioned facts. The effects of endothermic reactions involving dissociation of CO2 and H2O components were included in the mathematical model.
The mathematical model is based on the mass material balance of natural gas combustion. The resulting relationship for determining the mass concentration of emissions produced is given by Equation (2), with the produced flue-gas volume being the sum of the combustion air and air infiltration volumes (Equation (3)). The determining variable is the measured oxygen content in the flue gas during the experimental measurements (Testo-350XL), and the real combustion conditions in the thermal aggregate are calculated based on combustion control via the air excess coefficient (Equation (4)). The mass flows of fuel, air and oxygen are defined on the basis of the burner fuel energy input. The volume of flue gas generated includes the impact of air infiltration, which is determined by means of Equation (5).
where is the component concentration (ppm); is the molar mass (kg kmol−1); is the molar volume of emission (m3 kmol−1); is the volume of flue gas (m3 m−3); is the volume of flue gas from combustion of 1 m3 fuel; is the fuel gas temperature; is the volume of air infiltration per 1 m3 of fuel (m3 m−3); is the air excess coefficient (–); is the theoretical volume of flue gas (dry) if m = 1 (m3·m−3); is the theoretical volume of oxidizing agent if m = 1 (m3·m−3); is the oxygen content in dry flue gases determined by means of flue-gas analysis (% vol.); and is the required oxygen concentration in oxygen-enriched combustion air for experimental measurement (%).
4. Results and Discussion
The measurements of flue-gas concentration were performed in the furnace stack. The impact of OEC technology on NOx formation was analyzed for two burner design variants. In the first case, the burner outlet orifice was constant, regardless of oxygen content in the oxidant. This case represents the utilization of air/fuel burners. In the second case, the burner outlet orifice was optimized with regard to the air flow rate. The results of OEC utilization impact on the formation of the basic flue-gas components (CO2, CO, NOx) obtained from experimental measurements are shown and discussed in later parts of this paper. The assessment of reduction in their formation is highly topical from an ecological point of view. The final concentration of oxygen in the oxidizer is influenced by air infiltration, and therefore the actual concentrations of oxygen in the experiments were lower in comparison with those shown in Table 2. Figure 4 shows the general dependence of the concentration of emission components during combustion of natural gas as a function of oxygen concentration in the oxidizer.
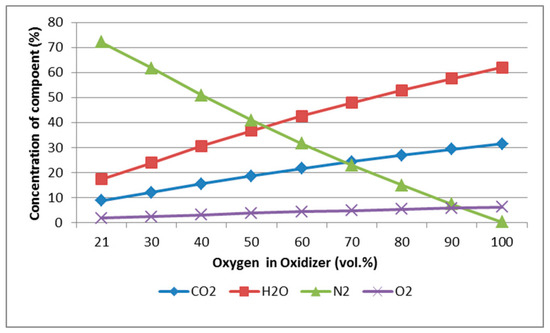
Figure 4.
Graphs of dependence of concentration of components (natural gas, flue gas) as a function of oxygen concentration in the oxidizer (m = 1.1) (mathematical modeling).
4.1. Emissions of CO2
CO2 emissions are directly linked to the carbon content in the fuel used as the heat source in the furnace. Table 3 provides the chemical composition of the fuel (natural gas). Based on fuel composition and on the statics of combustion, it is possible to determine the volume of CO2 in flue gases produced during the combustion of 1 m3 of fuel. The resulting value for CO2 emissions is 1.05 m3·m−3. When using OEC, the total volume of the CO2 component in the flue gas does not change, however, a change can be seen in the concentration of the CO2 component in the flue gas.
Reduction in the amount of CO2 emissions produced is facilitated by lower fuel consumption. Intensifying the combustion by means of OEC technology or the proposed modification of the burner makes it possible to shorten the time required for melting the charge material in the furnace. The measurement results presented in Figure 5 show that it is possible to save about 50% of the fuel with the utilization of OEC technology. In the same case, utilization of OEC technology combined with the proposed modification of the burner can lead to around 60% fuel savings compared to conventional air/fuel combustion.
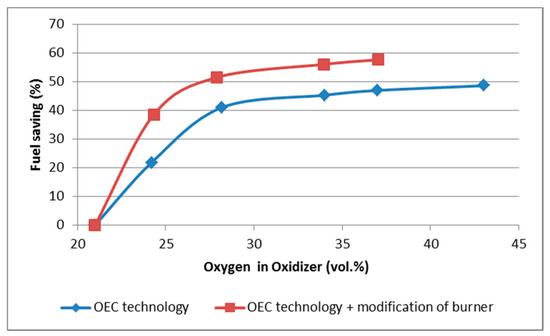
Figure 5.
Dependence of fuel savings on oxygen concentration in the oxidant (experimental measurements).
The results of our experimental measurements confirm that optimization of the burner outlet orifice according to flame velocity has a significant effect on the charge material melting process. Compared to the constant outlet orifice, about 10% fuel saving was achieved. Alternatively, it is possible to reduce the oxygen concentration by up to 10% in the oxidizer while achieving the same fuel saving. Fuel consumption reduction by 50 to 60% was indicated by 16% shorter charge melting time, as the burner fuel input rate was the same in all experiments.
4.2. Emissions of CO
The most common source of CO emissions in the flue gas is an incorrectly adjusted amount of combustion air excess (oxidizer) at burners or insufficient fuel mixing with the oxidizer. In the case of OEC, it is necessary to consider that part of the CO emissions are produced by the dissociation of CO2. This is an endothermic reaction defined by Equation (6):
The chemical equilibrium constant K in this reaction is defined by Equation (7):
where , , and are partial pressures of components CO, O2, and CO2 respectively.
where , , and are partial pressures of components CO, O2, and CO2 respectively. where a is the volume of CO2 (m3); b is the volume of O2 (m3); is the coefficient of dissociation; is an equilibrium constant; ΔG is the change in Gibbs’ energy (J·mol−1); R is universal gas constant 8.314 (J·K−1·mol−1); and T is temperature (K).
The extent of CO2 dissociation depends on temperature and partial pressures. The results of calculations based on Equations (6)–(9) above are presented in Figure 6. The highest coefficient of dissociation is obtained while maintaining the stoichiometry of combustion (m = 1), when the highest possible temperatures are reached. For the chemical composition of natural gas given in Table 3, temperatures in the range from 1961 °C (21% O2) to 3015 °C (100% O2) are reached. Due to the penetration of ambient air into the combustion chamber, the real air excess coefficient increases and the temperature reached is lower. Based on experimental measurements, the final excess of combustion air including air infiltration was determined as m = 1.2.
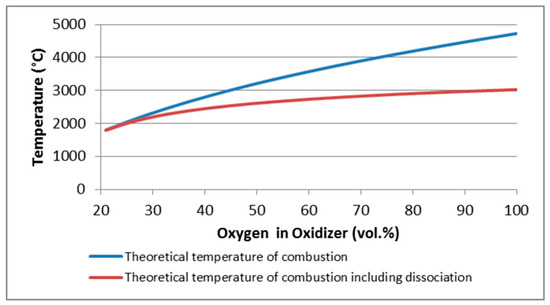
Figure 6.
Dependence of temperature as a function of oxygen concentration in the oxidizer (m = 1.2) (mathematical modeling).
Results of the mathematical model shown in Figure 7 predict the trends and values of the coefficient of dissociation depending on the oxygen enrichment concentration in the oxidizer and on the air excess. It is evident that with the oxygen concentration range of 21–30% vol. in the oxidizer and at higher air excess values, the dissociation of CO2 is negligible. This argument is well-presented in Figure 7. With increasing oxygen concentration in the oxidizer above 30% vol. a significant increase in CO2 dissociation occurs. This may then result in an increase in CO concentration in the flue gas.
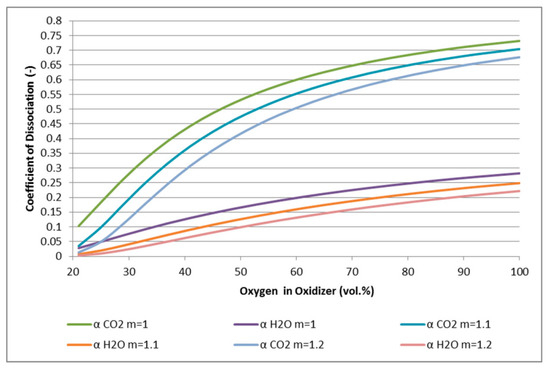
Figure 7.
Dependence of coefficient of dissociation of CO2 and H2O on oxidizer oxygen concentration (mathematical modeling).
The results of the experimental measurements are presented in Figure 8. CO formation is suppressed in the range of oxygen content in the oxidant from 21% to 27% vol. for both analyzed burner designs. Compared to air combustion, higher temperatures are achieved in these measurements, which can have a positive effect on the combustion process. Better blending of the combustion mixture can also occur. Both of these effects can have a positive influence on the reduction of CO formation. In the case of utilizing OEC above 35% vol., there is a slight increase in the concentration of CO in the flue gas, which confirms the findings obtained from the mathematical model. In the case of the modified burner, the concentration of CO emissions gradually decreases.
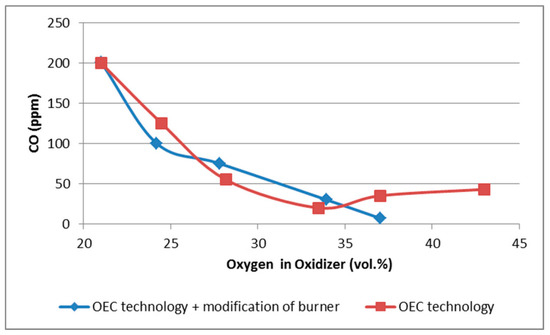
Figure 8.
Dependence of CO concentration in flue gas on concentration of oxygen in oxidizer (experimental measurements).
The use of an exhaust fan in the rotary tilting furnace reduces the flue-gas residence time, which means that CO molecules do not have enough time to burn out and are drawn off into the chimney. Industrial-scale furnaces, which utilize combustion with pure oxygen or combustion with high concentration of oxygen in the oxidizer, should therefore consider installation of an afterburner chamber for the combustible components of flue gas.
Further discussion on expected and measured CO concentrations is provided in part 5, along with a discussion related to simulated and measured temperature field and their comparison in Appendix A.
4.3. Emissions of NOx
Figure 9 shows that in both burner design cases the nitrogen oxide emissions increased as the oxygen concentration in the oxidizer rose. The addition of oxygen together with an optimized burner orifice caused the concentration of NOx in flue gas to increase, namely from 5 ppm (21% vol. O2) to 327 ppm (38.74% vol. O2). In the case of the constant burner orifice, an increase in NOx concentration in flue gas from 5 ppm (21% vol. O2) to 860 ppm (43% vol. O2) could be seen. The explanation for such a steep increase in NOx concentration in the flue gas is that the burner is placed in a zone with high infiltration of air into the furnace. In addition, due to the increasing combustion velocity, the flame becomes shorter. The formation and amount of nitrogen oxides are strongly temperature-dependent. The mechanism of NOx formation occurs at a temperature of about 1000 to 1300 K, and with increasing temperature the NOx concentration increases significantly. High flame temperature and large amounts of extra oxygen and nitrogen from air infiltration create suitable conditions for NOx formation [24].
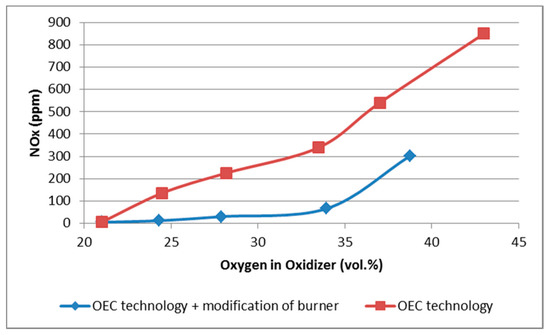
Figure 9.
Dependence of NOx concentration in flue gas on concentration of oxygen in oxidizer (experimental measurements).
In comparison with the results presented in the study by Poskart et al. [8], lower concentrations of NOx were found during our experimental measurements. In that study, the NOx concentration was 1284 ppm at 30% oxygen enrichment in the oxidizer and burner input power of 10 kW.
Rotary tilting furnace design and air infiltration create a suitable environment for the nitrogen oxide formation rate to decrease by means of primary denitrification (deNOx) methods. These methods are based on NOx formation suppression directly during fuel combustion through the creation of a reduction zone, which lowers the flame temperature [24,25]. Primary methods include overfire air (OFA) [26,27], reburning (stage combustion) [28], flue-gas recirculation (FGR) [29], and their combinations. The rotary tilting furnace involves a combination of OFA and FGR methods. OFA is caused by ambient air penetrating into the combustion chamber. The air infiltration zone is in close proximity to the burner, so infiltrating air can be considered as secondary air. The combustion mixture is burned with a larger excess of combustion air than is necessary for complete combustion of fuel, and this causes the combustion temperature to drop. There is also a decrease in the final concentration of oxygen enrichment in the oxidizer, which causes a further decrease in temperature. The position of the stack above the burner and the use of a flue-gas exhaust fan can cause flue-gas recirculation. Part of the recirculated flue gases are mixed with fresh flue gas, resulting in decreased temperatures and more uniform temperature distribution in the combustion chamber.
The difference between the results of the experimental measurements is caused by intensification of heat transfer to the charge material. Higher heat flux from flue gas to charge material causes a reduction in the temperature achieved in the combustion chamber, and thereby also a decrease in NOx emissions, through modification of the burner.
Figure 10 shows that the temperature of flue gas in the stack depends on the type of burner and the concentration of oxygen in the oxidizer. In the case of industrial-scale furnaces, many times higher NOx mass flows can be expected. The reason is the larger area of the opening through which ambient air penetrates into the combustion chamber. Moreover, combustion at higher oxygen concentrations or combustion with pure oxygen is used there, which causes an increase in combustion temperatures. A shorter flame and smaller reaction zone for combustion are expected only in applications where an air/fuel burner is used at lower oxygen concentrations.
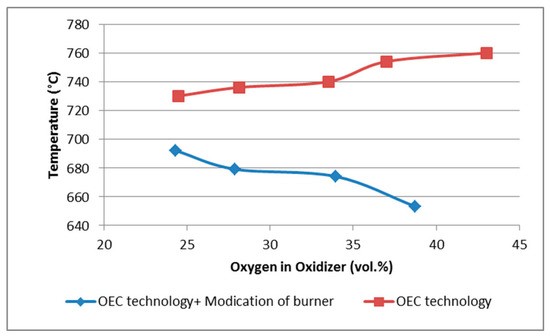
Figure 10.
Temperature of flue gas (experimental measurements).
From the results of our experimental measurements we can conclude that utilization of OEC does not have a significant effect on H2 and CH4 emissions, and their formation can therefore be ignored. The large amount of air infiltration and the high affinity of these components cause them to burn completely. As can be seen from Figure 7, higher H2 concentrations can be expected at oxygen concentrations in the oxidizing agent above 40%. At this oxygen concentration, temperatures in the combustion chamber reach the point at which water vapor (H2O) begins to dissociate. The coefficient of dissociation of H2O is about five times lower than that of CO2.
5. Computational Fluid Dynamics (CFD) Model of Emissions Formation
The formation of emission particles in the combustion chamber of a rotary tilting furnace under OEC conditions can be illustrated using simulation modeling with CFD simulations. Prieler et al. [30] described skeletal reaction mechanisms for the CFD model of the OEC system which they used. Bhuiyan et al. [31] modeled the impact of oxy/fuel combustion on radiative and convective heat transfer in a furnace. Cravero et al. [32] used a CFD model for designing and developing innovative configurations in regenerative furnaces. Gómez et al. [33] analyzed the formation of emissions at different oxygen concentrations in a boiler using a CFD model. Nieckele et al. [34] described CFD methodology for simulation modeling of an industrial aluminum melting furnace. Zhou et al. [35] performed numerical modeling of aluminum scrap processing in a rotary furnace. Khoei et al. [36] also modeled aluminum recycling processes in a rotary furnace. Rimar et al. [37] developed a simulation model of combustion for a heating furnace.
The simulation model of the laboratory-scale furnace shown in Figure 11 was developed in Ansys software v19.2 (Ansys, Canonsburg, PA, USA). Modeling of the interaction of turbulence and chemistry was performed based on non-premixed combustion. In this type of combustion, the fuel and the oxidizer are not brought into contact until they are introduced into the reaction zone. The combustion process was described in terms of the Westbrook and Dryer (WD) global reaction mechanism, and the formation of NOx emissions was calculated using the PDF transport equation. These reaction mechanisms are described in detail in paper [4]. The chemical composition of natural gas, which was used in our laboratory measurement, consists of 95% methane. Our simulation model was therefore simplified, and the fuel was assumed to consist of 100% methane. Five-step methane/air WD global reaction mechanisms were used for describing the combustion process. This process was defined using a combination of finite rate chemistry and eddy dissipation models. The utilized methane/air WD global reaction mechanisms are defined in Appendix B.
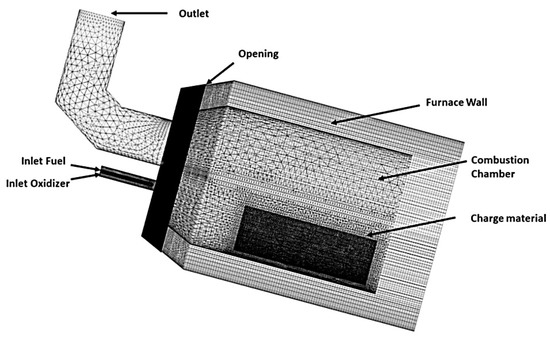
Figure 11.
CFD model of laboratory-scale model.
The utilized WD global reaction mechanisms were developed for modeling methane/air combustion. The kinetics of chemical reactions are defined using the Arrhenius Equation (Appendix B). Andersen [38] and Bibrzycki [39] optimized the kinetic parameters of the chemical reaction for modeling oxy combustion. Optimized Arrhenius equations allow better prediction of the combustion process and are defined in Appendix B.
The formation of nitrogen oxide was defined as two chemical reactions for thermal and prompt NO. The kinetics of chemical reactions are strongly dependent on the temperature reached in the combustion chamber, and in our simulation model they are defined by means of Ansys software (Appendix B).
DesignModeler software was used to create the simulation model shown in Figure 11. The model was divided into three domains. The main domain represents the fluid dynamics of the combustion chamber. It includes the above-mentioned model of interaction between turbulence and chemistry and boundary conditions for Inlet Fuel, Inlet Oxidizer, Outlet, and Opening. The boundary condition “Outlet” specifies the pressure condition of the stack, which in our case was defined as negative pressure created by the exhaust fan. On the basis of experimental measurement, the pressure condition of the chimney was set as −5 Pa. The boundary condition “Opening” defines the area through which outside air penetrated into the combustion chamber, where the specified pressure was equal to atmospheric, and the air composition was 21% vol. O2 and 79% vol. N2.
The boundary conditions for fuel and oxidizer were set as Inlet and were calculated from Table 2 for mass flow rate. The required mass flow rates to achieve the required oxygen enrichment in the oxidizer are shown in Table 4.
Table 4.
Boundary condition Fuel and Oxidizer.
The second and third domains represent the charge material and the furnace wall respectively. The boundary condition between individual domains was defined as “Interface”, where the heat transfer module was turned on. Turbulence in the simulation model was described with model k-ε realizable, and radiative heat transfer was described with model P1 (combustion chamber) and Monte Carlo (Charge material, Furnace Wall).
Figure 11 provides a visualization of the mesh of the CFD model. The total number of cells was 5050326. Further increase in mesh fineness did not yield any further change in simulation outputs. This model was created from tetrahedral, hexahedral and wedge cells. Meshing in the vicinity of the furnace walls and charge material was supported with the inflation function and the inflation option “Smooth transition”, a maximum of five layers and growth rate of 1.2. The worst value of y+ was 12, observed in the stack area, while in other areas it ranged from 0 to 1.5. In order to simplify the simulation model it was assumed that the charge material would not melt. The heating of the charge material was defined as the specific heat capacity of aluminum (903 J·kg−1·K−1). The melting model would require transient simulation, which is time-consuming due to the increased complexity of the CFD model.
Results of Simulation Model
The above-mentioned setting of the simulation model allowed monitoring of mass concentration of emission component CO2, CO, H2, NO, and CH4, depending on the change in oxygen enrichment concentration in the oxidizer. Distribution of the temperature field and velocity in the combustion chamber could also be monitored. Modeled results of CFD simulations were created for both burner types (see Section 2). The results presented in Figure 12, Figure 13, Figure 14 and Figure 15 are modeled for 35% oxygen concentration in the oxidizer. Verification of the simulation model was carried out for all modeled concentrations and burner types in comparison with the results from experimental measurement.
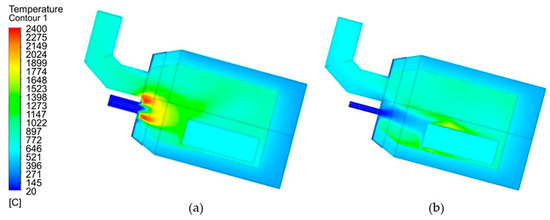
Figure 12.
Model results: distribution of temperature contours (a) OEC technology, (b) OEC technology +modification of burner.
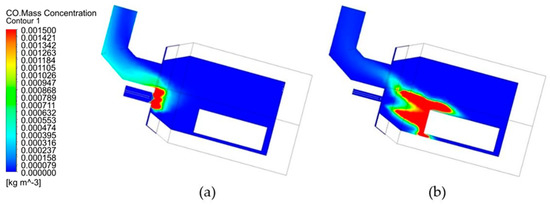
Figure 13.
Model results: distribution of CO mass concentration contours. (a) OEC technology, (b) OEC technology +modification of burner.
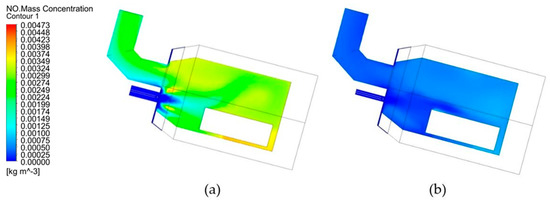
Figure 14.
Model results: distribution of NO mass concentration contours. (a) OEC technology, (b) OEC technology +modification of burner.
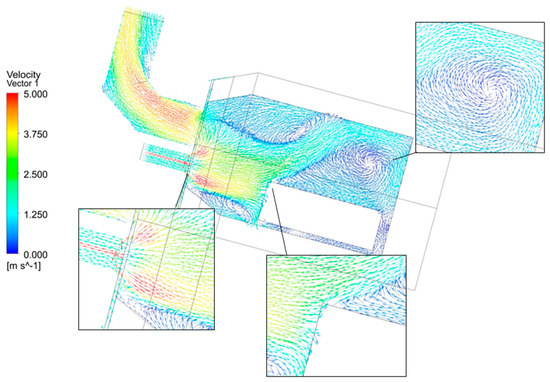
Figure 15.
Model results: vector of velocity with OEC technology.
Figure 12 presents a comparison of the distribution of temperature contours in the combustion chamber based on the change of burner type. The results of the simulation model confirm that the change in the diameter of the burner outlet orifice had a significant effect on the combustion process. When using OEC technology on the air/fuel burner, combustion takes place near the mouth of the burner, caused by high combustion flame speed and slow flow speed of the combustion mixture away from the burner. By optimizing the burner, the flame moves closer to the charge material. Results of the simulation modeling confirm that the flame temperature is lower in the case of the modified burner, which signals higher heat flux to the charge material. The achieved temperatures from the simulation model confirm the results of the experimental model presented in Figure 6. Comparison results from CFD modeling with experimental results are presented in Appendix A.
The model results shown in Figure 13 quantify the formation of CO emissions. Due to the small difference between achieved mass concentrations of CO based on the type of burner, the contour range had to be rescaled from 0 to 0.0015 kg m−3, which represents around 165 ppm CO. From the results of the simulation, it is evident that the area of CO formation is located specifically in the area of the flame. In the case of the air/fuel burner, a small part of the produced emissions is drawn into the stack by the exhaust fan. In the case of the optimized burner, the concentration of CO emissions drawn off into the stack is significantly lower.
The difference between temperatures achieved in the combustion chamber as presented in Figure 12 has a significant impact on the formation of NO emissions. Figure 14 presents the distribution of NO mass concentration contours. Improved heat transfer to the charge material due to a longer flame leads to more uniform distribution of the temperature field, and lower temperatures are achieved in the combustion chamber. This in turn reduces the formation of NO emissions. The results of our experimental measurement and simulation modeling confirm that optimization of the burner is a suitable way of decreasing the formation of NO emissions.
Circulation of flue gas in the combustion chamber is typical for the construction of a rotary tilting furnace. CFD modeling is a useful tool for predicting the zone of flue-gas circulation. Figure 15 and Figure 16 show the distribution of velocity fields in the combustion chamber depicted with vectors. In the case of an air/fuel burner, the circulation of flue gases takes place in the rear part of the combustion chamber. The density of flue gases in the rear part is higher due to the lower flue-gas temperature, causing fresh flue gas with higher temperature and with lower flue-gas density to be predominantly pushed upwards. This effect means that part of the thermal energy of the flue gas is not used to heat the charge material, but causes an increase in the production of NO emissions. In the case of a modified burner, the kinetic energy of the flue gas is higher and the above-mentioned problem with the circulation of flue gas does not exist.
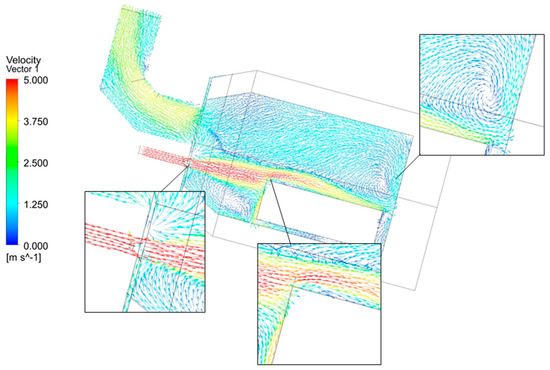
Figure 16.
Model results: Vector of velocity with OEC technology + modification of burner.
Flue-gas velocity contours presented in Figure 15 indicate that the flame and the produced fresh hot flue gas are partly repelled from the vicinity of the charge and diverted to the bulk of the furnace and partly to the stack. As a result, flue-gas flow velocity over the charge is lower than in the modified burner design, and a dead zone with a flue-gas vortex is formed in the rear part of the furnace. Modified burner design as documented in Figure 16 results in a flame orientated directly to the charge with the highest temperatures as well as the highest flue-gas flow velocities being reached in the vicinity of the charge. Although a flue-gas vortex forms in the furnace with modified burner design as well, in contrast to the basic burner design it does not disturb the flue-gas flow patterns above the charge. Thus, heat exchange both by convection and radiation is enhanced with the modified burner, charge melting time is decreased and flue-gas temperature to the stack is lowered.
The data presented in Figure 17 verify the CFD simulation model as its results are comparable with those from experimental measurement. Values used to construct this figure are listed in Appendix C. Thus, the method used for simulation model creation in Ansys can be considered as correct. The results obtained are relevant and can be used to predict the distribution of temperature in the combustion chamber and also the formation of emission components depending on the type of burner.
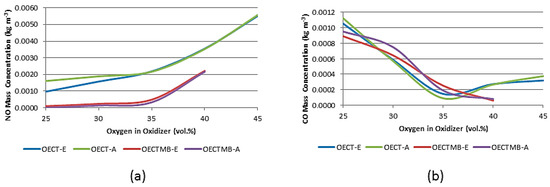
Figure 17.
Verification of CFD model. (a) NO mass concentration; (b) CO mass concentration.
Table 5 presents an overview of the emissions produced per melting cycle of charge material. The charge material was aluminum ingots. The time required to remelt the charge material was defined by the condition that the average temperature of the charge was 750 °C. The CO2, CO, and NO values shown in Table 5 were calculated based on Equation (2) from the results of the experimental measurements and fuel consumption presented in Table 2.
Table 5.
Summary of emissions produced in the melting of charge material, depending on oxygen concentration in the oxidant used.
The impact of the produced emission gases on the environment is different for each gas. The Global Warming Potential (GWP) concept was designed to standardize the impact of individual gases on the environment [40,41]. GWP is the heat absorbed by any greenhouse gas in the atmosphere, as a multiple of the heat which would be absorbed by the same mass of carbon dioxide (CO2). GWP is 1 for CO2. For other gases it depends on the particular gas. GWP for CO is 10 [40], which means that 1 g CO is equal to 10 g CO2. GWP for NO is 33 [41]. CO and NO produced as emission gases were recalculated using the GWP constant, and the results are included in Table 5 in the form of carbon dioxide equivalents (CO2 eq).
The results presented in Table 5 enable estimation of optimal furnace operation regarding both fuel consumption and environmental impact. Evaluating the fuel consumption alone (reflected in the amount of CO2 emissions produced) could lead to the misleading conclusion that “the higher oxygen enrichment rate the better”. However, including the impact of produced CO and NO emissions minimizes the incremental environmental benefit of oxygen enrichment rates over 35% vol., regardless of whether OEC technology is applied solely or in combination with a modified burner. Thus, it can be concluded that oxygen enrichment up to 35% vol. suffices in any attempt to approach near-optimal furnace operation, leading to its almost lowest combined energy use and environmental impact. The combination of OEC technology and burner modification allows for a reduction of fuel consumption by around 10% and total CO2 eq. emissions produced by around 15%, compared to OEC technology solely at around 35% vol. oxygen enrichment. The contribution of NO and CO emissions to the total GHG amount produced, expressed as CO2 equivalents, reaches around 5% for OEC technology solely and just 1% in the case of OEC technology combined with burner modification. This highlights the environmental performance superiority of the modified burner over the standard burner in OEC applications in rotary furnaces for aluminum melting.
6. Conclusions
The authors designed and constructed a laboratory-scale tilting rotary furnace and performed combined experimental-modeling analysis of GHG emissions produced during the combustion of natural gas at higher oxygen concentrations in the oxidizer, using basic and modified burner designs. Aluminum ingots with a total mass of 15 kg were used as the furnace charge in the experiments. A significant decrease in fuel consumption of up to 50% was recorded for both burner variants, which is associated with reduction in the amount of CO2 and other GHG emissions produced.
The experiments confirmed that optimization of the burner outlet orifice in terms of flame speed has a positive effect on the combustion process and heat exchange intensity, and reduces the melting time of the charge by up to 16% compared to standard air/fuel burners used when OEC technology is applied. This could lead to additional decrease in operating costs resulting from higher productivity being achievable in the furnace. In terms of the amount of CO and NOx emissions produced per melting charge, the optimum concentration of oxygen in the oxidizer is 35%. CFD simulations of furnace operation with a modified burner revealed a more uniform temperature field in the furnace, verified by experimental data from thermocouples and enhanced flue-gas mixing, which in accord with the experimental results led to lower flue-gas temperature in the stack. Likewise, lower NO and CO emissions released per charge using the modified burner, indicated by CFD simulations, were confirmed by the flue-gas composition measurement results.
Evaluation of GHG emissions recalculated to CO2 equivalents confirmed that the most feasible furnace operation is achieved at 35% vol. oxygen content in the oxidizer, leading to total GHG emissions per charge of less than 5 kg CO2 equivalent in the case of combined OEC technology and burner modification, whereas with OEC technology only the emissions are slightly over 6 kg CO2 equivalent.
Author Contributions
Conceptualization, A.V.; methodology, R.D.; validation, M.P. and L.L.; investigation, R.D. and M.V.; resources, G.J.; data curation, L.L; writing—original draft preparation, R.D. and M.V.; writing—review and editing, R.D., visualization, R.D. and M.V.; funding acquisition, A.V. and G.J. All authors have read and agreed to the published version of the manuscript.
Funding
This research was financially supported by the Slovak Research and Development Agency, grant nos. APVV-15-0148 and APVV-19-0170, and by the Slovak Scientific Agency, grant no. VEGA 1/0691/18.
Institutional Review Board Statement
Not applicable.
Informed Consent Statement
Not applicable.
Data Availability Statement
All data generated or analysed during this study are included in this article.
Conflicts of Interest
The authors declare no conflict of interest. The funders had no role in the design of the study, nor in the collection, analyses or interpretation of data, in the writing of the manuscript, or in the decision to publish the results.
Abbreviations
| a | Volume of CO2 (m3) |
| A | Pre-exponential factor (Equation (A6)) |
| b | Volume of H2O (m3) |
| Ci | Concentration of component (ppm) |
| CFD | Computational Fluid Dynamics |
| Ea | Activation energy (J.mol−1) |
| eq. | Equivalent (CO2 equivalent) |
| FGR | Flue gas recirculation |
| GHG | Greenhouse gases |
| GWP | Global Warming Potential |
| k1 to k4 | Reaction rates (Equations (A7)–(A10)) |
| K | Equilibrium constant |
| Theoretical volume of oxidizing agent if m = 1 (m3·m−3) | |
| LPG | Liquefied petroleum gas |
| m | Air excess coefficient |
| M | Molar mass (kg.kmol−1) |
| Oxygen content in dry flue gases determined by means of flue gas analysis (% vol.) | |
| OEC | Oxygen-Enhanced Combustion |
| OFA | Overfire air |
| p | Partial pressure (Pa) |
| R | Universal gas constant 8.314 (J K−1 mol−1) |
| t | Temperature (°C) |
| T | Thermodynamic temperature (K) |
| α | Coefficient of dissociation |
| ΔG | Change in Gibbs´ energy (J.mol−1) |
| OECT-E | OEC technology-Experiment |
| OECT-A | OEC technology-Ansys |
| OECTMB-E | OEC technology + Modification of burner- Experiment |
| OECTMB-A | OEC technology + Modification of burner- Ansys |
| Volume of fuel gas (m3) | |
| Volume of flue gas from combustion of 1 m3 fuel (m3 m−3) | |
| Volume of air infiltration for 1 m3 of fuel (m3 m−3) | |
| Theoretical volume of flue gas (dry) if m = 1 (m3·m−3) | |
| Required oxygen concentration in oxygen-enriched combustion air for experimental measurement (%) | |
| WD | Westbrook and Dryer |
Appendix A
Table A1.
Comparison of results from CFD modeling with experimental results using OEC technology.
Table A1.
Comparison of results from CFD modeling with experimental results using OEC technology.
| OEC Technology | |||||||||
| Position | O2 | E | A | E | A | E | A | E | A |
| Thermocouple | (% vol.) | T1 | - | T2 | - | T3 | - | T4 | - |
| Combustion chamber | 25 | 915 | 941 | 917 | 935 | 883 | 917 | 800 | 862 |
| 30 | 929 | 981 | 988 | 931 | 941 | 850 | 821 | 774 | |
| 35 | 998 | 1050 | 969 | 912 | 915 | 860 | 852 | 844 | |
| 40 | 1013 | 1101 | 972 | 1100 | 946 | 870 | 928 | 892 | |
| 45 | 1043 | 1090 | 945 | 1013 | 881 | 900 | 850 | 856 | |
| Lining | 25 | 709 | 750 | 732 | 782 | 709 | 781 | 692 | 714 |
| 30 | 747 | 760 | 747 | 780 | 701 | 736 | 698 | 724 | |
| 35 | 691 | 652 | 675 | 632 | 703 | 650 | 690 | 500 | |
| 40 | 659 | 700 | 708 | 714 | 687 | 713 | 652 | 682 | |
| 45 | 796 | 870 | 793 | 852 | 741 | 793 | 664 | 703 | |
| Stack | 25 | 730 | 756 | - | - | - | - | - | - |
| 30 | 736 | 700 | - | - | - | - | - | - | |
| 35 | 740 | 766 | - | - | - | - | - | - | |
| 40 | 754 | 746 | - | - | - | - | - | - | |
| 45 | 760 | 774 | - | - | - | - | - | - | |
Table A2.
Comparison of results from CFD modeling with experimental results using OEC technology + Modification of burner.
Table A2.
Comparison of results from CFD modeling with experimental results using OEC technology + Modification of burner.
| OEC Technology + Modification of Burner | |||||||||
| Position | O2 | E | A | E | A | E | A | E | A |
| Thermocouple | (% vol.) | T1 | - | T2 | - | T3 | - | T4 | - |
| Combustion chamber | 25 | 689 | 711 | 822 | 850 | 854 | 891 | 754 | 804 |
| 30 | 1137 | 1200 | 1026 | 1056 | 918 | 970 | 954 | 970 | |
| 35 | 850 | 878 | 826 | 856 | 913 | 870 | 992 | 931 | |
| 40 | 833 | 900 | 870 | 898 | 915 | 903 | 930 | 900 | |
| Lining | 25 | 677 | 703 | 748 | 780 | 688 | 714 | 729 | 714 |
| 30 | 712 | 743 | 725 | 756 | 691 | 723 | 740 | 723 | |
| 35 | 698 | 714 | 685 | 720 | 709 | 742 | 784 | 806 | |
| 40 | 650 | 570 | 668 | 600 | 710 | 660 | 748 | 680 | |
| Stack | 25 | 692 | 730 | - | - | - | - | - | - |
| 30 | 679 | 714 | - | - | - | - | - | - | |
| 35 | 674 | 706 | - | - | - | - | - | - | |
| 40 | 653 | 559 | - | - | - | - | - | - | |
Appendix B
The formation of NO emissions in Ansys software is given by Equations:
Thermal NO
Prompt NO
Appendix C
Table A3.
Verification of CFD model: NO and CO mass concentration.
Table A3.
Verification of CFD model: NO and CO mass concentration.
| OEC Technology | (% vol.) | 25 | 30 | 35 | 40 | 45 | |
| NO | Experimental | (kg m−3) | 9.68 × 10⁻⁴ | 1.58 × 10⁻³ | 2.19 × 10⁻³ | 3.55 × 10⁻³ | 5.52 × 10⁻³ |
| Ansys | (kg m−3) | 1.61 × 10⁻³ | 1.89 × 10⁻³ | 2.16 × 10⁻³ | 3.53 × 10⁻³ | 5.57 × 10⁻³ | |
| CO | Experimental | (kg m−3) | 8.56 × 10⁻⁴ | 5.85 × 10⁻⁴ | 1.45 × 10⁻⁴ | 2.72 × 10⁻⁴ | 3.18 × 10⁻⁴ |
| Ansys | (kg m−3) | 1.12 × 10⁻³ | 5.68 × 10⁻⁴ | 8.74 × 10⁻⁵ | 2.66 × 10⁻⁴ | 3.75 × 10⁻⁴ | |
| OEC technology + Modification of burner | (% vol.) | 25 | 30 | 35 | 40 | - | |
| NO | Experimental | (kg m−3) | 9.67 × 10⁻⁵ | 2.34 × 10⁻⁴ | 4.85 × 10⁻⁴ | 2.22 × 10⁻³ | - |
| Ansys | (kg m−3) | 3.85 × 10⁻⁸ | 1.38 × 10⁻⁴ | 3.26 × 10⁻⁴ | 2.16 × 10⁻³ | - | |
| CO | Experimental | (kg m−3) | 8.90 × 10⁻⁴ | 6.42 × 10⁻⁴ | 2.51 × 10⁻⁴ | 5.83 × 10⁻⁵ | - |
| Ansys | (kg m−3) | 9.51 × 10⁻⁴ | 7.49 × 10⁻⁴ | 1.88 × 10⁻⁴ | 7.77 × 10⁻⁵ | - | |
References
- OECD Organization for Economic Cooperation and Development. Material Case Study 2: Aluminium, in OECD Global Forum on Environment. Available online: https://www.oecd.org/env/waste/46194971.pdf (accessed on 20 October 2020).
- Gerres, T.; Ávila, J.P.C.; Llamas, P.L.; San Román, T.G. A review of cross-sector decarbonisation potentials in the European energy intensive industry. J. Cleaner Prod. 2019, 210, 585–601. [Google Scholar] [CrossRef]
- Naranjo, R.D.; Kwon, J.; Majumdar, R.; Choate, W.T. Advanced Melting Technologies: Energy Saving Concepts and Opportunities for the Metal Casting Industry, U.S. Department of Energy. Available online: https://www1.eere.energy.gov/manufacturing/resources/metalcasting/pdfs/advancedmeltingtechnologies.pdf (accessed on 20 October 2020).
- Baukal, C. Oxygen-Enhanced Combustion; CRC Press: Boca Raton, FL, USA, 2013. [Google Scholar]
- Wu, K.-K.; Chang, Y.-C.; Chen, C.-H.; Chen, Y.-D. High-efficiency combustion of natural gas with 21–30% oxygen-enriched air. Fuel 2010, 89, 2455–2462. [Google Scholar] [CrossRef]
- Jablonský, G.; Pástor, M.; Dzurňák, R. Enriching the Combustible Mixture with Oxygen in Practice; TU of Košice: Košice, Slovakia, 2015; ISBN 978-80-553-2414-2. [Google Scholar]
- Baukal, C.H.E. Industrial Burners Handbook, 1st ed.; CRC Press: Boca Raton, FL, USA, 2004; pp. 650–726. ISBN 9780203488805. [Google Scholar]
- Poskart, A.; Radomiak, H.; Niegodajew, P.; Zajemska, M.; Musiał, D. The Analysis of Nitrogen Oxides Formation During Oxygen—Enriched Combustion of Natural Gas. Arch. Met. Mater. 2016, 61, 1925–1930. [Google Scholar] [CrossRef]
- Leeson, D.; Mac Dowell, N.; Shah, N.; Petit, C.; Fennell, P.S. A Techno-economic analysis and systematic review of carbon capture and storage (CCS) applied to the iron and steel, cement, oil refining and pulp and paper industries, as well as other high purity sources. Int. J. Greenh. Gas Control 2017, 61, 71–84. [Google Scholar] [CrossRef]
- Mayr, B.; Prieler, R.; Demuth, M.; Hochenauer, C. Modelling of high temperature furnaces under air-fuel and oxygen enriched conditions. Appl. Therm. Eng. 2018, 136, 492–503. [Google Scholar] [CrossRef]
- Ghadamgahi, M.; Ölund, P.; Ekman, T.; Andersson, N.; Jönsson, P. Numerical and experimental study on flameless oxy-fuel combustion in a pilot- scale and a real-size industrial furnace. Appl. Therm. Eng. 2018, 141, 788–797. [Google Scholar] [CrossRef]
- Dinda, S.K.; Chattopadhyay, K. Numerical Modeling of Volatile Organic Compounds (VOC) Emissions during Preheating of Magnesia-Carbon Bricks in a Basic Oxygen Furnace. Metals 2020, 10, 1277. [Google Scholar] [CrossRef]
- Volkova, O.; Sahebkar, B.; Hubalkova, J.; Aneziris, C.G.; Scheller, P.R. Ladle Heating Procedure and Its Influence on the MgO–C-Oxidation. Mater. Manuf. Process. 2008, 23, 758–763. [Google Scholar] [CrossRef]
- Tan, Y.; Douglas, M.A.; Thambimuthu, K.V. CO2 capture using oxygen enhanced combustion strategies for natural gas power plants. Fuel 2002, 81, 1007–1016. [Google Scholar] [CrossRef]
- Wang, R.; Jiang, L.; Wang, Y.; Roskilly, A. Energy saving technologies and mass-thermal network optimization for decarbonized iron and steel industry: A review. J. Clean. Prod. 2020, 274. [Google Scholar] [CrossRef]
- D’Agostini, M. High-Efficiency, High-Capacity, Low-NOx Aluminum Melting Using Oxygen-Enhanced Combustion; DOE/ID/13514; U.S. Department of Energy: Washington, DC, USA, 2000; pp. 10–35.
- Jepson, S.; Kampen, P.V. Oxygen-enhanced combustion provides advantages in Al-melting furnaces. Ind. Heat. 2005, 72, 29–35. [Google Scholar]
- Dzurnak, R.; Varga, A.; Kizek, J.; Jablonský, G.; Lukáč, L. Influence of Burner Nozzle Parameters Analysis on the Aluminium Melting Process. Appl. Sci. 2019, 9, 1614. [Google Scholar] [CrossRef]
- Dzurňák, R.; Varga, A.; Jablonský, G.; Variny, M.; Atyafi, R.; Lukáč, L.; Pástor, M.; Kizek, J. Influence of Air Infiltration on Combustion Process Changes in a Rotary Tilting Furnace. Processes 2020, 8, 1292. [Google Scholar] [CrossRef]
- Mahinroosta, M.; Allahverdi, A. Hazardous aluminum dross characterization and recycling strategies: A critical review. J. Environ. Manag. 2018, 223, 452–468. [Google Scholar] [CrossRef]
- Ahn, S.Y.; Go, S.M.; Lee, K.Y.; Kim, T.H.; Seo, S.I.; Choi, G.M.; Kim, D.J. The characteristics of NO production mechanism on flue gas recirculation in oxy-firing condition. Appl. Therm. Eng. 2011, 31, 1163–1171. [Google Scholar] [CrossRef]
- Mass View: The Intelligent Alternative for VA Meters: Mass Flow for Gases with Flow Display. Available online: https://www.bronkhorst.com/getmedia/88dd3dac-0ddd-4dec-887f-8c3d34b28028/MASS-VIEW_EN.pdf (accessed on 20 October 2020).
- SPP-Distribucia. Available online: https://www.spp-distribucia.sk/dodavatelia/informacie/zlozenie-zemneho-plynu-a-emisny-faktor/ (accessed on 20 October 2020).
- Rimár, M.; Kulikov, A. NOx formation in combustion of gaseous fuel in ejection burner. In Proceedings of the 20th Anniversary of International Scientific Conference, Terchova, Slovakia, 27–29 April 2016; p. 20051. [Google Scholar]
- Bilbao, R.; Alzueta, M.U.; Millera, A.; Cantín, V. Experimental study and modelling of the burnout zone in the natural gas reburning process. Chem. Eng. Sci. 1995, 50, 2579–2587. [Google Scholar] [CrossRef]
- Jo, H.; Kang, K.; Park, J.; Ryu, C.; Ahn, H.; Go, Y. Optimization of Air Distribution to Reduce NOx Emission and Unburned Carbon for the Retrofit of a 500 MWe Tangential-Firing Coal Boiler. Energies 2019, 12, 3281. [Google Scholar] [CrossRef]
- Rimár, M.; Fedák, M.; Kulikov, A.; Čorny, I.; Abaham, M.; Kizek, J. Reduction of NOx formation under the limit combustion conditions through the application of combined primary deNOx methods on the gas boilers. Acta Montan. Slovaca 2019, 24, 98–119. [Google Scholar]
- Lukáč, L.; Rimár, M.; Variny, M.; Kizek, J.; Lukáč, P.; Jablonský, G.; Janošovský, J.; Fedák, M. Experimental Investigation of Primary De-NOx Methods Application Effects on NOx and CO Emissions from a Small-Scale Furnace. Processes 2020, 8, 940. [Google Scholar] [CrossRef]
- Shalaj, V.V.; Mikhajlov, A.G.; Novikova, E.E.; Terebilov, S.V.; Novikova, T.V. Gas Recirculation Impact on the Nitrogen Oxides Formation in the Boiler Furnace. Procedia Eng. 2016, 152, 434–438. [Google Scholar] [CrossRef]
- Prieler, R.; Mayr, B.; Viehböock, D.; Demuth, M.; Hochenauer, C. Sensitivity analysis of skeletal reaction mechanisms for use in CFD simulation of oxygen enhanced combustion systems. J. Energy Instit. 2018, 91, 369–388. [Google Scholar] [CrossRef]
- Bhuiyan, A.A.; Naser, J. Numerical modelling of oxy fuel combustion, the effect of radiative and convective heat transfer and burnout. Fuel 2015, 139, 268–284. [Google Scholar] [CrossRef]
- Cravero, C.; De Domenico, D. The Use of CFD for the Design and Development of Innovative Configurations in Regenerative Glass Production Furnaces. Energies 2019, 12, 2455. [Google Scholar] [CrossRef]
- Gómez, M.Á.; Martín, R.; Collazo, J.; Porteiro, J. CFD Steady Model Applied to a Biomass Boiler Operating in Air Enrichment Conditions. Energies 2018, 11, 2513. [Google Scholar] [CrossRef]
- Nieckele, A.O.; Naccache, M.F.; Gomes, M.S.P. Numerical Modeling of an Industrial Aluminum Melting Furnace. J. Energy Resour. Technol. 2004, 126, 72–81. [Google Scholar] [CrossRef]
- Zhou, B.; Yang, Y.; Reuter, M.A.; Boin, U. Modelling of aluminium scrap melting in a rotary furnace. Miner. Eng. 2006, 19, 299–308. [Google Scholar] [CrossRef]
- Khoei, A.R.; Masters, I.; Gethin, D. Numerical modelling of the rotary furnace in aluminium recycling processes. J. Mater. Process. Technol. 2003, 139, 567–572. [Google Scholar] [CrossRef]
- Rimár, M.; Kulikov, A.; Fedak, M.; Yeromin, O.O.; Sukhyy, K.; Gupalo, O.; Belyanovskaya, E.; Berta, R.; Smajda, M.; Ratnayake, M. Mathematical Model of a Heating Furnace Implemented with Volumetric Fuel Combustion. Processes 2020, 8, 469. [Google Scholar] [CrossRef]
- Andersen, J.; Rasmussen, C.L.; Giselsson, T.; Glarborg, P. Global combustion mechanisms for use in CFD modeling under oxy-fuel conditions. Energy Fuel 2009, 23, 1379–1389. [Google Scholar] [CrossRef]
- Bibrzycki, J.; Poinsot, T.; Zajdel, A. Investigation of Laminar Flame Speed of CH4/N2/O2 Mixtures Using Reduced Chemical Kinetic Mechanisms. Arch. Combust. 2010, 30, 287–296. [Google Scholar]
- Fuglestvedt, J.S.; Isaksen, I.S.A.; Wang, W.C. Estimates of indirect global warming potentials for CH4, CO and NOX. Clim. Change 1996, 34, 405–437. [Google Scholar] [CrossRef]
- Lammel, G.; Graßl, H. Greenhouse effect of NOX. Environ. Sci. Pollut. Res. 1995, 2, 40–45. [Google Scholar] [CrossRef] [PubMed]


Publisher’s Note: MDPI stays neutral with regard to jurisdictional claims in published maps and institutional affiliations. |
© 2021 by the authors. Licensee MDPI, Basel, Switzerland. This article is an open access article distributed under the terms and conditions of the Creative Commons Attribution (CC BY) license (http://creativecommons.org/licenses/by/4.0/).