Article

Numerical Investigation of Segregation Evolution during the Vacuum Arc Remelting Process of Ni-Based Superalloy Ingots

1
School of Metallurgy, Northeastern University, Shenyang 110819, China
2
High Temperature Materials Division, China Iron and Steel Research Institute Group, Beijing 100081, China
*
Authors to whom correspondence should be addressed.
Metals 2021, 11(12), 2046; https://doi.org/10.3390/met11122046
Submission received: 22 October 2021 / Revised: 9 December 2021 / Accepted: 14 December 2021 / Published: 17 December 2021

Abstract

:
Segregation defects greatly affect the service performance and working life of castings during the vacuum arc remelting (VAR) process. However, the corresponding research on the prediction of segregation defects is still not comprehensive. Through considering the influence of water-cooled crucible on the electromagnetic field inside an ingot, a full-scale model for the comprehensive prediction of freckles and macrosegregation defects during the VAR process is developed in this paper. The macroscopic solute transport phenomenon and the segregation behavior of Ni-5.8 wt% Al-15.2 wt% Ta alloy are predicted. The results indicate that the freckles are mainly concentrated in the lower region of the ingot. With the growth of the ingot, the solute enrichment channels gradually develop into solute enrichment regions, and the channel segregation evolves into macrosegregation. The Lorentz force mainly affects the flow pattern at the top of the molten pool, while the complex flow of multiple vortices is dominated by thermosolutal buoyancy. The maximum and minimum relative segregation ratio inside the ingot can reach 290% and −90%, respectively, and the positive segregation region accounts for about 79% of the total volume. This paper provides a new perspective for understanding the segregation behavior inside the ingot by studying the segregation evolution during the VAR process.

1. Introduction

Ni-based superalloys have been widely used to manufacture key hot-end components of aeroengines and large gas turbines due to their high creep resistance and fatigue strength, good oxidation, and hot corrosion resistance at high temperatures [1]. As the last step of the three-step smelting process of vacuum induction melting (VIM), electroslag remelting (ESR), and vacuum arc remelting (VAR), the VAR process can effectively improve the purity of remelting metals, which has consequently been widely used to prepare special alloys such as superalloys. As shown in Figure 1, DC arc is used as the heat source to smelt an electrode under the protection of vacuum or inert gas during the VAR process, and the droplet formed by smelting the electrode tip enters the water-cooled copper crucible to solidify into ingots [2]. The physical phenomena involved in this process are very complex, and a large amount of researches on this process have been carried out.
At present, many numerical models have been developed for this process, most of which focus on the shape of the molten pool, the flow pattern, and the distribution of the electromagnetic field. Sibaki et al. [3] established a two-dimensional axisymmetric model to study the influence of arc radius, side arc proportion, and gas cooling effect at shrinkage zone on the molten pool shape during the VAR process of titanium alloy. The results showed that the depth of the molten pool increased with the decrease in arc radius and side arc proportion, while the effect of gas cooling had little effect on the hydrodynamic behavior of the molten pool. Spitans et al. [4] established a two-dimensional axisymmetric model for transient growth of titanium alloy and observed the flow patterns dominated by different forces and their transition conditions. The results showed that besides buoyancy and Lorentz force, Ekman pumping will also greatly affect the flow in molten pools when the axial magnetic field is applied. Shevchenko et al. [5] studied the VAR process of the Inconel 718 alloy ingot and predicted the flow behavior in molten pools under steady-state Gaussian arc and transient time-varying arc distributions. The results showed that asymmetric arc behavior lasting for 5 s is sufficient to change the molten pool from a steady state to a transient state. Zhu et al. [6] used the half model to simulate the multi-field distribution during the VAR process of titanium alloy and found that the molten pool flow behavior was mainly dominated by the thermosolutal buoyancy. At the same time, the depth of the molten pool increases with the increase in melting current. Zhao et al. [7] calculated the electromagnetic field distribution in the VAR process by using a 1/4 scale model and analyzing the influence of stirring the magnetic field on electromagnetic force. The results showed that the self-induced magnetic field in the upper part of the ingot is basically unchanged, while the lower part is gradually reduced. Moreover, the addition of stirring magnetic field makes the horizontal rotating Lorentz force affect the surface of the ingot. From the above result, it can be found that due to the symmetry of molten pool, flow pattern, and electromagnetic field distribution, two-dimensional axisymmetric or three-dimensional non-full-scale models are mostly used in related research. These works have great potential to help one understand the basic physical phenomena in the VAR process. However, due to the existence of important asymmetric phenomena such as solute segregation defects, it is necessary to establish a three-dimensional full-scale model coupled with solute distribution.
At present, a large number of casting products produced by the VAR process have spot segregation defects such as freckles and white spots [8,9]. In addition, macrosegregation defects with solute enrichment in a certain range may also be formed inside the castings [10]. It will be difficult to eliminate these defects in the subsequent processing and heat treatment process, which will greatly affect the service performance and working life of castings [11]. Some scholars have undertaken relevant research on segregation defects in the VAR process through experiments and simulation methods. Shang et al. [12] observed the appearance and microstructure differences between the freckle forming region and the normal region of Nb-Ti alloy by means of metallographic structures and X-rays and calculated the Rayleigh number which is regarded as the criterion of freckle formation by using Meltflow software. The experimental and simulation results showed that the process parameters have an important influence on the formation of freckles, and that the freckles can be greatly reduced by matching the appropriate process parameters. Yang et al. [10] experimentally studied the effect of external magnetic fields on macrosegregation in titanium alloy ingots and found that the Lorentz force generated by external magnetic fields played a role in stirring the molten pool, which can reduce the macrosegregation degree of elements in titanium alloy. Wang et al. [13] studied the influence of process parameters on the formation of freckles by preparing Inconel 718 ingots. It was found that freckles were more likely to appear in the middle radius and central region of the ingots when the electrode diameter and arc gap were changed. Zagrebelnyy et al. [14] have carried out numerical research on the evolution of macrosegregation in the multi-stage VAR process of titanium alloy, and found that the distribution of electrode composition has little effect on the macrosegregation evolution of ingots in each stage under high power conditions. However, the inhomogeneity of the electrode composition may seriously affect the macrosegregation of the final ingot under low power. It should be emphasized that because their study used a two-dimensional axisymmetric model, it could not predict the random occurrence of freckle defects. Pericleous et al. [15] established a multi-scale model of the VAR process by introducing the temperature of the specific area of the paste into the micro-model in real time and predicted the formation of freckles and white spots under the eccentric and time-varying arc. Although the model further revealed the formation mechanism of freckles at the microscopic level, it did not fully show the solute distribution in the ingot and did not consider the influence of the water-cooled copper crucible region on the electromagnetic field distribution. It is worth noting that in recent years, some scholars have developed and perfected a variety of mesoscopic or micro-scale models based on the theory of grain nucleation and dendrite growth, and predicted the process including the grain size and the transformation of columnar crystals to equiaxed crystals. The evolution of the microstructure inside the ingots reveals the formation mechanism of segregation defects during the VAR process at a deeper level [16,17,18].
To the best of our knowledge, few works show the results of segregation evolution, including freckles and macrosegregation defects, during the VAR process, even though many papers on VAR modeling have been published. Generally, these two kinds of defects generally exist inside the ingots at the same time, and they are asymmetric. In order to fully explore the segregation behavior inside the ingot during the VAR process, a three-dimensional full-scale model for comprehensive prediction of freckles and macrosegregation defects was developed in this paper, and the influence of crucible on the electromagnetic field distribution inside the ingot was considered. The model was used to simulate the VAR process of Ni-5.8 wt% Al-15.2 wt% Ta alloy under typical industrial conditions, in which the segregation behavior was fully predicted. It is expected to play a guiding role in actual production.

2. Model Description

The multi-field coupling relationship involved in the VAR process is complex, as shown in Figure 2. Compared with the solidification process under natural convection, there are two differences: (1) The current flowing from the top of the crucible will cause a large magnetic field inside the ingot, and the Lorentz force will affect the flow of the melt during the solidification process, and (2) The Joule heat generated by current flowing through the ingot will change the temperature distribution and then the thermal buoyancy, which will finally affect the degree of segregation. Based on this, a three-dimensional full-scale mathematical model of the coupling solutions of the electromagnetic field, flow field, temperature and solute distribution is developed. Firstly, the electromagnetic field is solved according to the electric potential method, and then the Lorentz force and Joule heat are introduced into momentum and energy conservation equations as source terms, respectively, so as to realize the prediction of segregation behavior in the ingot. This model adopts the following assumptions:
(1)
The incompressible flow is assumed, ignoring the chemical reaction and Marangoni effect in the molten pool,
(2)
The metal density varies with temperature only in the buoyancy term of momentum equation, while the changing thermal conductivity with temperature calculated by thermodynamic software JMatPro (Version 7.0, Sente Software Ltd., Guildford, Surrey, UK) is adopted in this study. All other thermophysical properties are considered to be constant during the solidification process,
(3)
The current and heat flux provided by the arc to the top of the molten pool follow a Gaussian distribution [3],
(4)
In the melting stage of the consumable electrode, the thermal radiation on the surface of the molten pool is ignored and will be considered after the melting is completed.

2.1. Electric Potential Method

The incoming current interacts with the magnetic field induced inside the ingot to generate Lorentz force and Joule heat during the VAR process. The electric potential method is used to describe the above electromagnetic phenomena [19,20], and the electromagnetic physical quantities are solved based on the electrical potential φ and the magnetic vector potential A . The partial differential equation of φ and A is as follows:
2 φ = 0
2 A = μ 0 J
where μ0 is the magnetic permeability of free space; J is the current density.
The current density J can be obtained by substituting the potential distribution obtained from Equation (1) into Equation (3), and then the magnetic vector potential A can be obtained by substituting it into Equation (2). The magnetic induction intensity B can be obtained from Equation (4).
J = σ φ
B = × A
where σ is the electrical conductivity. Then the Lorentz force and Joule heat generated inside the ingot are as follows, respectively:
F = J × B
q Joule = J 2 / σ

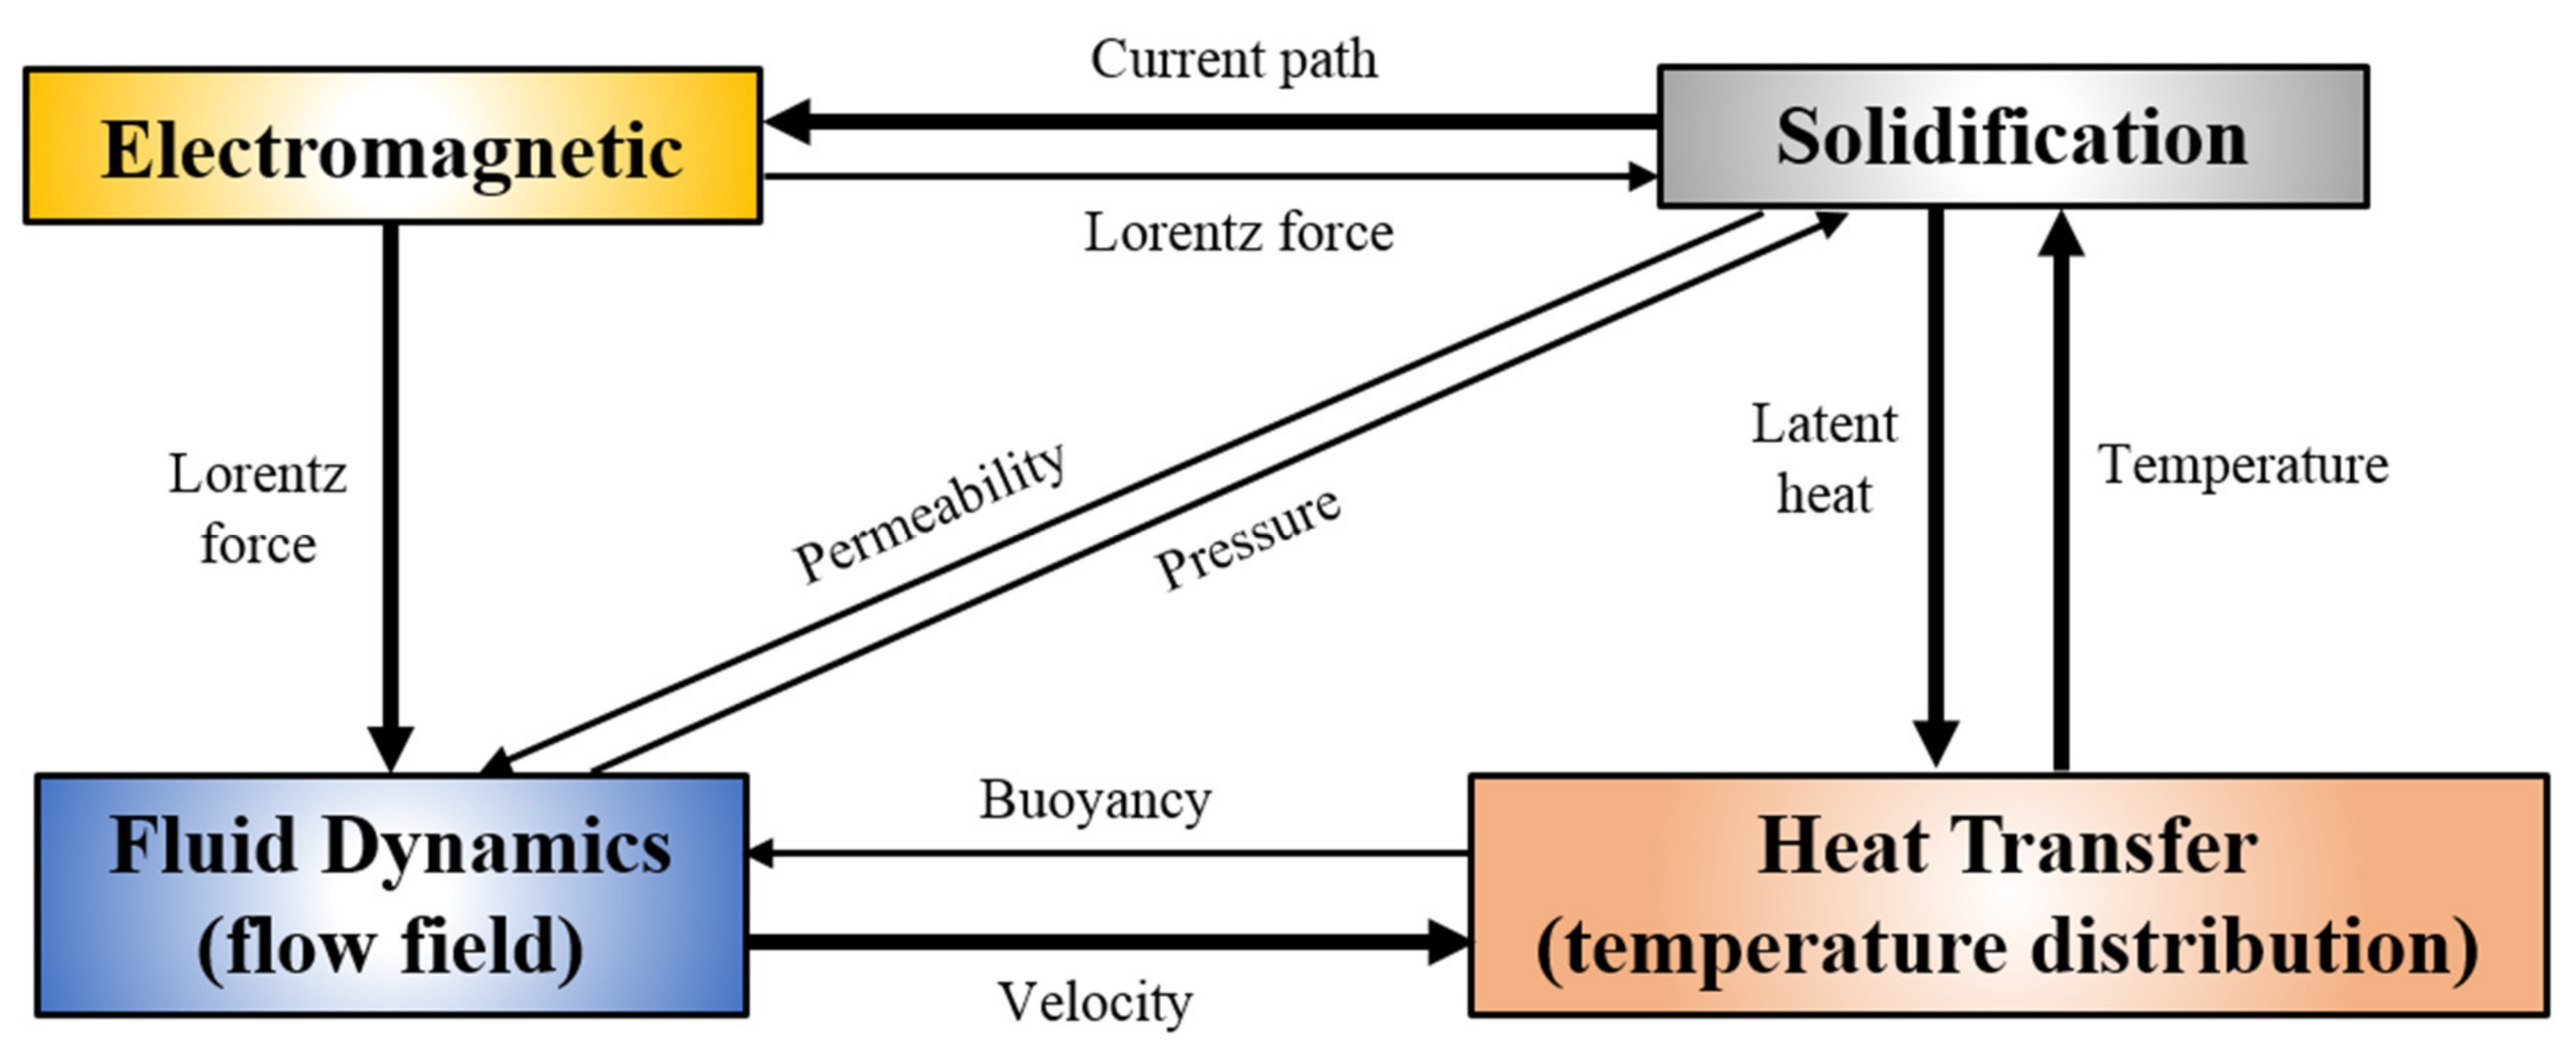
2.2. Coupling of Fluid Flow, Temperature, and Solute Distribution

The real-time distribution of flow field, temperature, and solute inside the ingot are obtained by coupling solutions of Navier–Stokes equations, energy conservation equations, and solute conservation equations. Combined with the above electromagnetic field distribution, the governing equation of the VAR process considering macroscopic solute transport can be expressed as follows [21,22,23,24]:
(1)
Continuity equation:
V = 0
(2)
Considering the viscous force, the thermosolutal buoyancy, and the Lorentz force in the mushy zone, the momentum conservation equation can be written as follows:
t ( ρ u ) + ( ρ V u ) = ( μ u ) p x μ K u + F x
t ( ρ v ) + ( ρ V v ) = ( μ v ) p y μ K v + F y
t ( ρ w ) + ( ρ V w ) = ( μ w ) p z μ K w + S g + F z
where, ρ is the density; u, v and w are the components of fluid velocity in x, y and z directions, respectively; Fx, Fy and Fz are the Lorentz forces in each direction; K is the permeability of the mushy zone, which is described by the Kozeny Carman equation, as shown in Equation (11). Sg is the thermosolutal buoyancy, which indicates the effect of density change caused by temperature and solute concentration on the fluid flow, as shown in Equation (12).
K = δ 2 180 f l 3 ( 1 f l ) 2
S g = ρ g [ β T ( T T ref ) + i β C i ( C l i C l , ref i ) ]
where, δ is the secondary dendrite arm spacing; βT and βC are the thermal and solutal expansion coefficients, respectively; T is temperature; C is solute concentration. The subscript l represents the liquid phase, ref is the reference value; the superscript i represents each component. The liquid fraction fl can be obtained from the following equation:
f l = 0 T T sol ( T T sol ) / ( T liq T sol ) T sol < T T liq 1 T > T liq
where Tsol and Tliq are the solidus and liquidus temperatures in the alloy solidification system, respectively.
(3)
Considering the effects of solute convection and heat conduction during solidification, the energy conservation equation is expressed as follows:
t ( ρ T ) + ( ρ V T ) = ( λ c p T ) + ρ L c p f s t + q Joule
where, λ is the thermal conductivity; cp is the specific heat capacity; L is the latent heat; fs is the solid fraction.
(4)
Ignoring the solute diffusion in the solid phase, the solute conservation equation during solidification can be described as:
t ( ρ C i ) + ( ρ V C i ) = ( ρ D C i ) + [ ρ D ( C l i C i ) ] [ ρ ( C l i C i ) V ]
where D is the solute diffusion coefficient in the liquid phase.
(5)
In order to close the governing equations of flow, heat transfer, and mass transfer and realize the coupling solution, the relationship between liquid fraction and solute concentration should also be given. The phase diagram method is used to update the solid fraction equation for the solidification process of multi-component alloy. The liquidus temperature in the alloy solidification system can be obtained by the following equation:
T liq = m liq ¯ C ¯ + T m
where Tm is the melting temperature of pure solvent. C ¯ and the average liquidus slope m liq ¯ is as follows:
C ¯ = i = 1 n C i
m liq ¯ = i = 1 n ( m liq i C i ) C ¯
In addition, the equilibrium distribution coefficient of the solute in the alloy solidification system is shown in Equation (19), from which the renewal equation of solid fraction in the system can be obtained, as shown in Equation (20):
k p ¯ = i = 1 n ( k p i m liq i C i ) i = 1 n ( m liq i C i )
f s = 1 1 k p ¯ T T liq T T m

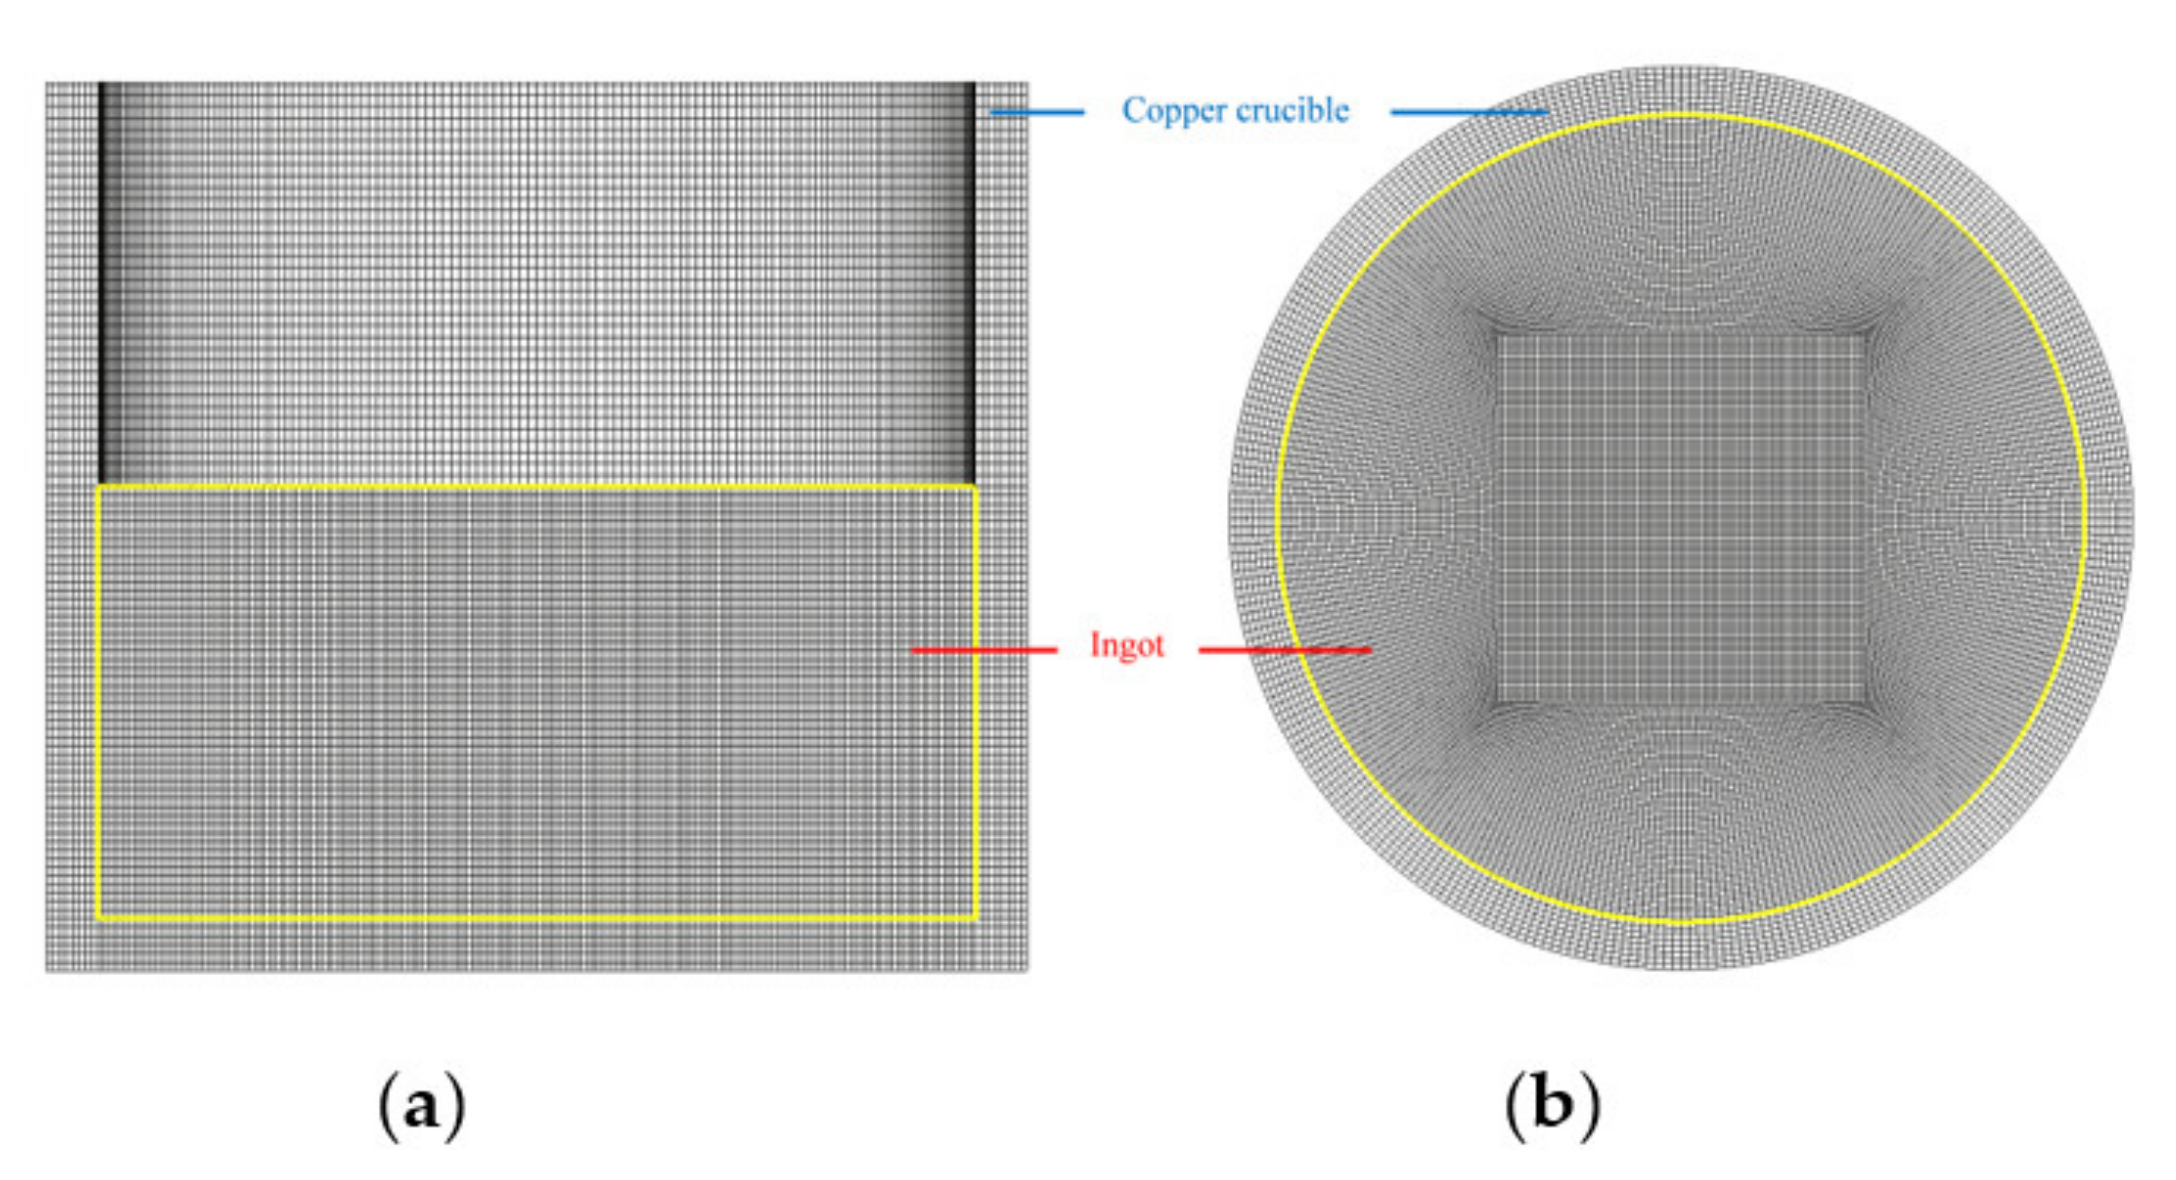
3. Simulation Conditions

In the actual VAR process, the height of the ingot in the crucible will continue to rise as a result of the continuous dropping of metal droplets formed by consumable electrode melting. In this paper, the continuous growth of the ingot is realized by using dynamic grid technology [25]. The initial height of the ingot is 0.25 m, and the final height is 0.5 m. Figure 3 is a schematic diagram of the grid used to simulate the VAR process. The outer and inner grids represent the copper crucible and the ingot, respectively. During the whole calculation process, the grids on both sides of the ingot-crucible interface always correspond to each other. The electrical potential φ and magnetic vector potential A are taken as UDS (user-defined scalar), and the governing equations are written by combining the UDS rules in Fluent software [26].
From relevant tests, a second-order discretization method for the convection terms is adopted to treat the fluid flow in this paper, which is reasonable without compromising the accuracy. The finite volume method (FVM) has been adopted for simultaneously solving the coupled macroscopic mass, momentum, energy, and species conservation equations during the VAR process. Based on the SIMPLEC algorithm, the commercial CFD software ANSYS FLUENT is employed to carry out simulations. The calculation in this paper is parallelized on Intel Xeon Gold 6240 CPU (36C/72T, 2.6 GHz). Moreover, the calculation time step is 0.01 s, and the total simulation time used in this study is 7950 s.

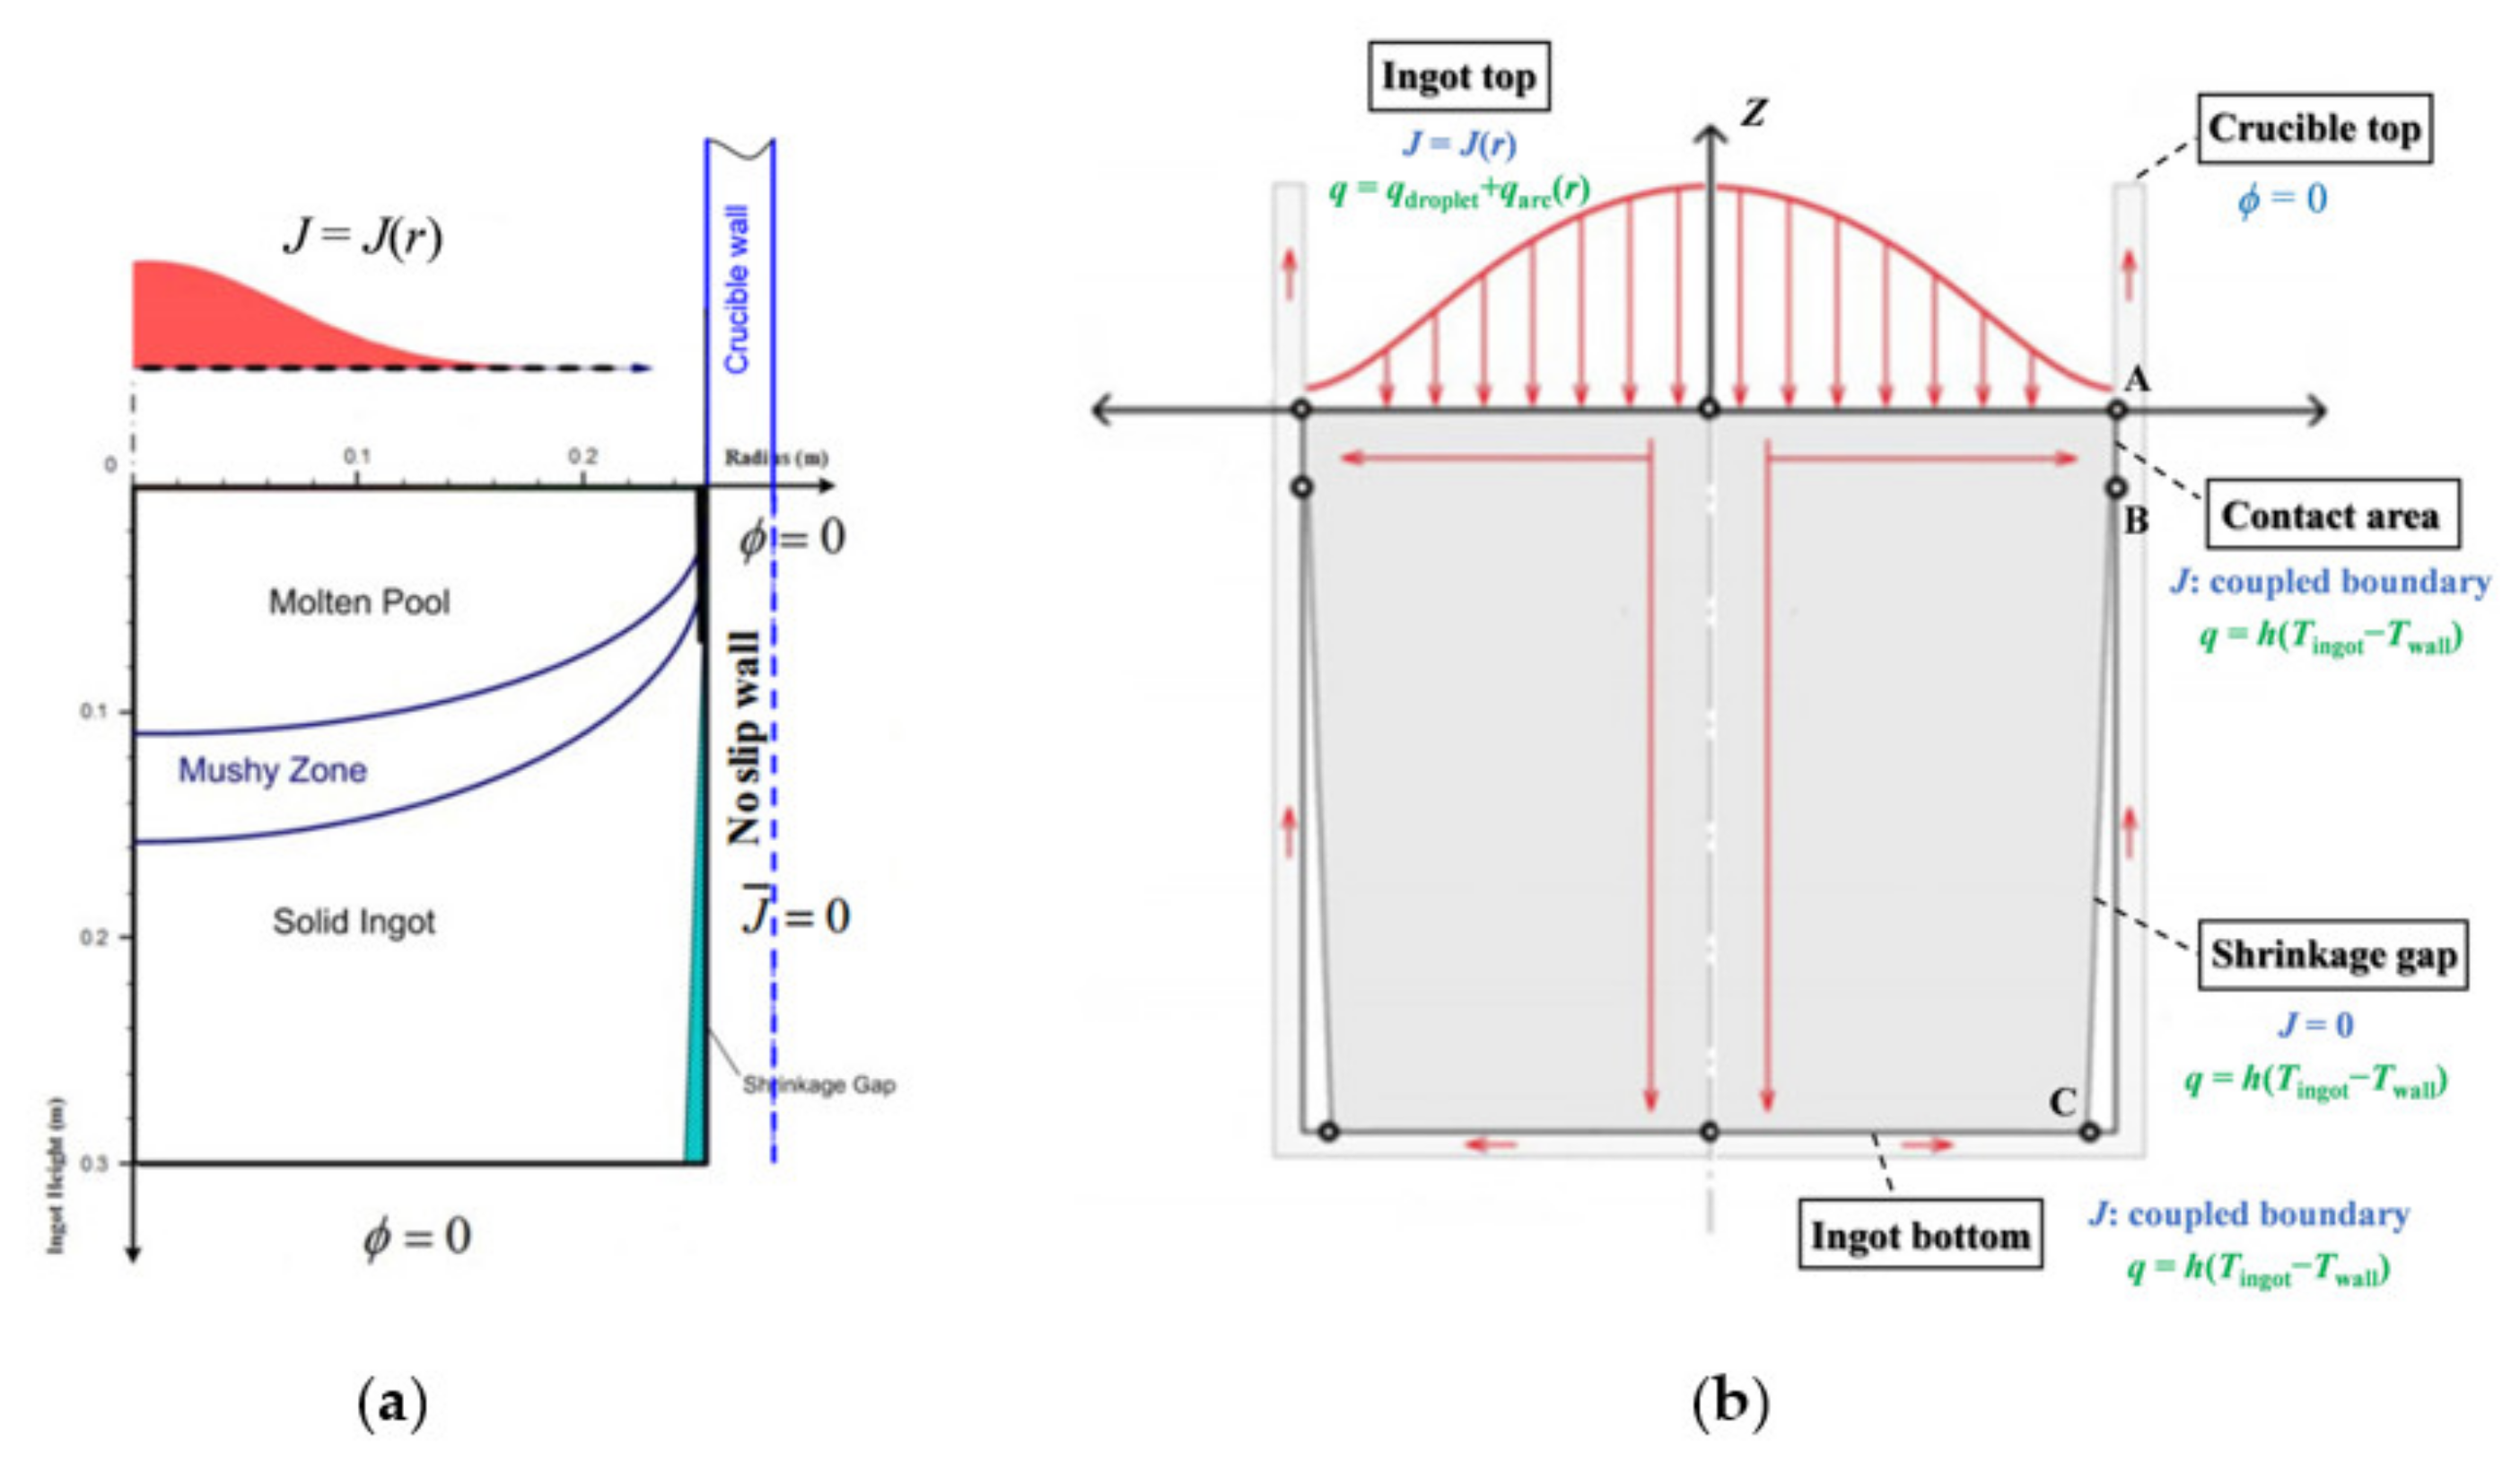
3.1. Boundary Conditions

(1)
Electromagnetic boundary condition
The simplified electromagnetic boundary conditions used in [15,27] for the partial study of the VAR process are shown in Figure 4a. The zero potential charging condition is given directly in the side contact area of the ingot and the crucible without considering the influence of the crucible. However, the current enters from the top of the crucible in the actual production, and the height of the crucible has a great influence on the electromagnetic field distribution inside the ingot, which is obviously not reflected in the simplified boundary conditions. In order to get a more realistic electromagnetic field distribution, the crucible part is included in the calculation domain, as shown in Figure 4b.
The side arc will be formed between the consumable electrode and the inner wall of the crucible. Only part of the current Iingot flows back to the electrode through the ingot, accounting for ηI of total current Itotal, as follows:
I ingot = I total η I
Due to solidification shrinkage, the side of the ingot gradually separates from the crucible wall during solidification, forming the electric contact area AB and electric separation area BC, as shown in Figure 4b. The length of AB is given as 0.05 m and remains constant, while the length of BC increased during ingot growth. The contact area and the bottom of the ingot are set as the electric coupling boundary, while the separation area is given zero current density. The electric potential at the crucible top is set to zero. In addition, the coupling boundary is given for the magnetic vector potential at the internal interface, and its flux at the external boundary is also set to zero.
It is assumed that the current density at the top of the ingot obeys the following Gaussian distribution:
J ( r ) = I ingot exp ( r 2 R a 2 ) 0 R i 2 π r exp ( r 2 R a 2 ) d r
where r is the distance between the top of the ingot and the center of the arc; Ri is the radius of the ingot; Ra is the effective radius of the arc.
(2)
Dynamic boundary condition
The interface between the ingot and the crucible adopts a non-slip boundary condition, and there is no solute exchange on both sides of the boundary. The drop of molten metal on the electrode is approximated by adding an equivalent mass to the melt surface at each time step without introducing any momentum [15].
(3)
Thermal boundary condition
There are two sources of heat entering from the top of the ingot. One is the qdroplet from the droplet of the consumable electrode, which is evenly added to the melt surface in each time step. It is composed of the sensible heat absorbed by heating to the drop temperature and the latent heat of phase change. The other is the qarc radiated from the arc to the molten pool, which is applied to the melt surface in the form of Gaussian distribution. The effective power in the system can be described as:
η p U I total = q droplet + q arc
where η p is the effective power factor; U is the applied voltage. In the shrinkage zone, the ingot can only dissipate heat through the heat radiation from the crucible wall, so the cooling effect is worse than that in the contact zone. If the temperature of the ingot side is lower than the critical temperature (30 K lower than the solidus temperature), the shrinkage zone is considered to have formed [4]. The heat flux at the interface between the ingot and the crucible can be expressed as:
q = e l σ s T ingot 3 ( T ingot T wall ) ,   shrinkage   zone h ( T ) ( T ingot T wall ) ,   contact   zone
where Tingot and Twall are the surface temperatures of the ingot and the crucible, respectively; the emissivity e1 of the ingot side is 0.9; The Stefan–Boltzmann constant is 5.67 × 10⁻⁸; h(T) is the equivalent convective heat transfer coefficient, as shown in Table 1 below.

3.2. Physical and Process Parameters

The main process parameters of VAR are shown in Table 1 [27]. Ni-5.8 wt% Al-15.2 wt% Ta ternary alloy is a commonly used case of superalloy calculation, and its thermophysical properties are shown in Table 2 [28,29,30]. Considering the change in thermal conductivity of the alloy with temperature, the corresponding data is calculated by the thermodynamic software.

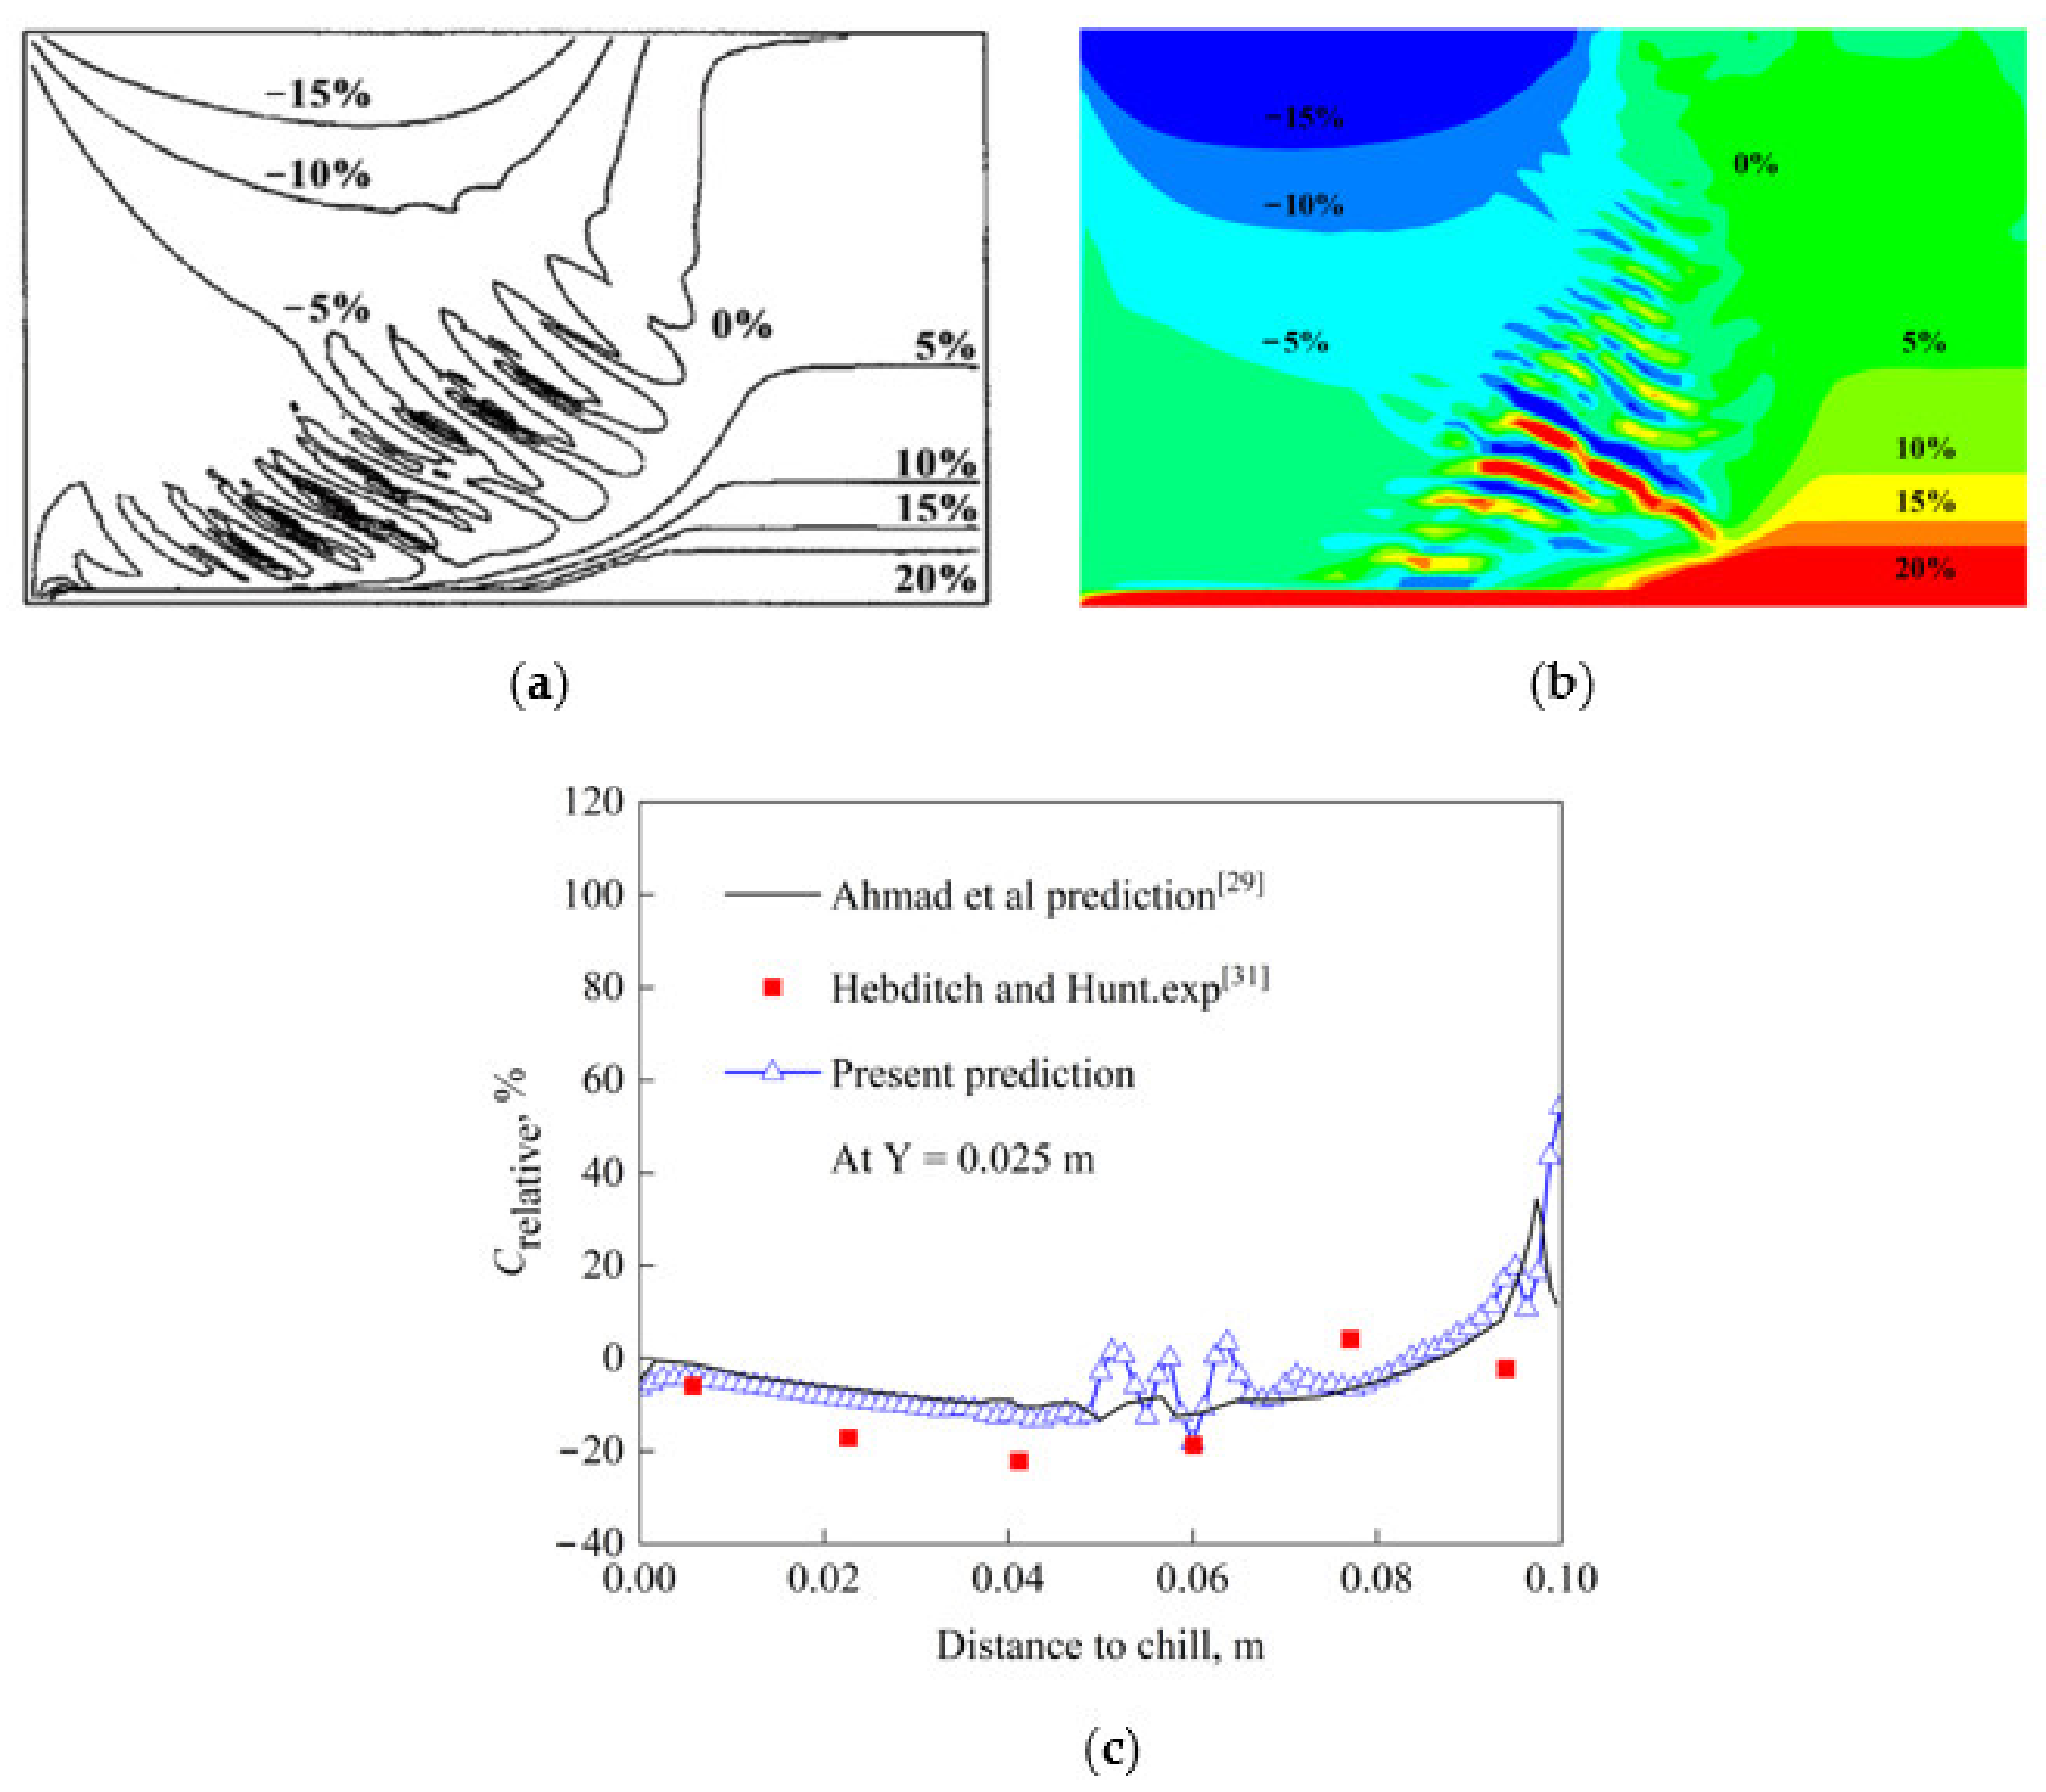
3.3. Model Validation

At present, there are few studies on the multi-field coupling of flow field, electromagnetic field, temperature, and solute distribution in the VAR process. Researchers [3] studied the fluid flow of molten pools, but have not considered the influence of macroscopic solute transport, thus this literature is used to verify the model of electromagnetic fields. In previous studies [31,32], the coupling solution of flow field, temperature, and solute distribution in the solidification process of Sn-5 wt% Pb alloy was carried out, but the effect of the electromagnetic field was not considered. Therefore, the model of flow field, temperature, and solute distribution is verified with this literature. The electromagnetic field model in this paper is used to simulate the variation of current density distribution with arc radius in the system when the proportion of side arc current in the literature [3] is 50%, and other parameter settings are consistent with those found in the literature. The verification result is shown in Figure 5, it can be observed that under different arc radiuses, the current density distribution calculated by the electromagnetic field model in this paper is in good agreement with those in the literature, thus verifying its reliability.
Moreover, the relative segregation ratio (Crelative) is defined to evaluate the local segregation degree inside the ingot. The simulation results of the segregation degree inside the ingot are compared with those given in references [31,32,33], as shown in Figure 6. As the equilibrium distribution coefficient of the solute Pb is less than one, it will precipitate into the liquid phase continuously during solidification, resulting in the increase in liquid phase density at the interface front and the downward flow induced by solute buoyancy. The thermal buoyancy caused by temperature gradient will also cause downward flow. The fluid in the square cavity will move downward under the action of the double diffusion convection of thermal solute, resulting in the enrichment of the solute at the bottom and the scarcity of the solute at the top. The distribution of relative segregation in Figure 6b confirms the above analysis and is basically consistent with that in the literature. After solidification, the horizontal straight line at the height of 0.025 m from the bottom of the square cavity is intercepted, and the relative segregation on the straight line simulated in this paper is compared with the simulation and experimental data found in the literature, as shown in Figure 6c. It can be demonstrated that there is a serious positive segregation in the middle and back section along the solidification direction in the lower part of the square cavity, and the solute is seriously enriched at the end of solidification. The calculated results are basically consistent with the predicted results in the literature [31], and the variation trend is the same as the experimental data of Hebditch et al. [33]. In conclusion, the prediction model of segregation defects during the VAR process developed in this paper is reliable.
C relative = C C 0 C 0 × 100 %

4. Results and Discussion

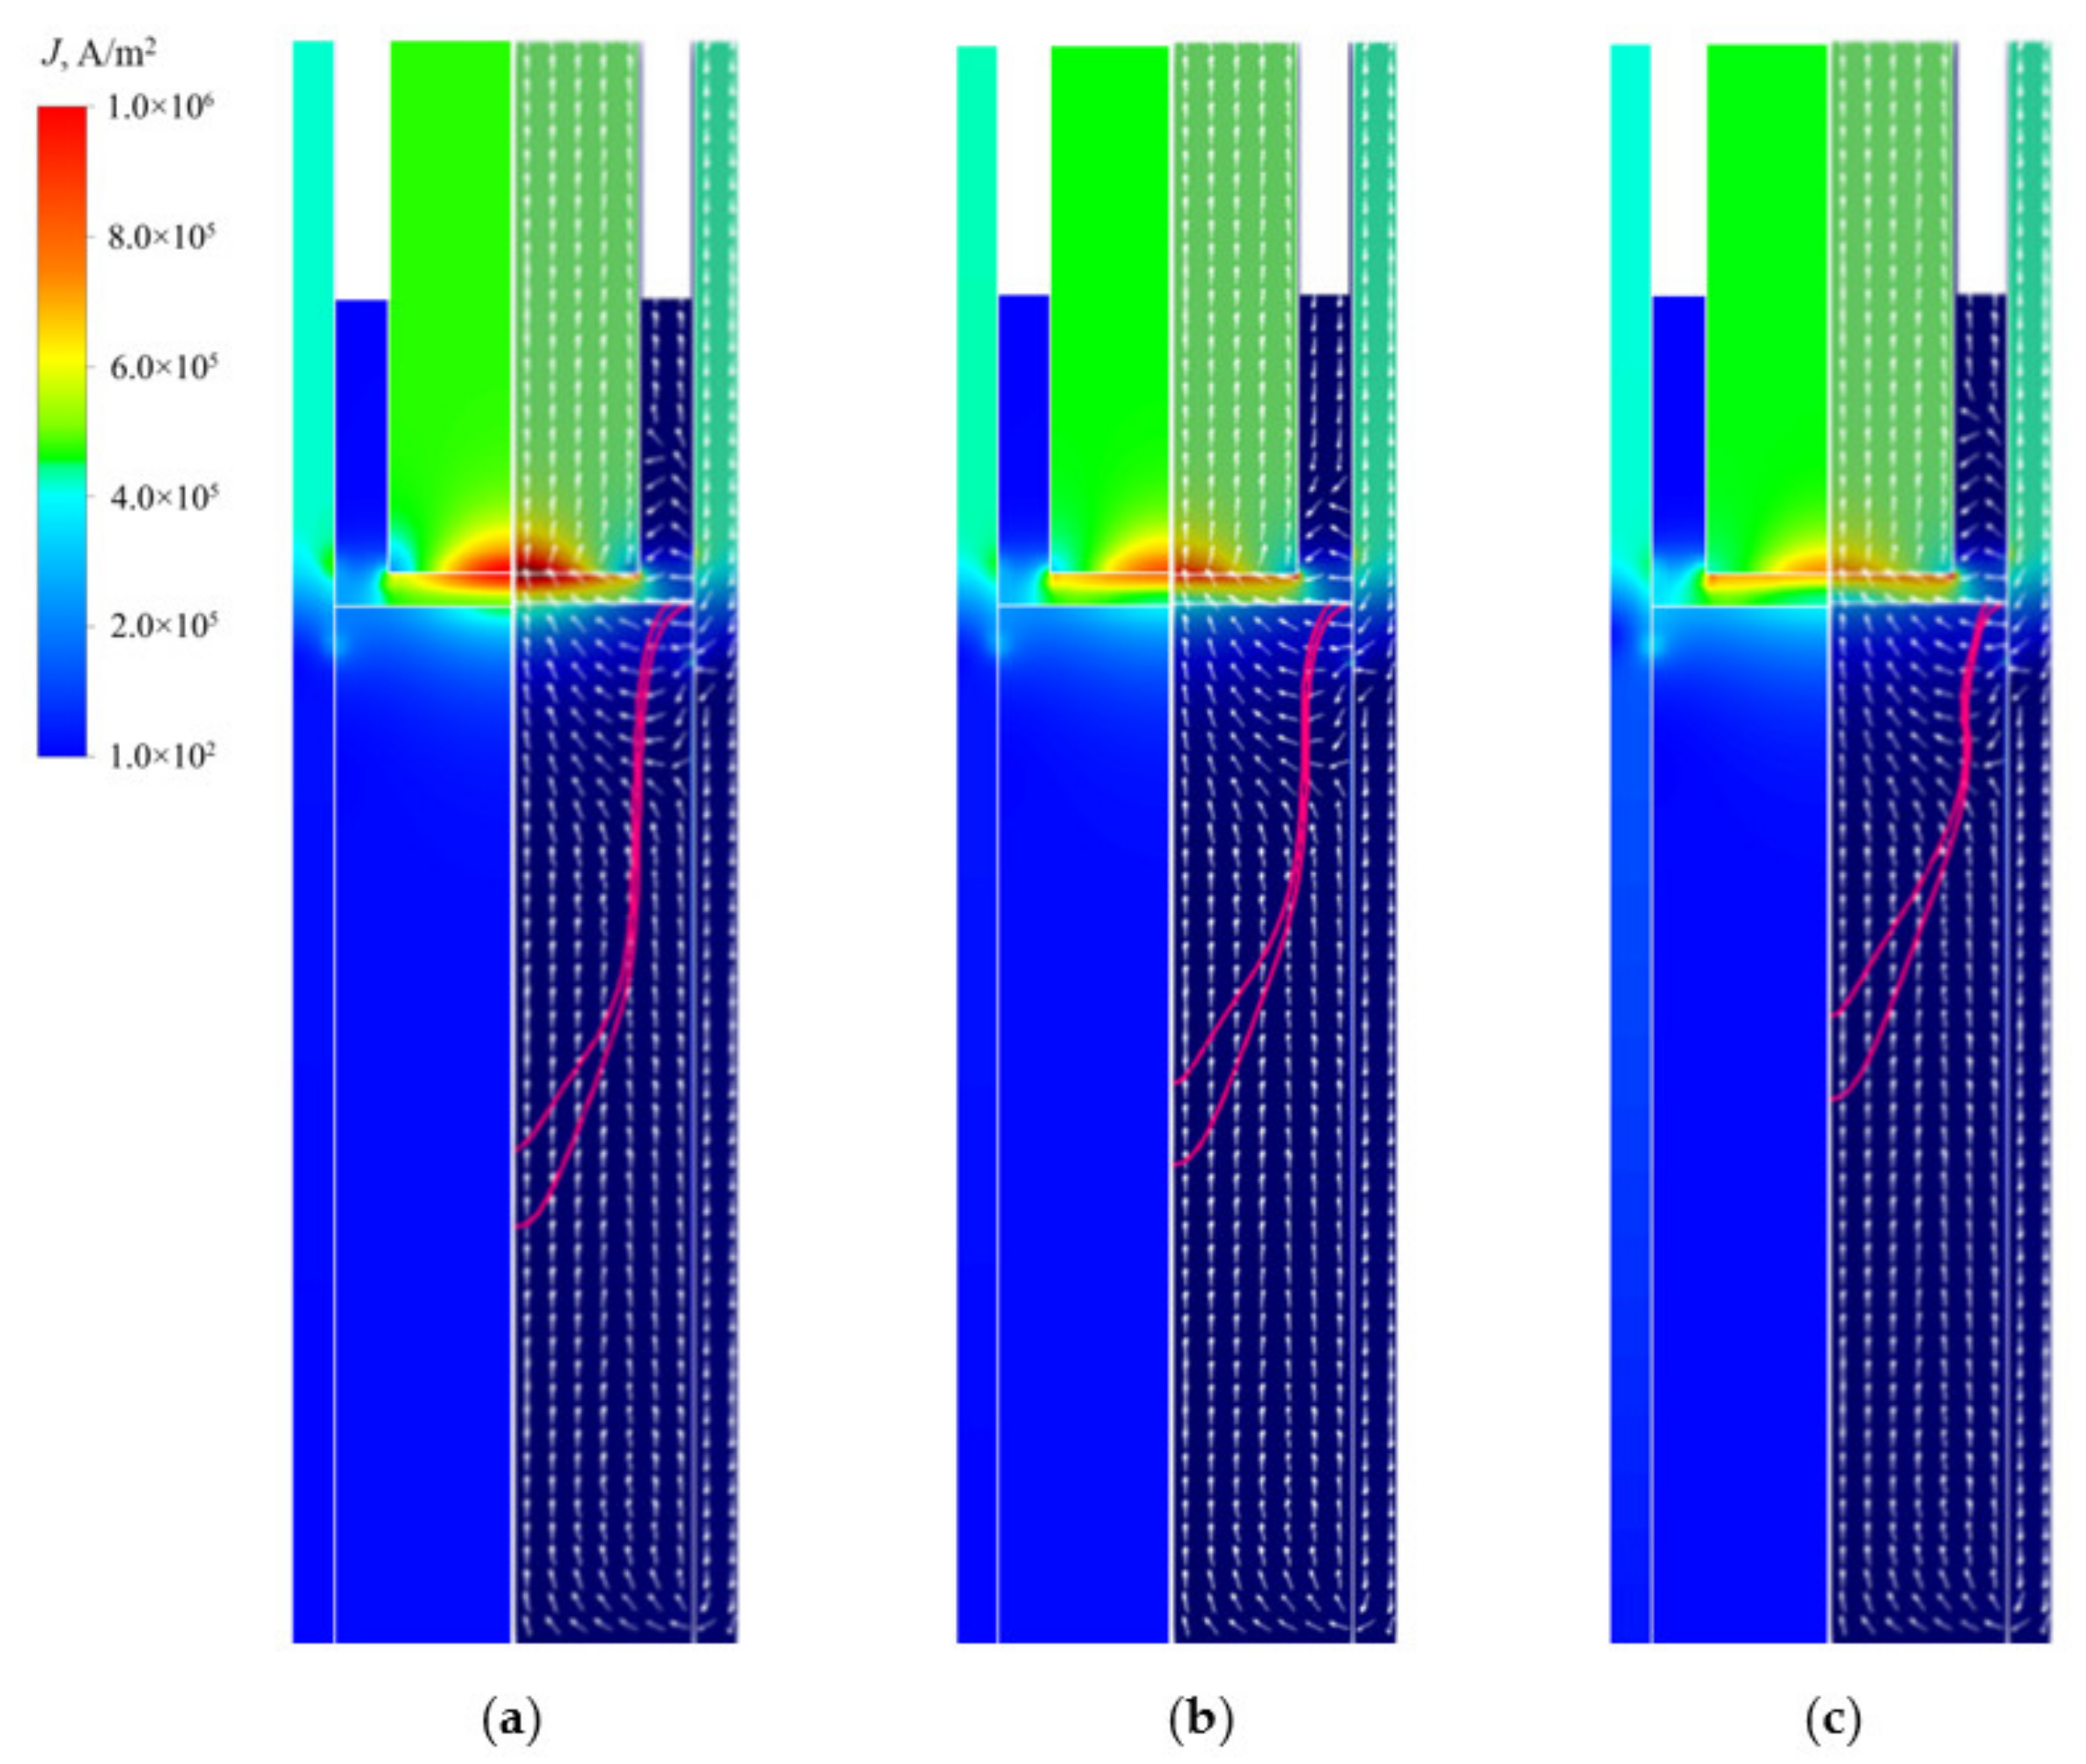
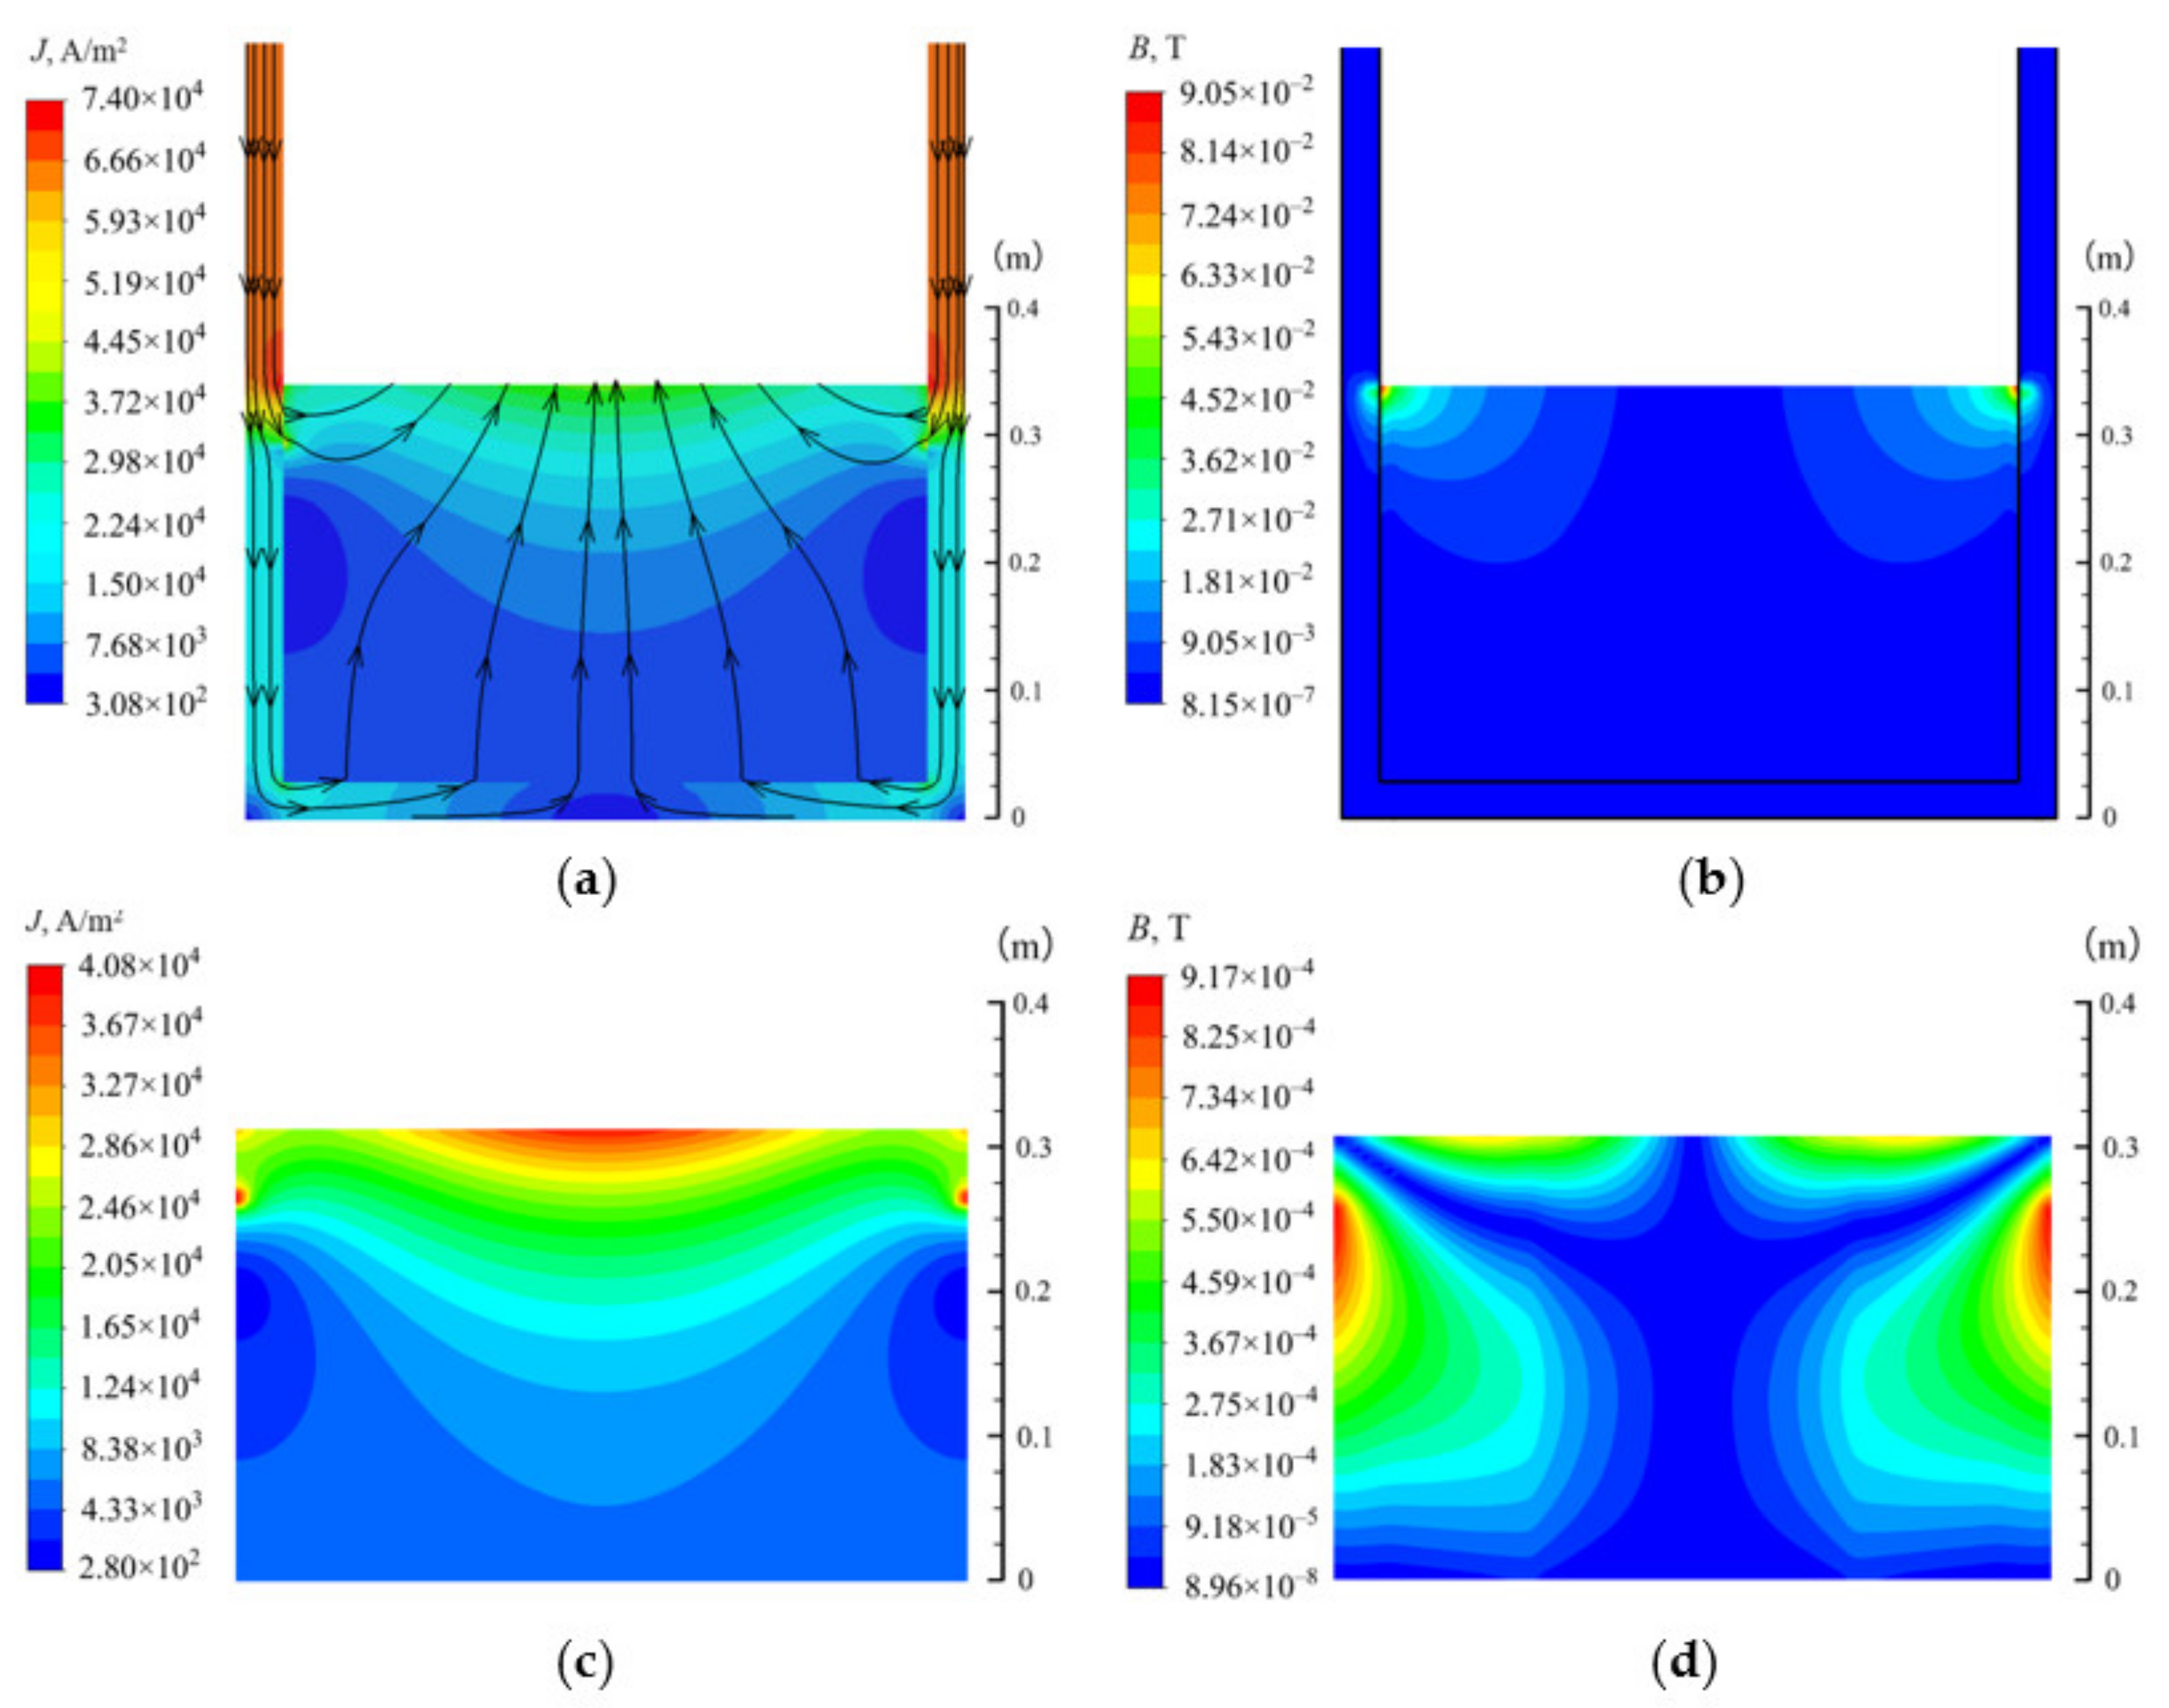
4.1. Electromagnetic Fields

In order to explore the influence of different boundary conditions on the electromagnetic field distribution inside the ingot, the electromagnetic field results on the cross-section X = 0 at t = 1500 s are calculated by using the actual boundary and simplified boundary presented in the upper and lower part of Figure 7, respectively. Comparing Figure 7a,c, it can be found that the current density distribution trend is almost the same under both boundaries, and the value difference is not large inside the ingot. However, the distribution and values of magnetic induction intensity are greatly different under both boundaries when comparing Figure 7b,d. The maximum magnetic induction intensity calculated by the simplified boundary is only 9.17 × 10⁻⁴ T, while the maximum magnetic induction intensity calculated by the actual boundary is 9.05 × 10⁻² T. This is mainly because in the electromagnetic field calculation without considering the crucible, the magnetic vector potential flux on the external boundary, such as the side and bottom surface of the ingot, is given as zero. However, when considering the actual crucible boundary, the bottom and side of the ingot are given the coupling boundary for magnetic vector potential, which is obviously more consistent with the actual production. In conclusion, the difference of boundary conditions mainly affects the distribution of magnetic induction intensity, and then changes the distribution of the Lorentz force, and will finally affect the predicted flow pattern in the molten pool and segregation behavior of the ingot.
There is a minimum current density near the separation area between the side of the ingot and the crucible. This is mainly because the separation area is not electrified. Most of the current enters the ingot through the upper contact area, and a few flows through the bottom of the crucible and then returns to the ingot. Both paths rarely pass near the separation area, as shown in Figure 7a. It can be seen from Figure 7b that the magnetic induction intensity of the middle and lower part of the ingot is smaller than that of the upper part. This is mainly because there is relatively less power in the bottom of the ingot, and the current tends to return to the consumable electrode along a shorter path. It can be seen from Figure 8 that the Lorentz force is mainly concentrated on the upper side of the ingot, and the direction is a combination of horizontal outward and vertical downward. However, the value of the Lorentz force in the ingot is small, and the direction is the combination of horizontal to the center and vertical downward. In this paper, the conductivity of the ingot is taken as a constant value, so the current density distribution can reflect the Joule heat distribution.

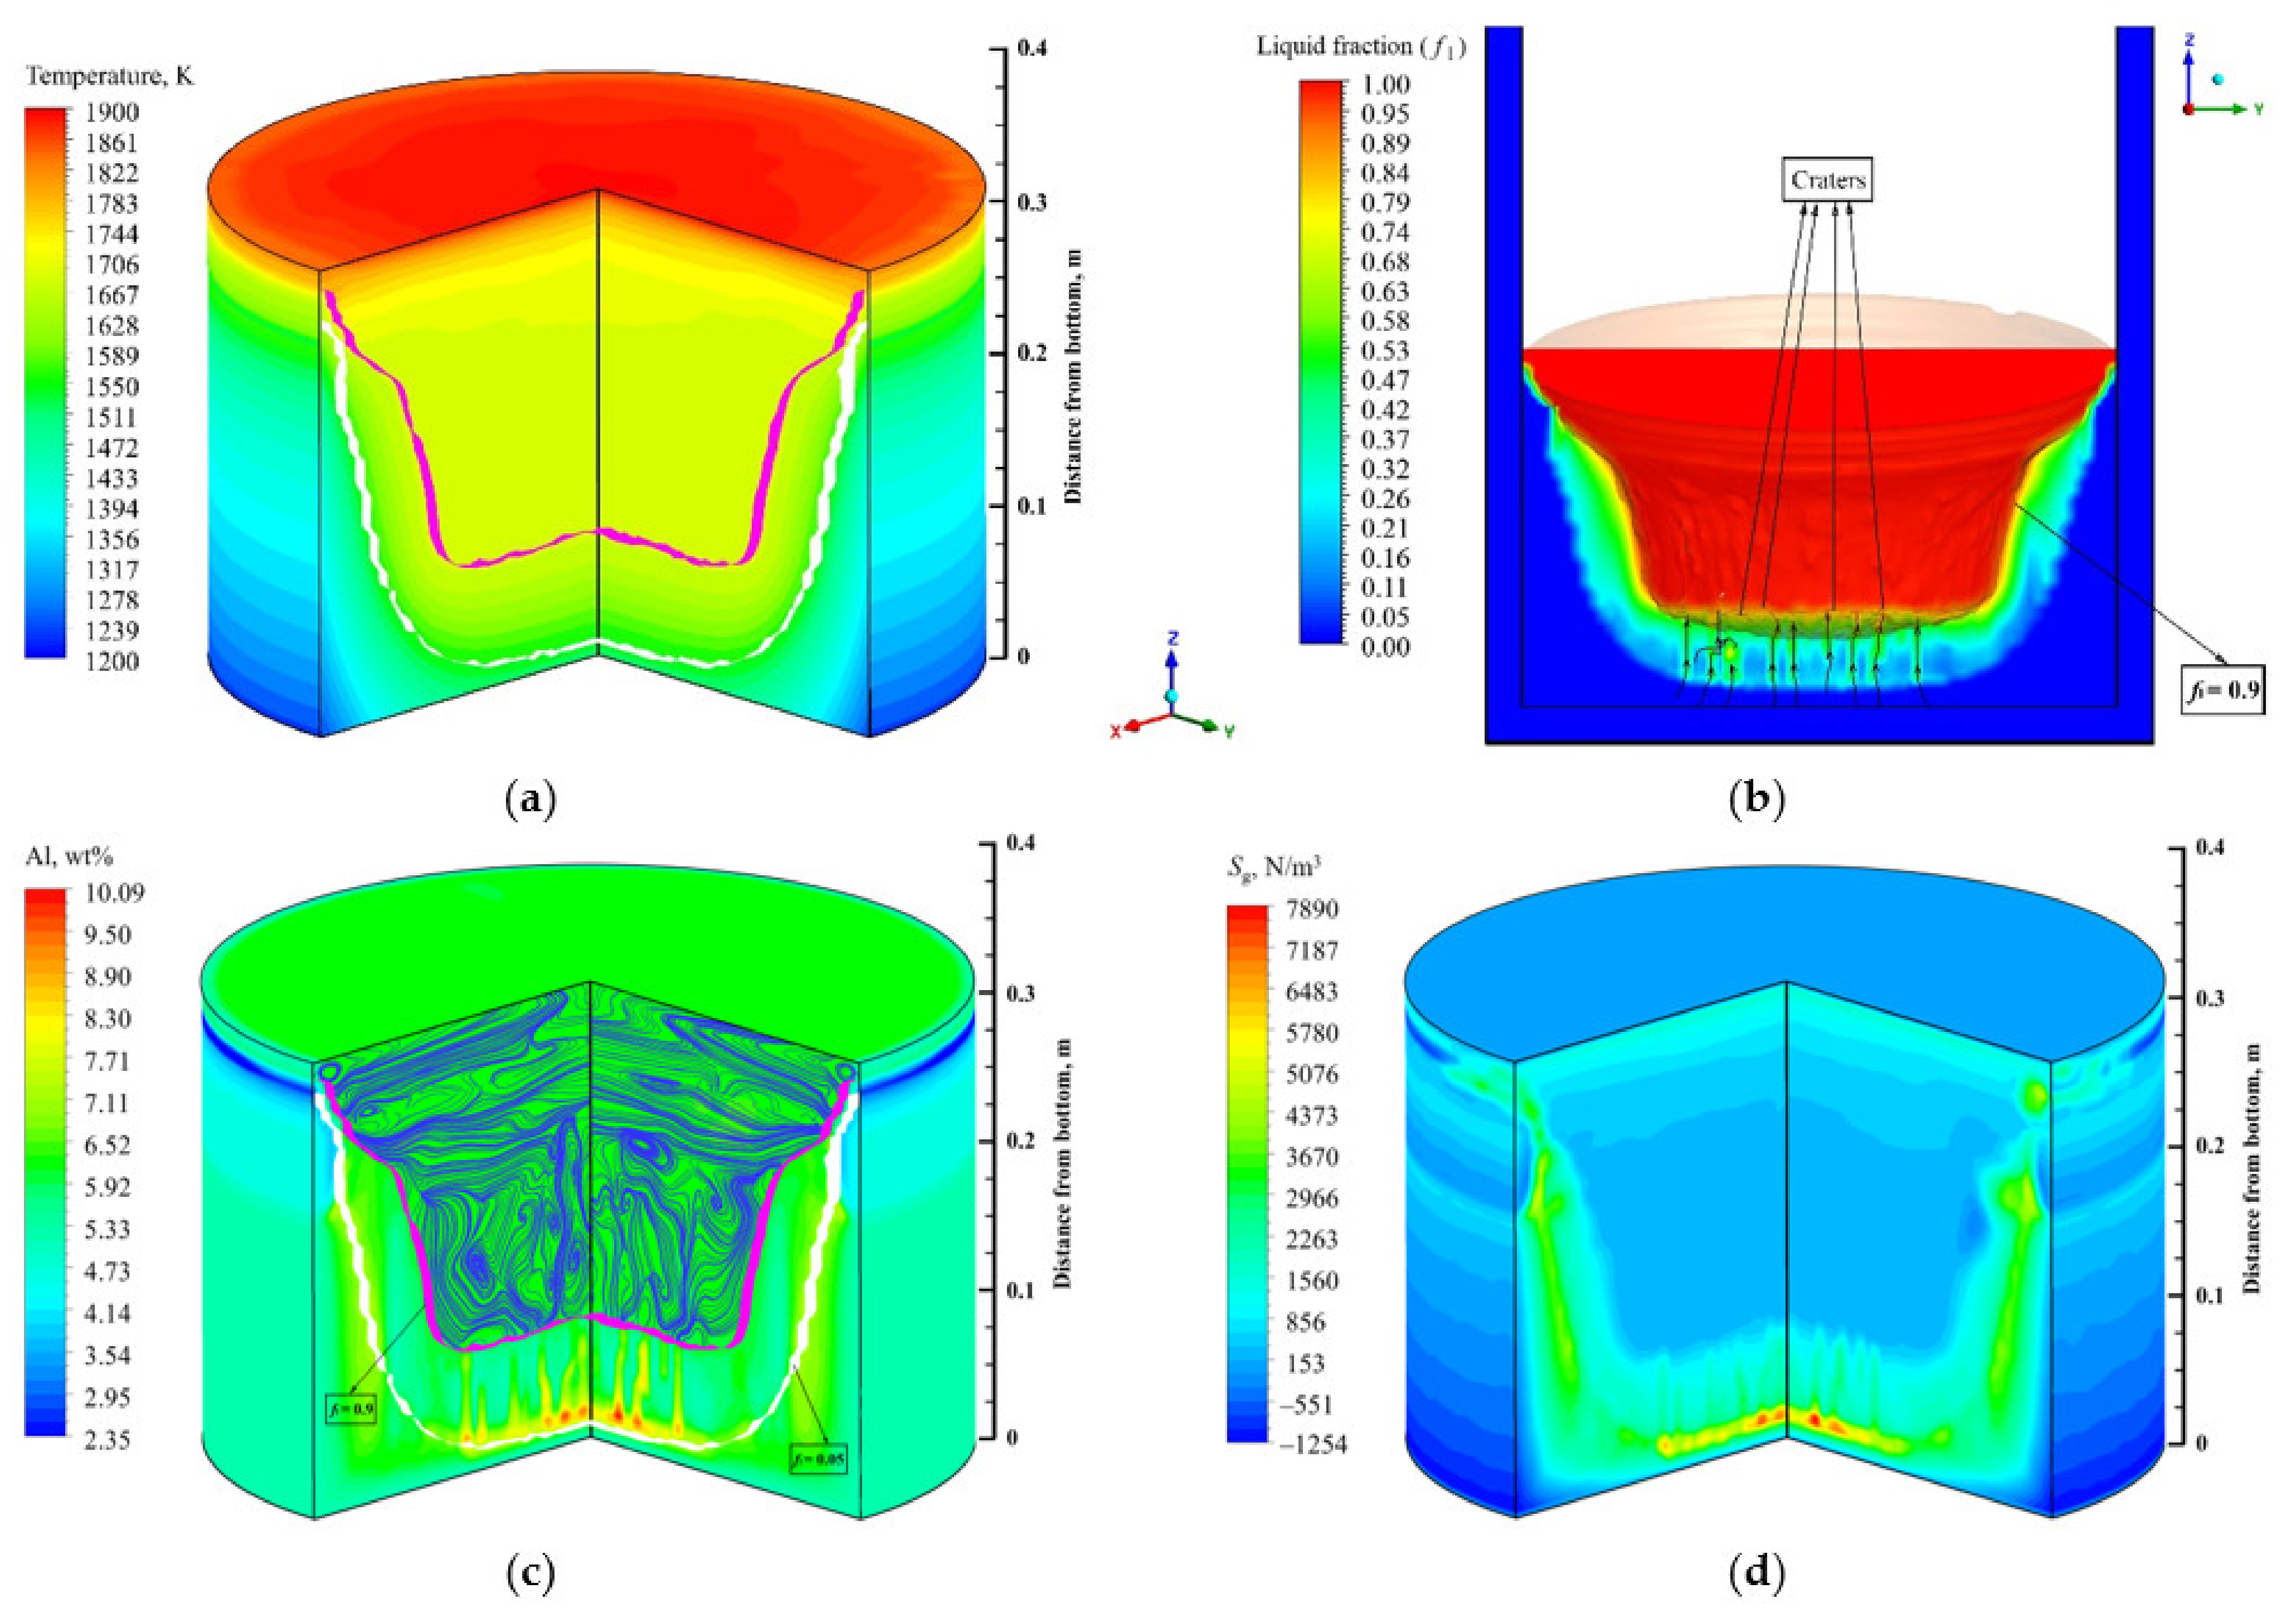
4.2. Flow field, Temperature, and Solute Distribution

In order to fully display the solute segregation and freckle formation process inside the ingot during the VAR process, three moments in the solidification process are selected for the study. Since the equilibrium distribution coefficients of Al and Ta are both less than one, the concentration distribution trends of the two solutes are similar, so only the distribution of the Al solute is shown. As can be seen from the temperature distribution in Figure 9a, the isotherm near the top of the ingot is relatively flat. This is because the temperature distribution in this region is dominated by the heat entering from the top which is mainly brought into the molten pool evenly by the droplets. Figure 9b shows the liquid fraction and the flow pattern in the channel at cross section X = 0 when the solidification time is 1500 s. The liquid fraction isosurface at the positions where the segregation channels are formed shows obvious fluctuation in the shape of a crater, and the upward jet is formed at these positions. During the upward growth of the channel, the fluid continuously flows and aggregates to the channel in the paste area, resulting in the enrichment of the solute in the channel and a scarcity in the surrounding area. The density inversion caused by temperature and solute concentration gradient inside the ingot induces the stable upward jet flow inside the channel, which is the fundamental reason for the channels to appear and grow continuously.
Figure 9c shows the distribution of the solute and flow field inside the ingot at a solidification time of 1500 s. The solute enrichment channel at the cross section of X = 0 and Y = 0 has begun to take shape, and the solute around the channel presents negative segregation. This is because the two solutes are precipitated out of the solid phase into the mushy zone, which causes the density inversion between the top and the bottom in the mushy zone, thus making the liquid in unstable. The two isosurfaces (fl = 0.05 and fl = 0.9) of liquid fraction approximately represent the solidus and liquidus, respectively. It can be observed that the molten pool is very deep at this time, which is due to the small heat dissipation at the bottom of the ingot, leading to the slow upward advance of the solidification front. Figure 9d shows the distribution of thermosolutal buoyancy in the ingot. It is found that the position with high thermosolutal buoyancy corresponds to the position where the solute enrichment channel is formed in Figure 9c, which also indicates that the thermosolutal buoyancy is the main driving force for the generation and development of channel segregation. In combination with Figure 8, it can be seen that the Lorentz force has less influence on the flow field inside the ingot than the thermosolutal buoyancy, and the complex flow form of multiple vortices in the liquid phase area is mainly affected by the latter. It is noteworthy that there are no clockwise or counterclockwise vortices as mentioned in the literature [18]. This is mainly because the irregular enrichment of channel solute makes the thermosolutal buoyancy present a complex distribution as shown in Figure 9d.
Figure 10 shows the flow field, temperature, and solute distribution inside the ingot after solidification for 3500 s. It can be seen from Figure 10a that the channels far away from the center of the ingot are more likely to maintain vertical growth, and the channels’ growth near the central region gradually stops with the growth of the ingot or when new solute enrichment channels appear. This is mainly because the flow resistance in the central area is too large to maintain the upward jet flow. The flow resistance is small far from the center, and the formation of channels increases the local permeability in the paste area, which further reduces the flow resistance. The solutes move upward with the flow column, and the local solute concentration increases. The higher the solute concentration in the ascending liquid column, the smaller the liquid density. That is to say, the liquid with solute rich is easier to move upward into the liquid region, and the channel is more likely to maintain vertical growth. In addition, a solute enrichment zone is formed in the center of the mushy zone, that is, macrosegregation begins to appear. Compared with Figure 9a, it can be observed that the flow intensity in the liquid region increases significantly, and the flow vortex caused by the Lorentz force near the side contact area is more intense, which also causes the isotherm in this region to show an obvious downward curve, as shown in Figure 10b.
After the ingot grows to a height of 0.5 m, the consumable electrode is considered to have melted. At this time, there is no heat input except from the heat dissipation by radiation outward at the top of the molten pool, therefore, the top of the ingot begins to solidify until the solidification is complete. Figure 11a shows the solute distribution inside the ingot after solidification (approximately 7950 s). It can be found that the channel solute enrichment is mainly concentrated in the lower part of the ingot (Region 1). With the growth of the ingot, the solute enrichment channels gradually develop into the solute enrichment regions, and the channel segregation evolves into macrosegregation (Region 2). Region 3 contains the downward solidification process caused by the outward radiation from the top of the ingot. It can be found that the solutes in the middle and upper parts of the ingot (Region 2 and 3) are mainly concentrated in the macrosegregation region of the center, and the sides show negative segregation. The closer to the outside side, the greater the downward component of Lorentz force, as shown in Figure 8. Therefore, it is more difficult for the thermosolutal buoyancy to cause an upward jet in this region, thus it is more difficult to form solute enrichment channels. A significant portion of solute in this region will go to other channels with the fluid flow. This is also the reason for the negative segregation of solutes near the side of the ingot. In the case of simultaneous heat dissipation at the bottom, side and top of the ingot, the temperature distribution shown in Figure 11b is formed inside the ingot.
In order to show the segregation behavior of the ingot more intuitively, the solute distribution on four sections Z = 0.1 m, 0.25 m, 0.35 m, and 0.45 m after solidification are selected for comparison, as shown in Figure 12. It can be seen from Figure 12a that at the section Z = 0.1 m, the solutes are concentrated in a freckled pattern, and there are several solute enrichment channels inside the ingot. When the ingot grows to the height of Z = 0.25 m, the number of freckles decreases significantly, and the solute rich regions appear in the center of the cross section, as shown in Figure 12b. This is because in this process, some adjacent channels in the center of the ingot merge and eventually form the macrosegregation region of the solute. In addition, the macrosegregation region on the section Z = 0.35 m in Figure 12c is obviously increased compared with the lower part, and the part with the most abundant solute tends to diffuse to the edge of the ingot. This is mainly due to the fact that before the consumable electrode is completely melted, the depth of the molten pool gradually decreases with the increase in ingot height, and the convection in the upper part of the molten pool is dominated by the transverse flow caused by the combined action of thermosolutal buoyancy and Lorentz force, as shown in Figure 9a and Figure 10a. Induced by the outward transverse flow, the enriched solute in the central region may deviate from its vertical development trend and gradually diffuse to the edge of the ingot. After the melting of the electrode, the top of the molten pool begins to radiate outward for heat dissipation. The region (Region 3) affected by this will not continue the trend of outward diffusion of the enriched solute, but will continuously accumulate solutes in the molten pool during the downward solidification process. The section at Z = 0.45m is located in this region, and thus solute distribution as shown in Figure 12d will appear.
The volume average segregation extent of the solute is defined to measure the overall segregation degree of the solute, as follows:
S vol = ( C C 0 ) 2 d V d V × 100 % C 0
where Svol is the volume average segregation extent of the solute; C0 is the initial mass fraction of the solute; C is the mass fraction of the solute on the centroid of each grid; dV is the volume size of a single grid. Figure 13 shows the variation curve of the average volume deviation degree during solidification. During the melting period of the consumable electrode, that is, the continuous growth period of the ingot, the average volume deviation degree increases gradually. When the electrode is completely melted, the top of the molten pool begins to solidify, and the average volume deviation decreases slowly.
Figure 14 shows the degree of solute segregation inside the ingot along the center line and the median radius line (X = 0, Y = −0.127 m) after solidification. It can be observed that the relative degree of solute segregation on the two lines increases gradually on the whole, corresponding to Regions 1 and 2 in Figure 11a. After entering Region 3, the relative segregation degree decreases obviously. In addition, the solute enrichment degree along the centerline is generally higher than that along the median radius line, which is an inevitable result of the U-shaped molten pool [34]. The positions along the two lines that are inconsistent with the overall trend of change may be affected by the channels. If the solute enrichment channels are formed at the corresponding positions on the lines, it is bound to lead to a larger local solute concentration. On the contrary, if solute enrichment channels are formed near the two lines, the solute concentration at the corresponding position on the line will decrease, and the degree of segregation will decrease accordingly.
In order to show the degree of solute segregation more directly, the volume sizes in various relative segregation degree ranges in the ingot after solidification are shown in Figure 15. It can be found that the numerical span of positive segregation range is larger than that of negative segregation, and the degree of negative segregation is more concentrated. The maximum degree of relative segregation inside the ingot is 290%, the minimum is −90%, and about 79% of the total volume is positive segregation. In the range of negative segregation (Crelative < 0), when the relative segregation value decreases, that is, the negative segregation becomes serious, the volume of the corresponding range also decreases. However, in the range of positive segregation (Crelative > 0), the volume of each segregation range has two maximum values located in the range of 0~20% and 100~120%. This is because the negative segregation distribution of the solute is relatively simple and is mainly concentrated on the side of the ingot. As discussed above, the volume distribution within the range of segregation degree conforms to the conventional monotonous variation trend. The positive segregation part includes the channel segregation region in the lower part of the ingot and the two macrosegregation regions in the middle and upper part of the ingot. The distribution form is more complex, rather than simple solute accumulation in the solidification direction.

5. Conclusions

The segregation defects inside the ingot during VAR process seriously affect their performance, but there are few studies on the comprehensive prediction of freckles and macrosegregation defects. In this paper, a three-dimensional full-scale model during the VAR process is developed, which includes the water-cooled copper crucible as the computational domain to predict the segregation behavior inside the ingot. The multi-field distribution during the VAR process of the Ni-5.8 wt% Al-15.2 wt% Ta alloy ingot is simulated, and the segregation evolution inside the ingot is obtained. The main conclusions are as follows:
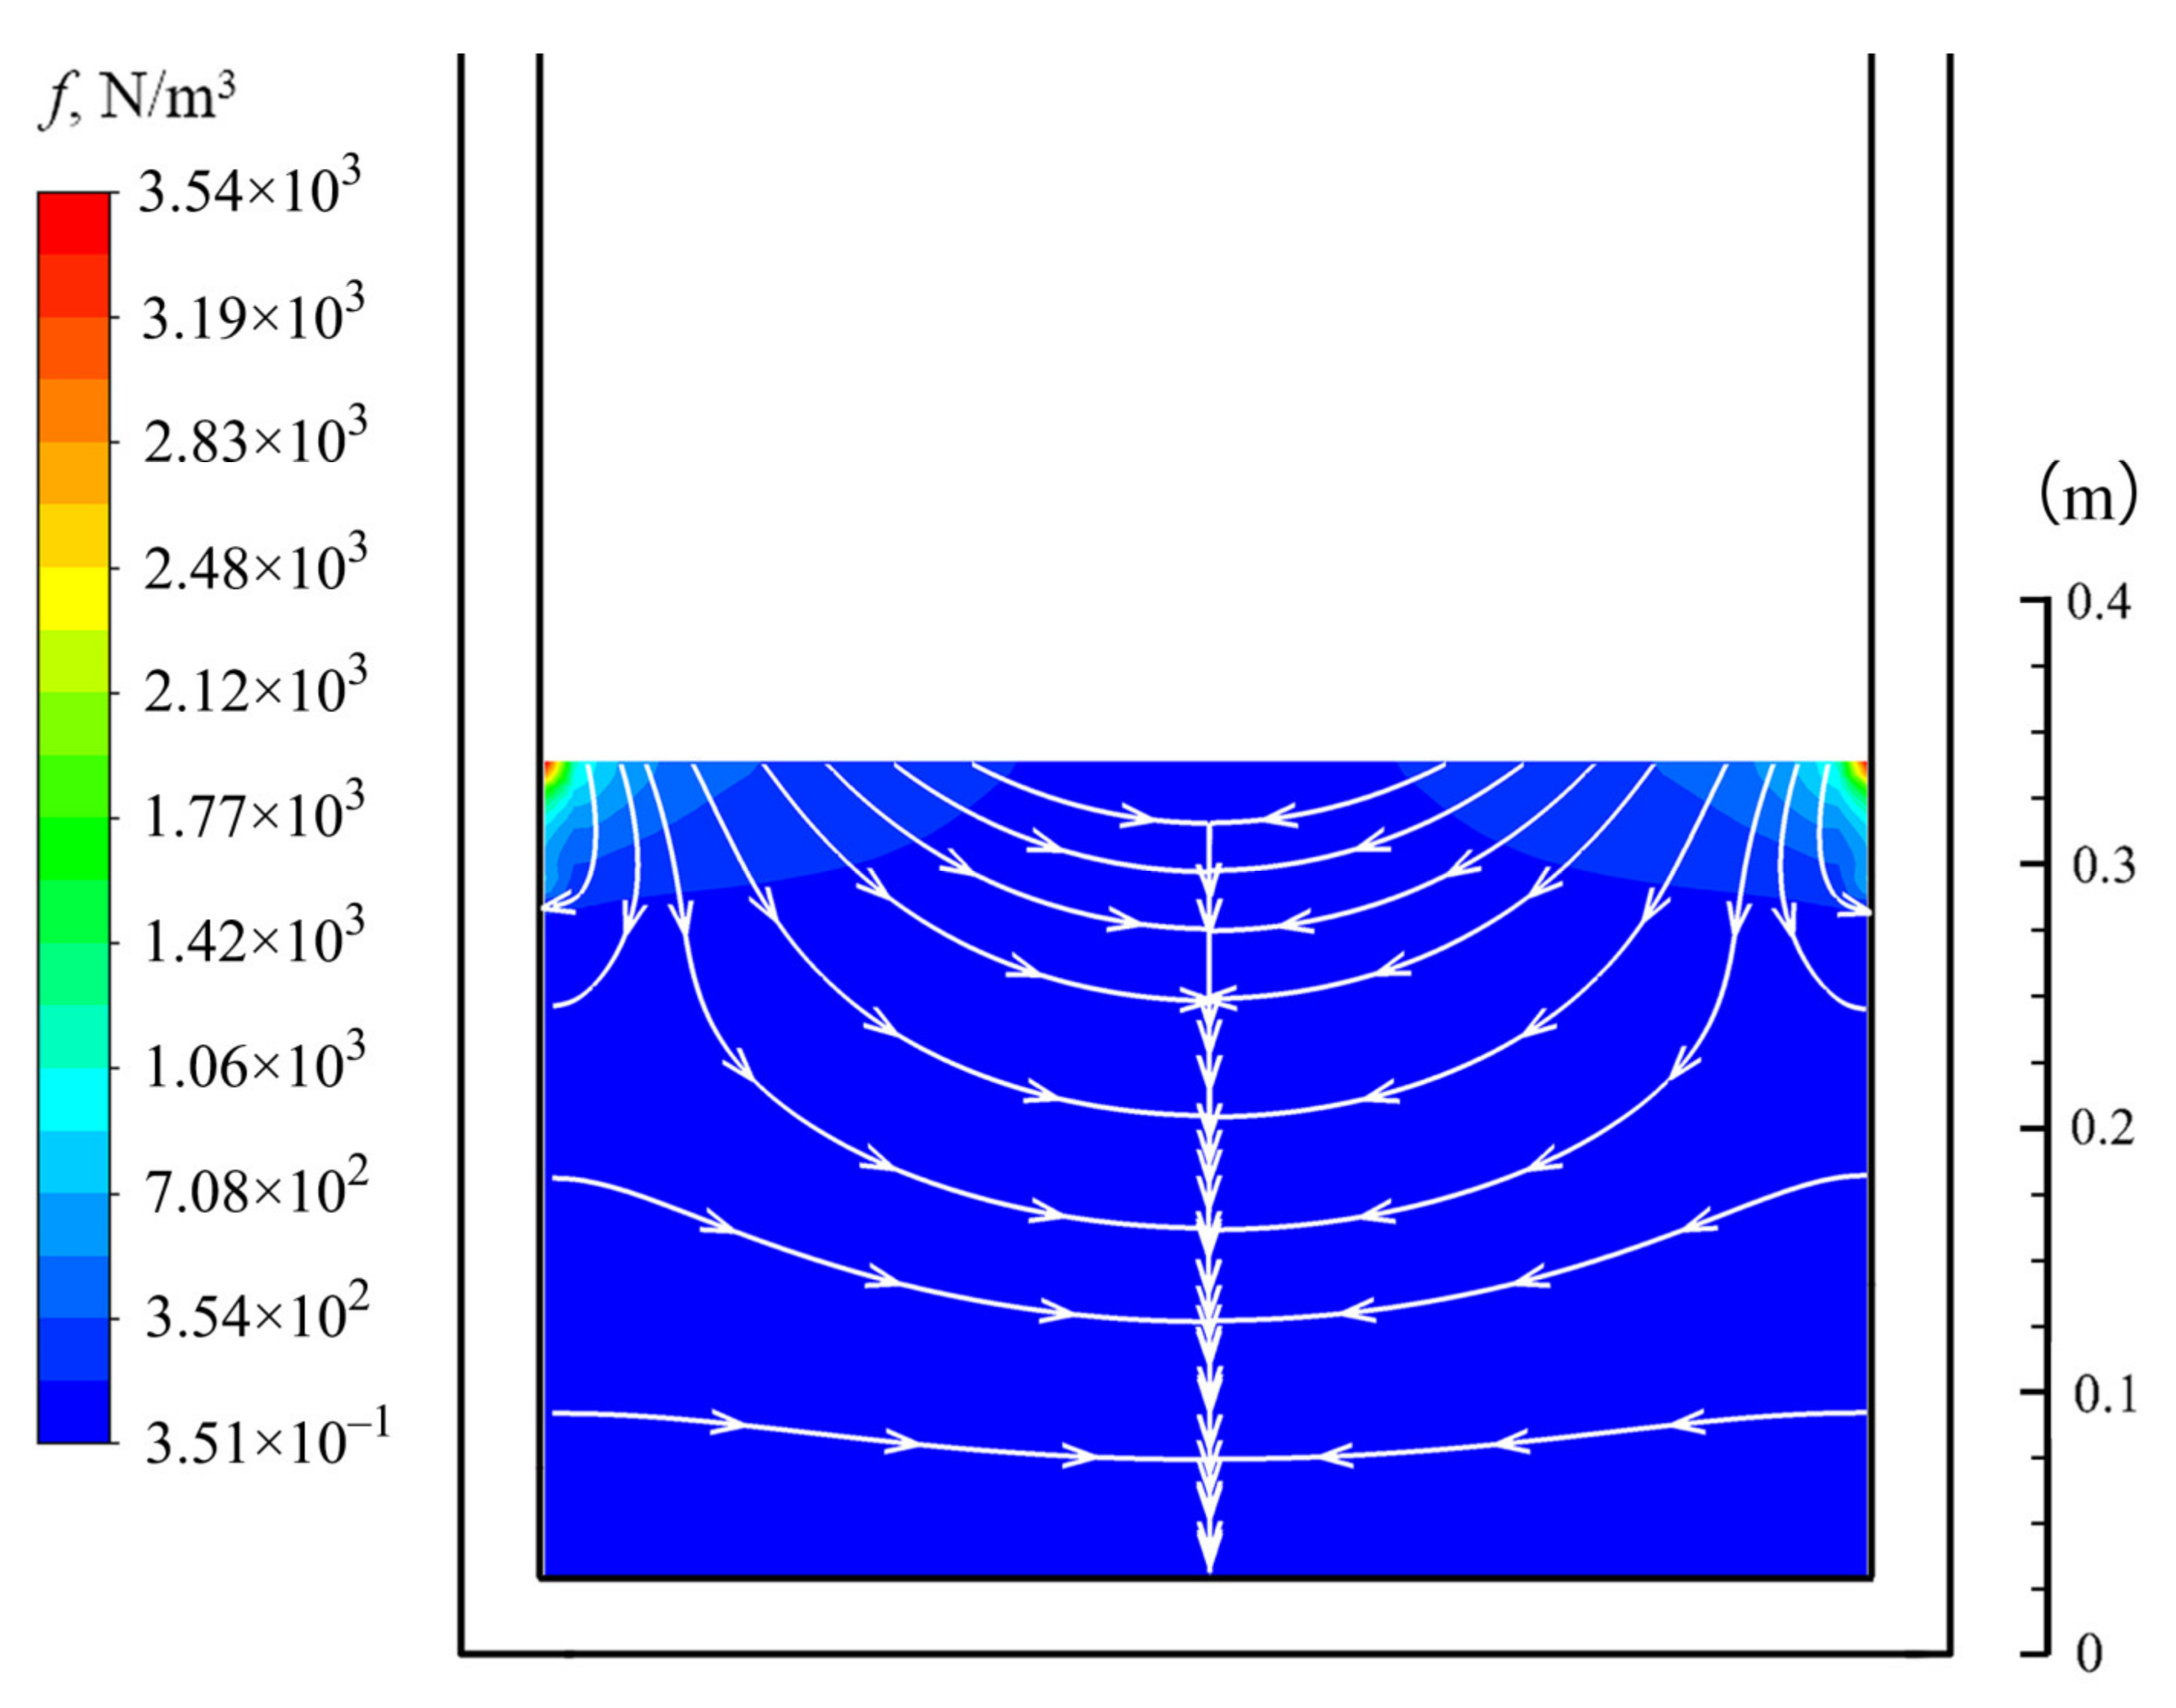
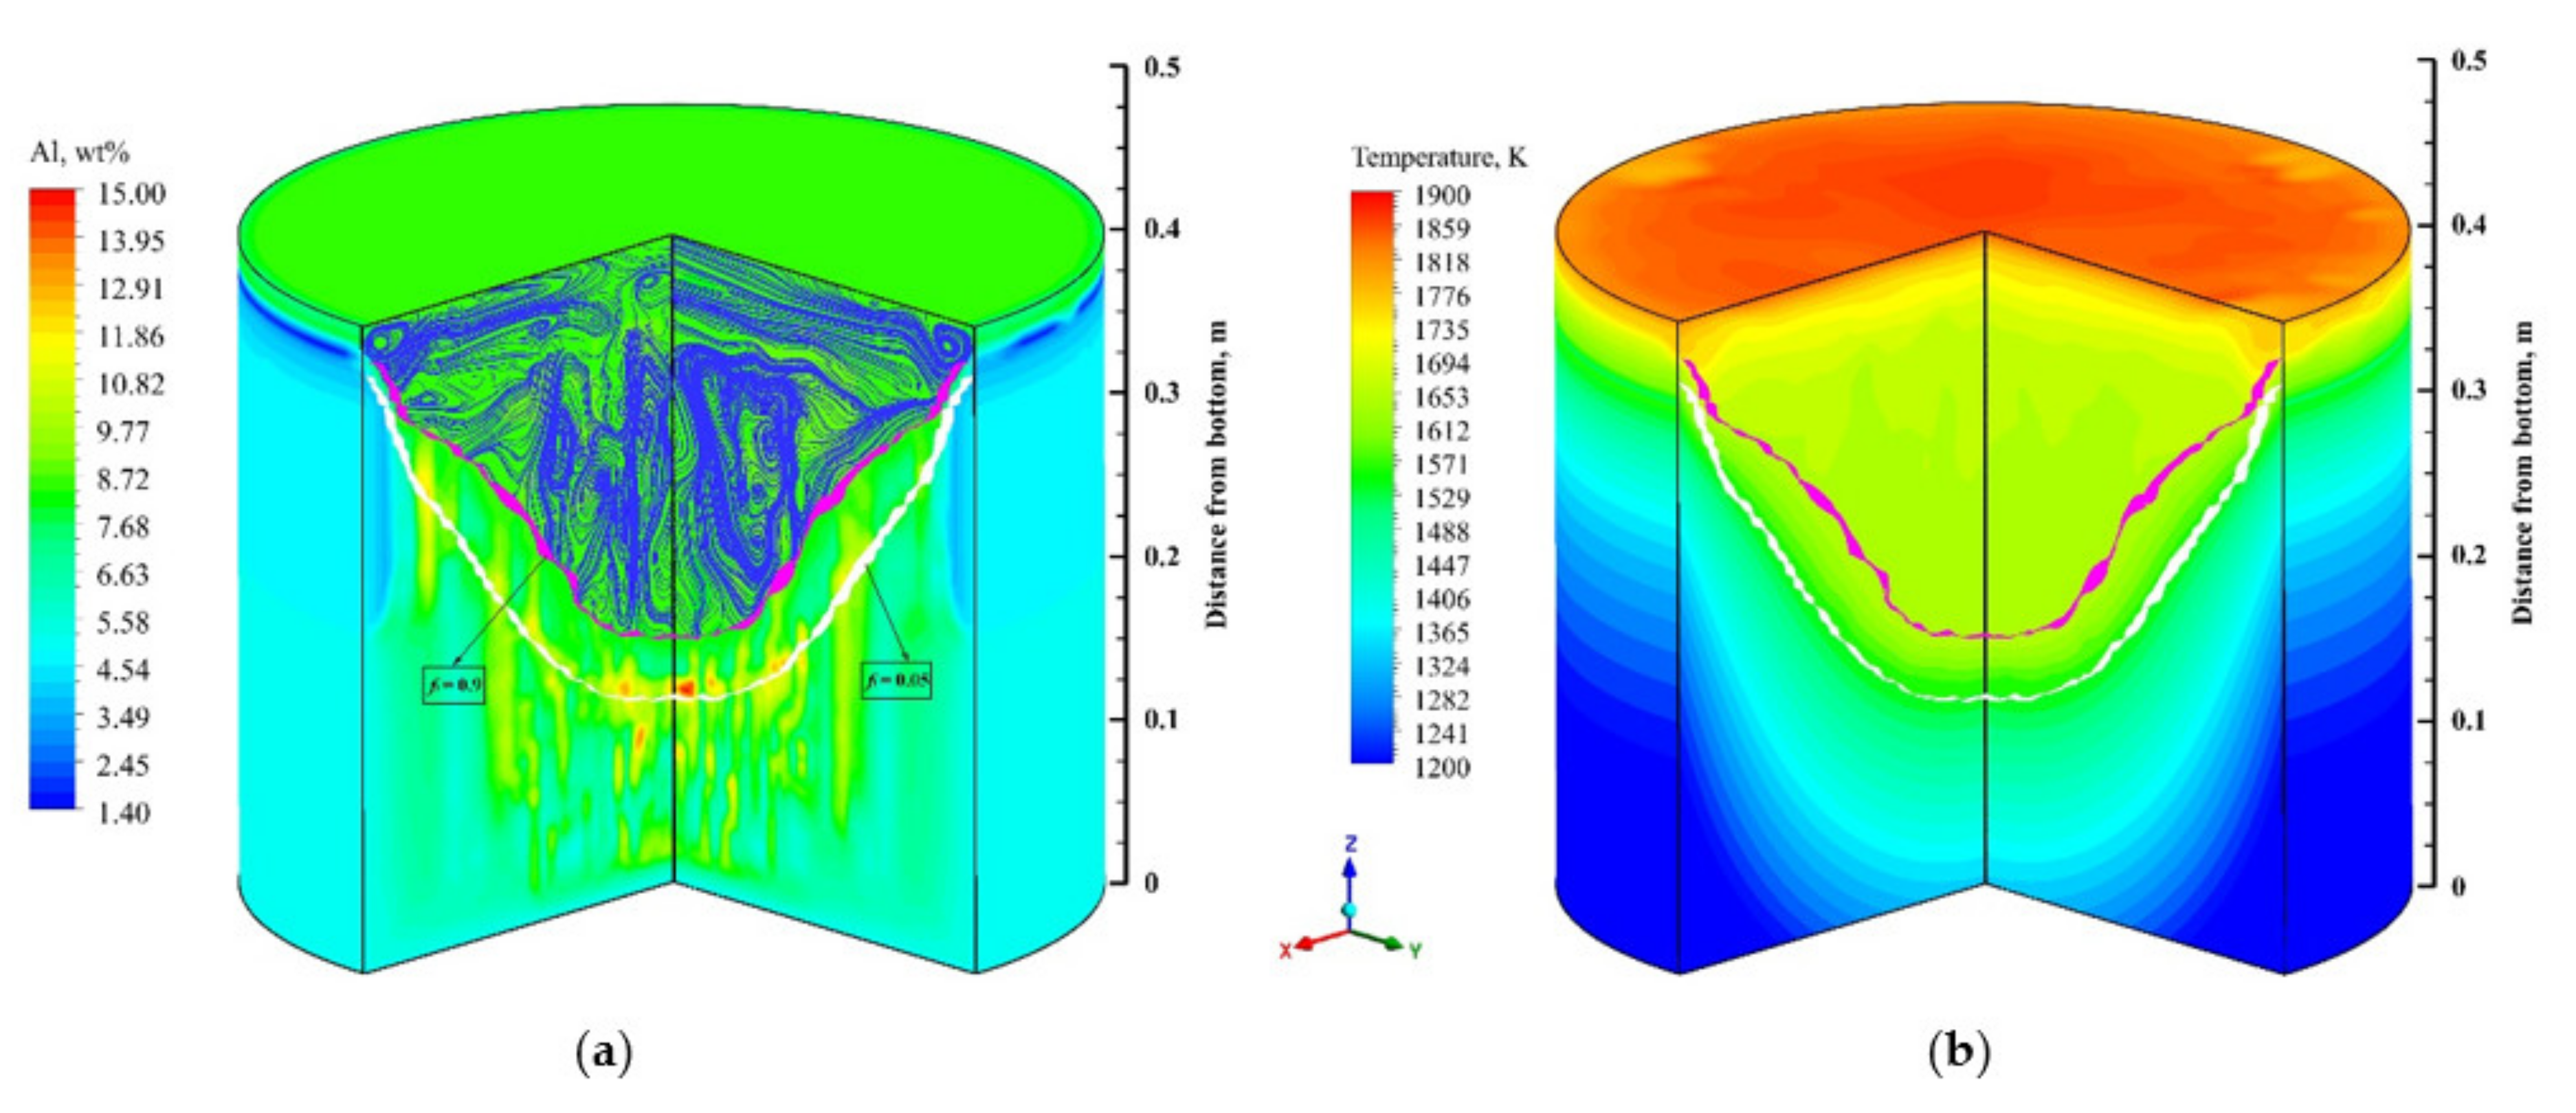
  • The Lorentz force mainly affects the flow pattern at the top of the molten pool, which has less influence on the flow field inside the ingot. The complex flow of multiple vortices in the molten pool is dominated by the thermosolutal buoyancy. The position where thermosolutal buoyancy is larger corresponds to the position where the solute enrichment channel is formed in the mushy zone.
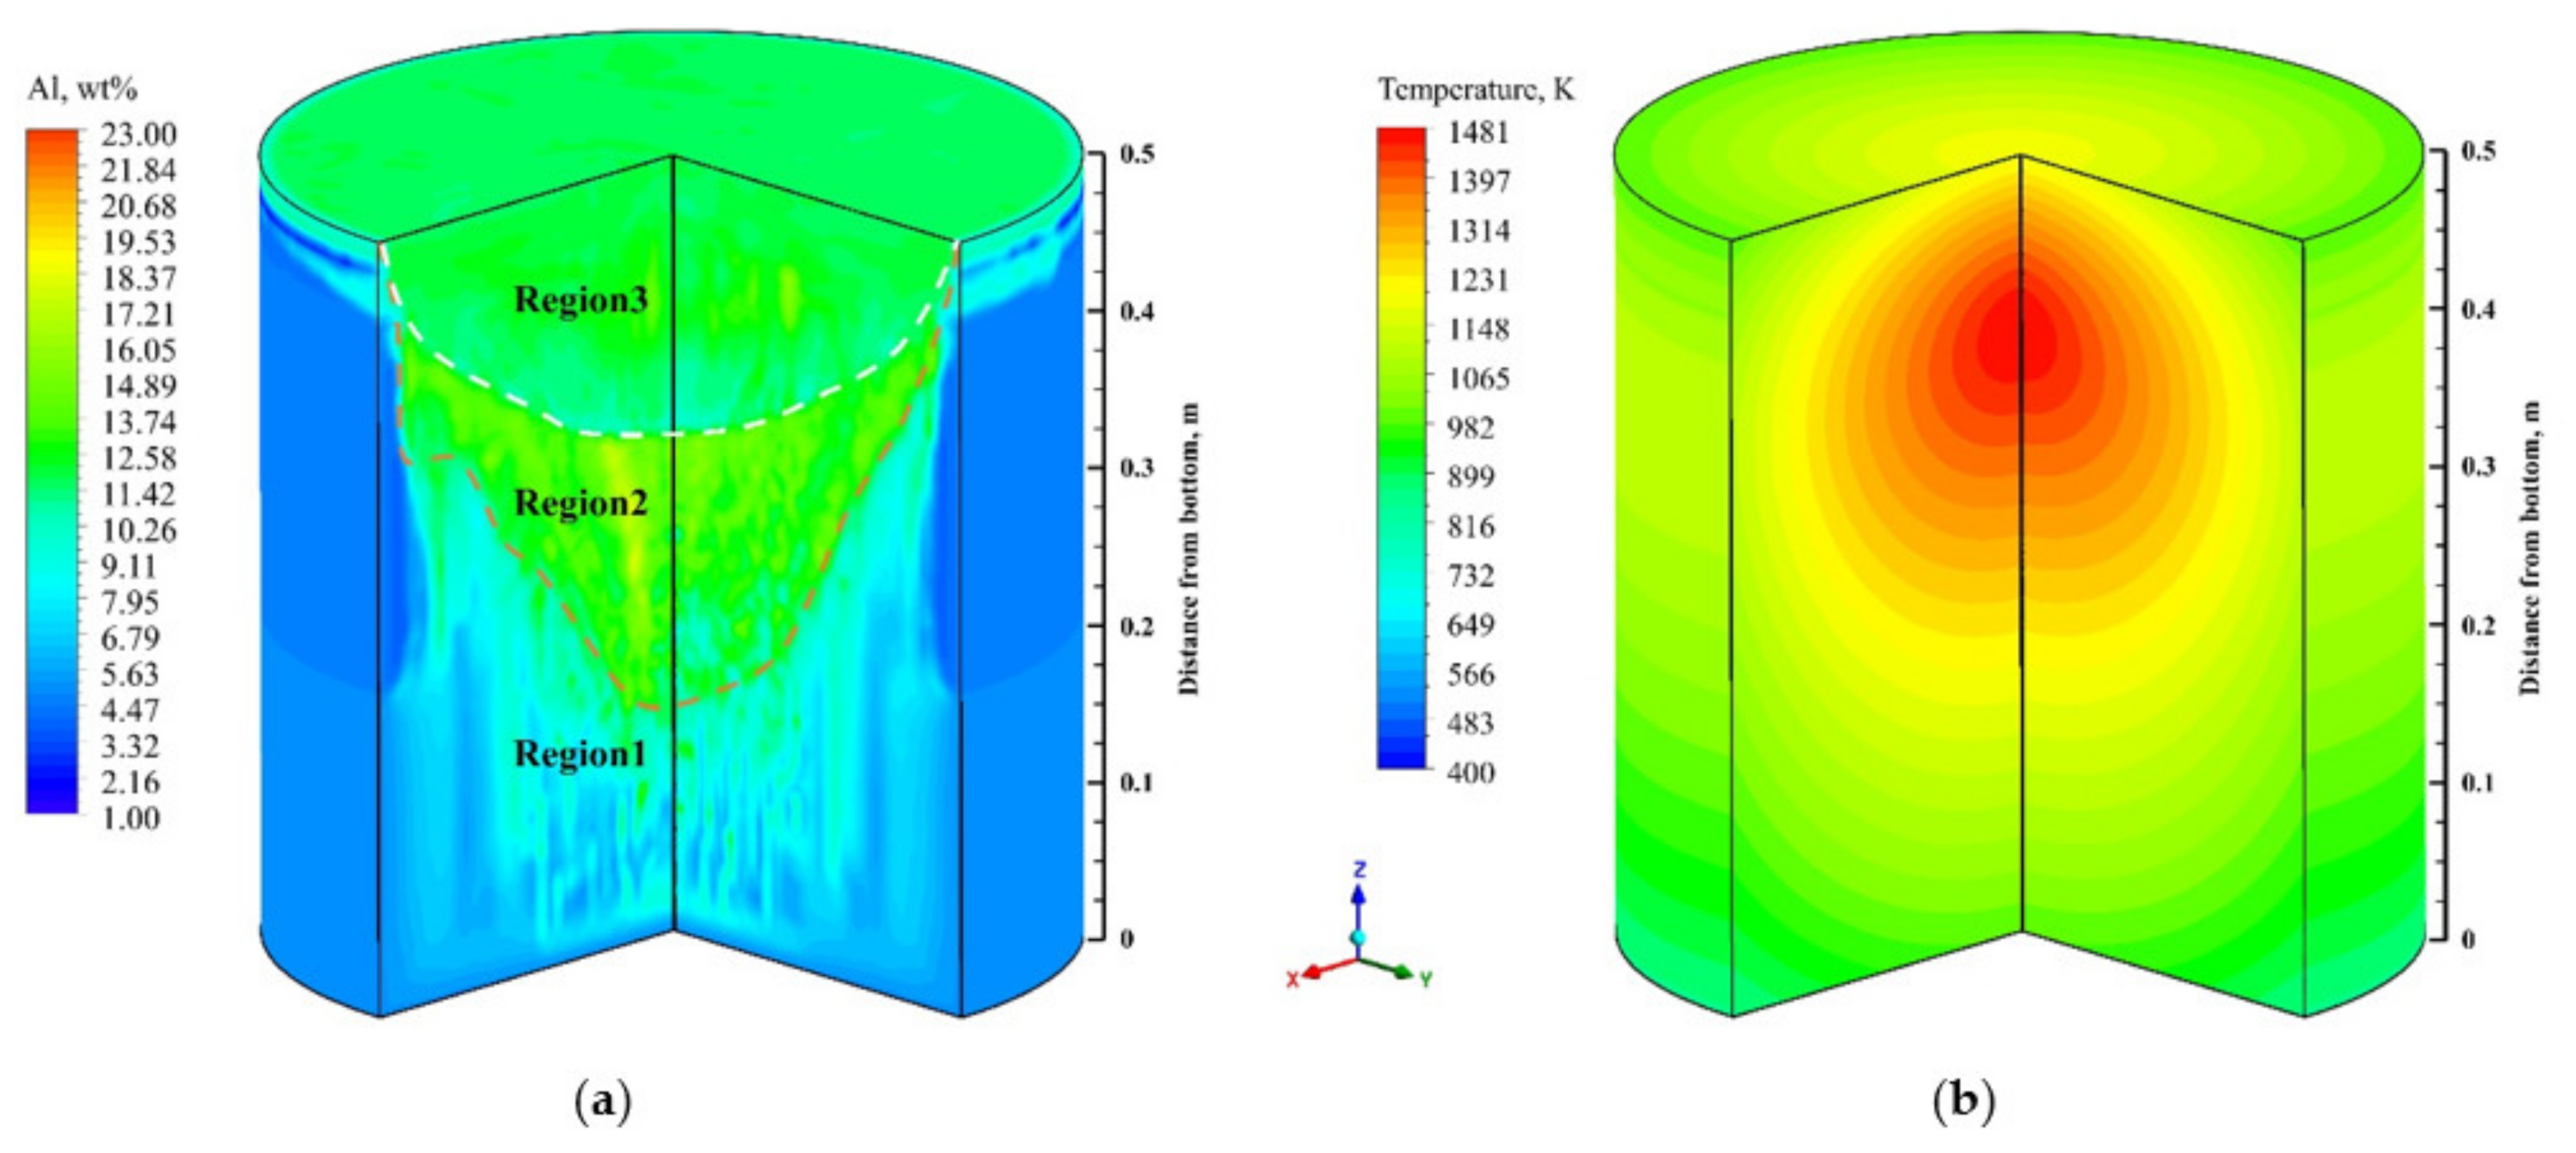
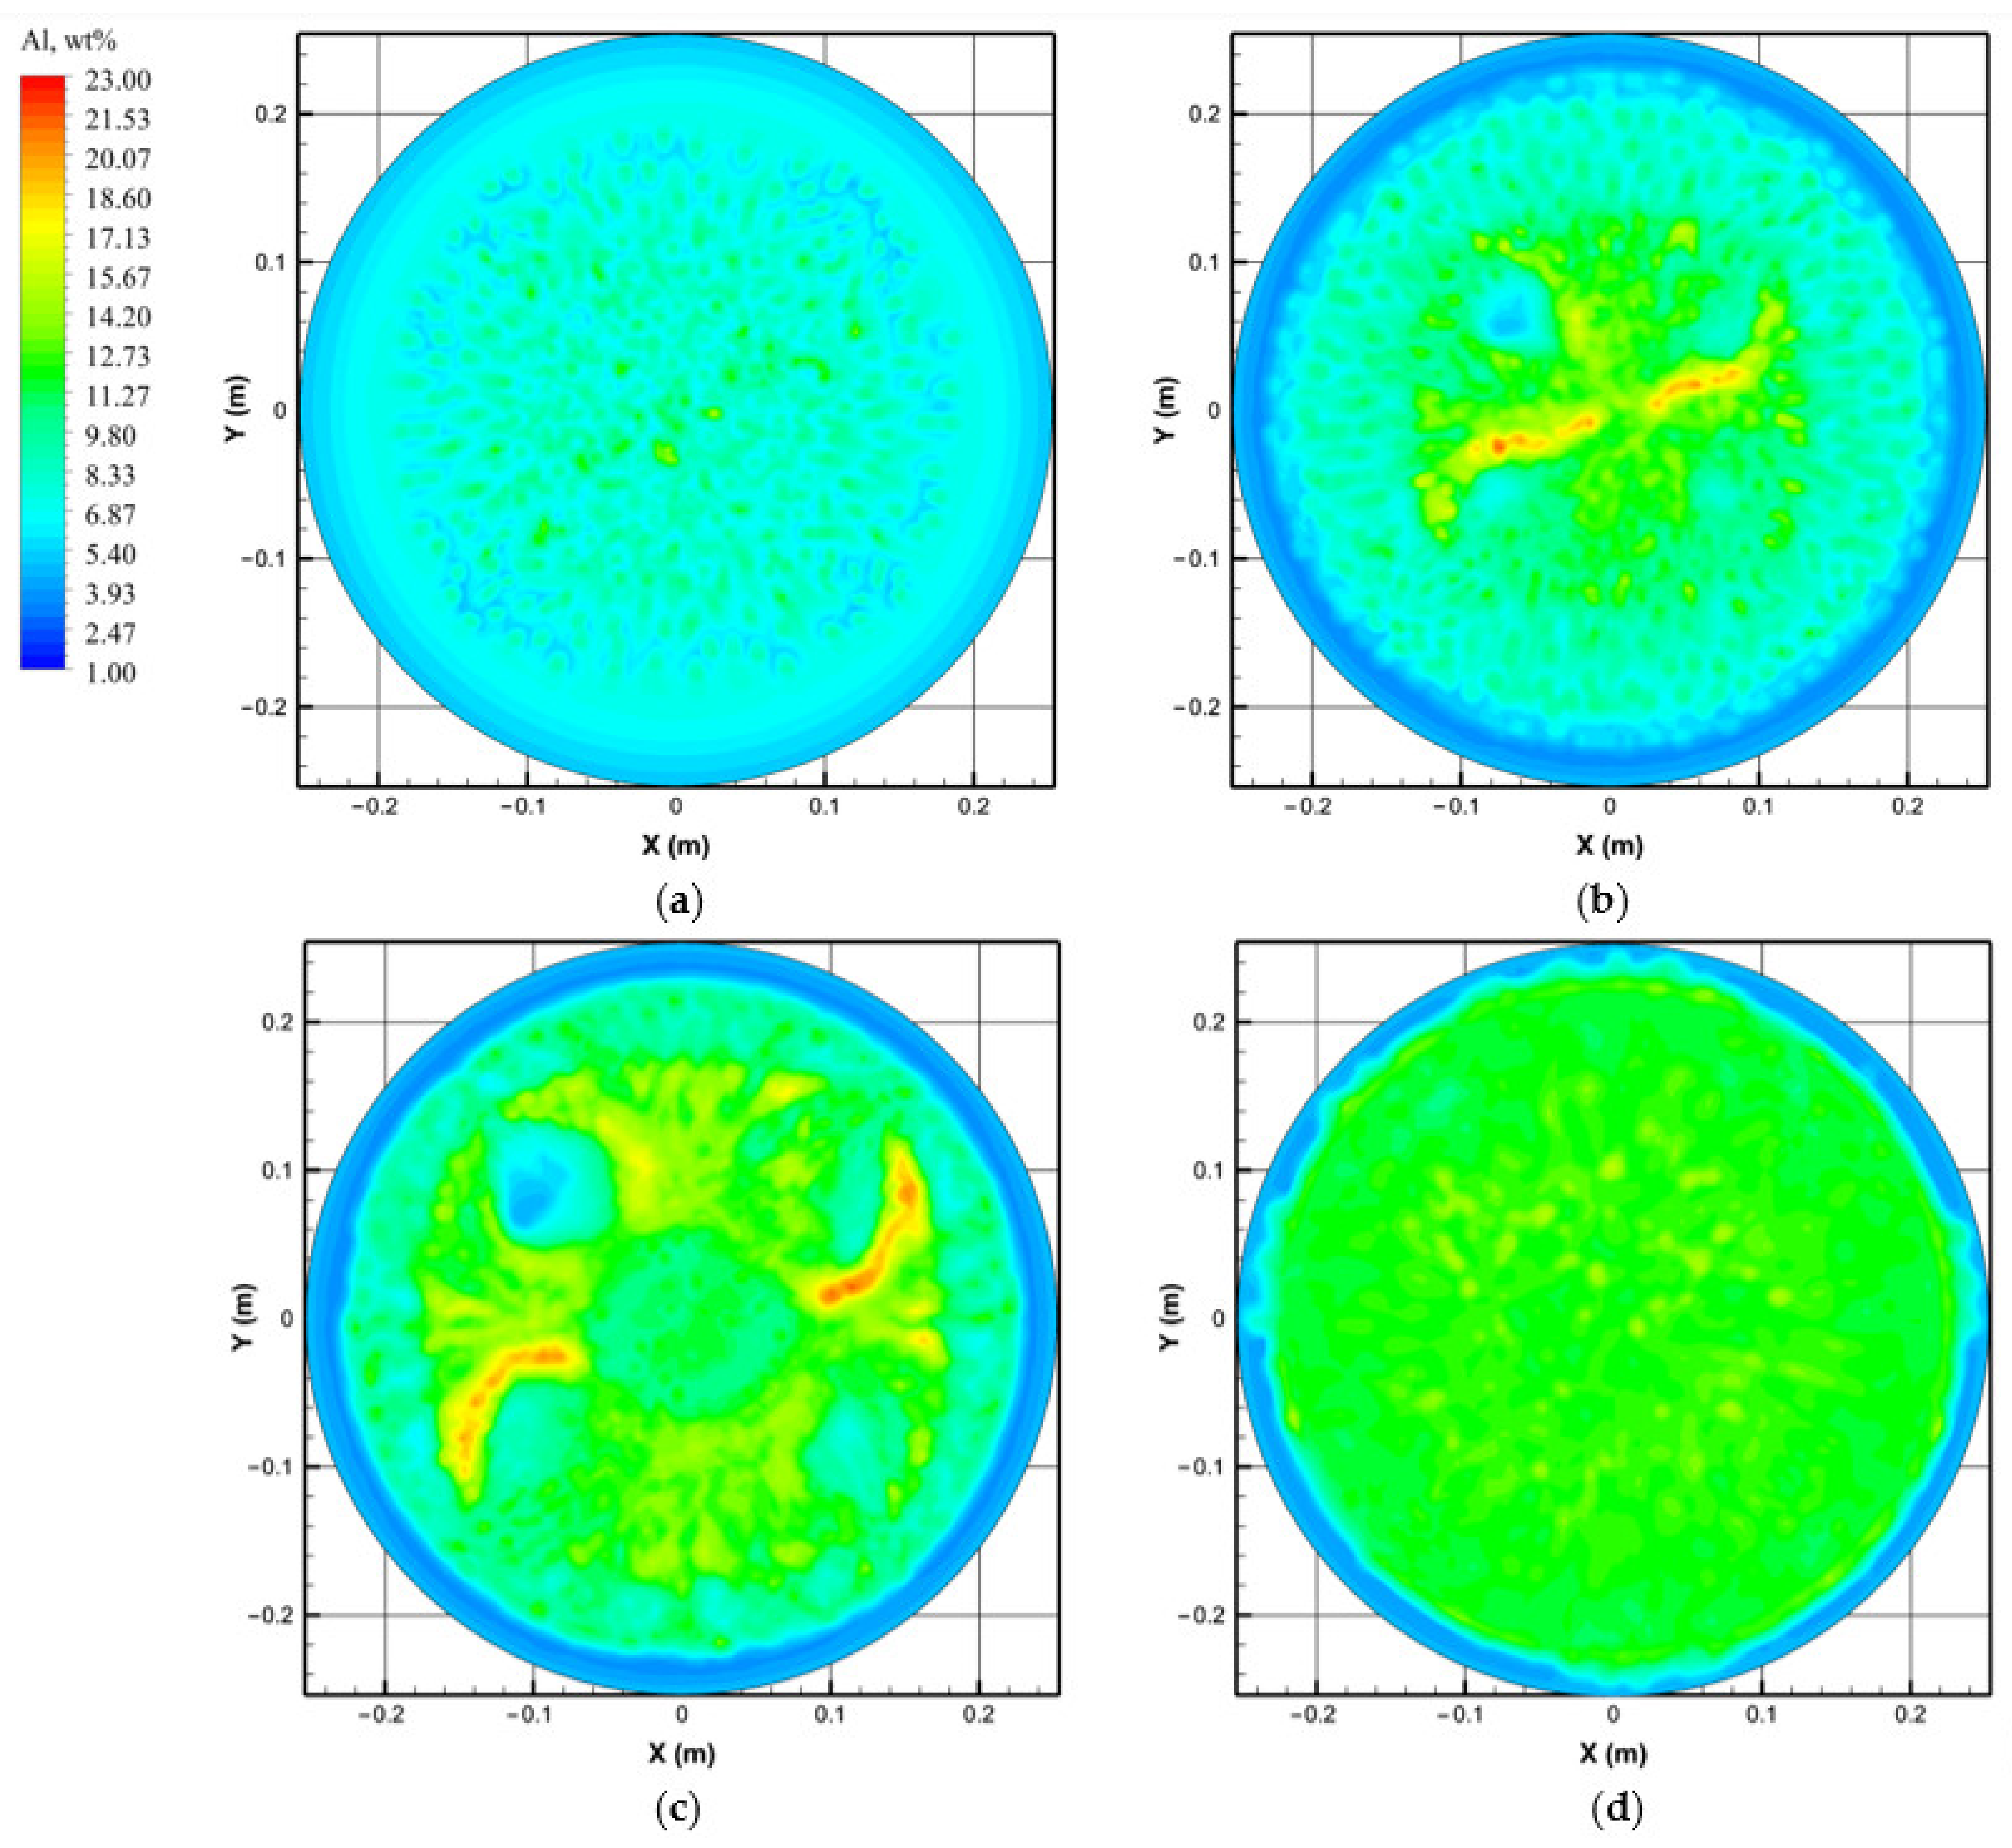
  • Freckles, that is, channel-type solute enrichment, mainly concentrated in the lower part of the ingot. With the growth of the ingot, some adjacent channels in the central part of the ingot merged, resulting in the solute enrichment channel gradually developing into the solute enrichment region, and channel segregation evolving into macrosegregation. The solutes in the middle and upper parts of the ingot are mainly concentrated in the macrosegregation area in the center, while negative segregation appears at the side of the ingot.
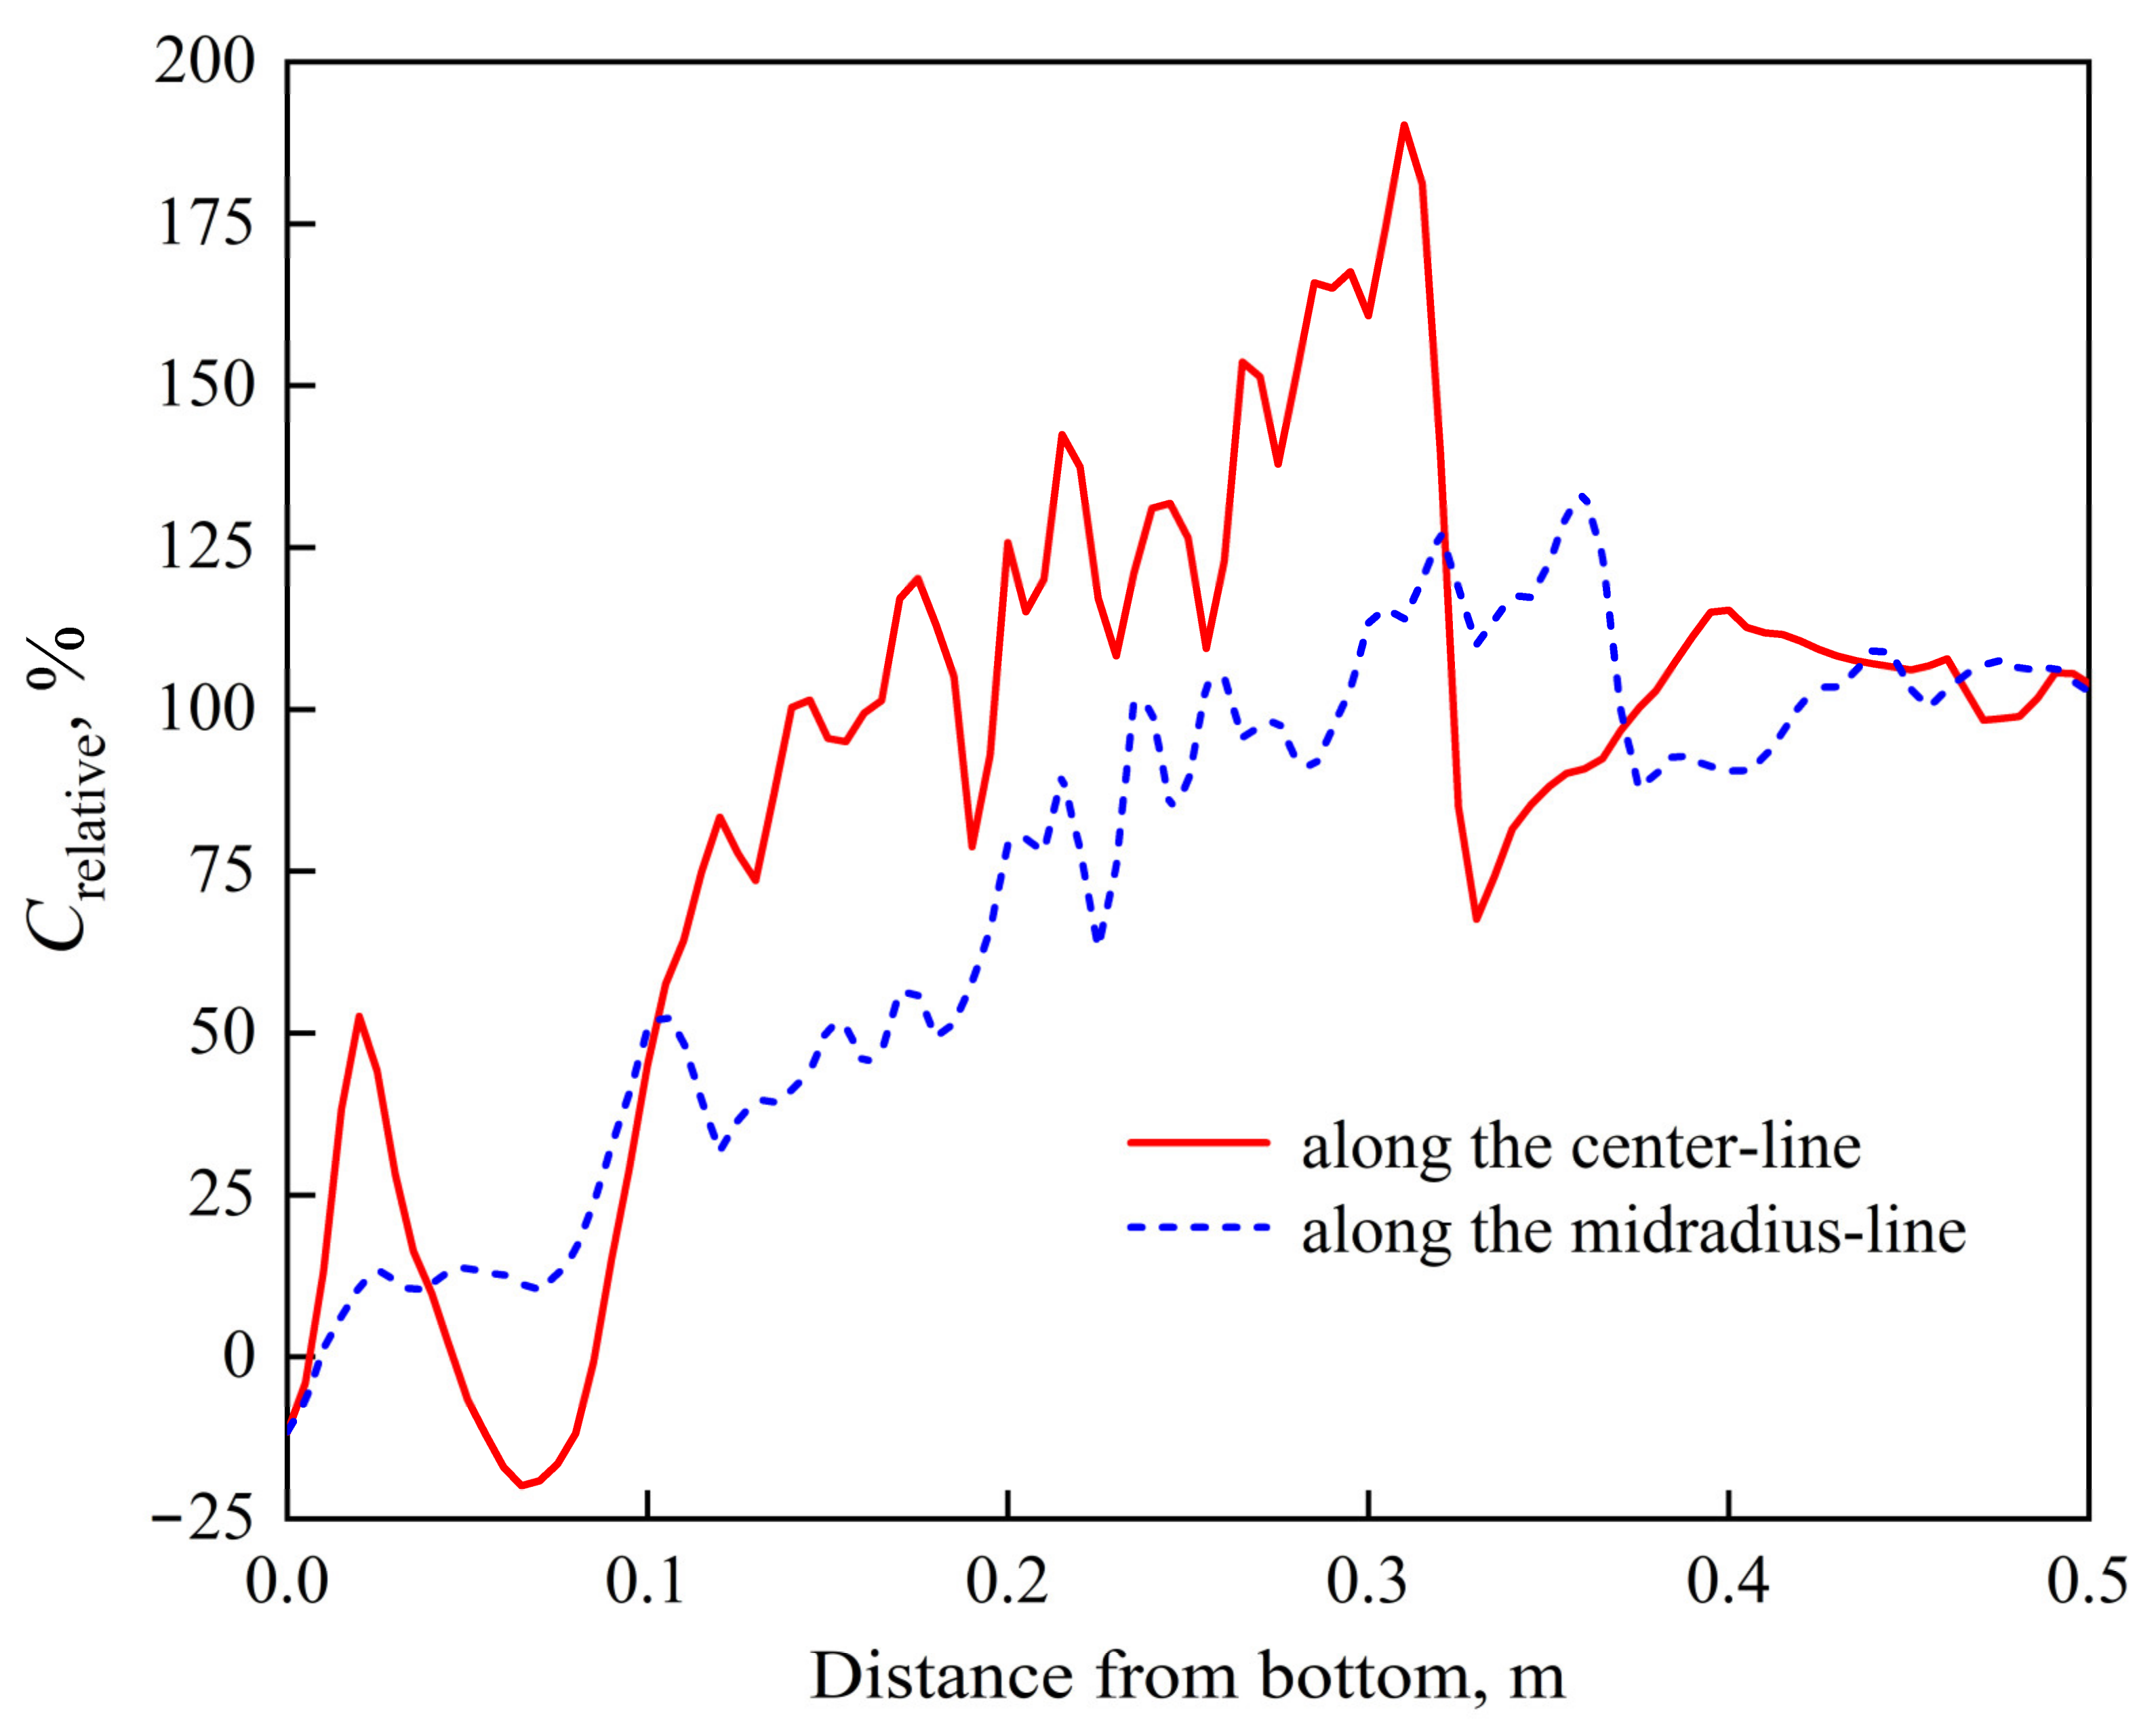
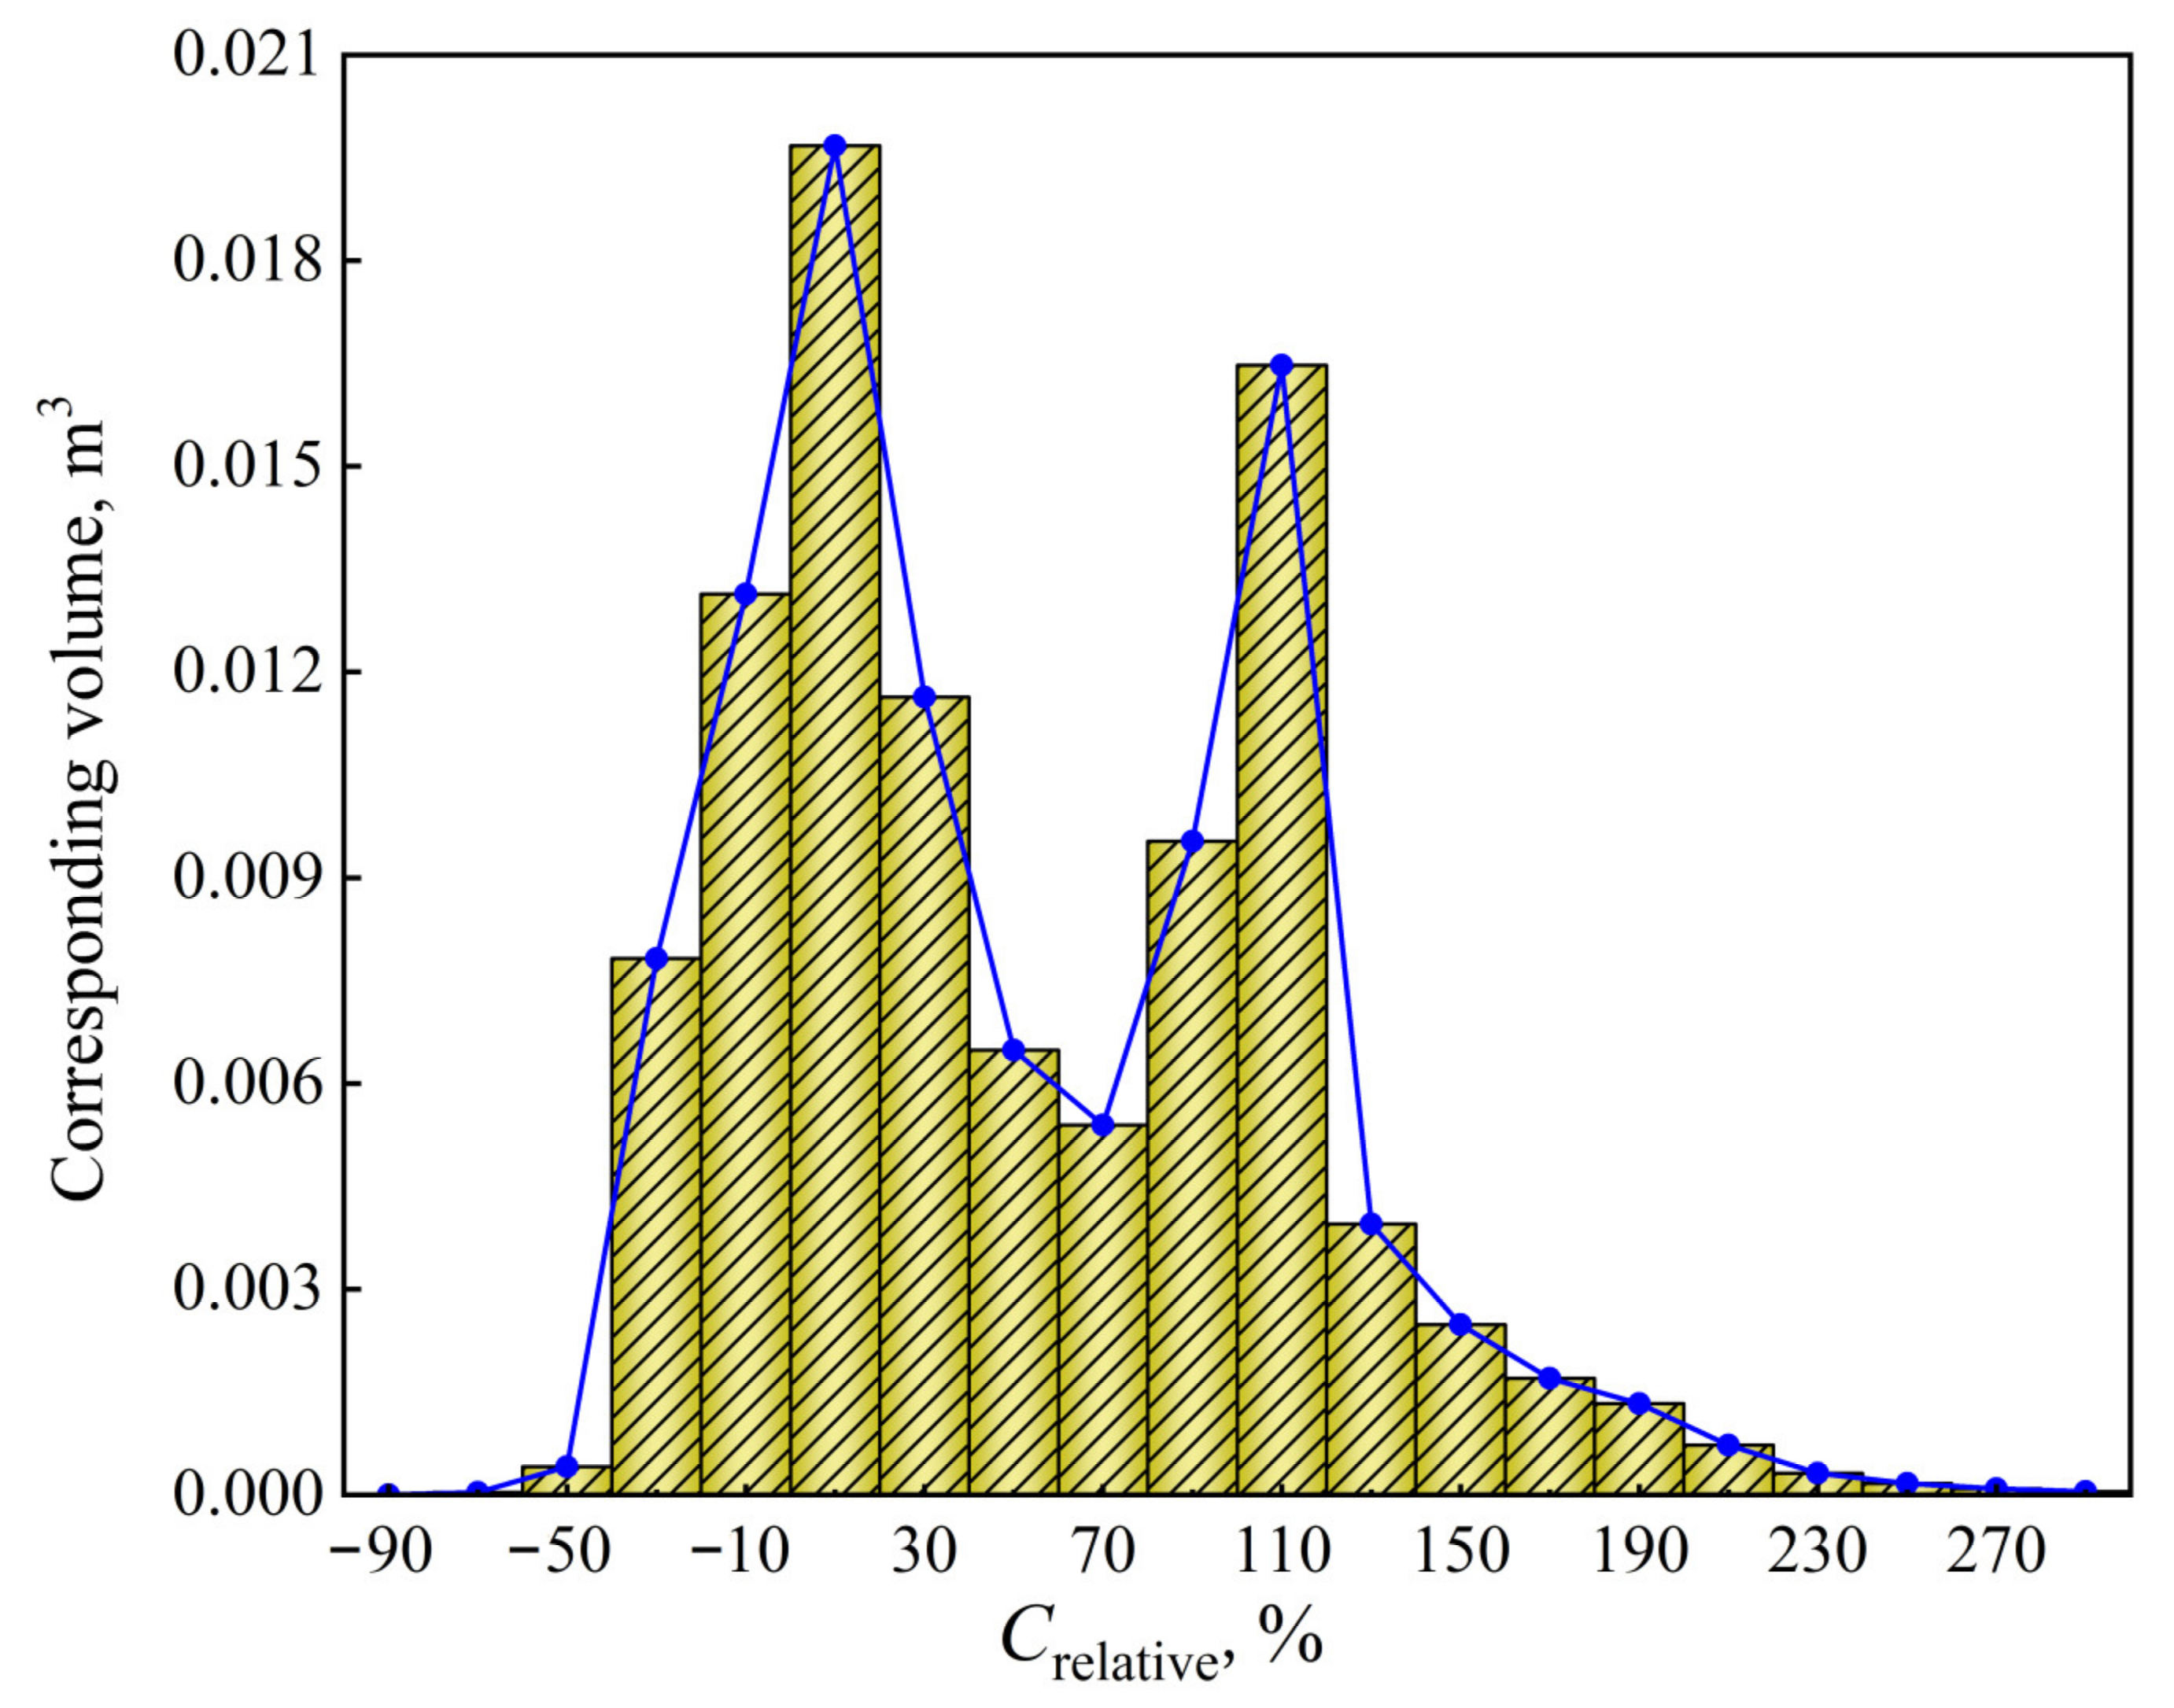
  • The maximum and minimum relative segregation ratio inside the ingot can reach 290% and –90%, respectively, and about 79% of the total volume presents positive segregation. In the range of negative segregation, the volume of the corresponding range will decrease as the negative segregation becomes more serious. In the range of positive segregation, the volume of the corresponding range has two maximum values, which are located in the range of 0~20% and 100%~120%, respectively, rather than the monotonous variation trend as in the negative segregation region.

Author Contributions

Conceptualization, methodology, software, validation, writing—original draft preparation, J.C.; conceptualization, supervision, methodology, writing—review and editing, B.L.; formal analysis, funding acquisition, writing—review and editing, Z.L.; software, writing—review and editing, F.Q.; methodology, resources, B.Z.; resources, J.Z. All authors have read and agreed to the published version of the manuscript.

Funding

This work was financially supported by the National Natural Science Foundation of China (Nos. 52171031, 51690161) and Fundamental Research Funds for the Central Universities (No. N2125001).

Institutional Review Board Statement

Not applicable.

Informed Consent Statement

Not applicable.

Data Availability Statement

Not applicable.

Conflicts of Interest

The authors declare no conflict of interest.

References

  1. Hu, B.; Pei, Y.L.; Gong, S.K.; Li, S.S. Orientation Dependence of High Cycle Fatigue Behavior of a <111> Oriented Single-Crystal Nickel-Based Superalloy. Metals 2021, 11, 1248. [Google Scholar] [CrossRef]
  2. Descotes, V.; Quatravaux, T.; Bellot, J.-P.; Witzke, S.; Jardy, A. Titanium Nitride (TiN) Germination and Growth During Vacuum Arc Remelting of a Maraging Steel. Metals 2020, 10, 541. [Google Scholar] [CrossRef] [Green Version]
  3. Karimi-Sibaki, E.; Kharicha, A.; Wu, M.H.; Ludwig, A.; Bohacek, J. A Parametric Study of the Vacuum Arc Remelting (VAR) Process: Effects of Arc Radius, Side-Arcing, and Gas Cooling. Metall. Mater. Trans. B 2019, 51, 222–235. [Google Scholar] [CrossRef] [Green Version]
  4. Spitans, S.; Franz, H.; Scholz, H.; Reiter, G.; Baake, E. Numerical Simulation of the Ingot Growth During the Vacuum Arc Remelting Process. Magnetohydrodynamics 2017, 53, 557–569. [Google Scholar] [CrossRef]
  5. Shevchenko, D.M.; Ward, R.M. Liquid Metal Pool Behavior During the Vacuum Arc Remelting of INCONEL 718. Metall. Mater. Trans. B 2008, 40, 263–270. [Google Scholar] [CrossRef]
  6. Zhu, B.; Xue, X.Y.; Kou, H.C.; Xiao, C.; Li, J.S. Macroscale Modeling of Multi-Physics Fields During Vacuum Arc Remelting of Ti-6Al-4V. Mater. Sci. Forum 2014, 789, 603–607. [Google Scholar] [CrossRef]
  7. Zhao, X.H.; Li, J.S.; Chang, H.; Yang, Z.J.; Kou, H.C.; Hu, R.; Zhou, L. Numerical Simulation of Electromagnetic Field in Vacuum Arc Remelting Process. Chin. J. Nonferrous Met. 2010, 20, 538–543. (In Chinese) [Google Scholar] [CrossRef]
  8. Zhang, B.J.; Huang, S.; Zhang, W.Y.; Tian, Q.; Chen, S.F. Recent Development of Nickel-Based Disc Alloys and Corresponding Cast-wrought Processing Techniques. Acta Metall. Sin. 2019, 55, 1095–1114. (In Chinese) [Google Scholar] [CrossRef]
  9. Madison, J.; Spowart, J.; Rowenhorst, D.; Aagesen, L.K.; Thornton, K.; Pollock, T.M. Modeling Fluid Flow in Three-Dimensional Single Crystal Dendritic Structures. Acta Mater. 2010, 58, 2864–2875. [Google Scholar] [CrossRef]
  10. Yang, Z.J.; Kou, H.C.; Li, J.S.; Hu, R.; Chang, H.; Zhou, L. Macrosegregation Behavior of Ti-10V-2Fe-3Al Alloy During Vacuum Consumable Arc Remelting Process. J. Mater. Eng. Perform. 2010, 20, 65–70. [Google Scholar] [CrossRef]
  11. Fan, K.; Wu, L.C.; Li, J.J.; Wang, J.C. Numerical Simulation of Macrosegregation Caused by Buoyancy Driven Flow During VAR Process for Titanium Alloys. Rare Met. Mater. Eng. 2020, 49, 871–877. (In Chinese) [Google Scholar]
  12. Shang, J.J.; He, Y.S.; Yang, C.; Wu, M.; Luo, W.Z.; Wang, K.X. Freckles Pattern and Microstructure Feature of Nb-Ti Alloy Produced by Vacuum Arc Remelting. In MATEC Web of Conferences; EDP Sciences: Nantes, France, 2020; Volume 321, p. 12. [Google Scholar] [CrossRef]
  13. Wang, X.H.; Ward, R.M.; Jacobs, M.H.; Barratt, M.D. Effect of Variation in Process Parameters on the Formation of Freckle in INCONEL 718 by Vacuum Arc Remelting. Metall. Mater. Trans. A 2008, 39, 2981–2989. [Google Scholar] [CrossRef]
  14. Zagrebelnyy, D.; Krane, M.J.M. Segregation Development in Multiple Melt Vacuum Arc Remelting. Metall. Mater. Trans. B 2008, 40, 281–288. [Google Scholar] [CrossRef]
  15. Pericleous, K.; Djambazov, G.; Ward, M.; Yuan, L.; Lee, P.D. A Multiscale 3D Model of the Vacuum Arc Remelting Process. Metall. Mater. Trans. A 2013, 44, 5365–5376. [Google Scholar] [CrossRef]
  16. Leder, M.O.; Kondrashov, E.N. Columnar-to-Equiaxed Transition During the Solidification of a Ti–10V–2Fe–3Al Alloy. Russ. Metall. 2017, 2016, 1125–1128. [Google Scholar] [CrossRef]
  17. Nastac, L. A Multiscale Transient Modeling Approach for Predicting the Solidification Structure in VAR-Processed Alloy 718 Ingots. Metall. Mater. Trans. B 2012, 45, 44–50. [Google Scholar] [CrossRef]
  18. Kermanpur, A.; Evans, D.G.; Siddall, R.J.; Lee, P.D.; Mclean, M. Effect of Process Parameters on Grain Structure Formation During VAR of INCONEL alloy 718. J. Mater. Sci. 2004, 39, 7175–7182. [Google Scholar] [CrossRef]
  19. Kou, H.C.; Zhang, Y.J.; Yang, Z.J.; Li, P.F.; Li, J.S.; Zhou, L. Liquid Metal Flow Behavior During Vacuum Consumable Arc Remelting Process for Titanium. Int. J. Eng. Technol. 2014, 12, 50–56. [Google Scholar]
  20. Wang, C.J.; Liu, Z.Q.; Li, B.K. Combined Effects of EMBr and SEMS on Melt Flow and Solidification in a Thin Slab Continuous Caster. Metals 2021, 11, 948. [Google Scholar] [CrossRef]
  21. Kaygısız, Y.; Maraşlı, N. Directional Solidification of Al–Cu–Si–Mg Quaternary Eutectic Alloy. J. Alloy. Compd. 2017, 721, 764–771. [Google Scholar] [CrossRef]
  22. Ren, N.; Li, J.; Panwisawas, C.; Xia, M.X.; Dong, H.B.; Li, J.G. Thermal-Solutal-Fluid Flow of Channel Segregation During Directional Solidification of Single-Crystal Nickel-Based Superalloys. Acta Mater. 2021, 206, 116620. [Google Scholar] [CrossRef]
  23. Liu, Z.Q.; Niu, R.; Wu, Y.D.; Li, B.K.; Gan, Y.; Wu, M.H. Physical and Numerical Simulation of Mixed Columnar-Equiaxed Solidification During Cold Strip Feeding in Continuous Casting. Int. J. Heat Mass Transf. 2021, 173, 121237. [Google Scholar] [CrossRef]
  24. Wu, M.H.; Ludwig, A.; Kharicha, A. Volume-Averaged Modeling of Multiphase Flow Phenomena During Alloy Solidification. Metals 2019, 9, 229. [Google Scholar] [CrossRef] [Green Version]
  25. Quatravaux, T.; Ryberon, S.; Hans, S.; Jardy, A.; Lusson, B.; Richy, P.E.; Ablitzer, D. Transient VAR ingot growth modelling: Application to specialty steels. J. Mater. Sci. 2004, 39, 7183–7191. [Google Scholar] [CrossRef]
  26. ANSYS FLUENT 14. 5-Theory Guide; ANSYS, Inc.: Canonsburg, PA, USA, 2012.
  27. Xu, X.; Zhang, W.; Lee, P.D. Tree-Ring Formation During Vacuum Arc Remelting of INCONEL 718: Part II. Mathematical Modeling. Metall. Mater. Trans. A 2002, 33, 1805–1815. [Google Scholar] [CrossRef]
  28. Tin, S.; Pollock, T.M. Predicting Freckle Formation in Single Crystal Ni-Base Superalloys. J. Mater. Sci. 2009, 39, 7199–7205. [Google Scholar] [CrossRef]
  29. Sung, P.K.; Poirier, D.R. Liquid-Solid Partition Ratios in Nickel-Base Alloys. Metall. Mater. Trans. A 1999, 30, 2173–2181. [Google Scholar] [CrossRef]
  30. Wu, Y.D.; Liu, Z.Q.; Wang, F.; Li, B.K.; Gan, Y. Experimental Investigation of Trajectories, Velocities and Size Distributions of Bubbles in a Continuous-Casting Mold. Powder Technol. 2021, 387, 325–335. [Google Scholar] [CrossRef]
  31. Ahmad, N.; Combeau, H.; Desbiolles, J.-L.; Jalanti, T.; Lesoult, G.; Rappaz, J.; Rappaz, M.; Stomp, C. Numerical Simulation of Macrosegregation: A Comparison Between Finite Volume Method and Finite Element Method Predictions and a Confrontation with Experiments. Metall. Mater. Trans. A 1998, 29, 617–630. [Google Scholar] [CrossRef]
  32. Li, W.S.; Shen, H.F.; Liu, B.C. A Response to Numerical Benchmark for Solidification of Binary Alloys: Macro-Segregation with Thermo-Solutal Convection. China Foundry 2012, 9, 171–177. [Google Scholar] [CrossRef]
  33. Hebditch, D.J.; Hunt, J.D. Observations of Ingot Macrosegregation on Model Systems. Metall. Trans. 1974, 5, 1557–1564. [Google Scholar] [CrossRef]
  34. Wang, Q.; Yan, H.G.; Ren, N.; Li, B.K. Effect of Current on Solute Transport in Electroslag Remelting Dual Alloy Ingot. Appl. Therm. Eng. 2016, 101, 564–567. [Google Scholar] [CrossRef]
Figure 1. Schematic diagram of the VAR process.
Metals 11 02046 g001
Figure 2. Coupled computational relationships for multiple physical fields during the VAR process.
Metals 11 02046 g002
Figure 3. Schematic diagram of mesh used in simulation: (a) local longitudinal section; (b) top view.
Metals 11 02046 g003
Figure 4. Schematic view of the boundary conditions: (a) simplified boundary condition; (b) actual boundary condition in this paper.
Metals 11 02046 g004
Figure 5. Contour of current density distribution changing with the arc radius when the current of the side arc accounts for 50% from this paper (left half) and the literature [3] (right half): the ratio of arc radius to ingot radius is (a) 0.5; (b) 0.6; (c) 0.7.
Metals 11 02046 g005
Figure 6. Comparison of Crelative in the cavity: (a) at 400 s from the literature; (b) this paper; (c) at 0.025 m from the bottom of the cavity after solidification.
Metals 11 02046 g006
Figure 7. The distribution of the electromagnetic field inside the ingot: (a) current density using actual boundary; (b) magnetic induction intensity using actual boundary; (c) current density using simplified boundary; (d) magnetic induction intensity using simplified boundary.
Metals 11 02046 g007
Figure 8. The distribution of the Lorentz force during the VAR process.
Metals 11 02046 g008
Figure 9. Results at solidification time t = 1500 s: (a) temperature distribution; (b) velocity field in the channels and liquid fraction at X = 0; (c) streamlines and solute distribution; (d) thermosolutal buoyancy.
Metals 11 02046 g009
Figure 10. Results at time t = 3500 s: (a) streamlines and solute distribution; (b) temperature distribution.
Metals 11 02046 g010
Figure 11. Results after solidification: (a) solute distribution and segregation behavior; (b) temperature distribution.
Metals 11 02046 g011
Figure 12. Solute distribution of horizontal sections inside the ingot after solidification: (a) Z = 0.1 m; (b) Z = 0.25 m; (c) Z = 0.35 m; (d) Z = 0.45 m.
Metals 11 02046 g012
Figure 13. Variation of volume-averaged segregation extent during the VAR process.
Metals 11 02046 g013
Figure 14. Variation of relative segregation ratio along the centerline and midradius-line after solidification.
Metals 11 02046 g014
Figure 15. Corresponding volume of each range of relative segregation ratio after solidification.
Metals 11 02046 g015
Table 1. Major technical parameters during the VAR process.
ParametersValueParametersValue
Ingot radius, Ri/mm 254 Ingot growth rate,
V0/m·s−1
4.22 × 10⁻⁵
Electrode radius, R0/mm 215 Proportion of Iingot, ηI 0.6
Arc focus, Ra/mm 178 Power efficiency, ηp 0.65
Current, Itotal/A 5600 Heat transfer coefficient, h(T)/W·m−2·K−1 20 (300 K), 40 (1000 K),
100 (1400 K), 300 (1580 K),
1000 (1620 K), 2000 (1700 K)
Volts, U/V 23 Wall thickness of crucible, δ0/mm 30
Melt rate, qm/kg·s−10.063 Temperature of crucible wall, Twall/K 400
Table 2. Thermophysical properties of Ni-5.8 wt% Al-15.2 wt% Ta alloy used for simulation.
ParametersValueParametersValue
Density, ρ/kg·m−37365Equilibrium partition coefficient, kTa0.48
Specific heat, cp/J·k−1·K−1660Solutal expansion coefficient,
β C Al /(wt%)−1
2.26 × 10⁻²
Thermal conductivity,
λ/W·m−1·K−1
18(600 K), 20(800 K),
23(1000 K), 26(1200 K),
29(1400 K), 33(1600 K),
41(1800 K), 45(2000 K)
Solutal expansion coefficient,
β C Ta /(wt%)−1
−3.82 × 10⁻³
Dynamic viscosity,
μ/kg·m−1·s−1
4.9 × 10⁻³Reference temperature, Tref/K1685
Solutal diffusivity, D/m2·s−15 × 10−9Eutectic mass fraction, C e Al /%37.5
Latent heat, L/J·kg−12.9 × 105Eutectic mass fraction, C e Ta /%76.1
Thermal expansion coefficient,
βT/K−1
1.2 × 10⁻⁴Eutectic temperature, Te/K1560
Slope of liquidus, mAl/K·(wt%)−1−5.17Melting temperature, Tm/K1754
Slope of liquidus, mTa/K·(wt%)−1−2.55Electrical conductivity,
σ−1·m−1
7.3 × 10⁵
Equilibrium partition coefficient, kAl0.54Magnetic permeability,
μ/H·m−1
1.26 × 10⁻⁶
Publisher’s Note: MDPI stays neutral with regard to jurisdictional claims in published maps and institutional affiliations.

