Article

Study of the Effect of a Plug with Torsion Channels on the Mixing Time in a Continuous Casting Ladle Water Model

by
Gerardo Aguilar
1,
Gildardo Solorio-Diaz
1,*,
Alicia Aguilar-Corona
1,
José Angel Ramos-Banderas
2,
Constantin A. Hernández
2,3 and
Fernando Saldaña
1
1
UMSNH, Posgrado en Ingeniería Mecánica, F. J. Mujica S/N Av., Morelia 58040, Mexico
2
TecNM/I.T. Morelia, Tecnológico 1500 Av., Morelia 58120, Mexico
3
CATEDRAS-CONACYT, Insurgentes Sur 1528 Av., Cuidad de Mexico 03940, Mexico
*
Author to whom correspondence should be addressed.
Metals 2021, 11(12), 1942; https://doi.org/10.3390/met11121942
Submission received: 19 October 2021 / Revised: 23 November 2021 / Accepted: 26 November 2021 / Published: 1 December 2021
(This article belongs to the Special Issue Numerical and Physical Modeling in Steel Refining and Casting)

Abstract

:
The use of porous plugs in injecting gas through the bottom of a ladle forms vertical plumes in a very similar way to a truncated cone. The gas plume when exiting the plug has a smaller diameter compared to that formed in the upper zone of the ladle because inertial forces predominate over buoyancy forces in this zone. In addition, the magnitude of the plume velocity is concentrated in an upward direction, which increases the likelihood of low velocity zones forming near the bottom of the ladle, especially in lower corners. In this work, a plug with spiral-shaped channels with different torsion angles is proposed, with the objective that the gas, when passing through them, has a tangential velocity gain or that the velocity magnitude is distributed in the three axes and does not just focus on the upward direction, helping to decrease low velocity zones near the bottom of the ladle for better mixing times. For the experimentation, we worked in a continuous casting ladle water model with two configuration injections, which in previous works were reported as the most efficient in mixing the steel in this ladle. The results obtained using the PIV technique (particle image velocimetry) and conductimetry technique indicate that the plugs with the torsion channels at angles of 60° and 120° improve the mixing times for the two injection configurations.

1. Introduction

The ladle furnace is the main reactor of the secondary refining during the steelmaking process. In it, the final chemical composition of the steel is adjusted, and it is responsible for feeding it thermally homogeneous to the continuous casting process. This reactor is also in charge of decarburization, desulfurization and the removal of non-metallic inclusions [1,2]. The chemical and thermal adjustment process is carried out in the presence of argon gas injected through the bottom of the reactor through porous plugs, accelerating the kinetics of the reactions and in turn reducing the mixing time of the reactor [1,2,3,4,5,6,7,8,9,10,11,12,13,14,15,16,17,18,19,20,21,22,23]. The mixing of a reactor of this type is defined by the characteristic time that, under certain conditions of agitation, eliminates the chemical and thermal gradients, and in practice it is important to reduce it without affecting the refractory line or excessively opening the slag layer.
The physical and numerical modeling of the ladle processes with scaled models using the appropriate similarity criteria has helped to understand the dynamic behavior of steel in high temperature operations of the refining process. Studies reported [3,4,5,6,7,8,9,10,11,13,18,19,20,22,24,25,26,27,28,29,30] scales ranging from 1:3 to 1:18, where, to optimize the mixing time, they modified the positions and the number of the nozzles or porous plugs, the height of the bath, the injection flows and the reactor form factors [3,4,8,13,14,24,30,31,32]. The effect of the nozzle diameter and its geometric shape was also investigated [6,12].
Research highlights the importance of achieving an adequate fluid dynamic structure [9,13,33,34], and others highlight that having a single recirculation that covers the entire diameter of the ladle helps to reduce mixing times [3,4], while others relate the mixing time with the amount of recirculatory flows to the inside of the reactor, stating that having more recirculation favors reducing mixing times [5]. The use of porous plugs in injecting the gas through the bottom of the ladle forms vertical plumes in a very similar way to a truncated cone. The gas plume when exiting the plug has a smaller diameter compared to that formed in the upper zone of the ladle because inertial forces predominate over buoyancy forces in this zone. In addition, the magnitude of the plume velocity is concentrated in an upward direction, which increases the likelihood of low velocity zones forming near the bottom of the ladle, especially in lower corners; however, they also sometimes form in the upper corners.
In order to modify the fluid dynamics of the gas plume, Shen et al. [35], by means of numerical simulation, placed a cylinder above the gas outlet of the nozzle, doing this in order to break the plume from the bottom. Xiao et al. [25] tested three types of nozzles with different shapes in the outlet geometry—one with a circular shape, one with a three-leaf clover shape, and the last one with a four-leaf clover shape—with the aim of reducing the height that the plume reaches once it breaks the slag layer, reporting that the exit geometry has an important impact on the height that the plume reaches once the slag layer breaks. Additionally, Fangguan et al. [36], in a water model, used three types of plugs with different slit geometries and diameters in order to investigate the effect of the diameter of the slit on the agitation of the steel; they found that as the diameter of the slit is increased, the time of mixing and the rate of elimination of inclusions diminish when the flow of gas is inferior to 5.26 NL∙min−1, being then that the plug is an important means to improve the efficiency of the agitation of the steel.
In this work, a plug with spiral-shaped channels with different torsion angles is proposed, with the objective that the gas, when passing through them, has a tangential velocity gain since it is known that this type of flow favors the mixing in reactors of other chemical processes [37,38,39]. Additionally, using PIV (particle image velocimetry) techniques, tracer injection and dye dispersion, its effect on mixing times is quantified in a physical model of a continuous casting ladle at a scale of 1:7. For the experimentation, we worked with two configuration injections, which in previous works were reported as the most efficient in mixing the steel in this ladle [3].

2. Materials and Methods

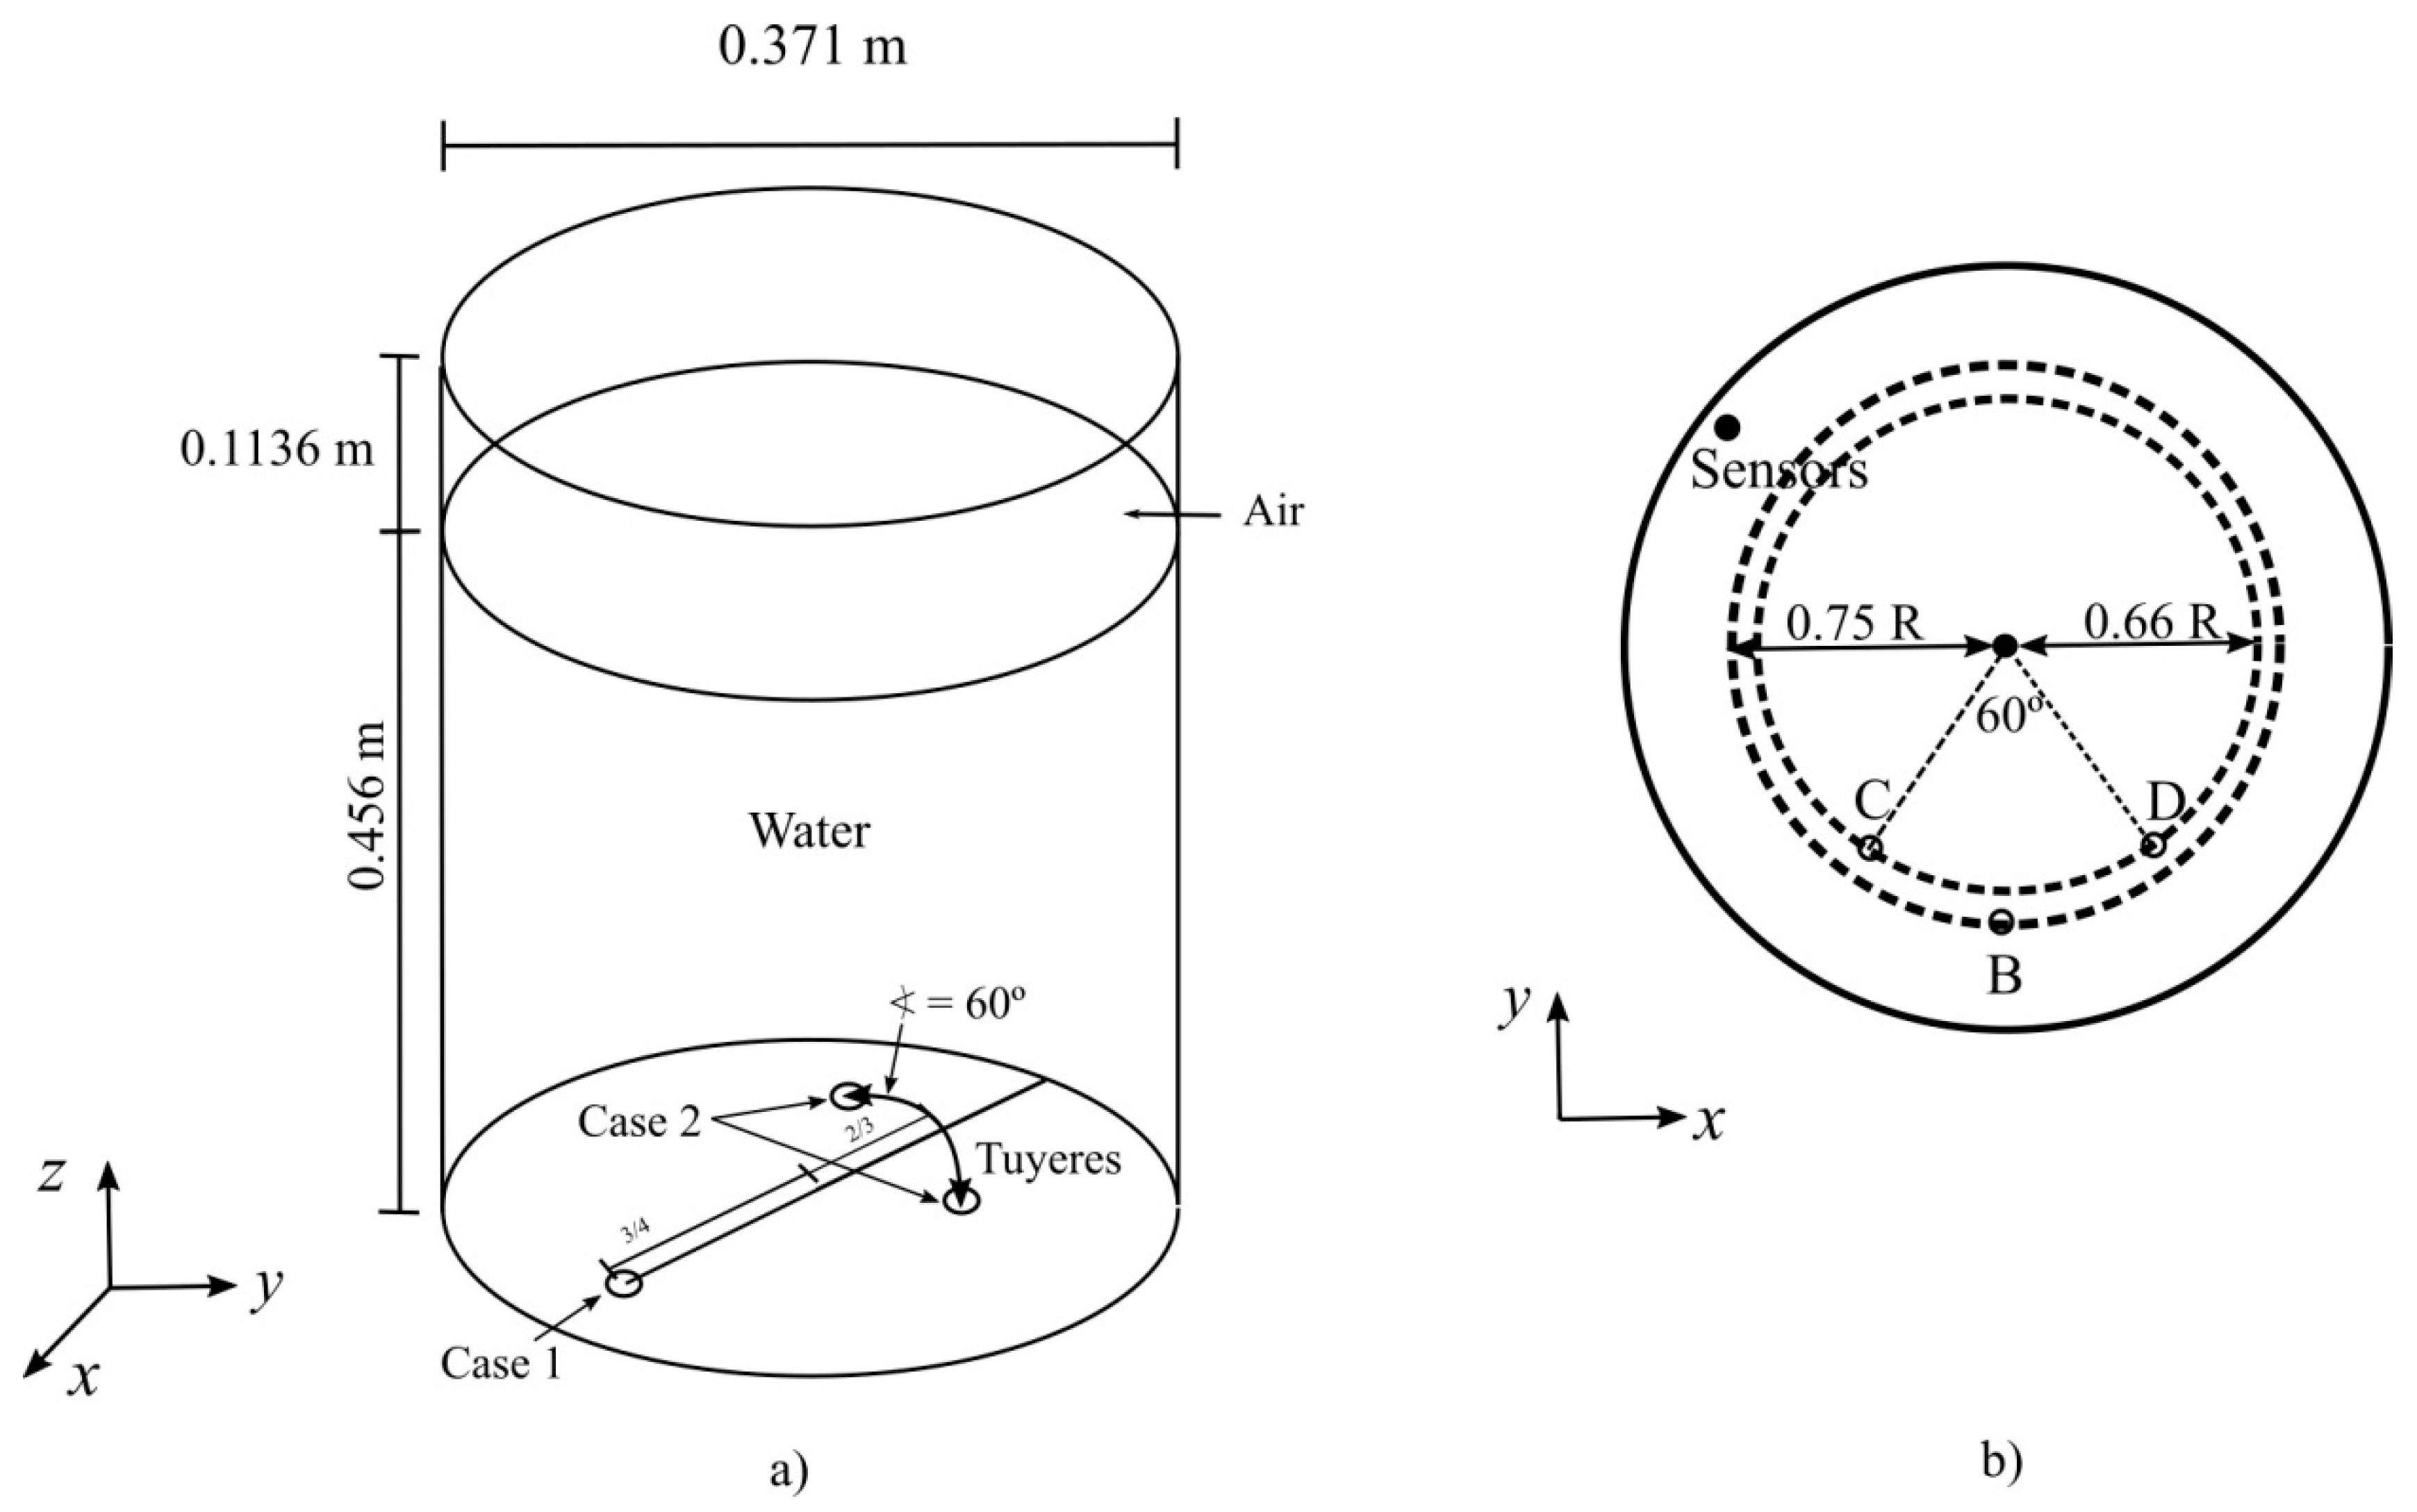
2.1. Experimental Configuration

For the construction of the acrylic model at a scale of 1:7, a ladle used in the industry was taken as a prototype. It has a capacity of 135 tons of steel and a maximum gas flow used in the industry for chemical adjustment and desulfurization of 1500 Nm3·min−1. The scaled model is shown in Figure 1a.
The air flow in the model is determined by the dynamic similarity criterion based on the modified Froude number, Frm = Frp. This is given by Equation (1), where Q is the gas flow in L/min, p is the density, d is the diameter and H is the height. From this expression, an air flow input value for the model of 4.9 L/min is obtained [3].
( Q m Q p ) 2 = ( ρ g a s ( p ) ρ g a s ( m ) ) ( ρ l i q u i d o ( m ) ρ l i q u i d o ( p ) ) ( d m d p ) 4 ( H m H p )
The stirring energy is supplied by the injection of air through the bottom of the ladle, which is shown in Figure 1. Two injection configurations are used in this work: the first consists of an injection of air (inlet B) placed at 0.75 R (0.75 or 3/4 distance from center to ladle wall). The second corresponds to a dual injection of air (inlets C and D) placed at 0.66 R (0.66 or 2/3 distance from the center to the wall of the ladle) 60° apart from each other. These tuyeres are located below the bottom of the ladle, and their scheme of these arrangements is shown in Figure 1b.
In order to determine the torsion angle of the channels that most favored the gain of a tangential velocity of the fluid when passing through the plugs, 5 plugs with spiral channels were designed and manufactured, which are shown in Figure 2. These plugs are also located below the bottom of the ladle, in the same way as the tuyeres.
These plugs are cylinders of 15.6 mm in diameter and 70 mm in height, with 5 channels whose torsion angles are: 30°, 60°, 90°, 120° and 180°. Their design was made in Solid Works software, and they were built on a Rostock V2 SeeMe CNC 3D printer with PLA material using a G code with CURA software. Each of these plugs was tested in a position closest to the center of the bottom (due to the impossibility of placing it in the center since the center is used for the injection of the tracer) in order to reduce the effect of the ladle walls on flow and to be able to better quantify the velocity distribution of the fluid as it exits the plugs. Subsequently, using the PIV technique, the fluid dynamics in a transverse plane at half the height of the model was characterized, and together with a statistical analysis of the magnitudes of the velocities in the plane, it was determined that the flow modifiers with torsion angles of 60° and 120° were those that carried out a better distribution of the velocities. The set of experiments carried out, as well as the arrangements used in the experimentation, is described in Table 1.

2.2. Mixing Time

Mixing time is defined as the time in which changes in the ion concentration have a deviation of less than ±5% at steady state in a liquid bath. This definition refers to the criterion of the time it takes to homogenize the liquid bath kept in constant motion to 95%, which is located in a container [25]. In this work, a stimulating agent (KCl with a molar concentration of 3.35 M) dissolved in water was used as a tracer solution. The experimental system is shown in Figure 3a.
Measurements were made until a quasi-stable state was reached. The tracer solution was introduced through the center of the ladle through a 0.0032 m diameter hose connected to a pipette. The hydrostatic pressure gradient was used to favor the dragging of the tracer by the kinematics of the fluid. The diffusion of this salt in the ladle was monitored by two sensors, which are shown in Figure 3a; the mixing time is affected by the position of the sensors [12,24,33] and the injection of the tracer [12,28], which is why the sensors should be placed in areas of low velocity or limited mixing so that the reading of the mixing time is more accurate [7,24,25,26,28]. Its location was determined using the colorimetry technique, which consists of injecting a tracer substance that does not modify the fluid dynamics of the system, for which 20 mL of a solution of red vegetable dye was injected, and the areas of low velocity or limited mixing on the top and bottom of the ladle.
The signal of the concentration of the saline solution was measured every second by conductivity sensors Oakton CON110 (series WD-35607-45) with graphite electrode. The data were sent to a data acquisition system (Keithley model KNM-TC42-RS232-C) and later processed in the computer to obtain the mixing time curves. The conductivity values were changed to concentration values by means of a calibration curve and their respective adjustment to a third-degree polynomial equation. The mixing time was determined considering the 95% homogenization criterion, which was reported in several studies [1,3,4,5,8,10,18,21,22,25,26,28,34,40,41]. The final result of the mixing time was taken as the average of a set of 5 experiments in each case for both sensors.

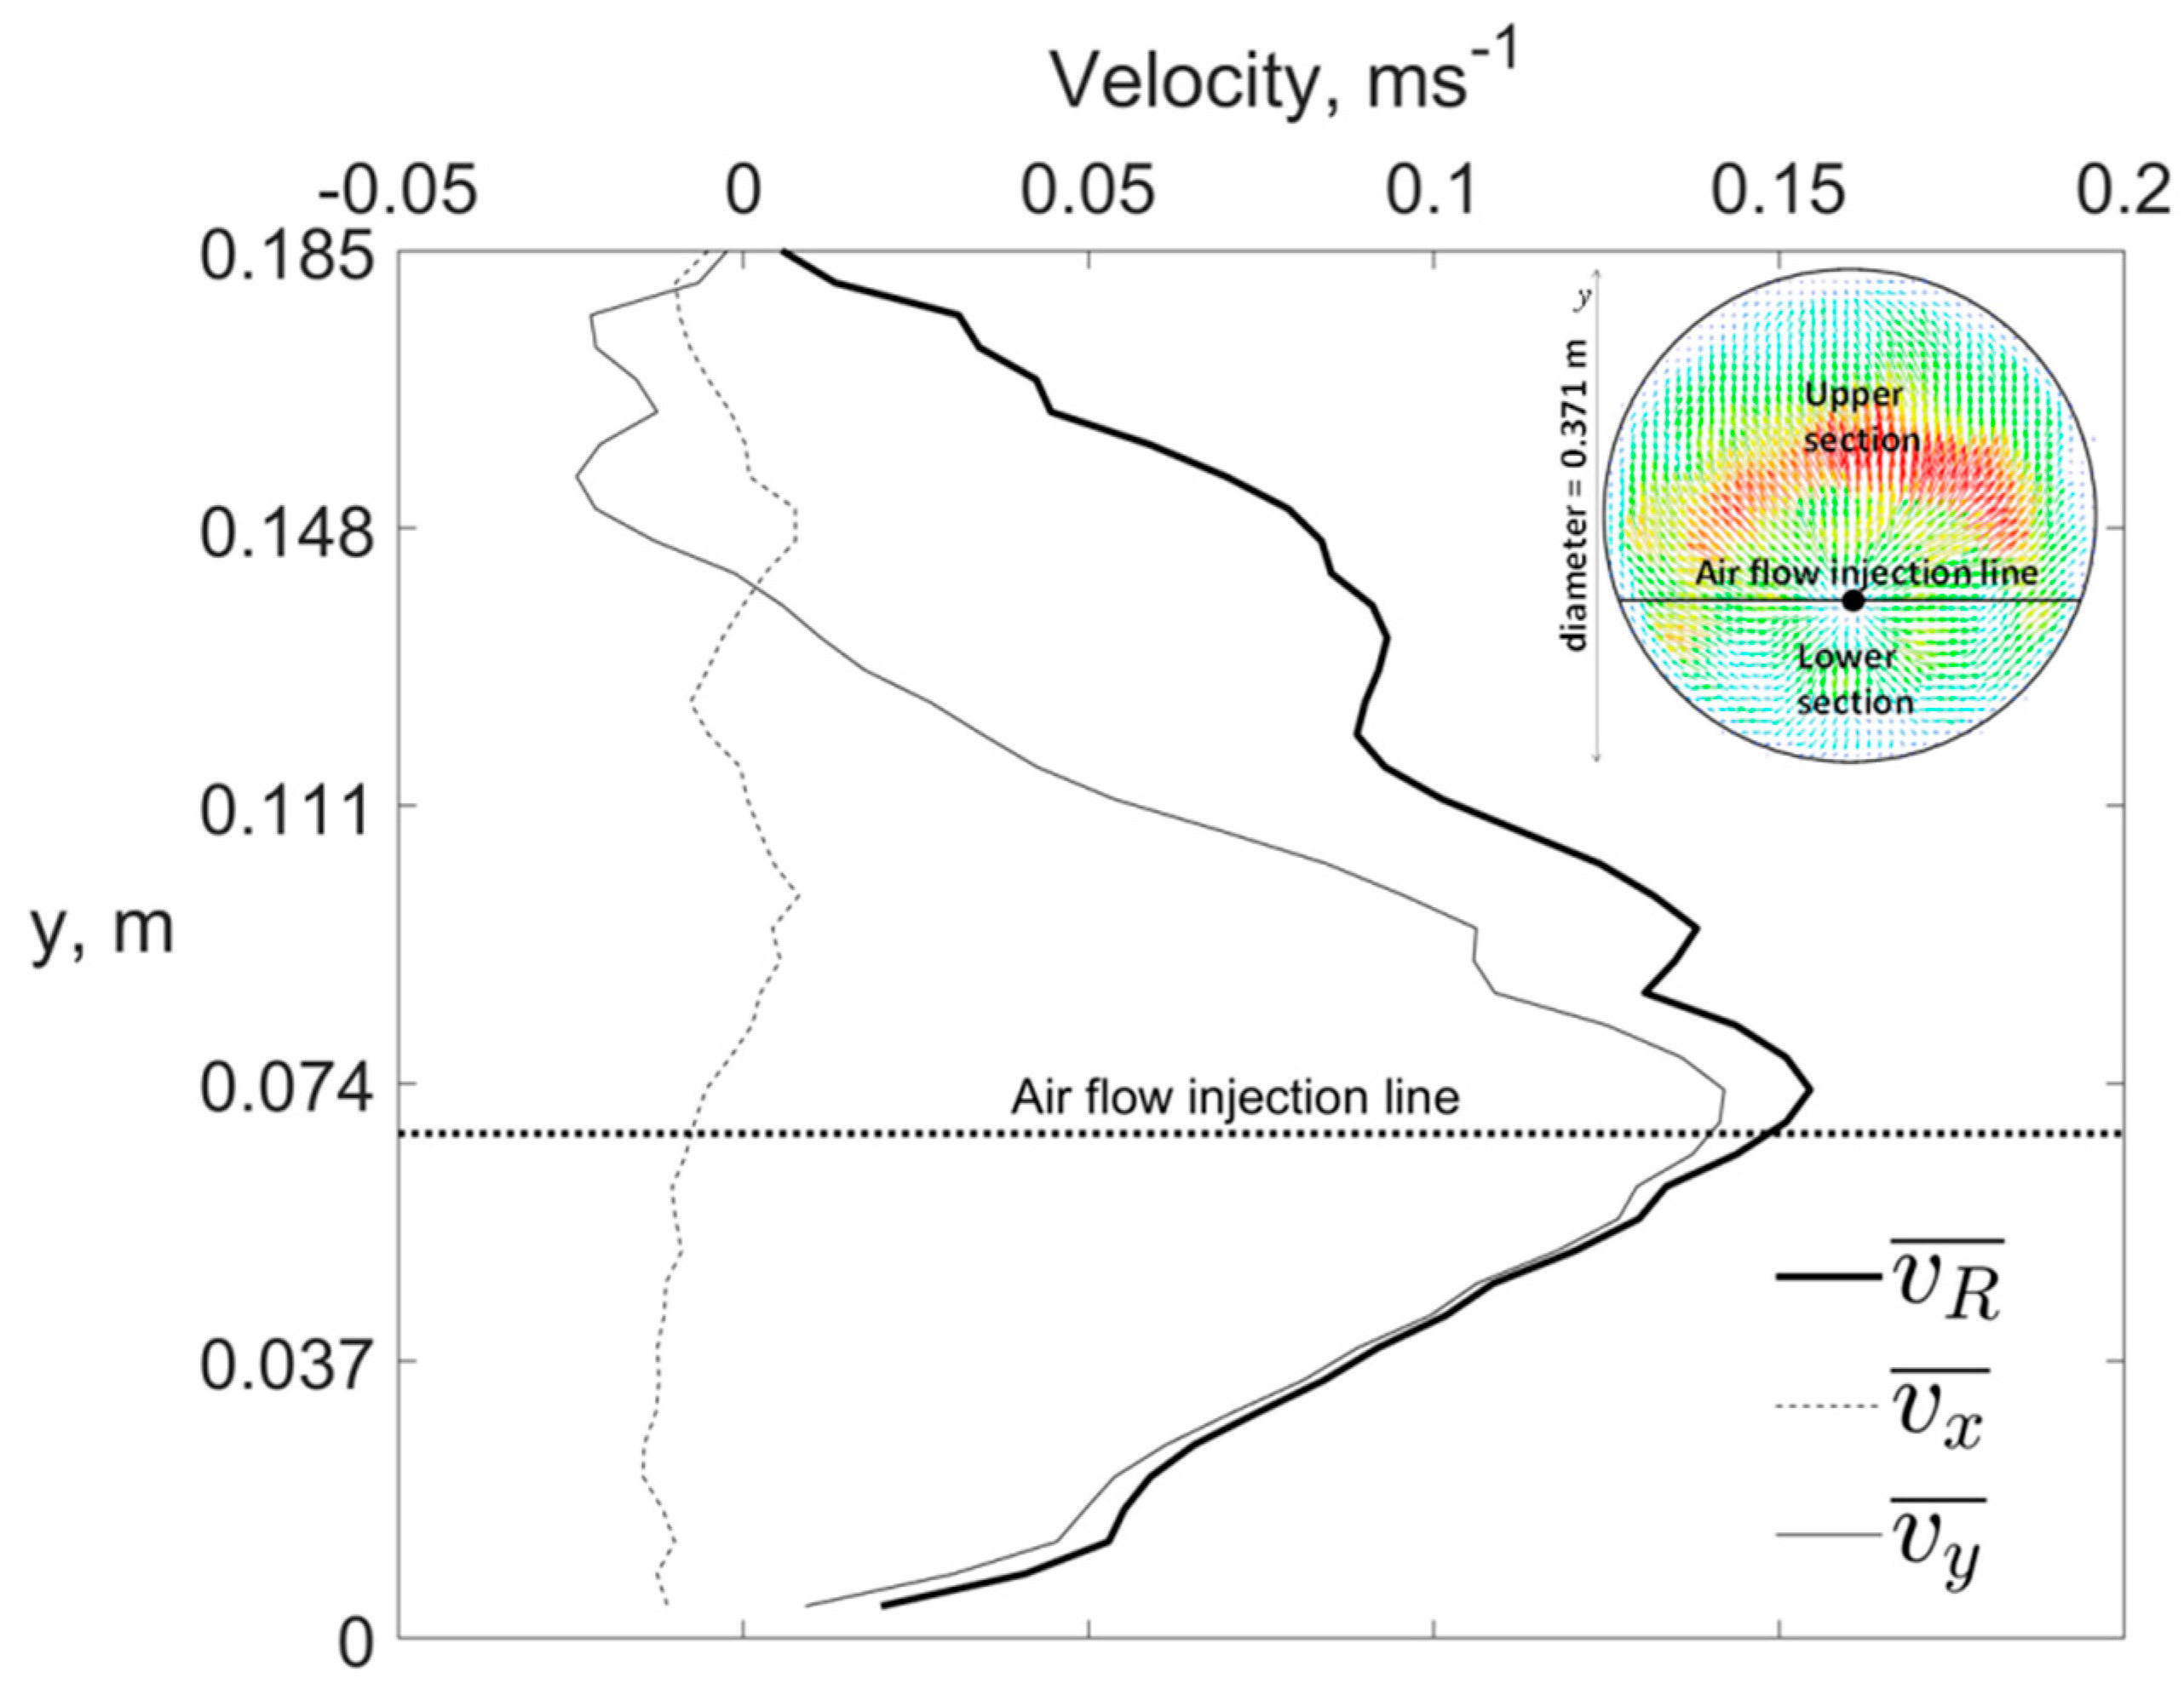
2.3. Obtaining the Velocity Fields with the PIV Technique

To obtain the flow velocity fields, the PIV technique (particle imaging velocimetry) was used. A total of 20 µm polyamide particles was distributed throughout the ladle in such a way that they reproduced the movement of the water. Velocity fields were obtained using a cross-correlation method, dividing the plane of interest into 32 × 32 pixel interrogation areas and subsequently using a statistical method. Streamlines and vorticity contours were also obtained in the same way.
The PIV used is a two-component speed system with high temporal resolution, with a Dual Power 30–1000 laser type, with energy pulses of up to 2 × 30 mJ and 20 kHz. This consists of a camera with a high-speed CMOS sensor. For each experiment with the PIV, 1000 images of the area of interest were taken in 2 s of real time at a laser operating frequency of 500 Hz. The images were processed by the commercial software Dynamic Studio to obtain the velocity fields, lines of current and vorticity contours. The instrumentation system used for this set of experiments is shown in Figure 3b, while the plane used is shown in Figure 3c.
For the configuration with only one injection, the vertical plane analyzed corresponds to that located on the air injection axis, while for the configuration with two injections, the analysis plane is located between the two inlets (Figure 3c). To avoid distortion in the photographs due to the cylindrical geometry of the ladle, a 0.006 m thick transparent acrylic cube was constructed, leaving at least 0.03 m of distance between the cube and the external wall of the ladle model. This space was filled with water, which was previously treated with a vacuum pump to eliminate the presence of bubbles.
To calculate the vorticity at a point, it was defined as the local rotation of a velocity field in 3D, defined by Equation (2):
ω ¯ = rot ( U ¯ ) = x U ¯ = ( W y V z ) i ¯ + ( U z W x ) j ¯ + ( V x U y ) k ¯ ,
where each term describes the rotation around the x, y and z axes respectively. Flat data gradients in the x direction cannot be calculated, so the only rotation in the x axis can be determined as:
ω x = W y V z

3. Results and Discussion

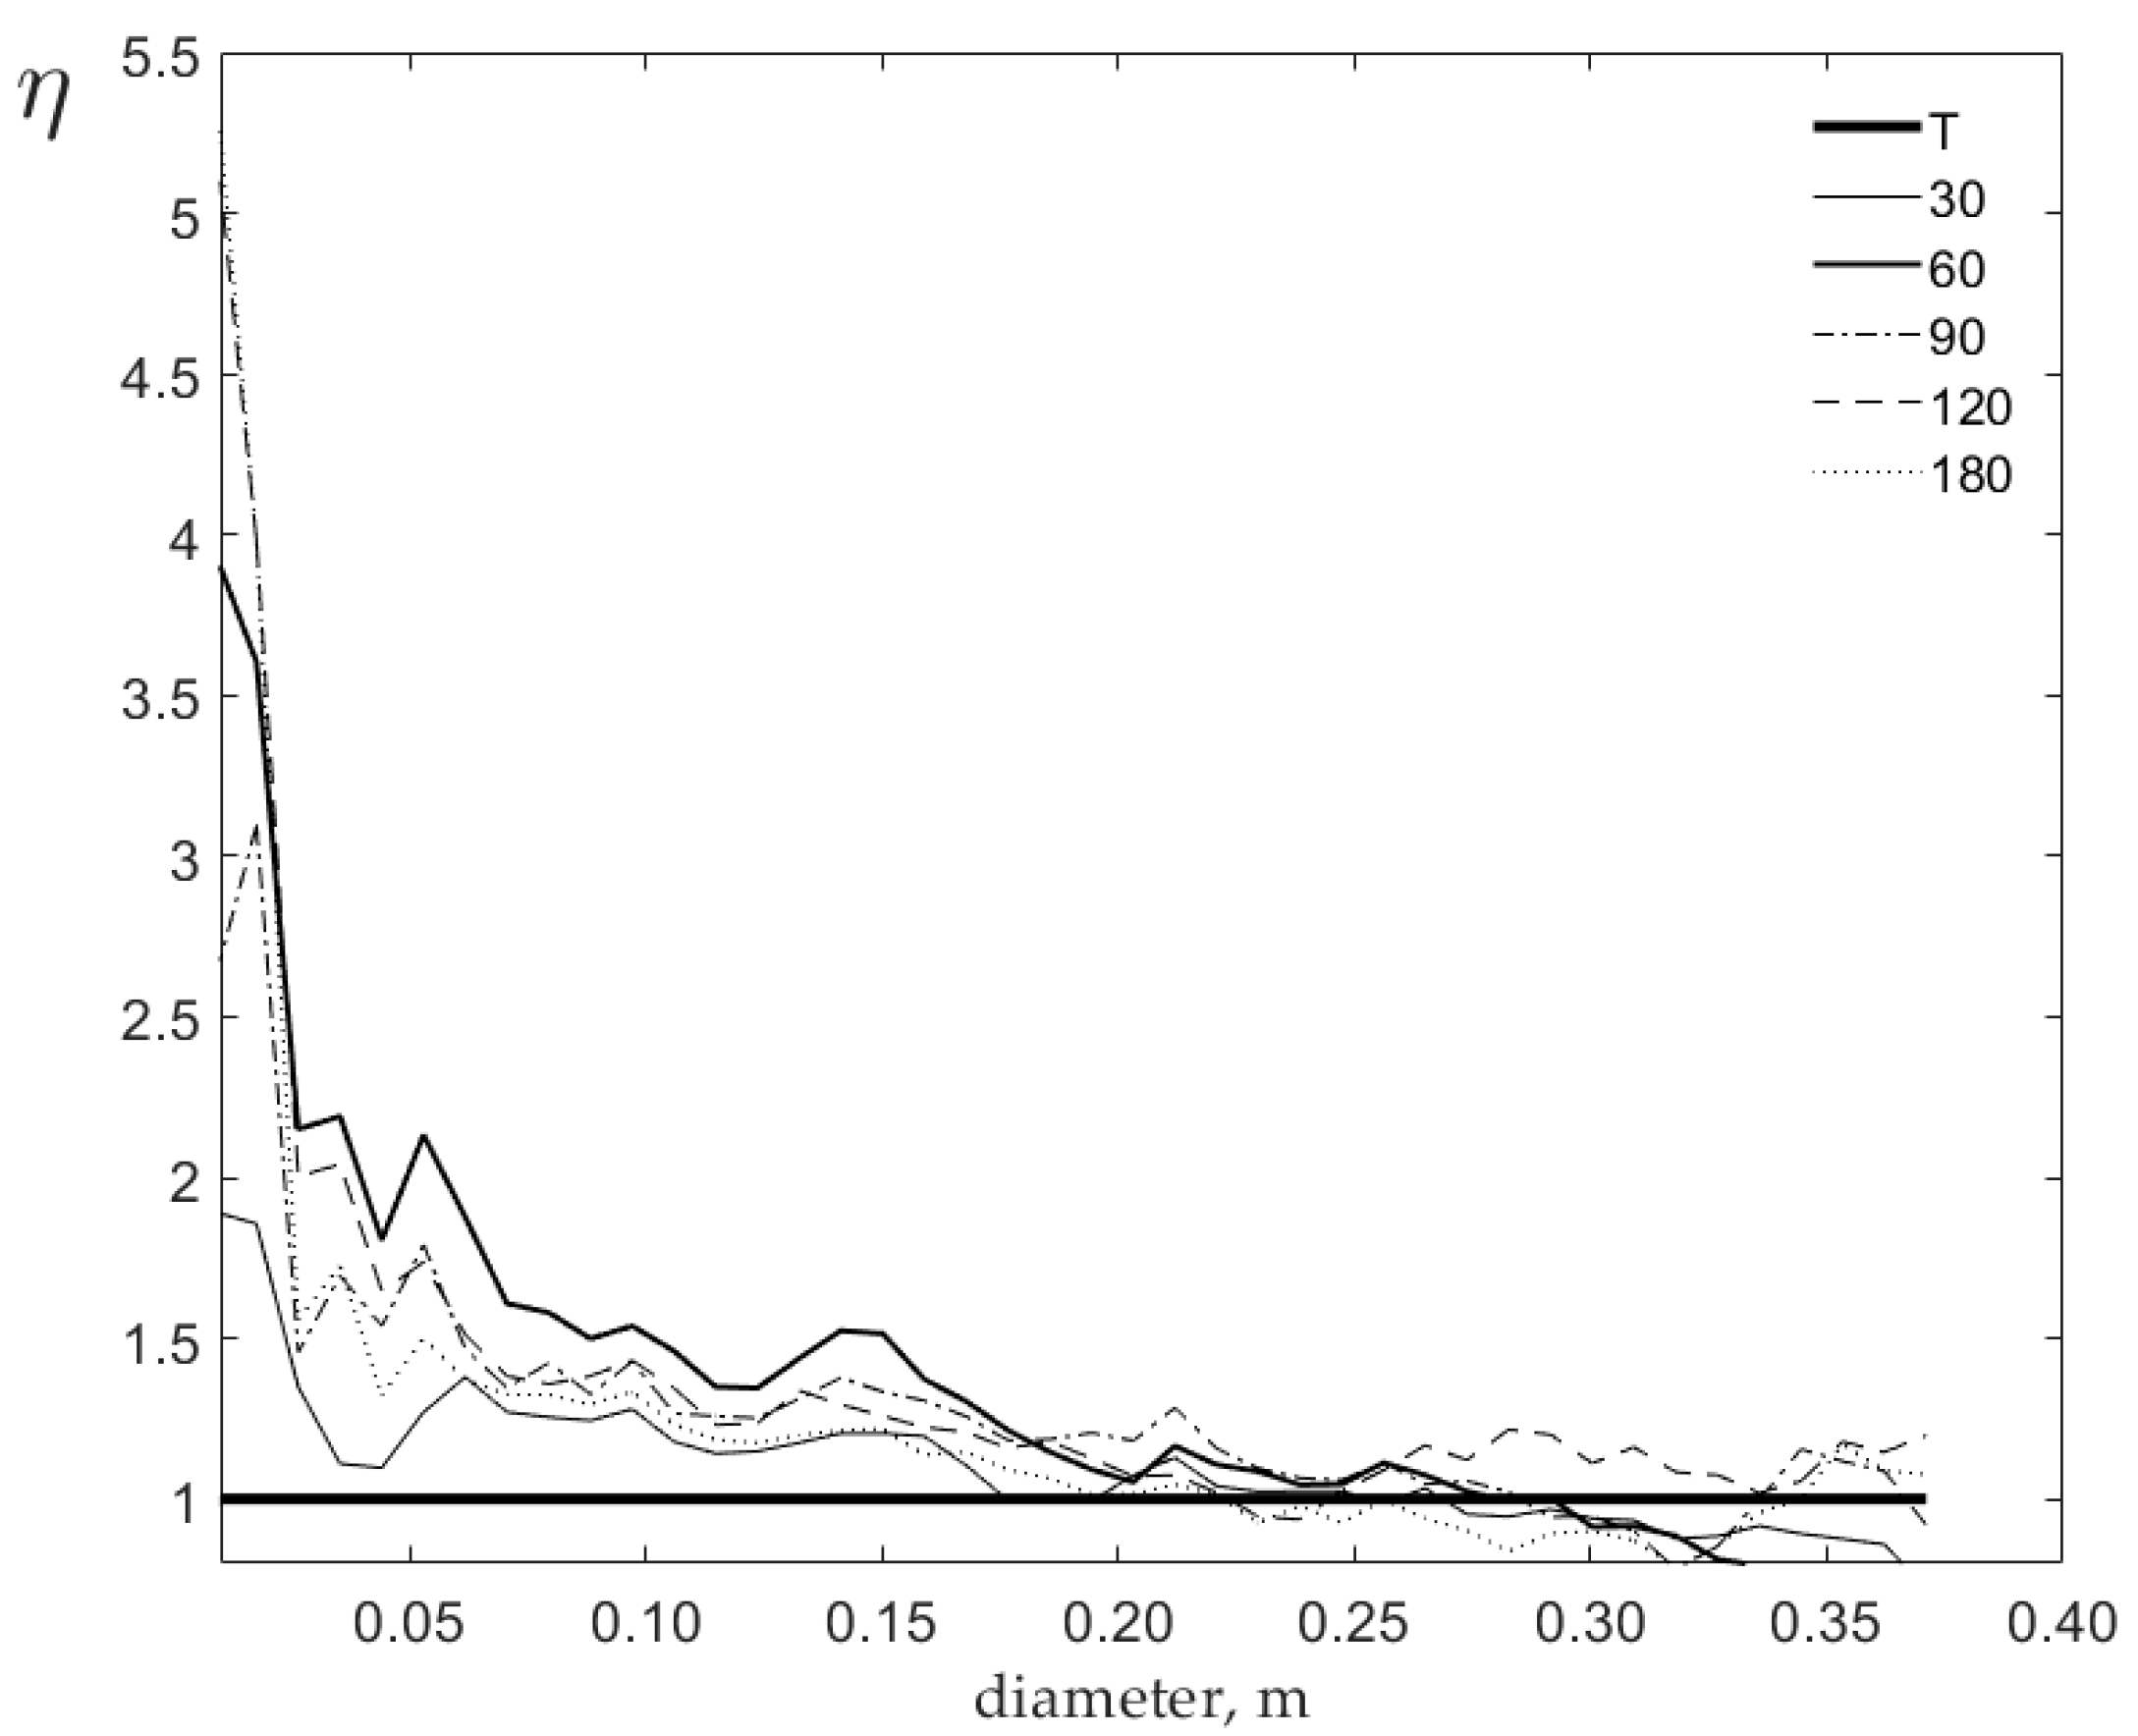
3.1. Selection of the Torsion Angle in the Flow Modifiers
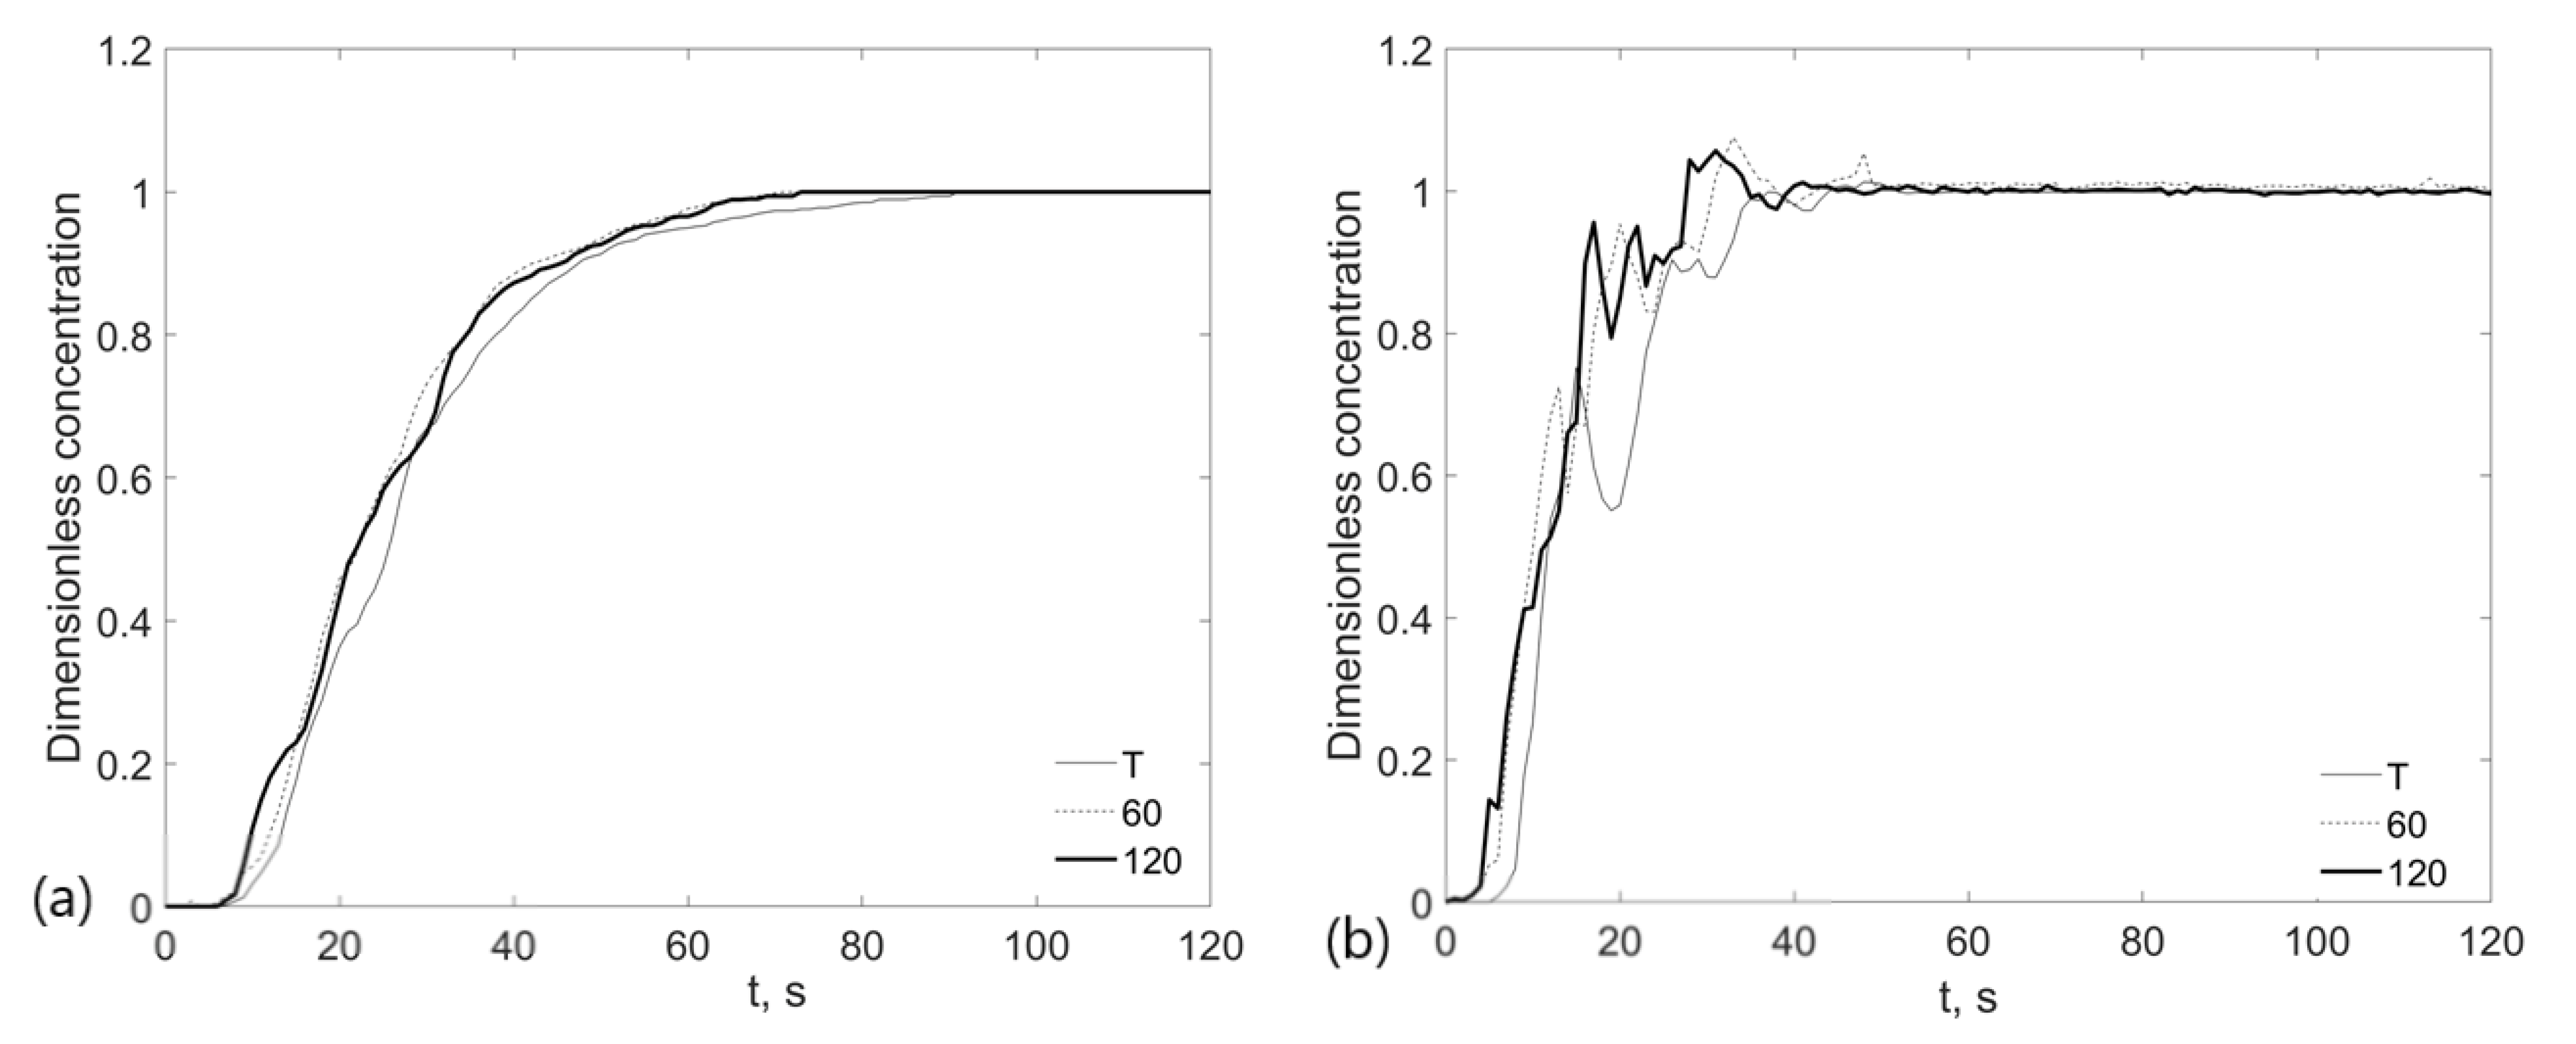
Figure 4 and Figure 5 show the contours and velocity fields in a transverse plane at half the height of the ladle model for the cases with a tuyere and for each of the plugs with the channels at different torsion angles.
Low velocity zones (according to the color scale and marked with 1) or where the magnitude of the velocity is concentrated on the z axis, are located near the walls of the ladle and at the location of the plume to all cases. However, these zones present a greater extension for the case with tuyere, both in the contours and in the velocity vector fields (see Figure 4a and Figure 5a) and tend to decrease as the torsion angle of the plug channels is increased (see Figure 4 and Figure 5), which corroborate that the torsion of the channels helps the magnitude of the velocity to be distributed in the three axes and is not concentrated only on the z axis. In the velocity contours for the tuyere case, an area is observed where the velocity magnitudes are the highest (marked with the number 3 in Figure 4a). This zone is located in the upper part of the injection location; as the torsion angle increases, it presents a better distribution throughout the 360°, and its area increases (see Figure 4b–f and Figure 5b–f). However, it is in the case with an angle of 60° (Figure 4c and Figure 5c), where this area is more evenly distributed throughout the 360°, followed by the case with the angle at 120° (Figure 4e and Figure 5e). This favors the zones of low velocity (or where the magnitude of the velocity is located on the z axis), which tend to decrease with the use of the plugs with the channels with torsion angles, which could favor to have better agitation and decrease mixing times. In addition, in Figure 4a and Figure 5a (case with tuyere), it is also observed that there is a certain separation between the location of the injection that is at the bottom of the ladle and the location of the plume in the plane. This would be caused by a curvature of the plume, which tends to decrease as the torsion angle increases and allows a more vertical plume (see Figure 4 and Figure 5), being that the cases with angles of 60°, 90° and 180° best represent this behavior.
To quantitatively determine the effect of the modifiers, spatial averaging in the x direction is carried out: the mean resultant of the velocity v R ¯ , the mean y component v y ¯ and the mean x component v x ¯ are so obtained (rows of the velocity fields in Figure 5). Figure 6 shows these quantities for the case of the ladle with the tuyere (case a of Figure 5) along the diameter of the ladle (where y = 0 m and y = 0.371 m represent the diametrically opposite sides of the ladle). The velocities at y = 0.135 m correspond to the air flow injection line. For the case of v R ¯ , and v y ¯ their highest magnitudes are located around this line. With respect to v x ¯ , their values fluctuate around zero. A clear anisotropy is observed between the values of v x ¯ and v y ¯ , being that v y ¯ is the one that contributes the most to the resulting velocity. The effect of the wall below the injection prevents the developing of higher velocities. This analysis was carried out for all the cases shown in Figure 5.
To determine the advantage of the use of flow modifiers over the use of the tuyere with respect to the increase in velocities, the value of η = V R ¯ modifier / v R ¯ tuyere was calculated, which is defined as the ratio between the resulting velocities with the flow modifier V R ¯ modifier and in the case of the tuyere v R ¯ tuyere . Figure 7 shows the value of η for all the cases studied along the diameter of the ladle.
The value of η = 1 corresponds to the case of η = V R ¯ tuyere / v R ¯ tuyere . The area above this line and below the curve correspond to the benefit, i.e., the velocity increase in the velocity resultant for each case studied. This area is found in Table 2.
From these values, modifiers with torsion angles of 60° and 120° were selected to study the mixing time and agitation of the system since these have the greatest effect on increasing the resulting velocities in this plane.

3.2. Mixing Times

Figure 8 shows the time-concentration graphs in the two sensors for the cases analyzed at 0.75 R. Both curves represent the dimensionless average of the data obtained from five experiments carried out on each sensor, respectively.
In the graphs, it is observed that in the first 40 s, the curves of the flow modifiers with the angles of 60° and 120° have a greater slope with respect to the curve where the tuyere is used. This tells us that there is greater agitation in these two cases, which is verified in the final results shown in Table 3, where the mixing times are presented for all the cases analyzed.
Table 3 shows that for the cases with 1 tuyere at 0.75 R and 2 tuyeres at 0.66 R, the difference is 1 s; however, for the case with 1 tuyere at 0.75 R, the mixing time decreases by 22% when the modifier is used with a torsion angle of the channels of 60° and 20% with a torsion angle of 120°. On the other hand, for the case of 2 tuyeres at 0.66 R, the mixing time decreases by 11% when the modifier is used with a torsion angle of the channels of 60° and 8% with a torsion angle of 120°.
Therefore, it can be concluded that the channels with a torsion angle work better when there is a single injection and when there is a torsion angle of the channels of 60°. In Figure 9, photographs of the plume obtained from experimentation with the PIV are shown.
In these, it is observed that with the injection with a tuyere, the plume tends to curve and impacts with the wall of the ladle (see point 1), causing the plume to deform in its upward trajectory. With the use of the modifier with an angle of 120° the trajectory of the plume is kept close to the wall but without touching it, while in the case of the modifier with the angle of 60°, its trajectory is maintained on the axis of the injection. This change in the trajectory of the plume with the use of the modifiers improves the transfer of momentum from the air to the water, which can be seen in Figure 10 in the velocity vector fields. There, the velocities in the plume tend to be higher in the cases where modifiers are used, finding the highest velocities and a greater thickness of the plume for the case of the modifier with torsion channels at 60° and the lowest for the case with a tuyere.
The channels with the torsion angles give a certain tangential velocity to the air that allows the plume to maintain a more vertical trajectory and at the same time improve the transfer of momentum to the fluid in the area near the surface marked with the number 2. There, for the cases with the modifiers, the fluid velocity vectors are located in the y direction, favoring the recirculation of the fluid toward the opposite wall of the injection, as confirmed by the vorticity contours for that same zone, where the rotation toward the opposite wall of the injection is stronger for the cases with the modifiers (see Figure 10g–i). With the use of the tuyere, the velocity magnitudes are lower for this same area (point 2), and the velocity magnitude is divided into the y y z component, favoring a more upward orientation as observed in the streamlines for the same area. This could lead to a greater opening area of the slag layer (see Figure 10a–c).
It can also be observed in the vorticity contours in the zone of influence of the plume (see Figure 10g–i) that the area of the blue contours increases and is more uniform with the use of the modifiers, which indicates that there is a greater tendency to rotate the fluid toward the opposite wall of the injection. Likewise, at the bottom of the ladle in the area marked with the number 3, it is observed that the red vorticity contours predominate in the cases with the modifiers promoting the regulation of the fluid toward the wall of the injection as shown in streamlines for the same area.
For the cases with a modifier, all of the above favor a spiral rotational movement that encompasses the entire plane of the ladle, with paths of the streamlines being closed, establishing itself in a better way for the case with the 60° modifier, where only a single vorticity is observed (see Figure 10e). This is not the case with the 120° modifier, where a main vorticity and a smaller vorticity are observed (see Figure 10f). In the case of the tuyere, it is not possible to establish a spiral rotation movement with closed paths of the streamlines, and three small vorticities are formed distributed within the plane (see Figure 10d). These vorticities could act as sinks of the tracer, in addition to the collision of the streamlines of the vortices in opposite directions; non-slip conditions would be established that decrease the transfer of mass and momentum. In Table 3, it can be seen that the case with the best mixing time is the modifier with the torsion channels at 60°, which presents a single vorticity that occupies the entire plane, which coincides with that reported in other works, where it is believed that this type of movement pattern helps to make agitation more efficient [3,4].
For the case with 2 injections in Figure 11a, it is observed that, just as when the ladle has 1 injection, the plume tends to curve and hits the wall of the ladle (see point 1), causing the plume to deform in its trajectory, ascending and bending down to the center, causing the formation of a vorticity near the surface (see point 2).
With the use of modifiers, the plume stays close to the wall but without impacting against it. This helps that in the area near the surface marked with the number 4 in Figure 12b,c, the magnitude of the vectors is concentrated in the y direction, contrary to what happens with the use of the tuyere, where the magnitude of the velocity is distributed in the y and z components, favoring a upward orientation, as observed in the streamlines for the same zone, which could cause a greater opening area of the slag layer (see Figure 12d–f). As in the case with 1 injection, it can be observed in the vorticity contours, in the zone of influence of the plume (see Figure 12g–i), that the area of the red contours increases and is more uniform with the use of the modifiers and that in the area marked with the number 4 for the cases with modifiers, it is observed that the red contour has a greater extension, lengthening toward the center of the ladle, indicating that there is a greater tendency to rotate from the fluid toward the opposite wall of the injection. Additionally, at the bottom of the ladle in the area marked with the number 5, it is shown that the blue vorticity contours predominate in the cases with the modifiers (see Figure 12h,i), indicating a recirculation of the fluid toward the wall of the injection as shown in the streamlines for the same zone in Figure 12e,f.
All of the above favor that the vorticity covers the entire plane, and that the mass transport occurs more efficiently in these cases, as shown by the results of the mixing times in Table 3. However, there are small differences in the cases with modifiers, as in both cases, a single vorticity is formed as seen in Figure 12e,f. Although the eye of the vortex is presented in different locations, for the modifier with the torsion channels at 120°, the eye of the vortex is located more toward the center, which favors a concentration of the tracer in that area, or that the time it takes for the tracer to reach that point is increased. In the case of the modifier with torsion channels at 60°, the eye is located below the eye position of the vortex for the modifier at 120° and close to the plume, which allows the tracer that reaches this area to be reincorporated faster to the total volume, improving the mixing times, as shown in the results of Table 3, where this case has the best mixing time for when we have two injections.
In contrast to the use of the tuyere, the vorticity takes on an oval shape with an upward direction, with the eye of the vortex being closer to the opposite wall of the injection and closer to the surface than to the bottom. This location of the eye of the vortex favors a concentration of the tracer in that area, or the time it takes for the tracer to reach that point increases, reflecting in longer mixing times as observed in Table 3.
The different mixing times between the angles of 60° and 120° have to do with the efficiency in the transfer of momentum from the plume to the fluid in the area near the bottom of the ladle since a better transfer in this area favors a better stirring time and, as a consequence, a better mixing time. In Figure 5, the velocity fields are shown in a transverse plane at half the height of the ladle at different angles (0, 30°, 60°, 90°, 120° and 180°), and it is shown that for the 60° angle, the area with higher magnitude velocities is bigger with respect to the smaller angles and is better distributed throughout the 360 degrees of the plane. With respect to the other angles, the one that comes closest to this distribution is the 120° angle, concluding that the torsion of the channels favors that the momentum transfer from the gas to the liquid is not concentrated only in the upward direction and that it is also present in the radial direction, with the angle of 60° being the one that presents better transfer in the radial direction as well as better distribution throughout the 360 degrees, followed by the 120° angle.

4. Conclusions

In this research work, the use of flux modifiers with different torsion angles in the injection plugs of an acrylic model of a secondary refining ladle on a scale of 1:7 was characterized by means of the PIV and conductivity techniques. Two positions injection were used: the first located at 0.75 times the radius value and the second located at 0.66 times the radius value. According to the results obtained during the physical modeling of the agitation of the liquid with the injection of gas through the use of a tuyere and the modifiers with the torsion channels, the following can be concluded:
-
The mixing times for the two injection cases with the use of the tuyere are very similar, with 91 s for the case with one localized injection at 0.75 R and 92 s for the case with two localized injections at 0.66 R.
-
The use of modifiers with torsion channels with angles of 60° and 120° improves the mixing times for the two injection cases. For the case of one single injection (0.75 R), the mixing time decreases by 22% when the modifier is used with a torsion angle of the channels of 60° and 20% with a torsion angle of 120°. For the case of two injections (0.66 R), the mixing time decreases by 11% when the modifier is used with a torsion angle of the channels of 60° and 8% with a torsion angle of 120°.
-
The channels with the torsion angles give a certain tangential velocity to the air. This allows the plume to maintain a more vertical trajectory and generate fluid dynamics that promote a spiral rotational movement that spans the entire plane of the ladle with closed streamlines paths. This flow pattern is seen more clearly when the modifier is used with the torsion angle at 60°.
-
Of the two torsion angles, the 60° angle is the one with which the best mixing times are obtained both for one injection at 0.75 R and for two injections at 0.66 R.

Author Contributions

Conceptualization, G.S.-D.; methodology, G.S.-D. and G.A.; validation, G.S.-D. and G.A.; formal analysis, G.A., G.S.-D. and A.A.-C.; investigation, G.A. and F.S.; resources, G.S.-D.; writing—original draft preparation, G.A., G.S.-D. and A.A.-C.; writing—review and editing, G.S.-D., J.A.R.-B., C.A.H. and G.A.; images, C.A.H. and G.A.; acquisition of data graphs, A.A.-C.; supervision, G.S.-D.; project administration, G.S.-D. and G.A.; funding acquisition, G.S.-D. All authors have read and agreed to the published version of the manuscript.

Funding

This research received no external funding.

Data Availability Statement

Not applicable.

Acknowledgments

The authors want to acknowledge to the UMSNH-FIM for the support with the material and equipment in this project, to the Conacyt for its financial support to carry out this work, as well as TecNM-ITM, CÁTEDRAS-CONACYT and SNI for their academic support.

Conflicts of Interest

The authors declare no conflict of interest.

References

  1. Irons, G.; Senguttuvan, A.; Krishnapisharody, K. Recent advances in the fluid dynamics of ladle metallurgy. ISIJ Int. 2015, 55, 1–6. [Google Scholar] [CrossRef] [Green Version]
  2. Birat, J.P. Impact of steelmaking and casting technologies on processing and properties of steel. Ironmak. Steelmak. 2001, 28, 152–158. [Google Scholar] [CrossRef]
  3. Gonzalez, R.; Solorio, G.; Ramos, A.; Torres, E.; Hernandez, C.; Zenit, R. Effect of the fluid-dynamic structure on the mixing time of a ladle furnace. Steel Res. Int. 2017, 55, 1700281. [Google Scholar] [CrossRef]
  4. Villela, J.J.; Ramos, J.A.; Hernandez, C.A.; Urióstegui, A.; Solorio, G. Optimization of the mixing time using asymmetrical arrays in both gas flow and injection positions in a dual-plug ladle. ISIJ Int. 2020, 60, 1172–1178. [Google Scholar] [CrossRef] [Green Version]
  5. Nunes, R.P.; Pereira, J.A.M.; Vilela, A.C.F.; Der Laan, F.T.V. Visualisation and analysis of the fluid flow structure inside an elliptical steelmaking ladle through image processing techniques. J. Eng. Sci. Technol. 2007, 2, 139–150. [Google Scholar]
  6. Terrazas, M.; Conejo, A. Effect of nozzle diameter on mixing time during bottom-gas injection in metallurgical ladles. Metall. Mater. Trans. B 2015, 46, 711–718. [Google Scholar] [CrossRef]
  7. Krishna, G.G.; Mehrotra, S.P.; Ghosh, A. Experimental investigation of mixing phenomena in a gas stirred liquid bath. Metall. Trans. B 1987, 19, 839–850. [Google Scholar]
  8. Amaro, A.M.; Ramirez, M.A.; Conejo, A.N. Effect of slag properties on mixing phenomena in gas-stirred ladles by physical modeling. ISIJ Int. 2014, 54, 1–8. [Google Scholar] [CrossRef] [Green Version]
  9. Kuo, T.; Kuo, J. Determination of mixing time in a measurement in a ladle-refining process using optical image processing. ISIJ Int. 2011, 51, 1597–1600. [Google Scholar] [CrossRef]
  10. Mazumdar, D.; Dhandapani, P.; Sarvanakumar, R. Modeling and optimisation of gas stirred ladle systems. ISIJ Int. 2017, 57, 286–295. [Google Scholar] [CrossRef] [Green Version]
  11. Helle, L.W. The calculation of the time required to mix liquid metal in a ladle by gas rising. J. South. Afr. Inst. Min. Metall. 1981, 81, 329–337. [Google Scholar]
  12. Gajjar, P.; Haas, T.; Owusu, K.B.; Eickhoff, M.; Kowitwarangkul, P.; Pfeifer, H. Physical study of the impact of injector design on mixing, convection and turbulence in ladle metallurgy. Eng. Sci. Technol. Int. J. 2019, 22, 538–547. [Google Scholar] [CrossRef]
  13. Ramírez-Argaez, M.A.; Tapia, J.; Espinoza, J.; Alcantar, E. Modelación matemática del mezclado en hornos-cucharas agitadas con gas. Revista de Metalurgia 2006, 42, 56–75. [Google Scholar] [CrossRef]
  14. Cloete, S.; Eksteen, J.J.; Bradshaw, S.M. A numerical modelling investigation into design variables influencing mixing efficiency in full scale gas stirred ladles. Miner. Eng. 2013, 46, 16–24. [Google Scholar] [CrossRef]
  15. Torres, S.; Barron, M.A. Numerical simulations of an argon stirred ladle with top and bottom injection. Open J. Appl. Sci. 2016, 6, 860–867. [Google Scholar] [CrossRef] [Green Version]
  16. Yu, S.; Zou, Z.S.; Shao, L.; Louhenkilpi, S. A theoretical scaling equation for designing physical modeling of gas-liquid flow in metallurgical ladles. Steel Res. 2016, 87, 1600156. [Google Scholar] [CrossRef]
  17. Krishnapisharody, K.; Irons, G. A critical review of the modified Froude number in ladle metallurgy. Metall. Mater. Trans. B 2013, 44, 1486–1498. [Google Scholar] [CrossRef]
  18. Gómez, A.S.; Conejo, A.N.; Zenit, R. Effect of separation angle and nozzle radial position on mixing time in ladles with two nozzles. J. Appl. Fluid Mech. 2018, 11, 11–20. [Google Scholar] [CrossRef]
  19. Ramasetti, E.K.; Visuri, V.V.; Sulasalmi, P.; Palovaara, T.; Gupta, A.K.; Fabritius, T. Physical and CFD modeling of the effect of top layer properties on the formation of open- eye in gas-stirred ladles with single and dual-plugs. Steel Res. Int. 2019, 90, 1–13. [Google Scholar] [CrossRef]
  20. Zheng, S.; Zhu, M. New process with argon injected into ladle around the tapping hole for controlling slag carry-over during continuous casting ladle. Metals 2018, 8, 624. [Google Scholar] [CrossRef] [Green Version]
  21. Liu, Y.; Bai, H.; Liu, H.; Ersson, M.; Jonsson, P.G.; Gan, Y. Physical and numerical modelling on the mixing condition in a 50 t ladle. Metals 2019, 9, 1136. [Google Scholar] [CrossRef] [Green Version]
  22. Calderon, F.A.; Morales, R.; Chattopadhyay, K.; Garcia, S. Fluid flow turbulence in the proximities of the metal-slag interface in ladle stirring operations. Metals 2019, 9, 192. [Google Scholar] [CrossRef] [Green Version]
  23. Xiao, J.; Yan, H.; Liu, L.; Möller, F.; Hu, Z.; Unger, S. Effect of bath depth and nozzle geometry on spout height in submerged gas injection at bottom. Metall. Mater. Trans. B 2019, 50, 3002–3011. [Google Scholar] [CrossRef]
  24. Conejo, A.N.; Kitamura, S.; Maruoka, N.; Kim, S. Effects of top layer, nozzle arrangement, and gas flow rate on mixing time in agitated ladles by bottom gas injection. Miner. Mater. Soc. ASM Int. 2013, 44, 914–923. [Google Scholar] [CrossRef]
  25. Ni, S.; Wang, H.; Zhang, J.; Lin, L.; Chu, S. A novel criterion of mixing time in gas-stirred ladle systems. Acta Met. Sin. 2014, 27, 1008–1011. [Google Scholar] [CrossRef]
  26. Chen, C.; Rui, Q.; Cheng, G. Effect of salt tracer amount on the mixing time measurement in a hydrodynamic model of gas-stirred ladle system. Steel Res. Int. 2013, 84, 900–907. [Google Scholar] [CrossRef]
  27. Zambrano, H.; Bencomo, A.; Trujillo, L.; Sigalotti, L. Numerical simulation of a gas-stirred ladle. In Selected Topics of Computational and Experimental Fluid Mechanics; Springer: Cham, Switzerland, 2015; pp. 271–280. [Google Scholar] [CrossRef]
  28. Shanqiang, N.; Shaojun, C.; Jun, Z.; Zhongsi, L. Water model study on mixing time in shaking ladle. In Proceedings of the Thirteenth International Ferroalloys Congress Efficient Technologies in Ferroalloy Industry, Almaty, Kazakhstan, 9–13 June 2013. [Google Scholar]
  29. Mazumdar, D.; Guthrie, R.I.L. Numerical computation of flow and mixing time in ladle metallurgy steelmaking operations C.A.S. Method. Appl. Math. Model. 1986, 10, 25–32. [Google Scholar] [CrossRef]
  30. Becker, J.U.; Oeters, F. Model experiments of mixing in steel ladles with continuous addition of the substance to be mixed. Steel Res. 1998, 69, 8–16. [Google Scholar] [CrossRef]
  31. Lou, W.; Zhu, M. Numerical simulations of inclusion behavior and mixing phenomena in gas-stirred ladles with different arrangement of tuyeres. ISIJ Int. 2014, 54, 9–18. [Google Scholar] [CrossRef] [Green Version]
  32. Cheng, R.; Zhang, L.; Yin, Y.; Zhang, J. Effect of side blowing on fluid and mixing phenomenon in gas stirred ladle. Metals 2021, 11, 369. [Google Scholar] [CrossRef]
  33. Aoki, J.; Thomas, B.G. Experimental and theoretical investigation of mixing in a bottom gas-stirred ladle. AISTech Proc. 2004, 1, 1045–1056. [Google Scholar]
  34. Turkoglu, H.; Farouk, B. Mixing time and liquid circulation in steelmaking ladles with vertical gas injection. ISIJ Int. 1991, 31, 1371–1380. [Google Scholar] [CrossRef] [Green Version]
  35. Shen, M.G.; Zhang, D.H.; Wu, C.; Zu, Q.; Qi, Q.H. Study on stirring behavior of liquid steel in bottom-blowing ladle with immersed cylinder. Metalurgija 2016, 55, 601–604. [Google Scholar]
  36. Fangguan, T.; Zhu, H.; Shengli, J.; Lipin, P.; Yawei, L.; Baokuan, L. Physical modeling evaluation on refining effects of ladle with different purging plug designs. Steel Res. Int. 2020, 91, 1900606. [Google Scholar] [CrossRef]
  37. Ramírez-Argaez, M.A.; Contreras, F.; González, C. Modelación matemática del mezclado en ollas cucharas de aluminio equipadas con la técnica de desgasificación rotor-inyector. Revista de Metalurgia 2006, 42, 185–202. [Google Scholar] [CrossRef] [Green Version]
  38. Takahashi, K.; Sugo, Y.; Takahata, Y.; Sekine, H.; Nakamura, M. Laminar mixing in stirred tank agitated by an impeller inclined. Int. J. Chem. Eng. 2012, 2012, 858329. [Google Scholar] [CrossRef] [Green Version]
  39. Solorio, G.; Morales, R.; Palafox, J.; Garcia, L.; Ramos, A. Analysis of fluid flow turbulence in tundishes fed by a swirling ladle shroud. ISIJ Int. 2004, 44, 1024–1032. [Google Scholar] [CrossRef]
  40. Chen, G.; He, S. Mixing behavior in the RH degasser with bottom gas injection. Vacuum 2016, 130, 48–55. [Google Scholar] [CrossRef]
  41. Warzecha, M.; Jowsa, J.; Merder, T. Gas mixing and chemical homogenization of steel in 100 T ladle furnace. Metalurgija 2007, 46, 227–232. [Google Scholar]
Figure 1. Geometry of the ladle: (a) isometric view of the model and (b) top view of the arrangements used in the experimentation.
Metals 11 01942 g001
Figure 2. Flow modifiers at different torsion angles: (a) 30°, (b) 60°, (c) 90°, (d) 120° and (e) 180°.
Metals 11 01942 g002
Figure 3. Instrumentation system used in the experimentation: (a) mixing time measurement system, (b) PIV measurement system and (c) plane analyzed for arrangements with 1 and 2 injections.
Metals 11 01942 g003
Figure 4. Velocity contours obtained using the PIV technique in a transverse plane at half the height of the ladle for all cases: (a) nozzle, (b) modifier 30°, (c) modifier 60°, (d) modifier 90°, (e) modifier 120° and (f) modifier 180°.
Metals 11 01942 g004
Figure 5. Fields of velocity vectors obtained by the PIV technique in a transverse plane at half the height of the ladle for all cases: (a) nozzle, (b) modifier 30°, (c) modifier 60°, (d) modifier 90°, (e) modifier 120° and (f) modifier 180°.
Metals 11 01942 g005
Figure 6. Values of v x ¯ , v y ¯ y v R ¯ for the case with tuyere along of ladle diameter.
Metals 11 01942 g006
Figure 7. Relationship of the velocities of the cases with modifiers with respect to the case with tuyere (T).
Metals 11 01942 g007
Figure 8. Time-concentration graphs obtained for the cases studied: (a) low sensor and (b) up sensor.
Metals 11 01942 g008
Figure 9. Bubble plume in the experimentation for the case with 1 injection: (a) tuyere, (b) flow modifier at 60° and (c) flow modifier at 120°.
Metals 11 01942 g009
Figure 10. Velocity fields, streamlines and vorticity contours in the central plane perpendicular to the bottom of the ladle, obtained by the PIV technique for the cases with 1 injection: using the tuyere (a,d,g), using the modifier at 60° (b,e,h) and using the flow modifier at 120° (c,f,i).
Metals 11 01942 g010
Figure 11. Bubble plume in the experiment for the case with 2 injections: (a) tuyere, (b) flow modifier at 60° and (c) flow modifier at 120°.
Metals 11 01942 g011
Figure 12. Velocity fields, streamlines and vorticity contours in the central plane perpendicular to the bottom of the ladle, obtained by the PIV technique for the cases with 2 injections: using the tuyere (a,d,g), using the modifier at 60° (b,e,h) and using the flow modifier at 120° (c,f,i).
Metals 11 01942 g012
Table 1. Study cases.
SchemeCaseInjectorsInjection Type
Metals 11 01942 i00111Tuyere
2Flow modifier at 60°
3Flow modifier at 120°
Metals 11 01942 i00242Tuyere
5Flow modifier at 60°
6Flow modifier at 120°
Table 2. Results of the benefit in the area under the curve obtained for each angle of the modifier.
Angle of the ModifierArea under the Curve
30°2.13
60°13.88
90°11.13
120°14.63
180°9.63
Table 3. Mixing times obtained for all the study cases.
Injection TypeTime in Seconds
1 Tuyere at 0.75R91
1 Modifier 60° at 0.75R71
1 Modifier 120° at 0.75R73
2 Tuyeres at 0.66R92
2 Modifiers 60° at 0.66R82
2 Modifiers 120° at 0.66R85
Publisher’s Note: MDPI stays neutral with regard to jurisdictional claims in published maps and institutional affiliations.

