Article

High-Temperature Surface Oxide Growth Kinetics of Al–Si–Zr Bulk Alloys and Ribbons

by
Denitsa Kiradzhiyska
1,
Gueorgui Vassilev
2,
Rositsa Mancheva
1,
Svetlana Yaneva
3 and
Nikolina Milcheva
1,*
1
Department of Chemical Sciences, Faculty of Pharmacy, Medical University of Plovdiv, 15A Vassil Aprilov blvd., 4000 Plovdiv, Bulgaria
2
Department of General and Inorganic Chemistry, Methodology of Chemical Education, University of Plovdiv Paisii Hilendarski, 4000 Plovdiv, Bulgaria
3
Acad. A. Balevski Institute of Materials Science, BAS, 1574 Sofia, Bulgaria
*
Author to whom correspondence should be addressed.
Metals 2021, 11(12), 1893; https://doi.org/10.3390/met11121893
Submission received: 2 November 2021 / Revised: 17 November 2021 / Accepted: 23 November 2021 / Published: 25 November 2021

Abstract

:
A typical modification technique of the functional properties of Al–Si based alloys is the addition of some third element in trace level. In the present work, ternary Al–Si–Zr bulk and ribbon alloys have been prepared. The kinetics of high-temperature surface oxidation has been studied by thermogravimetric method. It was found that at the start of the experiment the chemical reaction velocity is rate-controlling while for longer times the (oxygen) diffusion is the rate-controlling process. Activation energy of the two stages of oxidation has been obtained. Additional studies such as thermochemical analysis, optical and electron microscopy, and microhardness tests have been done.

1. Introduction

The Al–Si alloys have found many applications, mostly in airspace, marine and automotive industries. It is known that the corrosion resistance of these materials is due to the oxide layer naturally formed on their surfaces during the interaction with the oxygen and humidity of the air.
Dotting Al–Si alloys with some third constituent might change some of their properties (especially the mechanical properties and the oxidation resistance). Recently, some new cast Al-alloys [1] and Al–Si-alloys with zirconium additions were designed [2,3]. This transition metal affects the mechanical properties of the cast alloys by diminishing the grain size and by the formation of intermetallic compounds [4]. Moreover, it was found that the improvement of the mechanical properties of different Al–Mg–Si modified cast alloys by adding Zr is due to the effect of fine-grain strengthening [5,6,7,8].
Zr solubility (at room temperature) in the fcc-Al phase (denoted further as (Al) or matrix-phase) is rather small [9,10,11,12,13] and intermetallic compounds (mainly Al3Zr) are formed, commonly, when the solubility limit is exceeded. Nine more intermetallic compounds (IMC) have been reported for the Al–Zr system [13]. Thus, binary Si–Zr and Al–Zr IMC are expected to appear in the investigated Al–Si–Zr alloys as well as ternary phases, eventually, in agreement with the relevant phase diagrams. It is also known that silicon atoms can partially substitute aluminium in the compound Al3Zr [14]. Nevertheless, experimental information for the ternary Al–Si–Zr system is scarce and available only at temperatures above 700 °C [12,15,16,17].
The surface oxidation kinetics of a metal or alloy is controlled by a number of processes such as chemical reaction rate at one or both interfaces (metal/oxide or oxide/gas) and by atomic (ionic) transport through the oxide layer [18].
Studies of the micro-structural development in Al–Si microcrystalline alloys [19,20] and their oxidation mechanism have been performed by Yaneva et al. [21] It has been found that zirconium does not take part in the oxide layer formation and that Al2O3 layers grows onto the aluminium solid solution as well as onto the silicon phase interfaces. The oxide layers can break in adjacency to zirconium intermediate phases, allowing direct interaction of the metal surface with air, thus complicating the oxidation process. Nonetheless, the formal oxide layers formation kinetics of Al–Si–Zr alloys has not been studied.
Thus, the main goal of the current work is to investigate the surface oxide layers formation kinetics of Al–Si–Zr bulk alloys and ribbons and, in some extent, to characterize their phase composition.

2. Materials and Methods

In order to prepare ternary Al–Si–Zr alloys in two different forms (bulk alloys and ribbons), pure aluminium and silicon have been melted together in an inert atmosphere at 800 °C. Thereafter, zirconium containing ligature (4.2 wt.% Zr) has been added in order to get the desired Zr contents. The melted alloys were poured, from 930–950 °C, into metal moulds. As-obtained master alloys were solidified at air.
Ribbon-like Al–Si–Zr samples (≈15 mm wide and ≈25–40 µm thick) have been prepared from the respective master alloys by flat-flow casting, as previously described [12,17]. The cooling velocity was in the interval of 105 to 106 K/s. The casting has been done at the Institute of Metal Science and Technology, Bulgarian Academy of Sciences, Sofia.
Silicon and zirconium contents have been thereafter determined by wet chemistry and spectral methods at the Institute of Inorganic Chemistry, Bulgarian Academy of Sciences. Inductively Coupled Plasma Optical Emission Spectrometry (ICP-OES, iCAP 6000 series, produced by Thermo Scientific, Waltham, MA, USA) was used in order to determine experimentally Zr contents of the alloys.
Thermochemical analyses of these “as cast” ribbons have been done using Netzsch STA 449 F3 Jupiter apparatus under helium flux. Two regimes (Differential Scanning Calorimetry (DSC) and Differential Thermal Analysis (DTA)) have been applied depending on the samples behaviour. Three consecutive runs have been done with each sample. Heating rates of 10 deg/min and cooling rates of 40 deg/min have been commonly applied. The highest temperatures of heating were 1500 °C and 1550 °C for DTA and DSC studies, respectively.
The kinetics of high-temperature surface oxidation has been studied by a thermogravimetric method. These experiments were performed with a LABSYS-EVO device (Lyon, France). The main working temperature was 540 °C although experiments were done at 490, 510 and 560 °C as well. The work temperatures were maintained at an interval of ±5 °C.
The duration of each trial was 90 min. Initially, inert gas (Ar) flow was passed through the system until the desired working temperature was obtained. Thereafter, synthetic air (containing 20 vol. % oxygen) under pressure of 1 × 10⁵ Pa was passed with a volume rate of 20 cm3/min. The dimensions of the ribbon and bulk samples used for the kinetic studies were approximately 2 mm × 4 mm. The thickness of the bulk samples was approximately 1 mm, while this of the ribbons was around 25–40 µm. The weights of the samples used for the thermogravimetric experiments varied from 15 to 90 mg.
The equations describing the oxidation rates might be commonly classified as logarithmic, parabolic and linear [21,22,23]. One should be aware that they represent only limiting or ideal cases and deviations are often encountered, thus the kinetic data fitting to simple rate equations might become a challenge.
The direct logarithmic- and the inverse-logarithmic rate laws are encountered, usually, at relatively low oxidation temperatures (i.e., below 400 °C) [22]. At high temperatures the oxidation rate usually follows parabolic time dependence (Equation (1)).
W n = k j ( t + t 0 ) + C
The symbol W might represent the oxide layer thickness (for example see [23]) but in the case considered in the current work, W represents the weight gain (due to the oxygen mass entered the respective samples), n is the exponent (theoretically having the value of 2 for the parabolic rate law), t denotes the oxidation time, s, t0 is the eventual incubation period, s (usually appearing to be negligibly small), kj represents the respective rate constants, and C is an integration constant. As previously mentioned, the quantity W ought to be normalized (i.e., its dimension has to be kg/m2) in order to ensure the compatibility between all thermogravimetric experimental data.
The parabolic growth rate signifies that a volume diffusion process determines the overall velocity of the oxidation. Such a process may imply a uniform diffusion of one or more of the reactants through the growing layer. In the case of a linear oxidation rate, the power n is equal to 1 and entails that a surface or phase boundary process or reaction is rate limiting.
The microhardness of specimens was determined by Vickers method using Digital Micro Vickers Hardness Tester TMVS-1 (TIME High Technology Ltd., Beijing, China) with intender load of 0.025 kg and a time of 10 s. The microhardness measurements are converted to MPa dimensions, for convenience.
Optical (Olympus BX61 with video camera DP70 (Olympus, Tokyo, Japan) and motorized examination table) and scanning electron microscope (SEM) techniques were used for microstructure studies. The latter is a JEOL apparatus, type JSM 6390 (JEOL Inc., Tokyo, Japan). The chemical composition of selected spots was measured by means of energy-dispersive spectroscopy (EDS) analysis (EDS Oxford INCA device (Oxford Instruments, Abingdon, UK) operated at 20 kV).

3. Results and Discussion

3.1. Chemical Composition of the Alloy

The experimentally obtained chemical compositions are given in Table 1. Si and Zr contents of the master alloys and Zr contents of all samples have been determined directly. As one can see Zr contents vary from 0.26 wt.% to 1.38 wt.% received by means of ICP-OES, which is in good agreement with the other values of Zr obtained by wet chemistry and spectral methods (Table 1). Other studies with the described compositions have been done in our previous works [24,25]. It is essential to note that the chemical compositions of all samples investigated in this work are near to that of the Al–Si eutectic point (i.e., 12.6 wt.% Si [11]). Thus, the samples can be classified as hypoeutectic, with reference to the binary Al–Si system.

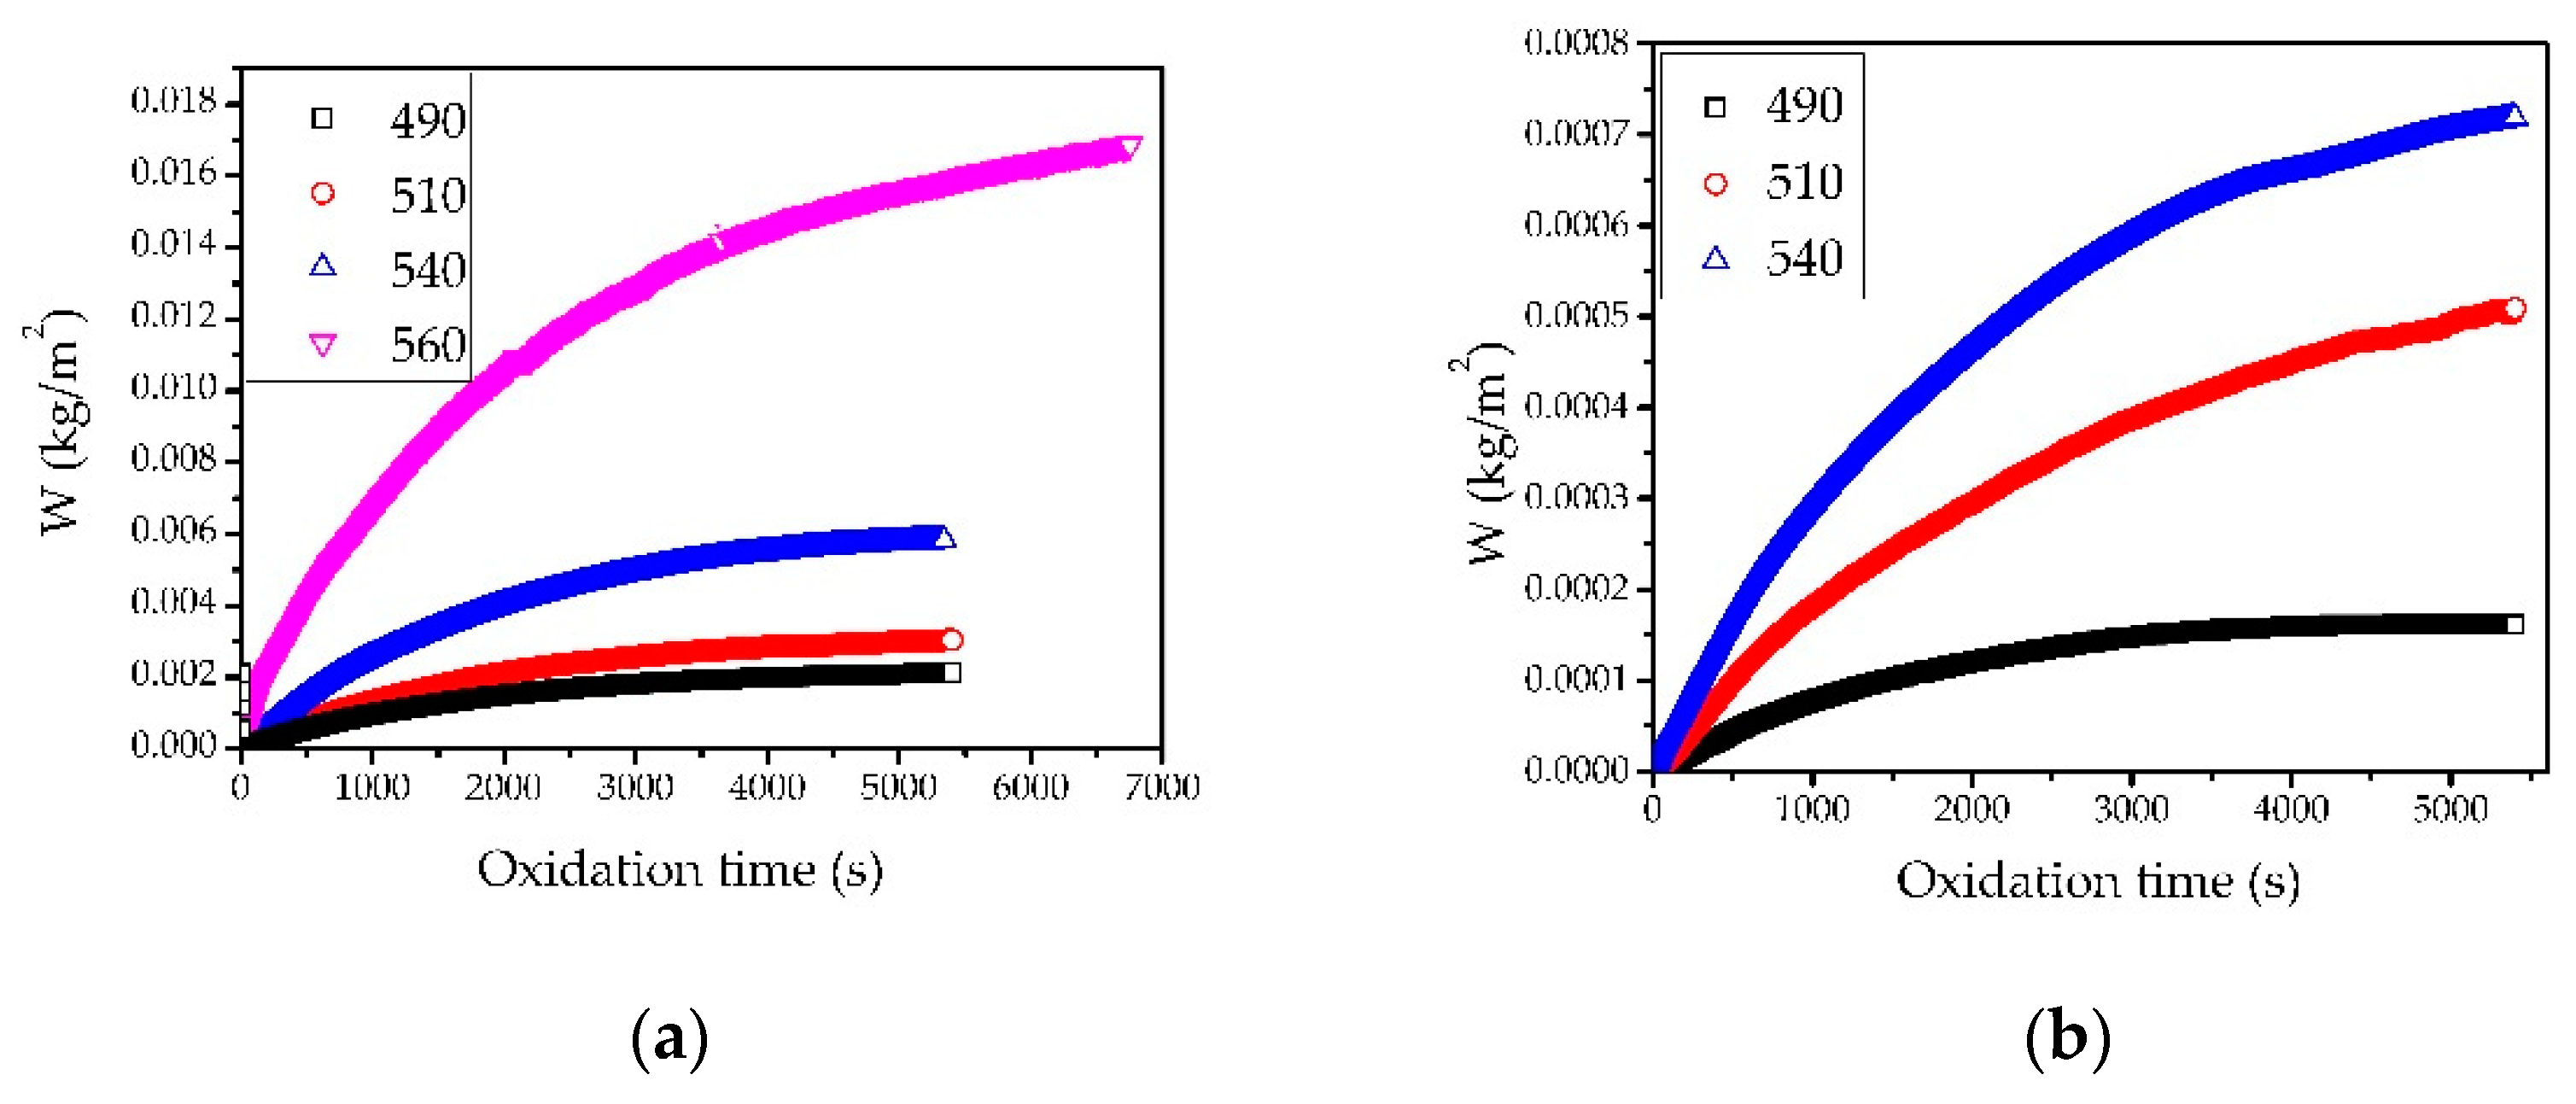
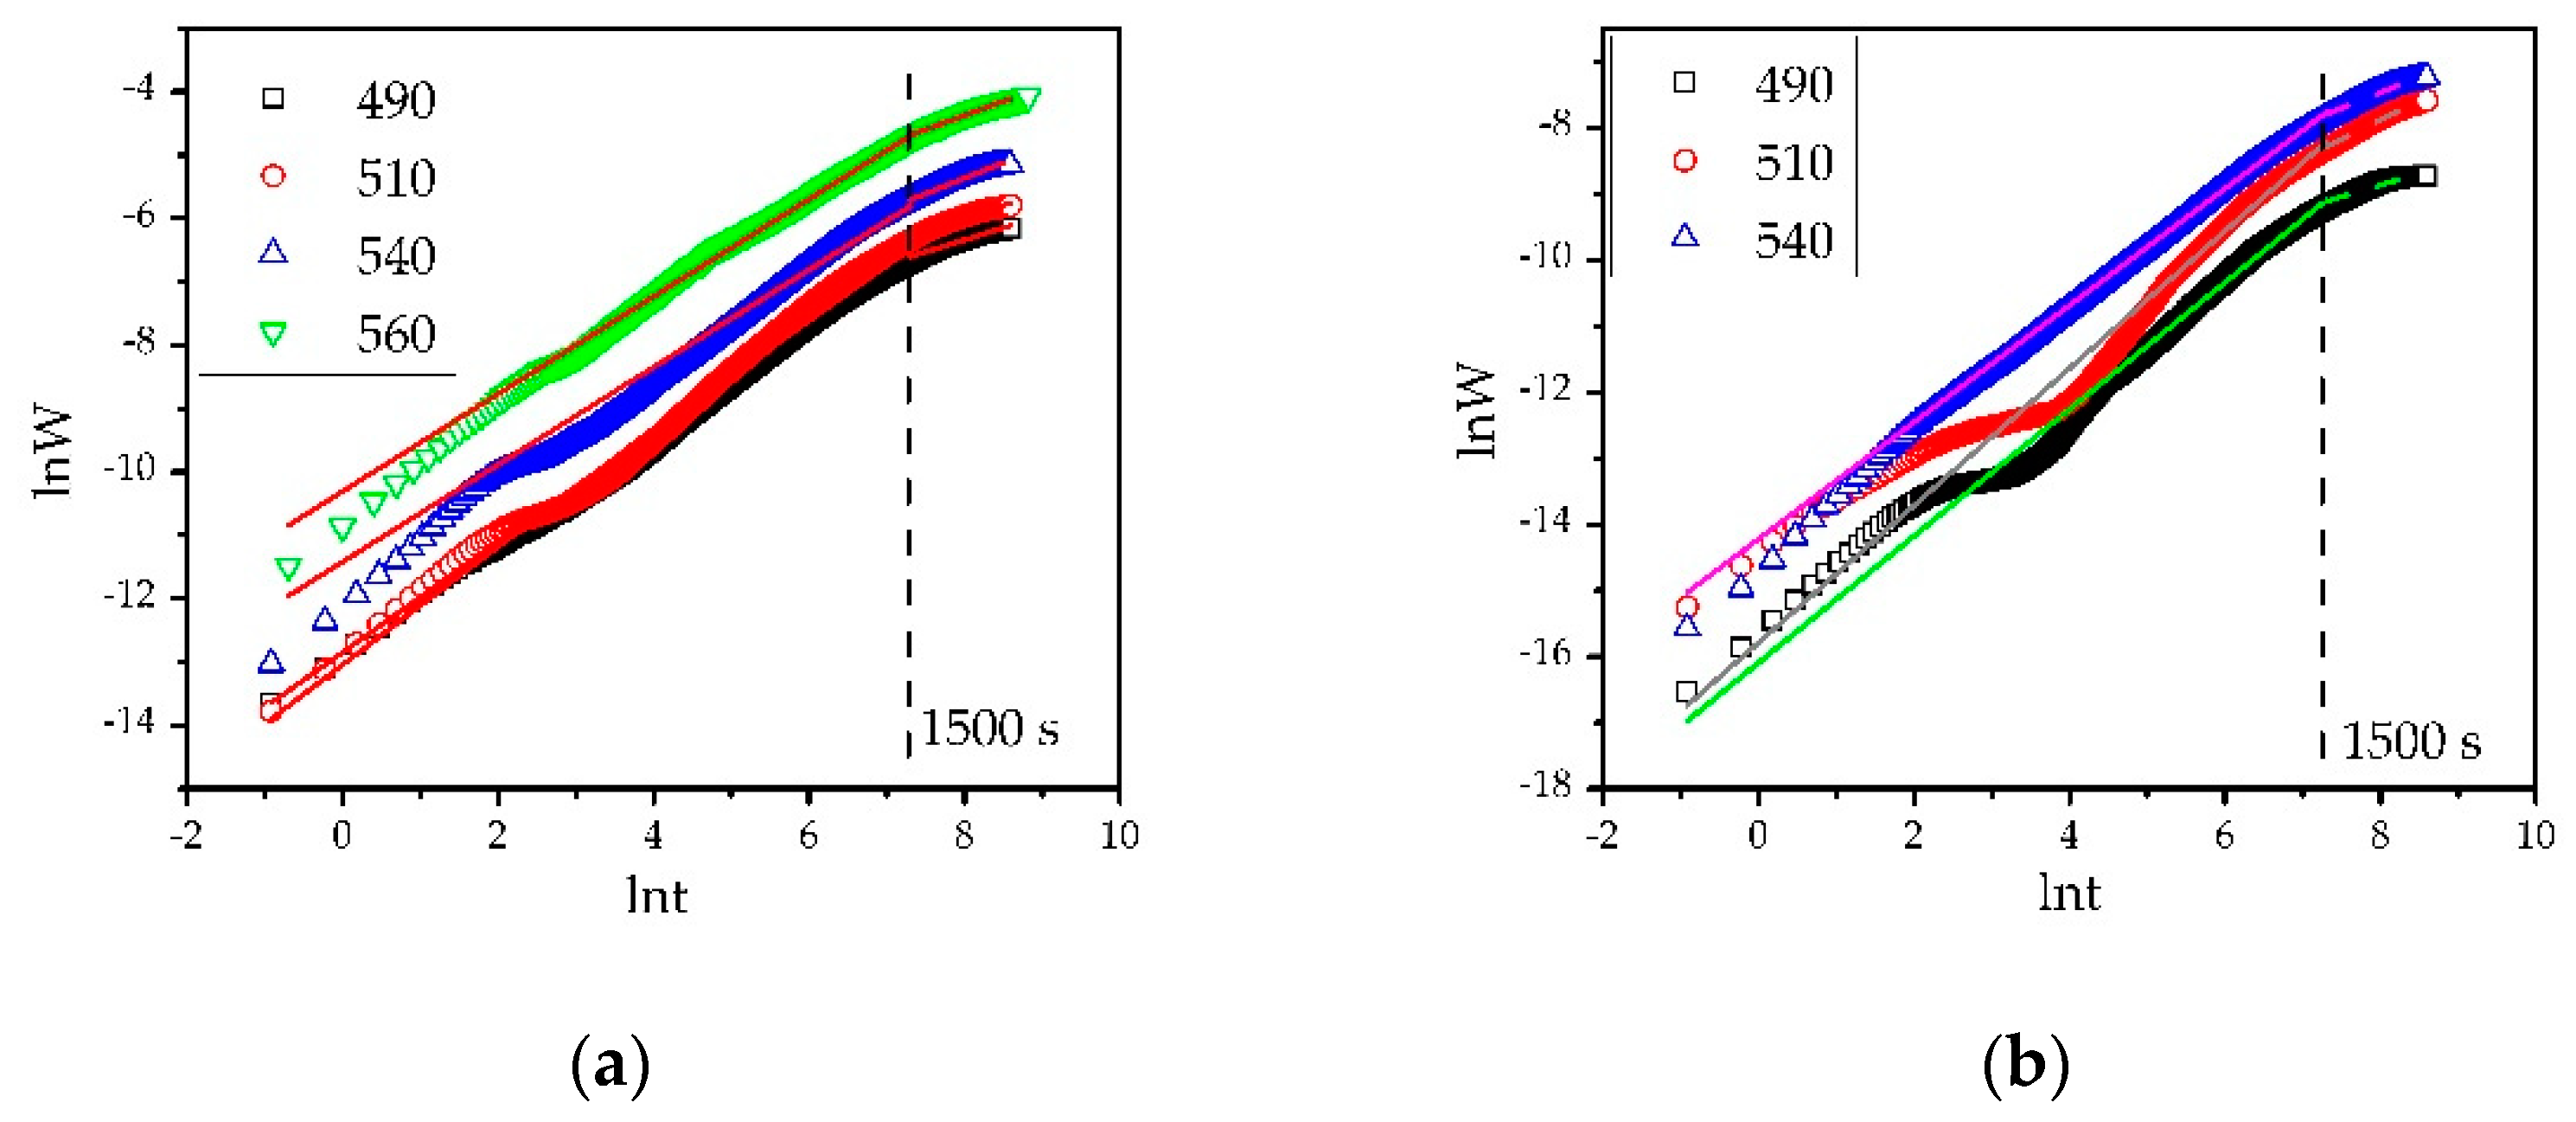
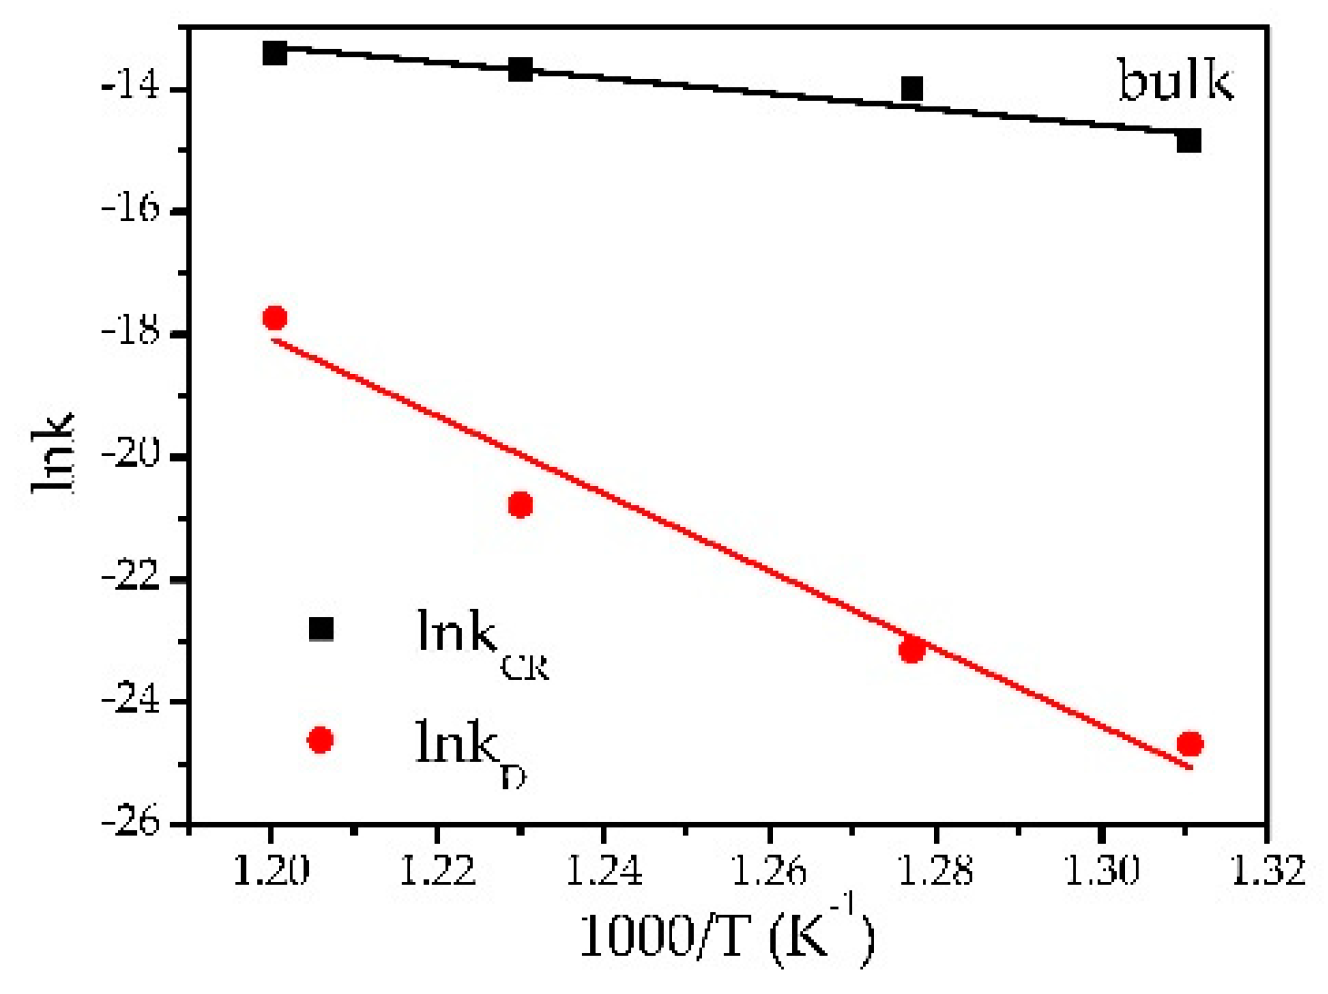
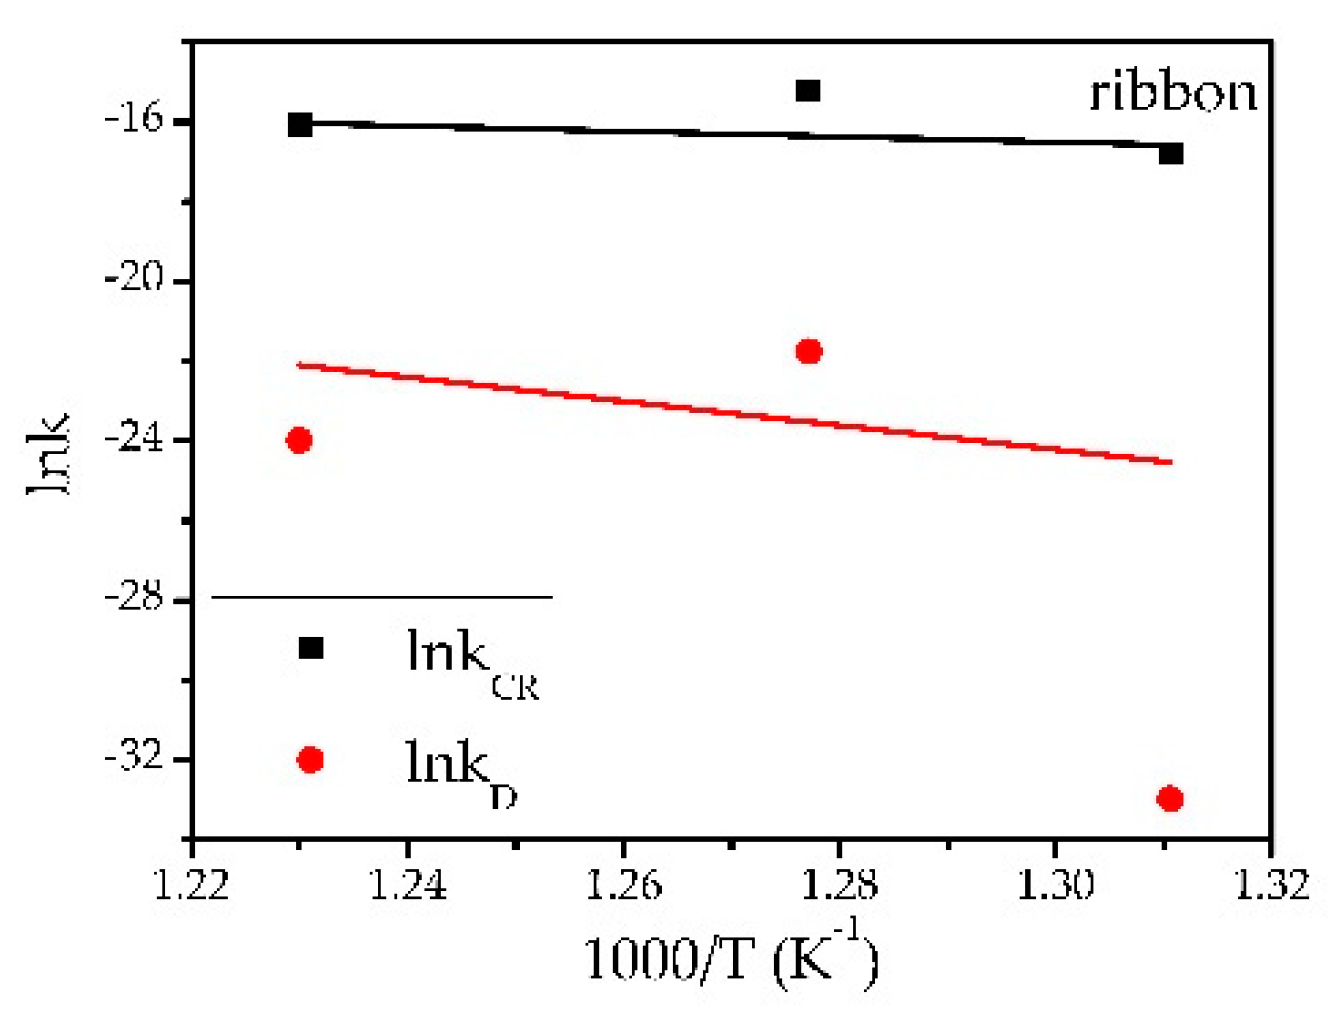
3.2. Oxidation Kinetics

The thermogravimetric experiments allow registering of the sample mass growth at isothermal conditions. The experimental data have been normalized by converting the absolute mass growth (kg) to mass growth per unite area (kg/m2). The quantity obtained in this way is referred to further as “normalized weight change”. It has been assumed that the mass change is due to the surface oxide layers formation on the samples. The experimental conditions of the thermogravimetric tests are shown in Table 2. Both types of samples (bulk and ribbon) have been oxidized at similar conditions. In order to study the kinetics of high-temperature oxidation, thermogravimetric tests at different temperatures were done.
We would like to note that, in a number of cases, the thermogravimetric experiments have been considered as “unsuccessful” because of arbitrary shapes of the registered curves. The latter have often exhibited very low oxidation rates, in comparison to the “successful” runs. The reasons for these divergences could not be revealed. The amount of the conditionally “unsuccessful” experiments was around 50% of all trials.
The oxidation kinetic curves registered with the bulk number 3 (at 490, 510, 540 and 560 °C) are shown in Figure 1a, while the pertinent results obtained for ribbon number 3 are plotted in Figure 1b.
One can see (Figure 1a,b) that the oxidation kinetic curves start developing since the very beginning of the experiments, which means that there is no incubation period (i.e., the parameter t0 (Equation (1)) is equal to zero). It is notable, by the values of W, that the oxidation process is more intensive with bulk alloy than ribbons, and therefore the rapidly solidified ribbons are more stable in oxidation.
In order to calculate the exponent n using the oxidation rate Equation (1) the normalized mass changes W (kg/m2), have been plotted against the oxidation time t (s), in logarithmic coordinates (see Figure 2a,b) and linear regression analyses have been done. These estimations are done in this study for both bulk alloys and ribbons.
In these coordinates, the n values are represented by the slopes of the respective lines. It has been found that, generally, parabolic rate kinetics (i.e., n = 2) is obeyed at longer times, but some consistent deviations for the initial annealing times were observed. Thus, we have assumed (and thereafter we have proved it, see Table 3) that the experimental thermogravimetric curves reflect two consecutive stages. Initially (up to 1500 s), the linear oxidation rate law (n = 1) is valid, while for longer times the parabolic rate law (i.e., n = 2) is followed. The value of 1500 s has been selected by the trial and error method and is, surely, somewhat approximate.
These findings mean that, at the start of the experiment, the chemical reaction (CR) velocity is rate-controlling (i.e., it is slower than the diffusion), while for longer times the (oxygen) diffusion (D) is the rate-controlling process. Such a sequence of the rate-controlling processes is physically justified because the oxygen influx is obstructed with the augmentation of the oxidized areas of the materials.
The oxidation kinetic constants (k1 = kCR and k2 = kD) obtained with bulk and ribbon samples, respectively, are plotted in Arrhenius coordinates (Figure 3 and Figure 4). The oxide growth activation energy (EA) for the two stages of the oxidation reaction for bulks and ribbons (first stage 0–1500 s process controlled by chemical reaction, second stage 1500–5600 s process controlled by diffusion) has been calculated by regression analyses. The logarithms of the oxidation kinetic constants and estimated activation energies for the both stages of bulks and ribbons are compiled in Table 4a,b. It is notable that the activation energy of the first time period (0–1500 s) is greater than the second one (1500–5600 s) for all samples. That difference for bulk samples is 5 times higher, while for the ribbons is about 4.5 times higher, which is of the same order. This means that the activation energy of the diffusion process is greater. The uncertainty of the activation energy for ribbons can be explained by assuming that they are nonhomogeneous nanomicrocrystal systems. This is supported by the SEM analyses [26], which proved that nano- and microsized Zr-enriched phases are formed in the Al–Si–Zr ribbons.

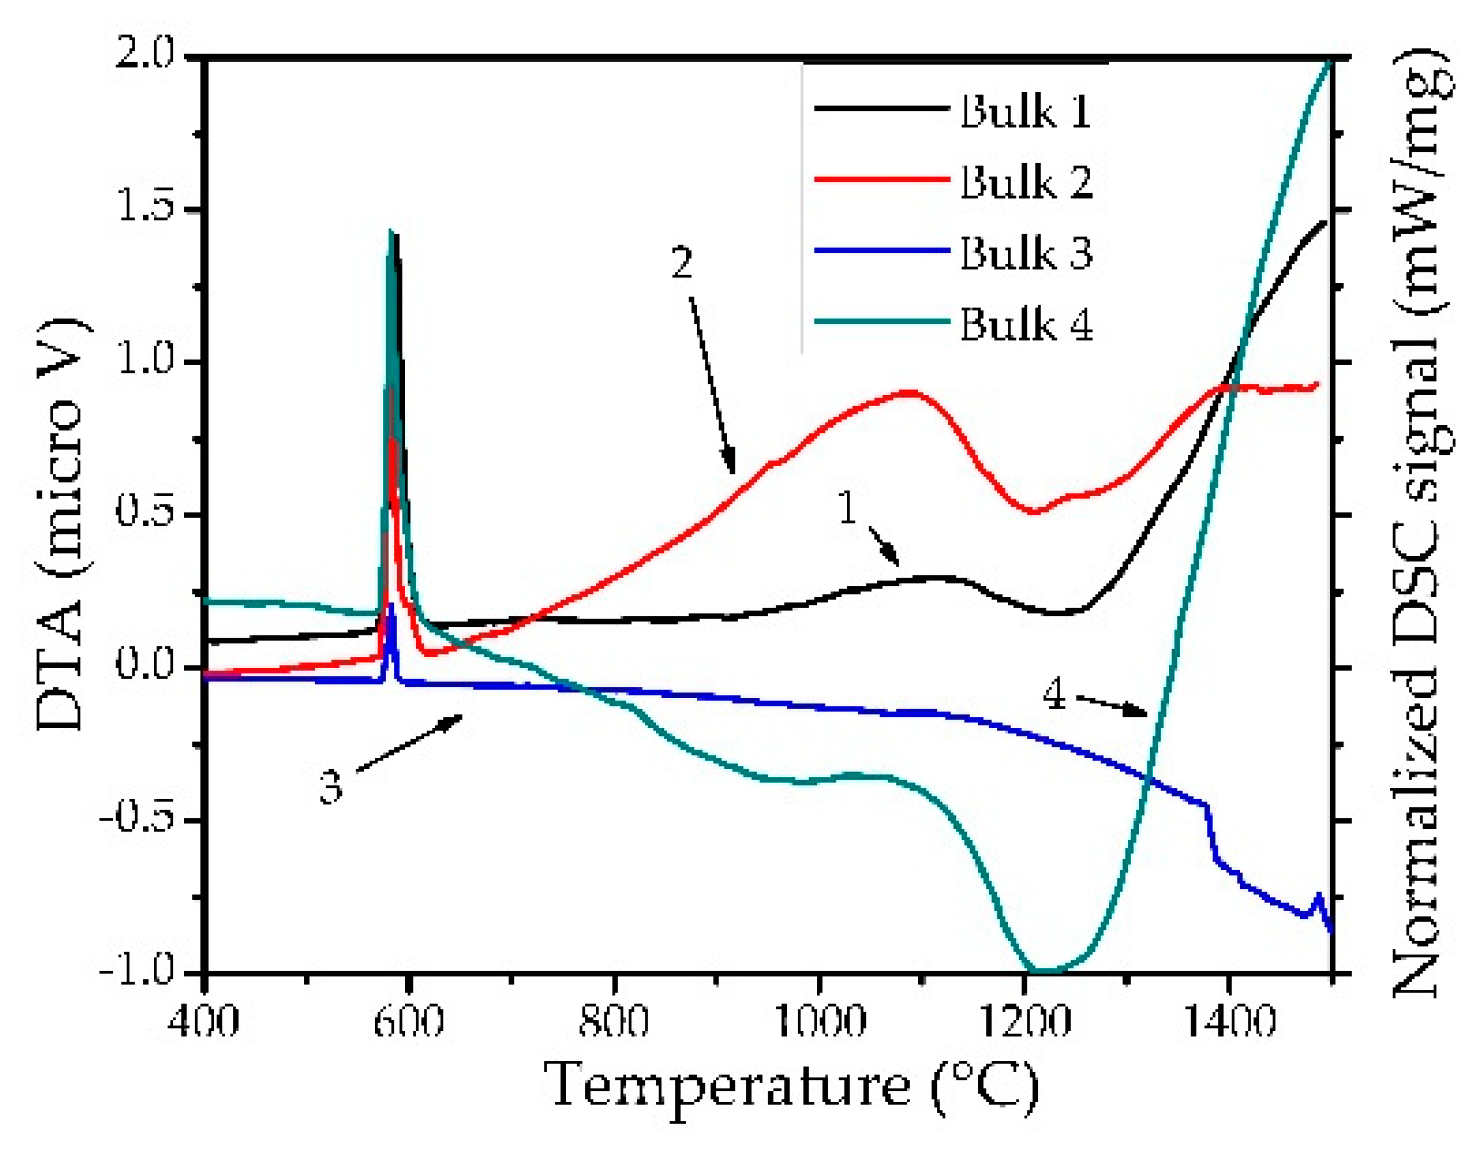
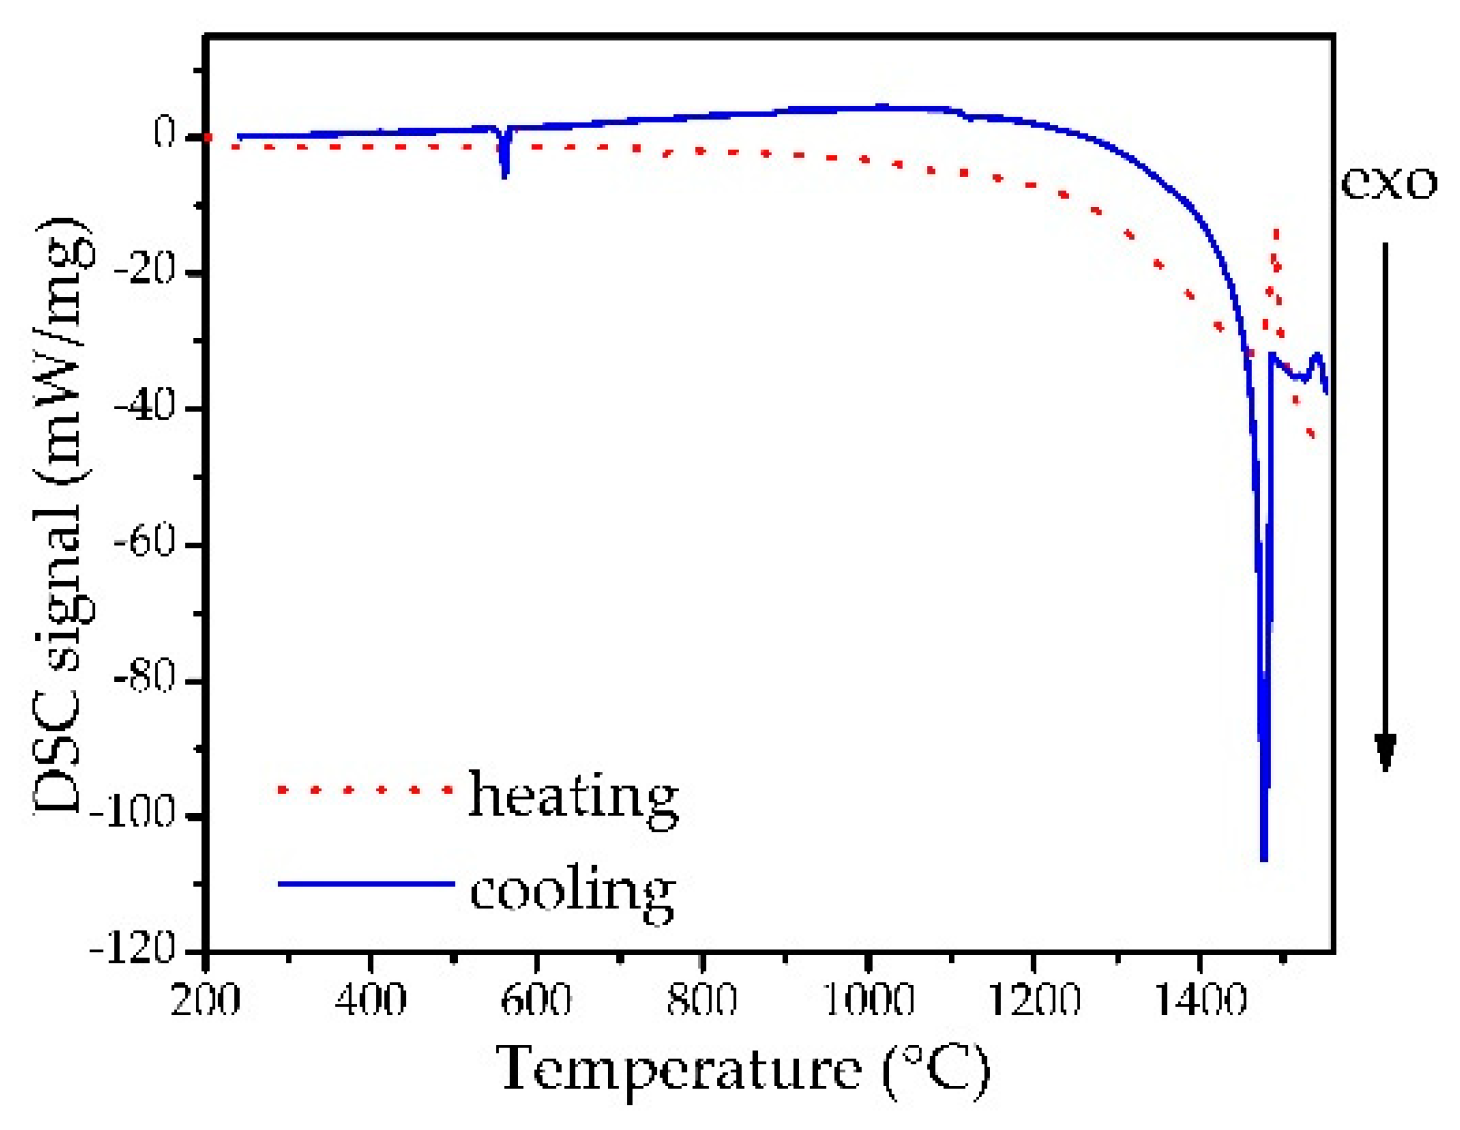
3.3. Thermal Studies

The thermal effects registered during heating and cooling of a given sample are related to the corresponding phase boundary crossing. That is why the phase diagrams of the systems involved in the studies are used as references. Thus, literature phase equilibrium data [11,13,15] have been used to provide information for the binary end-systems (Al–Si, Al–Zr, and Si–Zr) in order to identify the thermal effects related to the crossing of the invariants or the phase field boundaries.
The results of DTA experiments with Al–Si–Zr bulk samples (nos. 1B, 2B, 4B) at heating (h) and at cooling (c) are shown in Table 5 (for DTA experiments) and in Table 6 (for DSC experiments). DTA curves have been represented in Figure 5 (heating) while DSC curves are shown in Figure 6.
As predictable, the strongest thermal arrests (registered with all samples) correspond to the eutectic reaction in the Al–Si system:
L ↔ (Al) + (Si).
In Equation (2), L is for the liquid phase, (Al)—for the face centred cubic aluminium (or FCC) phase, and (Si)—for the tetragonal silicon phase. The enthalpy changes (ΔHi, J g−1) related to the corresponding thermal effects have been calculated.
Thermal effects with the participation of the Al3Zr might be expected at around 660 °C, due to the peritectic reaction:
Al3Zr + L ↔ (Al).
Nevertheless, such thermal arrests have not been observed clearly, which is easily understandable taking into account that peritectic reactions are kinetically hindered. Moreover, in the case under consideration the compositional difference between two of the phases is extremely small (the zirconium content is 0.08 mole fractions for (Al) and 0.03 mole fractions for L) [15]. In addition the envisaged Al3Zr fraction in the alloys is also rather tiny.
As one can see (Table 5 and Table 6), the strongest thermal effect (P1) has been registered with all bulk samples. The (P1) peaks correspond to the binary Al–Si eutectic reaction (Equation (2)), and are situated at around 572–580 °C (with standard deviations around 1 °C). The eutectic peak temperatures measured by DSC at cooling are reasonably lower (572.1 °C) than these registered at heating (575.8 °C). These findings confirm that the chemical and the phase compositions of the alloys are near to the Al–Si eutectic point.
The thermal arrests P2 and P3 have been observed at the DTA studies only (Table 5).
Namely, P2 effects (Table 5) have been registered at runs nos. 1Bc, 2Bc, 4Bc (Figure 5). These very feeble peaks are related to the crossing of the liquidus at cooling, before reaching the eutectic temperature.
The thermal effect P3 (Table 5) is observed with the DTA cooling runs of samples 1Bc and 4Bc at around 1200 °C. This effect could be related to the invariant reaction of Equation (4) taking place at 1275 °C according to [9,13].
Zr5Al4 + Zr2Al3 ↔ ZrAl
P2 appears at 1475.5 °C (at heating, Table 6) and P3 at 1486.7 °C. These temperatures might be related to the high-temperature eutectic reaction of Equation (5) [11]:
L ↔ Al4Zr5 + Al3Zr2.

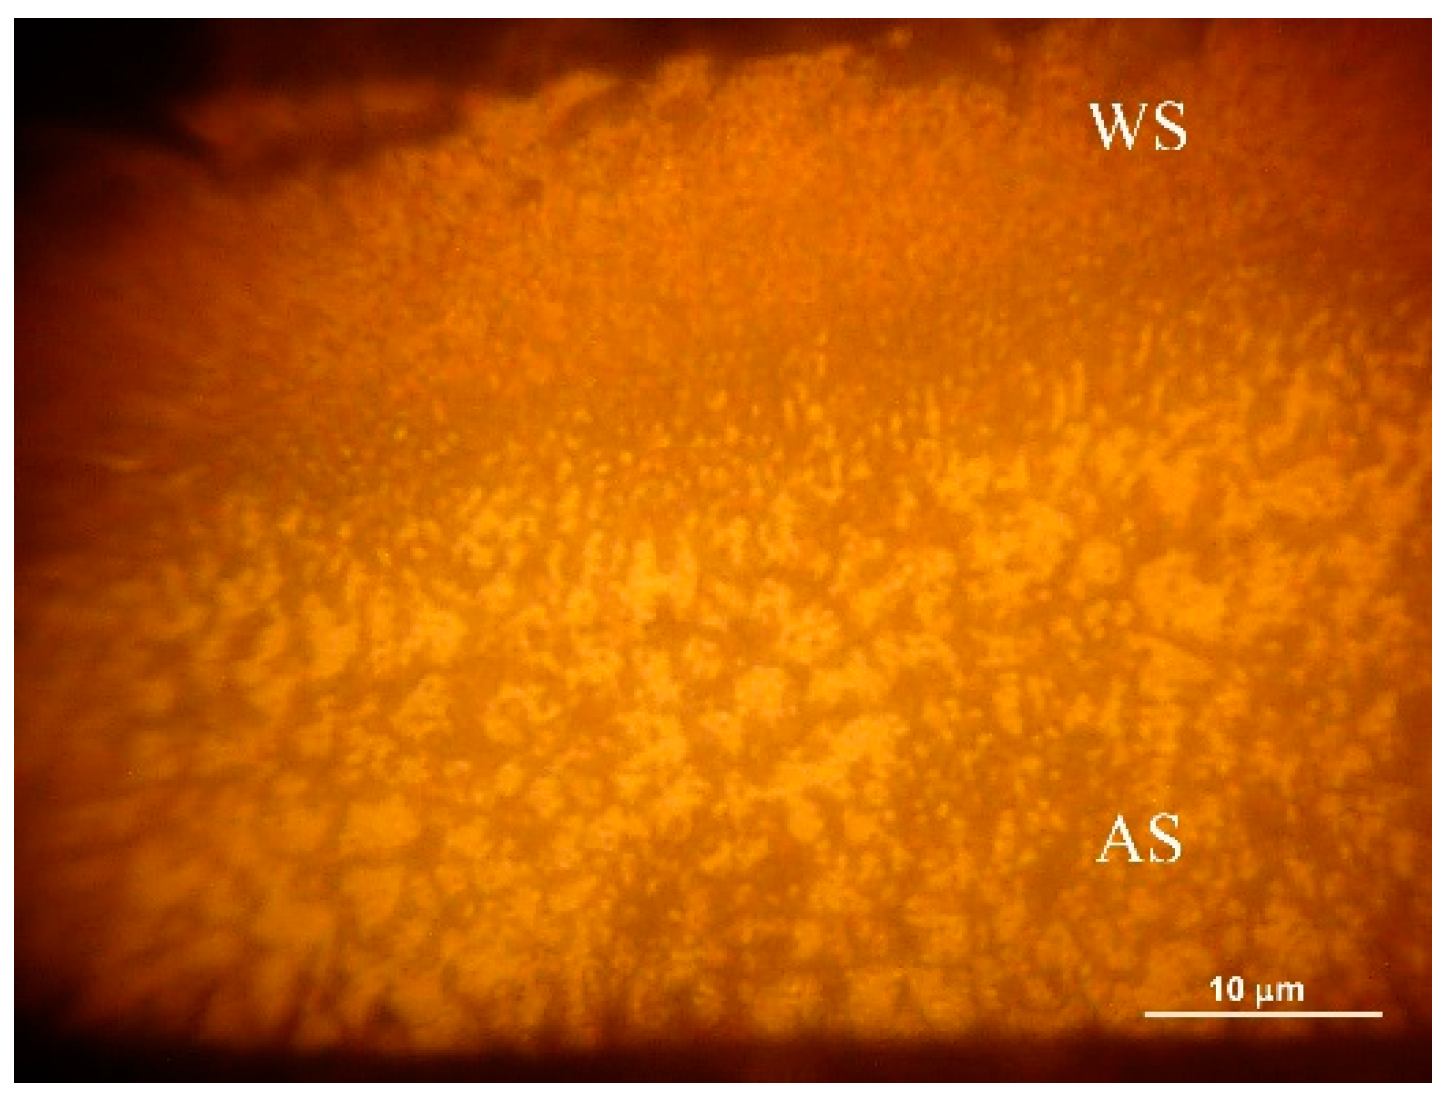
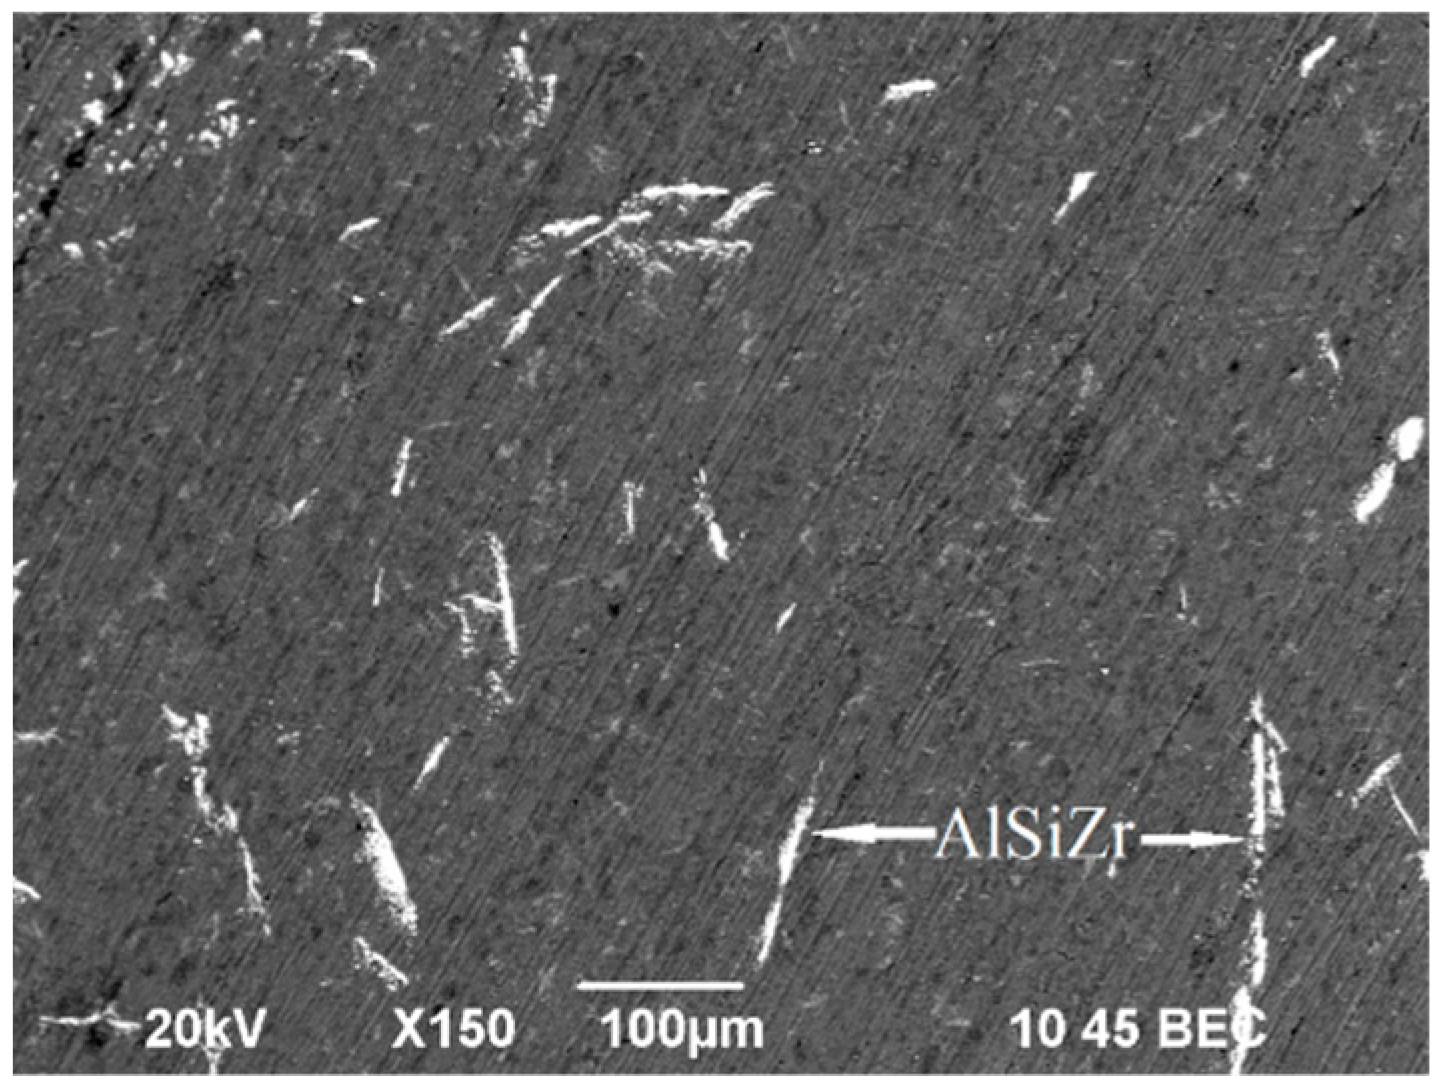
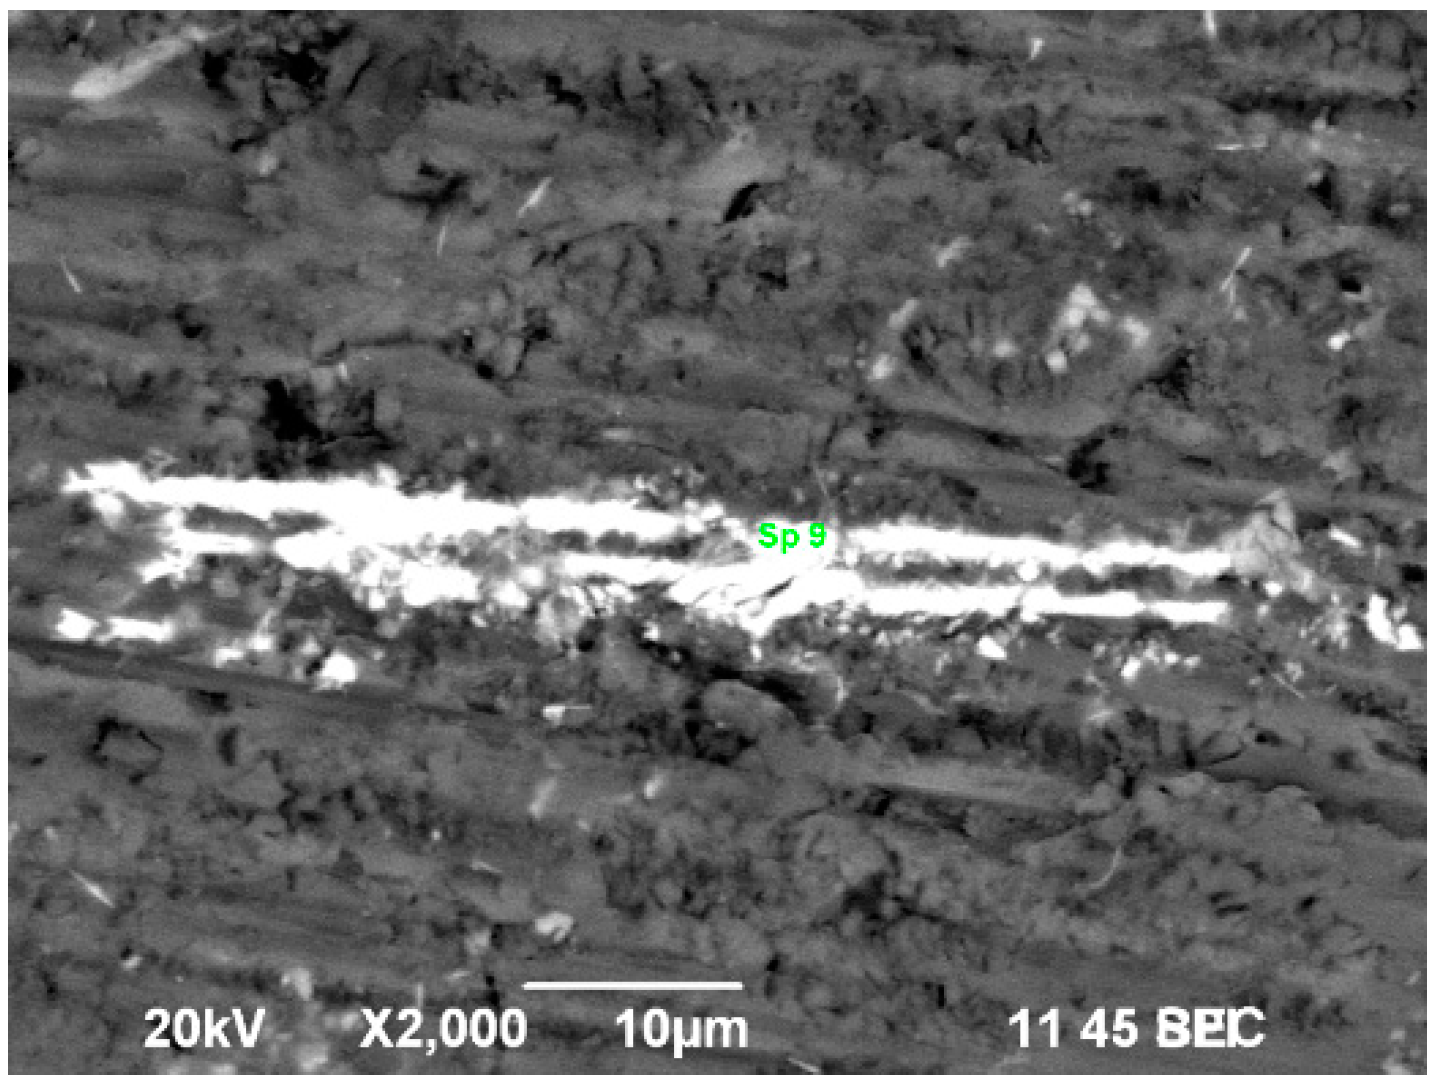
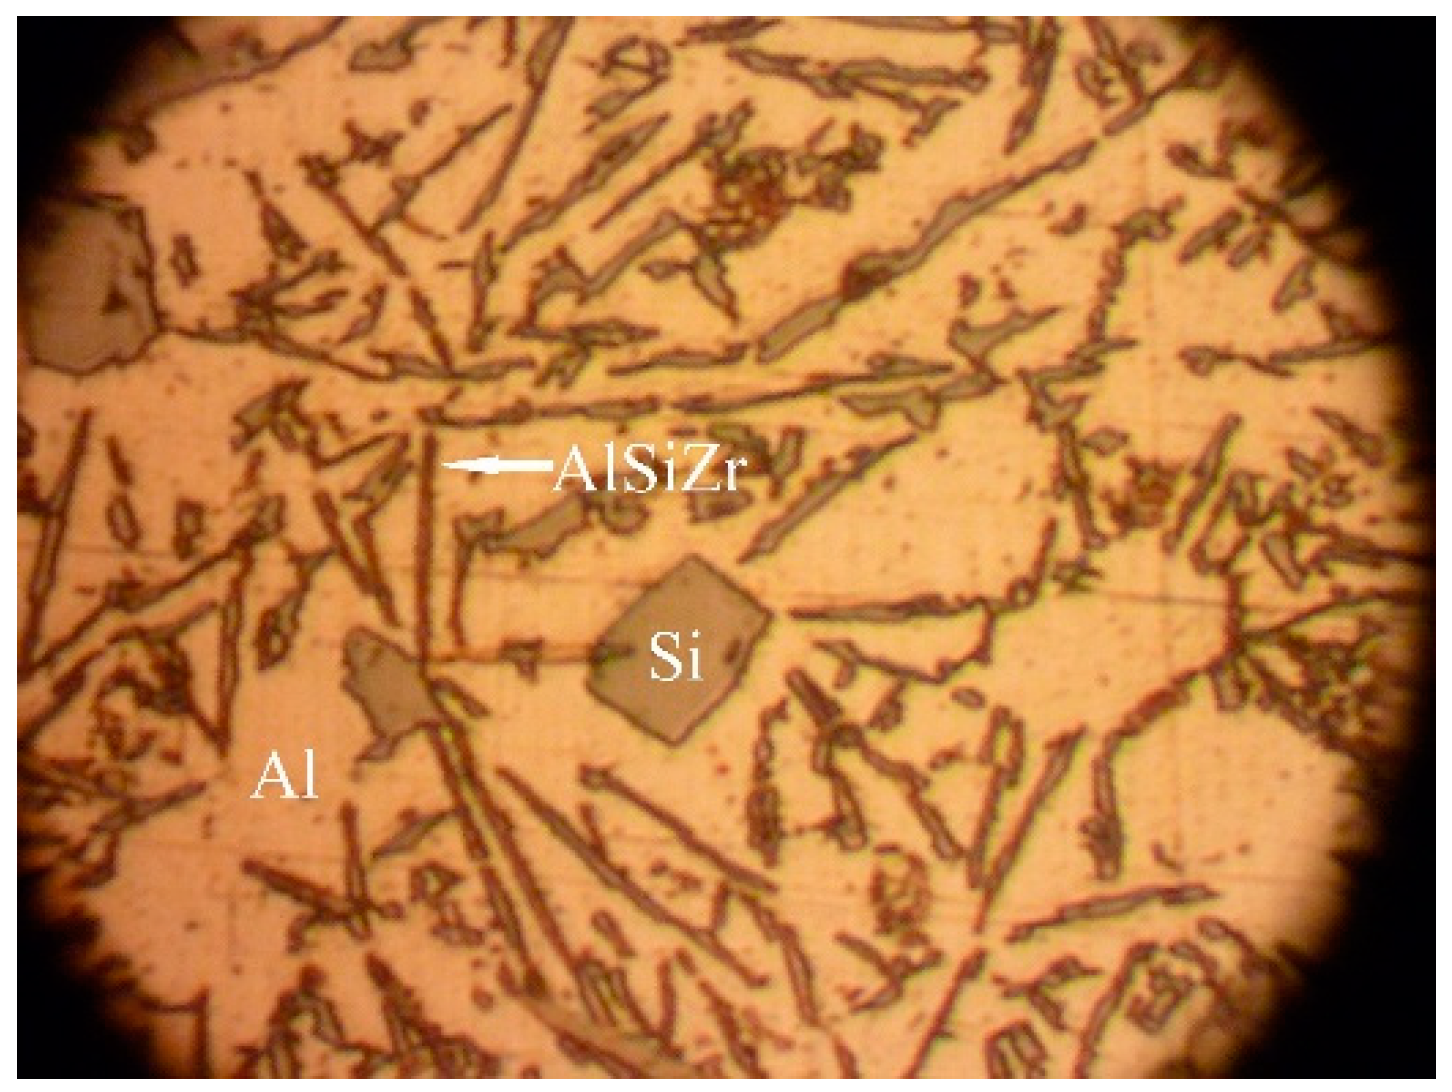
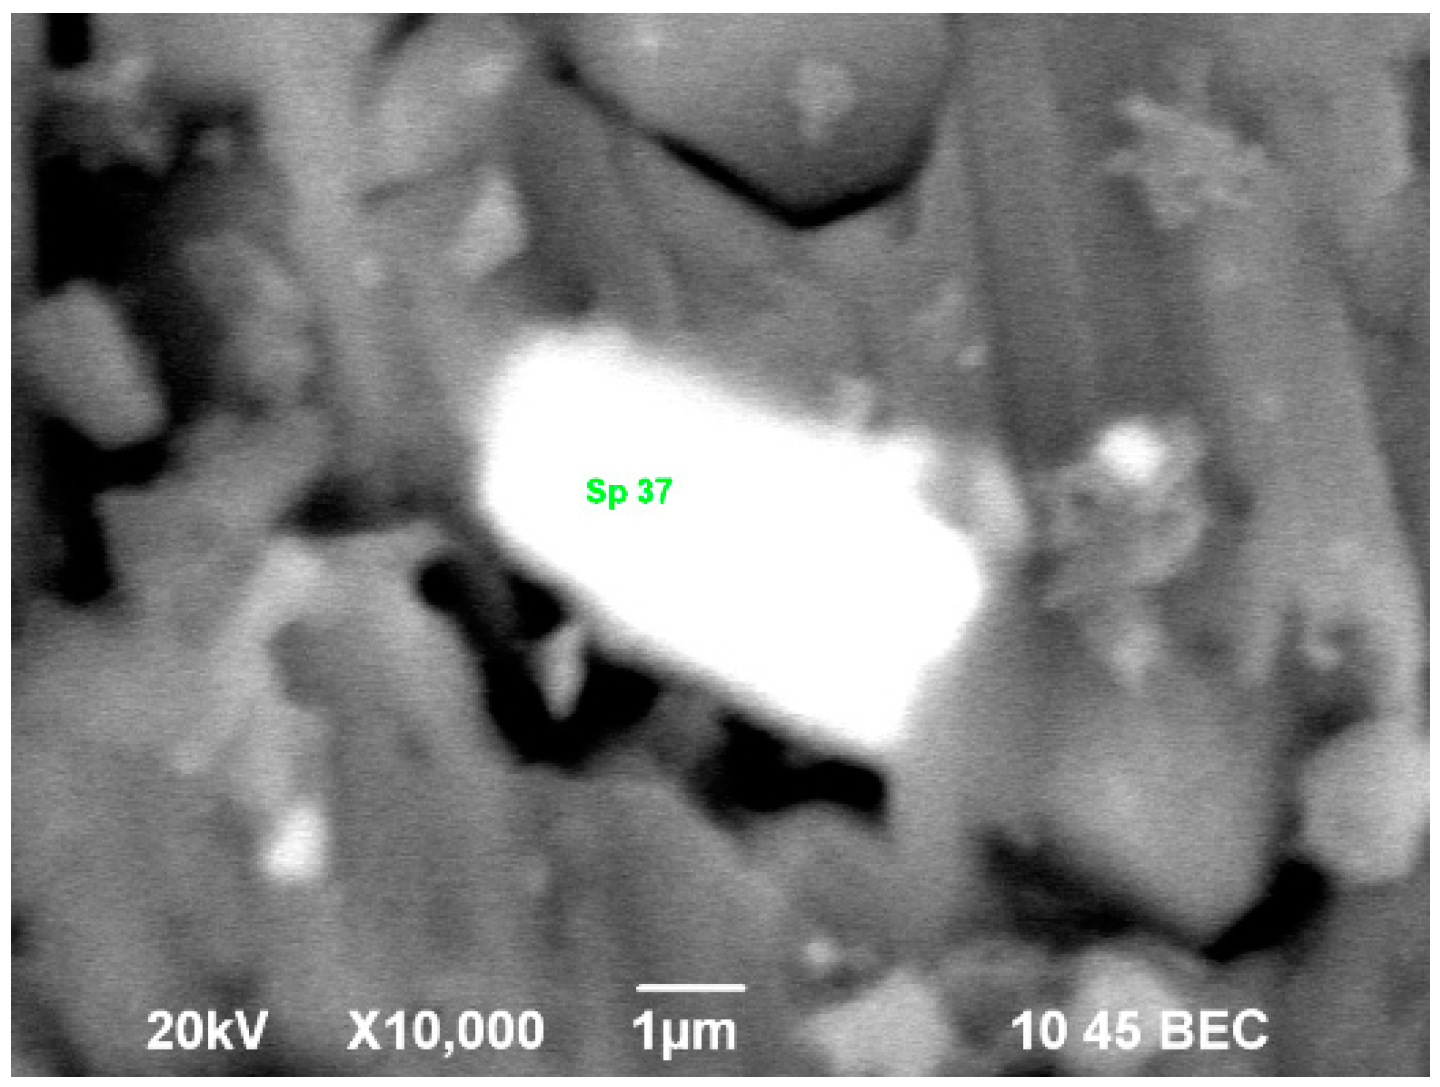
3.4. Optical and Scanning Electron Microscope Studies. Microhardness Tests

The microstructure of the ternary systems was observed using optical microscope. A cross-section of ribbon number 3 can be seen in Figure 7. It reveals that during the casting process two different microstructures are formed. The first structural zone corresponds to the wheel-side surface (WS—wheel-side) of the ribbon and the second one to that exposed to air (AS—air-side). The microstructure at the WS has smaller phase sizes (upper side of the picture) than that of the AS (the lower side of the picture).
A micrograph of bulk alloy number 3 is shown in Figure 8. The microstructure is much coarse than that of the corresponding ribbon.
The average length of the Al–Si–Zr compound, measured by SEM, is around 100 μm as it can be seen in Figure 9. This finding is in agreement with Gao et al. [12]
The oxide layer and the composition of the ternary compound of bulk samples before and after high temperature oxidation have been studied as well. The thermogravimetric oxidation was carried out at 540 °C for 90 min. The atomic percent of oxygen was estimated by SEM-EDX. Before oxidation it is 60.48 ± 3.26, while after oxidation it is 63.37 ± 1.35.
In order to determine the composition of the ternary compound atomic concentrations of Al, Si and Zr were recalculated after subtracting the respective oxygen content and normalizing the obtained data to 100%. Average ternary composition before oxidation, acquired in that way, corresponds to the formula Al72Si10Zr17 while after oxidation—to Al42Si37Zr21 (Table 7). It is obvious that the aluminum concentration decreases while the Si-concentration increases, probably due to dissolution of aluminum from the ternary phase to the matrix and diffusion of Si into ternary phase. Those ternary compounds have a certain homogeneity range. The described change is visualized in Figure 10.
The ternary compound Al72Si10Zr17 suffered not only composition changes (see above) but microstructure changes as well. Before oxidation it looks like a compact particle, while after oxidation its microstructure is flake-like (Figure 11 and Figure 12).
Microhardness tests have been done with all samples. The results have been averaged from eight measurements for each sample and are introduced in Table 8. Vickers hardness (HV, kgf/mm2) is converted to MPa in SI system. It can be noticed that the ribbon samples have values of the Vickers hardness twice as big than that of the bulk samples due to the rapidly solidification process.

4. Conclusions

A number of experiments with Al–Si–Zr bulk alloys and rapidly solidified ribbons were done. Two oxidation kinetics stages were distinguished. Rate-controlling processes are: chemical reaction velocity, initially (i.e., for the first stage), and oxygen diffusion (for longer times). Activation energy values were calculated for both cases, separately.
A ternary compound corresponding to the formula Al72Si10Zr17 was identified in the metallic samples. It also suffers oxidation and its composition changed to Al42Si37Zr21 (without counting the oxygen content).
It was observed that ribbons had bigger hardness values than the respective bulk samples due to the microstructure achieved at rapid solidification.

Author Contributions

Conceptualization, G.V. and S.Y.; Formal analysis, D.K. and G.V.; Funding acquisition, R.M.; Investigation, D.K., G.V. and N.M.; Methodology, G.V.; Project administration, G.V.; Software, D.K.; Supervision, G.V.; Validation, D.K., G.V. and N.M.; Visualization, N.M.; Writing—original draft, D.K., G.V. and N.M.; Writing—review and editing, N.M. All authors have read and agreed to the published version of the manuscript.

Funding

This research was funded by the NATIONAL SCIENTIFIC PROGRAM “Young Scientists and Postdoctoral Candidates” of Bulgarian Ministry of Education and Science.

Institutional Review Board Statement

Not applicable.

Informed Consent Statement

Not applicable.

Data Availability Statement

The datasets used and analyzed during the current study are available from the corresponding author on reasonable request. All data are in the form of tables and figures.

Acknowledgments

The authors are very grateful to Jolanta Romanowska from Politechnika Rzeszowska, Rzeszow, Poland for SEM-EDS analysis.

Conflicts of Interest

The authors declare that there is no conflict of interest regarding the publication of this paper. The funders had no role in the design of the study; in the collection, analyses, or interpretation of data; in the writing of the manuscript, or in the decision to publish the results.

References

  1. Çadırlı, E.; Tecer, H.; Şahin, M.; Yılmaz, E.; Kırındı, T.; Gündüz, M. Effect of heat treatments on the microhardness and tensile strength of Al–0.25 wt.% Zr alloy. J. Alloys Compd. 2015, 632, 229–237. [Google Scholar] [CrossRef]
  2. Li, Q.; Ma, X.; Li, B.; Ma, J.; Feng, X.; Pei, R.; Liu, J. Influences of different Zr/Sc ratios on microstructure and mechanical properties of Al–2Si alloy. J. Rare Earths 2021, 39, 105–112. [Google Scholar] [CrossRef]
  3. Andrzejczuk, M.; Lewandowska, M.; Latuch, J.; Kurzydłowski, K.J. Multiscale characterization of nanostructured Al–Si–Zr alloys obtained by rapid solidification method. J. Mater. Sci. 2011, 46, 5454–5459. [Google Scholar] [CrossRef] [Green Version]
  4. Bao, G.; Zuo, M.; Li, D.; Li, Y.; Liu, X. The improvement of microstructures and mechanical properties of near eutectic Al–Si multicomponent alloy by an Al–8Zr–2P master alloy. Mater. Sci. Eng. A 2012, 531, 55–60. [Google Scholar] [CrossRef]
  5. Dang, J.; Huang, Y.; Cheng, J. Effect of Sc and Zr on microstructures and mechanical properties of as-cast Al–Mg–Si–Mn alloys. T. Nonferr. Metal Soc. 2009, 19, 540–544. [Google Scholar] [CrossRef]
  6. Bevilaqua, W.L.; Stadtlander, A.R.; Froehlich, A.R.; Lemos, G.V.B.; Reguly, A. High-temperature mechanical properties of cast Al–Si–Cu–Mg alloy by combined additions of cerium and zirconium. Mater. Res. Express. 2020, 7, 026532. [Google Scholar] [CrossRef]
  7. Reihanian, M.; Ranjbar, K.; Rashno, S. Microstructure and Impression Creep behaviour of Al–7Si–0.3Mg alloy with Zr addition. Met. Mater. Int. 2020, 27, 2530–2540. [Google Scholar] [CrossRef]
  8. Rahimian, M.; Amirkhanlou, S.; Blake, P.; Ji, S. Nanoscale Zr-containing precipitates; a solution for significant improvement of high-temperature strength in Al–Si–Cu–Mg alloys. Mater. Sci. Eng. A 2018, 721, 328–338. [Google Scholar] [CrossRef] [Green Version]
  9. McPherson, D.J.; Hansen, M. The System Zr–Al. Trans. ASM 1954, 46, 354–374. [Google Scholar]
  10. Murray, J.L.; McAlister, A.J. The Al–Si (Aluminum–Silicon) system. Bull. Alloy Phase Diagr. 1984, 5, 74–84. [Google Scholar] [CrossRef]
  11. Massalski, T. ASM CD-ROM. In Binary Phase Diagrams, 2nd ed.; ASM International: Almere, The Netherlands, 1996. [Google Scholar]
  12. Tong, G.; Dakuia, L.; Zuoshanb, W.; Xiangfaa, L. Evolution, microhardness of ZrAlSi intermetallic and its impact on the elevated-temperature properties in Al–Si alloys. Mater. Sci. Eng. A 2012, 552, 523–529. [Google Scholar] [CrossRef]
  13. Wang, T.; Jin, Z.; Zhao, J.C. Thermodynamic assessment of the Al–Zr binary system. JPE 2001, 22, 544–551. [Google Scholar] [CrossRef]
  14. Litynska, L.; Abou-Ras, D.; Kostorz, G.; Duetkiewicz, J. TEM and HREM study of Al3Zr precipitates in an Al–Mg–Si–Zr alloy. J. Microsc. 2006, 223, 182–184. [Google Scholar] [CrossRef]
  15. Mondolfo, L.F. Aluminum Alloys: Structure and Properties; Butterworths and Co., Ltd.: London, UK, 1976. [Google Scholar] [CrossRef]
  16. Liu, Y.; Tang, M.; Wu, C.; Wang, J.; Su, X. Progress on phase equilibria of the AlSiZr system at 700 and 900 °C. J. Alloys Compd. 2017, 693, 357–365. [Google Scholar] [CrossRef] [Green Version]
  17. Schob, O.; Nowotny, H.; Benesovsky, F. The Ternary Systems (Titanium, Zirconium, Hafnium)-Aluminum-Silicon. Planseeber. Pulvermetall. 1962, 10, 65–71. [Google Scholar]
  18. Beck, A.F.; Heine, M.A.; Caule, E.J.; Pryor, M.J. The kinetics of the oxidation of Al in oxygen at high temperature. Corros. Sci. 1967, 7, 1–22. [Google Scholar] [CrossRef]
  19. Petrova, A.; Stefanov, G.; Yaneva, S.; Avdeev, G.; Miteva, A.; Petrov, R. Influence of the inert particle additives on the properties of the nano-microcrystalline alloys on based on Al–Fe–V–Si. Metallurgist 2020, 64, 3–4. [Google Scholar] [CrossRef]
  20. Stoichev, N.; Petrov, K.; Yaneva, S.; Kovachev, P.; Tzvetanova, N. Micro-structural development in Al–Si microcrystalline alloys. Mater. Sci. Eng. A 2002, 337, 12–16. [Google Scholar] [CrossRef]
  21. Yaneva, S.; Stojanova, L.; Markow, T. Oxidation of Solid Aluminium Silicon Alloys in Air. Cryst. Res. Technol. 1987, 22, 251–258. [Google Scholar] [CrossRef]
  22. Lins, V.F.C.; Paula e Silva, E.M. Autocorrelation treatment of thermogravimetric data with the cochrane-orcutt method. Braz. J. Chem. Eng. 1997, 14, 179–184. [Google Scholar] [CrossRef]
  23. Knoll, A.; Smigiel, E.; Broll, N.; Cornet, A. Study of high temperature oxidation kinetics of steel using grazing X-ray reflectometry. In Advances in X-ray Analysis (AXA)-Denver X-ray Conferences; JCPDS-International Centre for Diffraction Data: Newtown Square, PA, USA, 1999; pp. 170–178. [Google Scholar]
  24. Kiradzhiyska, D.; Drajewicz, M.; Romanowska, J.; Volšak, D.; Gandova, V.; Vassilev, G. Thermochemical and electron microscope studies of fast-cooled cast Al–Si–Zr ribbons and Al–Cu–Nd alloys. Basic Inf. 2014, 1, 15–26. [Google Scholar]
  25. Stefanov, G.; Kiradzhiyska, D.; Avdeev, G. High-temperature oxidation of Al–Si–Zr alloys. In Proceedings of the NDT Days 2013, Sozopol, Bulgaria, 17–21 June 2013; Volume 2, pp. 305–308. (In Bulgarian). [Google Scholar]
  26. Kiradzhiyska, D.; Vassilev, G.; Mantcheva, R. Thermochemical studies of Al–Si–Zr alloys. In Proceedings of the Science and Youth Conference, Plovdiv, Bulgaria, 10–12 April 2014; pp. 319–322. [Google Scholar]
Figure 1. Oxidation kinetic curves registered with: (a) the bulk sample number 3 at 490, 510, 540 and 560 °C; (b) the ribbon sample number 3 at 490, 510 and 540 °C. Normalized weight changes (W, kg/m2) are plotted along the ordinate and the oxidation time (s) along the abscissa.
Metals 11 01893 g001
Figure 2. Natural logarithm of the normalized weight (W, kg/m2) along the ordinate and natural logarithm of time (t, s) are plotted along the abscissa of (a) a bulk number 3 at 490, 510, 540 and 560 °C and (b) a ribbon number 3 at 490, 510 and 540 °C.
Metals 11 01893 g002
Figure 3. Arrhenius plot of the oxidation coefficients (kCR, kg/m2—oxidation coefficient of chemical reaction stage from 0 to 1500 s and kD, kg/m2—oxidation coefficient of diffusion stage from 1500 to 5400 s) at various temperatures (T, K) for estimation of the activation energy of the two stages (CR and D) with bulk sample 3.
Metals 11 01893 g003
Figure 4. Arrhenius plot of the oxidation coefficients (kCR, kg/m2—oxidation coefficient of chemical reaction stage from 0 to 1500 s and kD, kg/m2—oxidation coefficient of diffusion stage from 1500 to 5400 s) at various temperatures (T, K) for estimation of the activation energy of the two stages (CR and D) with ribbon sample 3.
Metals 11 01893 g004
Figure 5. DTA curves at heating (first run) of bulk samples nos. 1B, 2B, 3B, and DSC curve of bulk no. 4B, normalized by factor 50. DTA signal (μV) along the ordinate and temperature (°C) along the abscissa are plotted.
Metals 11 01893 g005
Figure 6. DSC curves at heating and cooling of bulk number 3. DSC signal (mW/mg) along the ordinate and temperature (°C) along the abscissa are plotted.
Metals 11 01893 g006
Figure 7. Cross-section optical image of the ribbon microstructure. Upper zone is at the side of the cooling wheel (WS) and presents smaller grain sizes, while the lower zone is at the air side (AS) and the grain sizes are bigger.
Metals 11 01893 g007
Figure 8. Microstructure of bulk alloy number 3 taken by optical microscope—under eutectic structure with pronounced aluminum phase (Al), silicon phases (Si) in the form of plates, and an intermetallics (Al–Si–Zr) in the form of darker flake-like morphology.
Metals 11 01893 g008
Figure 9. Microstructure of bulk alloy number 3 taken by electron microscope in back scattered electrons—Al-matrix in darker and flake-like morphology of AlSiZr intermetallics with average length around 100 μm.
Metals 11 01893 g009
Figure 10. Schematic ternary compound composition (in atomic percents) revealed by SEM-EDS before and after the oxidation at 540 °C for 90 min. The circles () represent its composition before oxidation, while the rectangular (■) represent its composition after oxidation.
Metals 11 01893 g010
Figure 11. SEM image in back scattered electrons of bulk number 2 before oxidation with composition of the intermetallics (spectrum 37) shown in Table 7. The bright particle (Sp 37) is associated with the compound Al72Si10Zr17.
Metals 11 01893 g011
Figure 12. SEM image in back scattered electrons of bulk number 2 after oxidation with composition of the intermetallics (spectrum 9) shown in Table 7. The particle (Sp 9) corresponds to the formulae Al42Si37Zr21 without counting the oxygen content.
Metals 11 01893 g012
Table 1. Experimentally determined chemical compositions of the master alloys and ribbons. NB and NR—consecutive number of the master (bulk) alloys and of the respective ribbons; cSi—Si content of the master alloy (mass %); cZr—Zr content of the master alloy and the respective ribbon (mass %); cAl—estimated aluminum content; RSD—relative standard deviation (mass %) of the chemical compositions.
Wet Chemistry and Spectral MethodsICP-OES Methods
NBcSi
(Mass %)
cZr
(Mass %)
cAl
(Mass %)
NBcZr ± RSD
(Mass %)
NRcZr ± RSD
(Mass %)
1B9.700.3090.001B0.26 ± 0.011R0.27 ± 0.01
2B10.000.8289.182B0.99 ± 0.062R1.09 ± 0.08
3B11.301.2087.503B1.19± 0.053R1.16 ± 0.07
4B9.301.4089.304B1.38 ± 0.064R1.34 ± 0.03
Table 2. Experimental conditions of the thermogravimetric tests with bulk alloys (NB) and ribbons (NR). Temperature (t) in °C and respective standard deviation (SD).
NBt ± SD
(°C)
Duration
(s)
NRt ± SD
(°C)
Duration
(s)
1B541.4 ± 0.454001R540.4 ± 0.45400
2B541.4 ± 0.454002R540.7 ± 0.45400
3B541.3 ± 0.453523R541.4 ± 0.45400
3B540.6 ± 0.37200---
4B541.3 ± 0.454004R541.0 ± 0.45400
3B490.0 ± 0.454003R490.0 ± 0.45400
3B510.0 ± 0.454003R510.0 ± 0.45400
3B560.0 ± 0.45400---
Table 3. Exponent values (ni) of Equation (1) and the respective standard deviations (SDi) for bulk (B) and ribbon (R) samples at various temperatures (t, °C), obtained in logarithmic coordinates. No—sample number, n1 and n2—exponent values for the time intervals 0–1500 s and 1500–5400 s, respectively. k1,ef (kg/m2s) and k2,ef (kg/m2s) represent the effective oxidation rate constants for the first and second time periods, in that order.
Not
(°C)
n1 ± SDn1(k1,ef ± SDk1,ef) × 10–6
(kg/m2s)
n2 ± SDn2k2,ef ± SDk2,ef
(kg/m2s)
1B5400.998 ± 0.0021.887 ± 0.0202.120 ± 0.004(2.230 ± 0.060) × 109
2B5401.106 ± 0.0020.758 ± 0.0302.108 ± 0.004(2.900 ± 0.060) × 109
3B5401.135 ± 0.0011.158 ± 0.0102.397 ± 0.004(9.530 ± 0.140) × 1010
4B5401.140 ± 0.0010.870 ± 0.0302.391 ± 0.004(5.680 ± 0.070) × 1010
3B4901.146 ± 0.0010.355 ± 0.0032.630 ± 0.005(1.930 ± 0.030) × 1011
3B5101.072 ± 0.0020.841 ± 0.0102.530 ± 0.005(8.840 ± 0.130) × 1011
3B5601.300 ± 0.0021.499 ± 0.0102.225 ± 0.003(2.000 ± 0.020) × 108
1R5401.031 ± 0.0010.199 ± 0.0031.858 ± 0.003(3.056 ± 0.060) × 1010
2R5401.091 ± 0.0010.176 ± 0.0042.362 ± 0.004(1.100 ± 0.020) × 1011
3R5401.132 ± 0.0010.102 ± 0.0062.143 ± 0.004(3.852 ± 0.002) × 1011
4R5401.097 ± 0.0020.930 ± 0.0042.269 ± 0.004(2.940 ± 0.020) × 1011
3R4901.043 ± 0.0020.051 ± 0.0012.816 ± 0.004(4.788 ± 0.003) × 1015
3R5100.964 ± 0.0020.245 ± 0.0021.743 ± 0.004(3.578 ± 0.001) × 1010
Table 4. Reaction rate constants kCR (for the time intervals 0–1500 s) and kD (for the time intervals 1500–5400 s) of (a) bulk and (b) ribbon samples at various temperatures and the respective activation energies (EA,CR, EA,D) in kJ/mol, R—correlation coefficient, t—temperature in °C, SD—standard deviation, kJ/mol.
(a)
Not
(°C)
lnkCR ± SDlnkD ± SDEA,CR ± SD
(kJ/mol)
EA,D ± SD
(kJ/mol)
3B490−14.8501 ± 0.0067−24.6708 ± 0.0146106.30 ± 20.45
R2 = 0.896
525.20 ± 64.85
R2 = 0.955
3B510−13.9881 ± 0.0089−23.1497 ± 0.0144
3B540−13.6688 ± 0.0062−20.7716 ± 0.0142
3B560−13.4102 ± 0.0077−17.7294 ± 0.0106
1B540−13.1797 ± 0.0078−19.9213 ± 0.0137--
2B540−14.0926 ± 0.0071−19.6584 ± 0.0121--
4B540−13.9528 ± 0.0081−21.2880 ± 0.0120--
(b)
Not
(°C)
lnkCR ± SDlnkD ± SDEA,CR
(kJ/mol)
EA,D
(kJ/mol)
3R490−16.7894 ± 0.0087−32.9727 ± 0.023456.26 ± 9.88
R2 = 0.360
250.92 ± 123.37
R2 = 0.887
3R510−15.2211 ± 0.0155−21.7510 ± 0.0082
3R540−16.0989 ± 0.0057−23.9799 ± 0.0131
1R540−15.4276 ± 0.0157−21.9093 ± 0.0117--
2R540−15.5500 ± 0.0167−25.2330 ± 0.0257--
4R540−15.4594 ± 0.0127−24.2498 ± 0.0241--
Table 5. Results of DTA experiments with Al–Si–Zr samples 1B, 2B, 4B at heating (Noh) and cooling (Noc). Temperature regime: heating rate—10 deg/min and cooling rate of 40 deg/min, Pn—thermal arrest with standard deviation (SD), °C; ΔHn—corresponding enthalpy change with standard deviation, J g −1; “–” missing thermal arrest in the respective run.
NoP1 ± SD
(°C)
ΔH1 ± SD
(J g −1)
P2 ± SD
(°C)
ΔH2 ± SD
(J g −1)
P3 ± SD
(°C)
ΔH3 ± SD
(J g −1)
1Bh574.7 ± 0.97.6 ± 0.5
1Bc580.7 ± 0.1−5.2 ± 0.3586.8 ± 0.30.6 ± 0.7≈12003.23 ± 0.6
2Bh574.6 ± 0.26.7 ± 0.7
2Bc574.2 ± 3.6−4.1 ± 0.3594.2 ± 0.1−0.5 ± 0.2
4Bh574.5 ± 0.46.4 ± 0.6
4Bc580.5 ± 0.4−3.9 ± 0.1588.2 ± 0.1−0.2 ± 0.1≈12001.3 ± 0.4
Table 6. Results of DSC experiments with Al–Si–Zr sample No. 3B at heating (Noh) and cooling (Noc). Temperature regime: heating rate—10 deg/min and cooling rate of 40 deg/min, Pn—thermal arrest with standard deviation (SD), °C; ΔHn—corresponding enthalpy change with standard deviation, J g −1; “–” missing thermal arrest at the respective run.
NoP1
(°C)
ΔH1 ± SD
(J g −1)
P2
(°C)
ΔH2 ± SD
(J g −1)
P3
(°C)
ΔH3 ± SD
(J g −1)
3Bh575.8 ± 0.417.8 ± 13.31475.5 ± 3.573.4 ± 74
3Bc572.1 ± 6.9−27.7 ± 21.71486.7 ± 1.6−333 ± 34
Table 7. Relative Al, Si and Zr content of bulk alloys before and after high temperature oxidation. No—consecutive number of the bulk alloy; Sp.—number of the spectrum; concentration of Al, Si and Zr in the ternary compound before and after oxidation, in atomic percent; Average—average composition of all spectrums with the respective standard deviation (SD).
NoSp.Before OxidationSp.After Oxidation
Al
(At.%)
Si
(At.%)
Zr
(At.%)
Al
(At.%)
Si
(At.%)
Zr
(At.%)
1B2676.6611.9011.44142.5634.6222.82
2770.3918.3711.24349.0332.7918.18
----441.2947.1111.61
----642.5636.2021.24
----749.8932.6317.48
2B3275.988.4915.54944.1234.8621.02
3373.688.2418.081140.9736.4422.58
----1239.5237.3623.12
3B3564.4711.0824.441338.2338.0123.76
3669.0210.7020.281543.9035.0821.02
3771.0110.2118.781639.8337.5622.61
----1736.8339.3123.85
4B3964.8410.4924.671939.9634.8425.20
4074.438.4617.112035.1440.2824.58
4175.758.1516.092148.7931.3119.90
-80.006.9413.06----
Average-72.3810.2817.34-42.1836.5621.26
SD-4.933.094.59-4.253.703.35
Table 8. Vickers hardness (HV, kgf/mm2) measured of bulk (NB) and ribbon (NR) samples, SD—standard deviation, H—hardness (MPa).
NBHV ± SD
(kgf/mm2)
H ± SD
(MPa)
NRHV± SD
(kgf/mm2)
H ± SD
(MPa)
1B54 ± 3533 ± 321R99 ± 11974 ± 105
2B55 ± 5538 ± 532R100 ± 51077 ± 46
3B54 ± 4534 ± 393R102 ± 12996 ± 116
4B48 ± 2473 ± 224R121 ± 21191 ± 20
Publisher’s Note: MDPI stays neutral with regard to jurisdictional claims in published maps and institutional affiliations.

