
Phase Transitions in the Co–Al–Nb–Mo System


Abstract
:1. Introduction
2. Materials and Methods
3. Results and Discussion
4. Conclusions
Author Contributions
Funding
Institutional Review Board Statement
Informed Consent Statement
Data Availability Statement
Conflicts of Interest
References
- Zhu, L.; Wei, C.; Qi, H.; Jiang, L.; Jin, Z.; Zhao, J.C. Experimental investigation of phase equilibria in the Co-rich part of the Co-Al-X (X = W, Mo, Nb, Ni, Ta) ternary systems using diffusion multiples. J. Alloys Compd. 2017, 691, 110–118. [Google Scholar] [CrossRef]
- Makineni, S.K.; Nithin, B.; Chattopadhyay, K. A new tungsten-free γ–γ′ Co–Al–Mo–Nb-based superalloy. Scr. Mater. 2015, 98, 36–39. [Google Scholar] [CrossRef]
- Tomaszewska, A.; Mikuszewski, T.; Moskal, G.; Migas, D. Primary microstructure, microsegregation and precipitates characterization of an as-cast new type γ-γ′ Co-Al-Mo-Nb cobalt-based superalloy. J. Alloys Compd. 2018, 750, 741–749. [Google Scholar] [CrossRef]
- Shaipov, R.K.; Kerimov, E.Y.; Slyusarenko, E.M. Isothermal Section of the Phase Diagram of the Co–Nb–Mo Ternary System at 1375 K. Mosc. Univ. Chem. Bull. 2015, 70, 183–189. [Google Scholar] [CrossRef]
- Dovbenko, O.; Stein, F.; Palm, M.; Prymak, O. Experimental determination of the ternary Co-Al-Nb phase diagram. Intermetallics 2010, 18, 2191–2207. [Google Scholar] [CrossRef]
- Raghavan, V. Al-Co-Nb (Aluminum-Cobalt-Niobium). J. Phase Equilibria 2012, 33, 472–473. [Google Scholar] [CrossRef]
- He CStein, F.; Palm, M. Thermodynamic description of the systems Co–Nb, Al–Nb and Co–Al–Nb. J. Alloys Compd. 2015, 637, 361–375. [Google Scholar] [CrossRef]
- Saunders, N. The AI-Mo System (Aluminum-Molybdenum). J. Phase Equilibria 1997, 18, 370–378. [Google Scholar] [CrossRef]
- Davydov, A.; Kattner, U.R. Thermodynamic Assessment of the Co-Mo System. J. Phase Equilibria 1999, 20, 5–16. [Google Scholar] [CrossRef]
- Okamoto, H. Co-Nb (Cobalt-Niobium). J. Phase Equilibria 2010, 31, 94–95. [Google Scholar] [CrossRef]
- McAIieter, A.J. The Al-Co (Aluminum-Cobalt) System. Bull. Alloy Phase Diagr. 1989, 10, 646–650. [Google Scholar]
- Brewer, L.; Lamoreaux, R.H. The Mo-Nb phase diagram. In Compendium of Phase Diagram Data, Air Force Materials Laboratory; Rudy, E., Ed.; Rep. No. AFML-TR-65-2, Part V; Wright-Patterson AFB: Montgomery, OH, USA, 1969. [Google Scholar]
- da Silva, A.A.A.P.; Coelho, G.C.; Nunes, C.A.; Fiorani, J.M.; David, N.; Vilasi, M. Nb-Al Binary System: Reevaluation of the Solubility Limits of the (Nb), Nb3Al, Nb2Al and NbAl3 Phases at High Temperatures. Mater. Res. 2019, 22, e20190305. [Google Scholar] [CrossRef]
- Lyakishev, N.P. (Ed.) Phase Diagrams of Binary Metallic Systems; Mechanical Engineering: Moscow, Russia, 1996–2000; ISBN 5-217-02688-Х. [Google Scholar]
- Makineni, S.K.; Nithin, B.; Palanisamy, D.; Chattopadhyay, K. Phase evolution and crystallography of precipitates during decomposition of new ‘‘tungsten-free’’ Co(Ni)-Mo-Al-Nb γ/γ′ superalloys at elevated temperatures. J. Mater. Sci. 2016, 51, 7843–7860. [Google Scholar] [CrossRef]
- Damian Migas, D.; Moskal, G.; Maciąg, T. Thermal analysis of W-free Co–(Ni)–Al–Mo–Nb superalloys. J. Therm. Anal. Calorim. 2020, 142, 149–156. [Google Scholar] [CrossRef] [Green Version]
- Davydov, D.I.; Kazantseva, N.V.; Ezhov, I.V.; Gaviko, V.S.; Popov, N.A. Study of structural phase transformations in cobalt heat resistant alloys. AIP Conf. Proc. 2020, 2310, 020070. [Google Scholar] [CrossRef]
- Davydov, D.; Kazantseva, N.; Ezhov, I.; Popova, E. Effect of alloying on the γ-γ′ microstructure of W-free Co-based superalloys. Mater. Today Proc. 2021, 38, 1971–1973. [Google Scholar] [CrossRef]
- Kazantseva, N.V.; Stepanova, N.N.; Vinogradova, N.I.; Demakov, S.L.; Yurovskikh, A.S.; Davydov, D.I.; Shishkin, D.A.; Rigmant, M.B.; Romanov, E.P. Study of the martensitic transformation in the Co-9 at % Al alloy. Phys. Met. Metallogr. 2016, 117, 42–48. [Google Scholar] [CrossRef]
- Grüner, D.; Stein, F.; Palm, M.; Konrad, J.; Ormeci, A.; Schnelle, W.; Grin, Y.; Kreiner, G. Preparation, phase stability and structure of the C36 Laves phase Nb1–xCo2+x. Z. Krist.-Cryst. Mater. 2006, 221, 319–333. [Google Scholar] [CrossRef] [Green Version]
- Aufrecht, J.; Leineweber, A.; Duppel, V.; Mittemeijer, E.J. Layer-stacking irregularities in C36-type Nb-Cr and Ti-Cr Laves phases and their relation with polytypic phase transformations. Philos. Mag. 2010, 90, 3149–3175. [Google Scholar] [CrossRef] [Green Version]
- Palm, M.; He, C.; Dovbenko, O.; Stein, F.; Schuster, J.C. Liquidus Projection and Reaction Scheme of the Co-Al-Nb System. J. Phase Equilibria Diffus. 2012, 33, 210–221. [Google Scholar] [CrossRef] [Green Version]
- Stein, F.; Leineweber, A. Laves phases: A review of their functional and structural applications and an improved fundamental understanding of stability and properties. J. Mater. Sci. 2021, 56, 5321–5427. [Google Scholar] [CrossRef]
- Co3Mo. Available online: https://materialsproject.org/materials/mp-1139/ (accessed on 26 October 2021).
- Co2Nb. Available online: https://materialsproject.org/materials/Co2Nb/ (accessed on 26 October 2021).


| Alloy/Elements | Co | Al | Nb | Mo |
|---|---|---|---|---|
| 1 | Bal. | 10 (9.8) | - | - |
| 2 | Bal. | 10 (9.68) | - | 5 (4.86) |
| 3 | Bal. | 10 (8.92) | 2 (1.9) | - |
| 4 | Bal. | 10 (9.86) | 2 (2.08) | 5 (4.77) |
| 5 | Bal. | 10 (8.86) | 3 (3.14) | 7 (7.5) |
| 6 | Bal. | 10 (9.46) | 4 (4) | 3 (2.9) |
| 7 | Bal. | 10 (8.9) | 9 (9.3) | 7 (6.5) |
| 8 | Bal. | 10 (9.1) | 5 (4.7) | 5 (5.2) |
| Phase | Structural Type | References |
|---|---|---|
| MoCo3 | D019, P63/mmc, 194, Mg3Cd | [3,15] |
| α– (Co) | A1, Fmm, 225, Cu, | [2,3,15,17,18] |
| α–Co2Nb | C36, P63/mmc, 194, MgNi2 | [16] |
| β–Co2Nb | C14, P63/mmc, 194, MgZn2 | [17,18] |
| γ–Co2Nb | C15, Fdm, 227, Cu2Mg | [3] |
| CoAl | B2, Pmm, 221, CsCl | [15] |
| Co3(Al,Nb,Mo) | L12, Pmm, 221, Cu3Au | [2,3,15,17,18] |
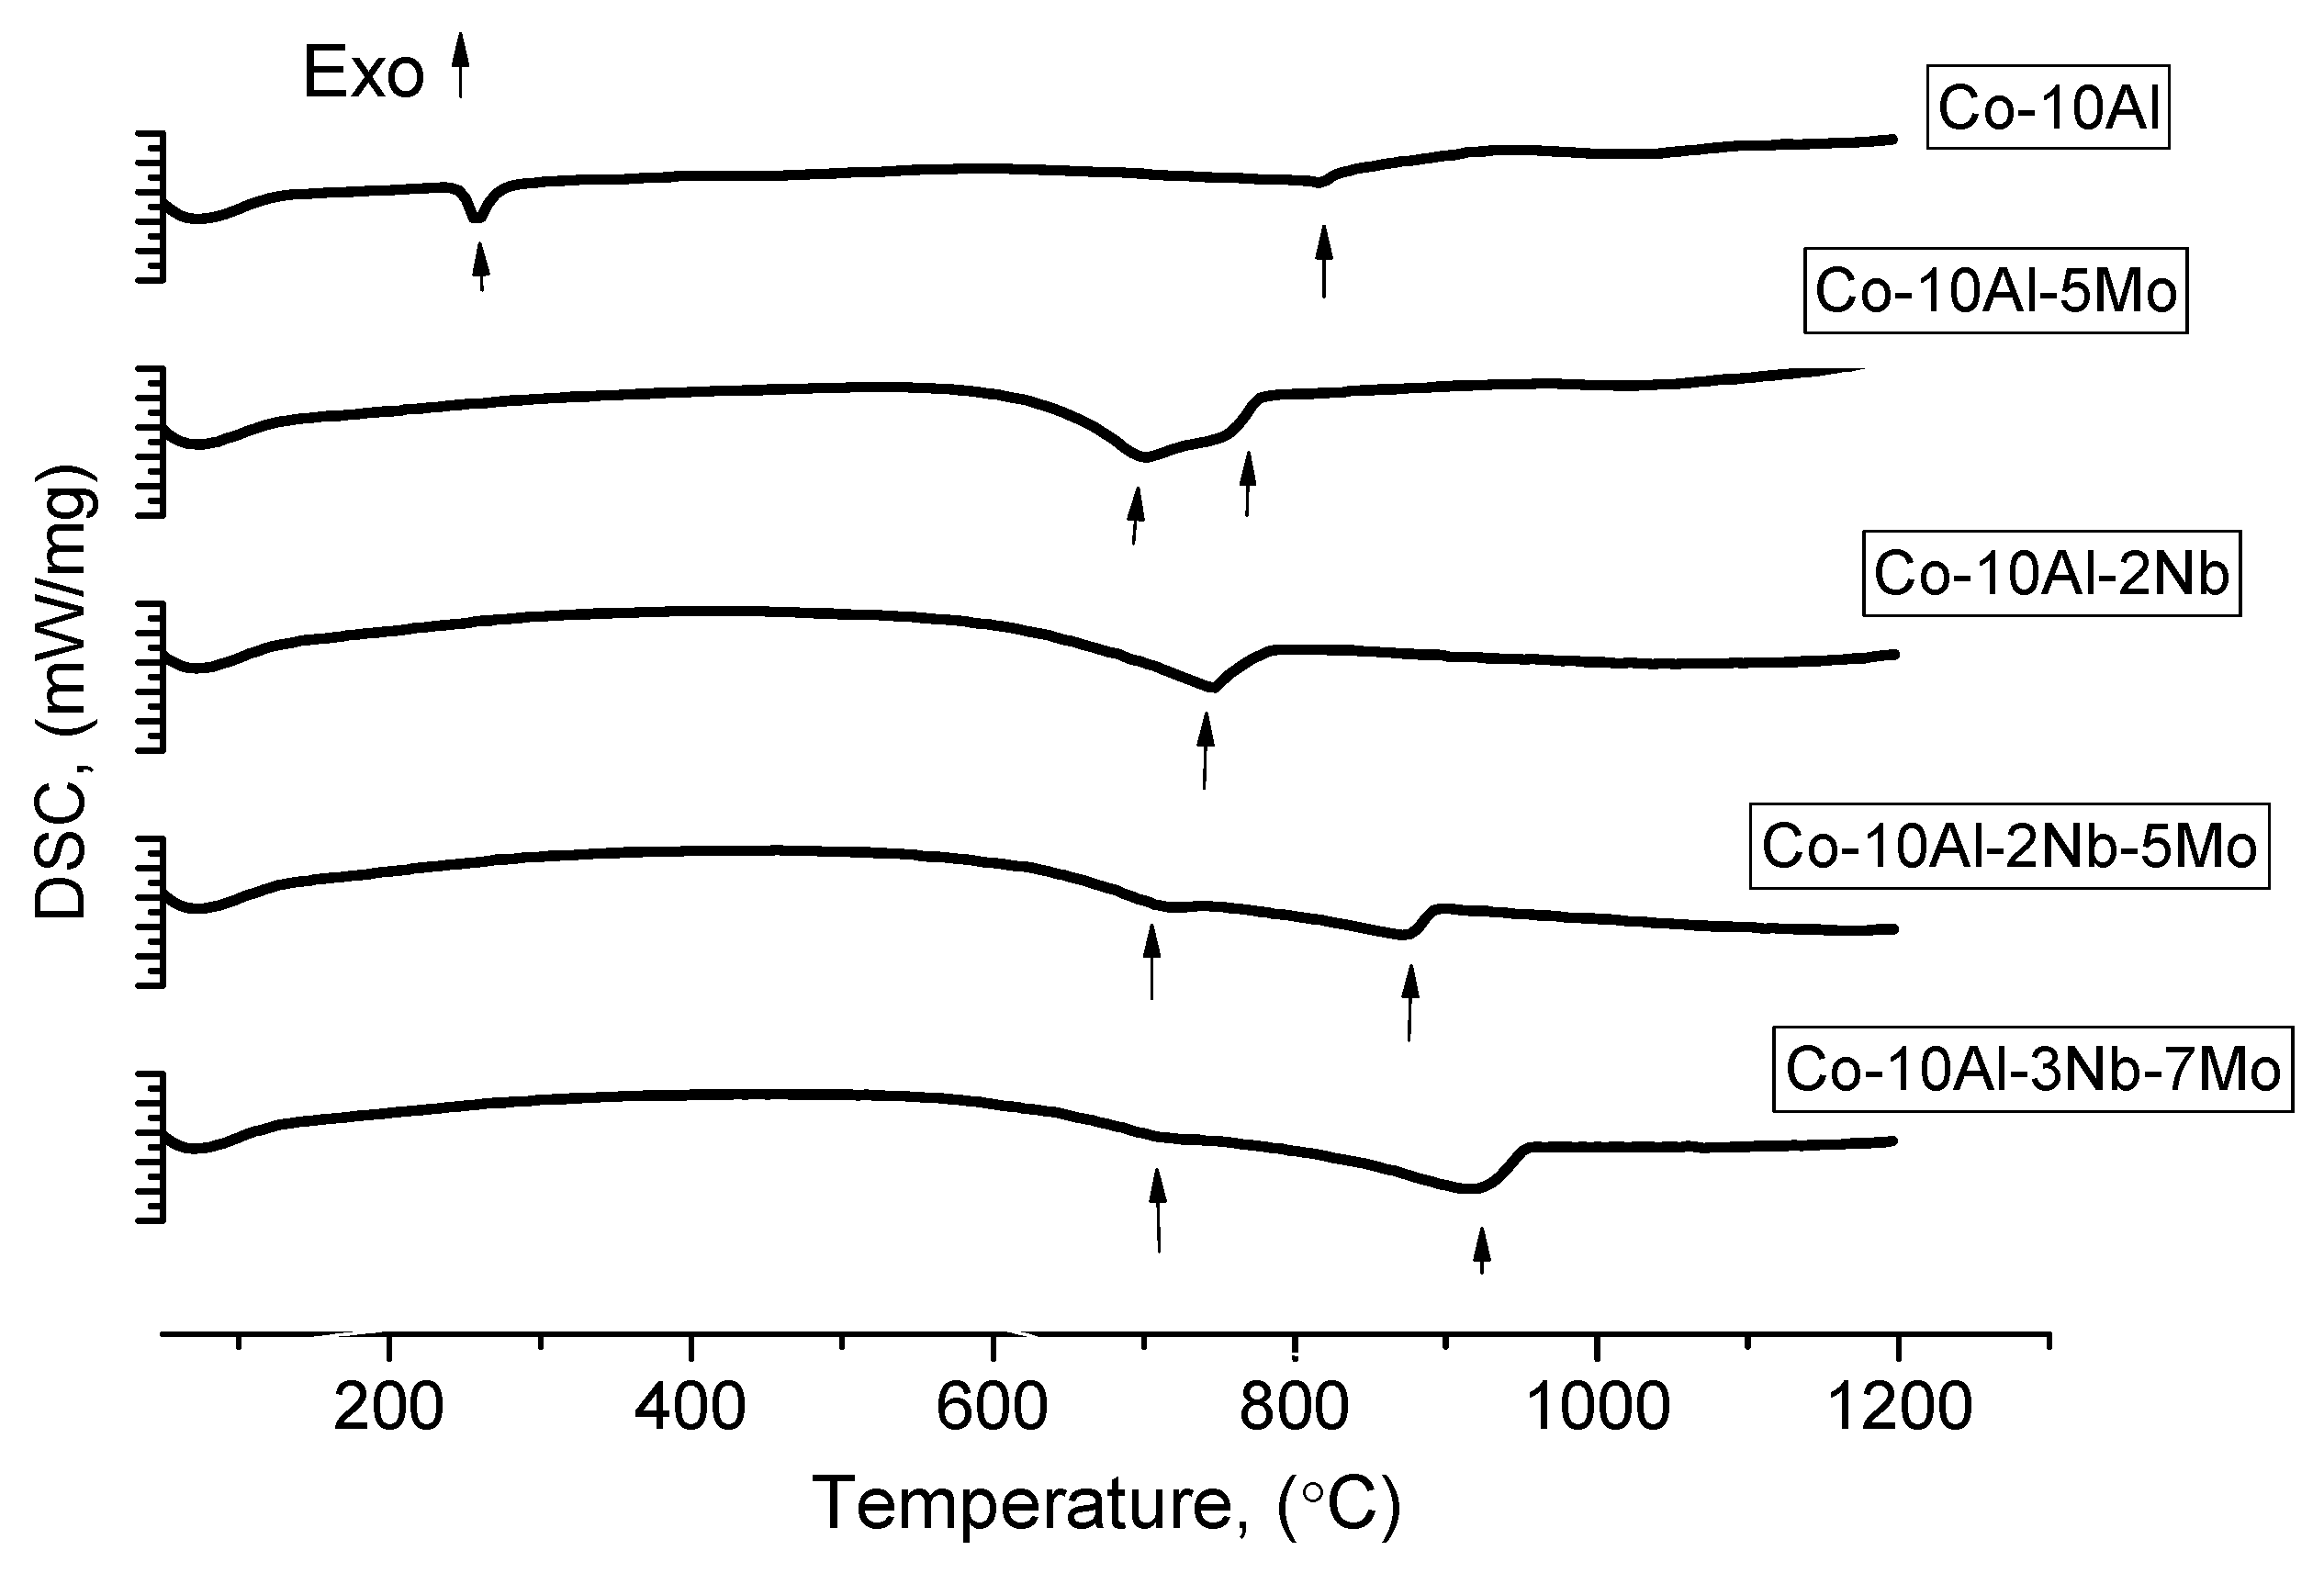
| Alloy | Nominal Composition, at.% | The Temperature of the Phase Transitions, °C (Heating) | The Temperature of the Phase Transitions, °C (Cooling) | |||||||
|---|---|---|---|---|---|---|---|---|---|---|
| Co | Al | Nb | Mo | |||||||
| 1 | base | 10 | - | - | 256 | 820 | - | - | 200 | 800 |
| 2 | base | 10 | - | 5 | - | 696 | 757 | - | 626 | 682 |
| 3 | base | 10 | 2 | - | - | 742 | - | - | - | 687 |
| 4 | base | 10 | 2 | 5 | - | 707 | 867 | - | 650 | 847 |
| 5 | base | 10 | 3 | 7 | - | 711 | 916 | - | - | 911 |
| 6 | base | 10 | 4 | 3 | - | 720 | 914 | - | 640 | 880 |
| 7 | base | 10 | 9 | 7 | 390 | 707 | 950 | - | 896 | |
| 8 | base | 10 | 5 | 5 | 397 | 632 | 721 | 942 | 650 | 917 |
| Alloy No. | Nominal Composition, at.% | Phase Composition of the Alloys | Concentration of the Elements in the Alloy Phases, at.% | ||||||
|---|---|---|---|---|---|---|---|---|---|
| Co | Al | Nb | Mo | Co | Al | Nb | Mo | ||
| 1 | base | 10 | - | - | εCo + αCo | 91.57 | 8.43 | - | - |
| 2 | base | 10 | - | 5 | Γ + Co3Mo (DO19) | 86.42 | 8.94 | - | 4.64 |
| 3 | base | 10 | 2 | - | γ (+B2) | 88.75 | 9.34 | 1.91 | - |
| α-Co2Nb (C36) | 85.34 | 8.74 | 5.92 | - | |||||
| 4 | base | 10 | 2 | 5 | γ + γ′ | 84.33 | 9.03 | 1.95 | 4.69 |
| α-Co2Nb (C36) (or Co3Mo?) | 80.04 | 7.99 | 6.01 | 5.96 | |||||
| 5 | base | 10 | 3 | 7 | γ/γ′ | 77.8 | 7.8 | 4.3 | 10.1 |
| β-Co2Nb (C14) | 63.2 | 4.9 | 15.9 | 15.9 | |||||
| 6 | base | 10 | 4 | 3 | γ/γ′ | 81.73 | 9.54 | 3.66 | 5.07 |
| β-Co2Nb (C14) | 70.15 | 4.40 | 17.73 | 7.72 | |||||
| α-Co2Nb (C36) | 75.82 | 6.79 | 11.09 | 6.30 | |||||
| 7 | base | 10 | 9 | 7 | γ/γ′ | 85.82 | 8.86 | 1.91 | 3.41 |
| B2 | 72.47 | 22.74 | 3.18 | 1.62 | |||||
| α-Co2Nb(C14) | 72.39 | 3.81 | 17.68 | 6.12 | |||||
| 8 | base | 10 | 5 | 5 | γ/γ′ | 84.32 | 9.21 | 4.05 | 2.43 |
| β-Co2Nb(C14) | 72.34 | 3.86 | 20.18 | 3.61 | |||||
| α-Co2Nb (C36) | 76.69 | 6.06 | 14.35 | 2.95 | |||||
Publisher’s Note: MDPI stays neutral with regard to jurisdictional claims in published maps and institutional affiliations. |
© 2021 by the authors. Licensee MDPI, Basel, Switzerland. This article is an open access article distributed under the terms and conditions of the Creative Commons Attribution (CC BY) license (https://creativecommons.org/licenses/by/4.0/).
Share and Cite
Davydov, D.; Kazantseva, N.; Popov, N.; Vinogradova, N.; Ezhov, I. Phase Transitions in the Co–Al–Nb–Mo System. Metals 2021, 11, 1887. https://doi.org/10.3390/met11121887
Davydov D, Kazantseva N, Popov N, Vinogradova N, Ezhov I. Phase Transitions in the Co–Al–Nb–Mo System. Metals. 2021; 11(12):1887. https://doi.org/10.3390/met11121887
Chicago/Turabian StyleDavydov, Denis, Nataliya Kazantseva, Nikolai Popov, Nina Vinogradova, and Igor Ezhov. 2021. "Phase Transitions in the Co–Al–Nb–Mo System" Metals 11, no. 12: 1887. https://doi.org/10.3390/met11121887
APA StyleDavydov, D., Kazantseva, N., Popov, N., Vinogradova, N., & Ezhov, I. (2021). Phase Transitions in the Co–Al–Nb–Mo System. Metals, 11(12), 1887. https://doi.org/10.3390/met11121887