
Fatigue Life and Reliability of Steel Castings through Integrated Simulations and Experiments


Abstract
:1. Introduction
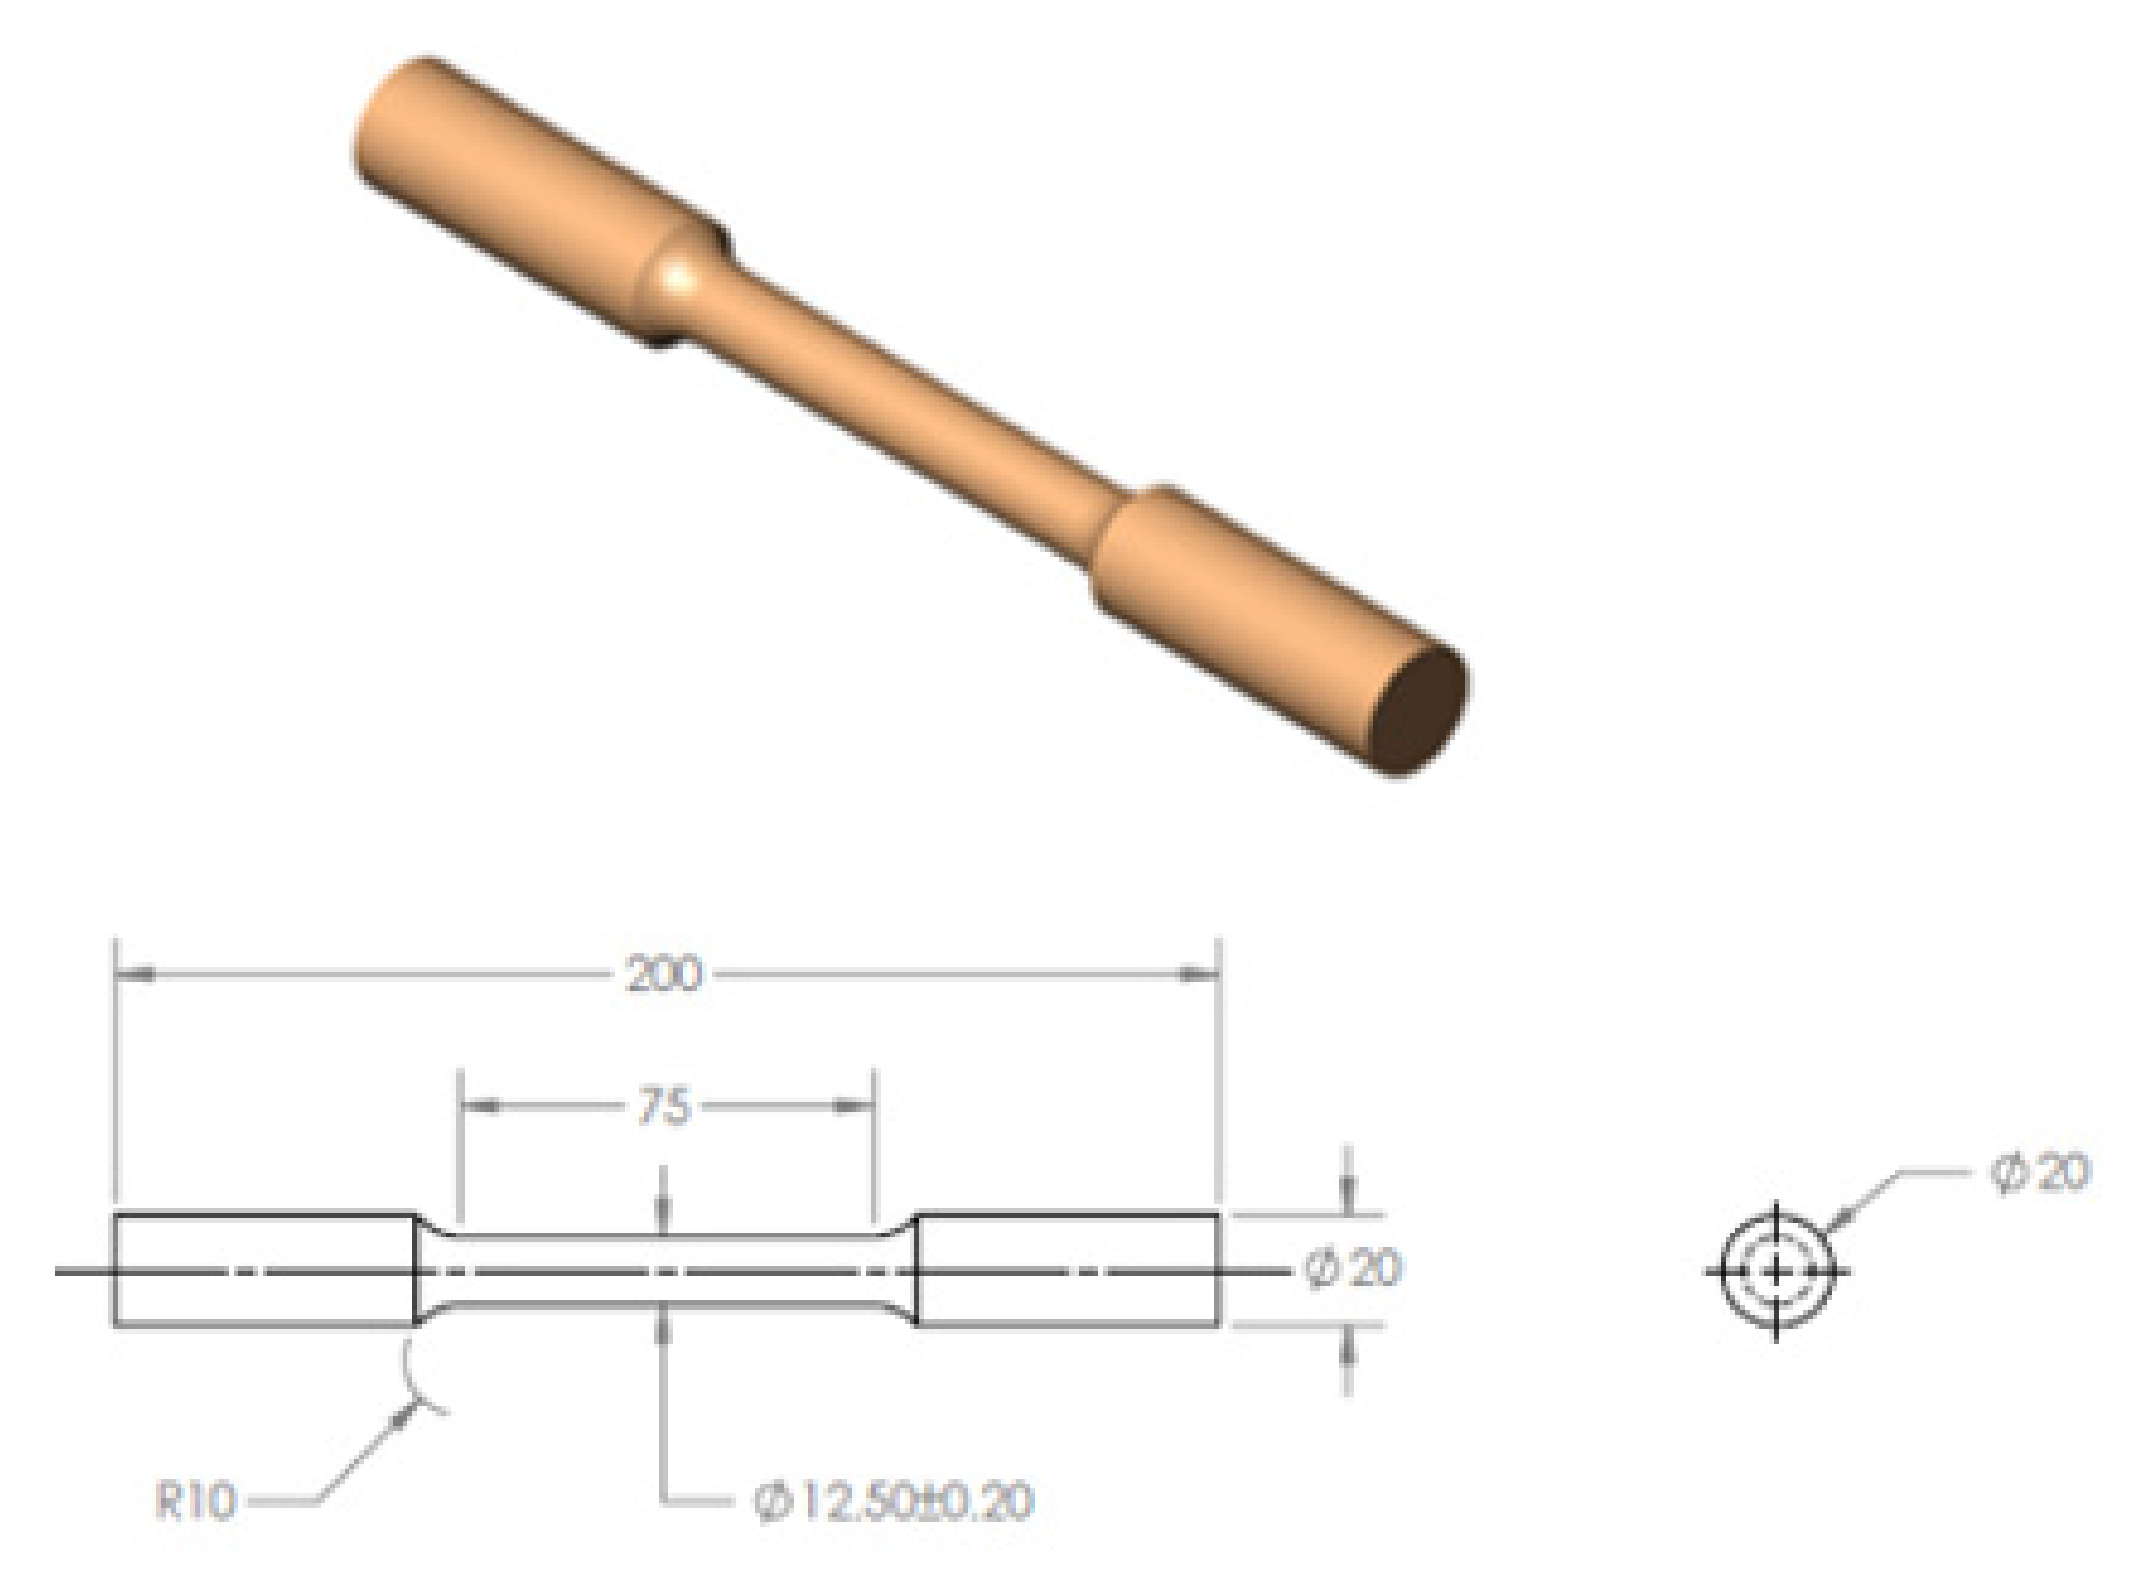
2. Materials
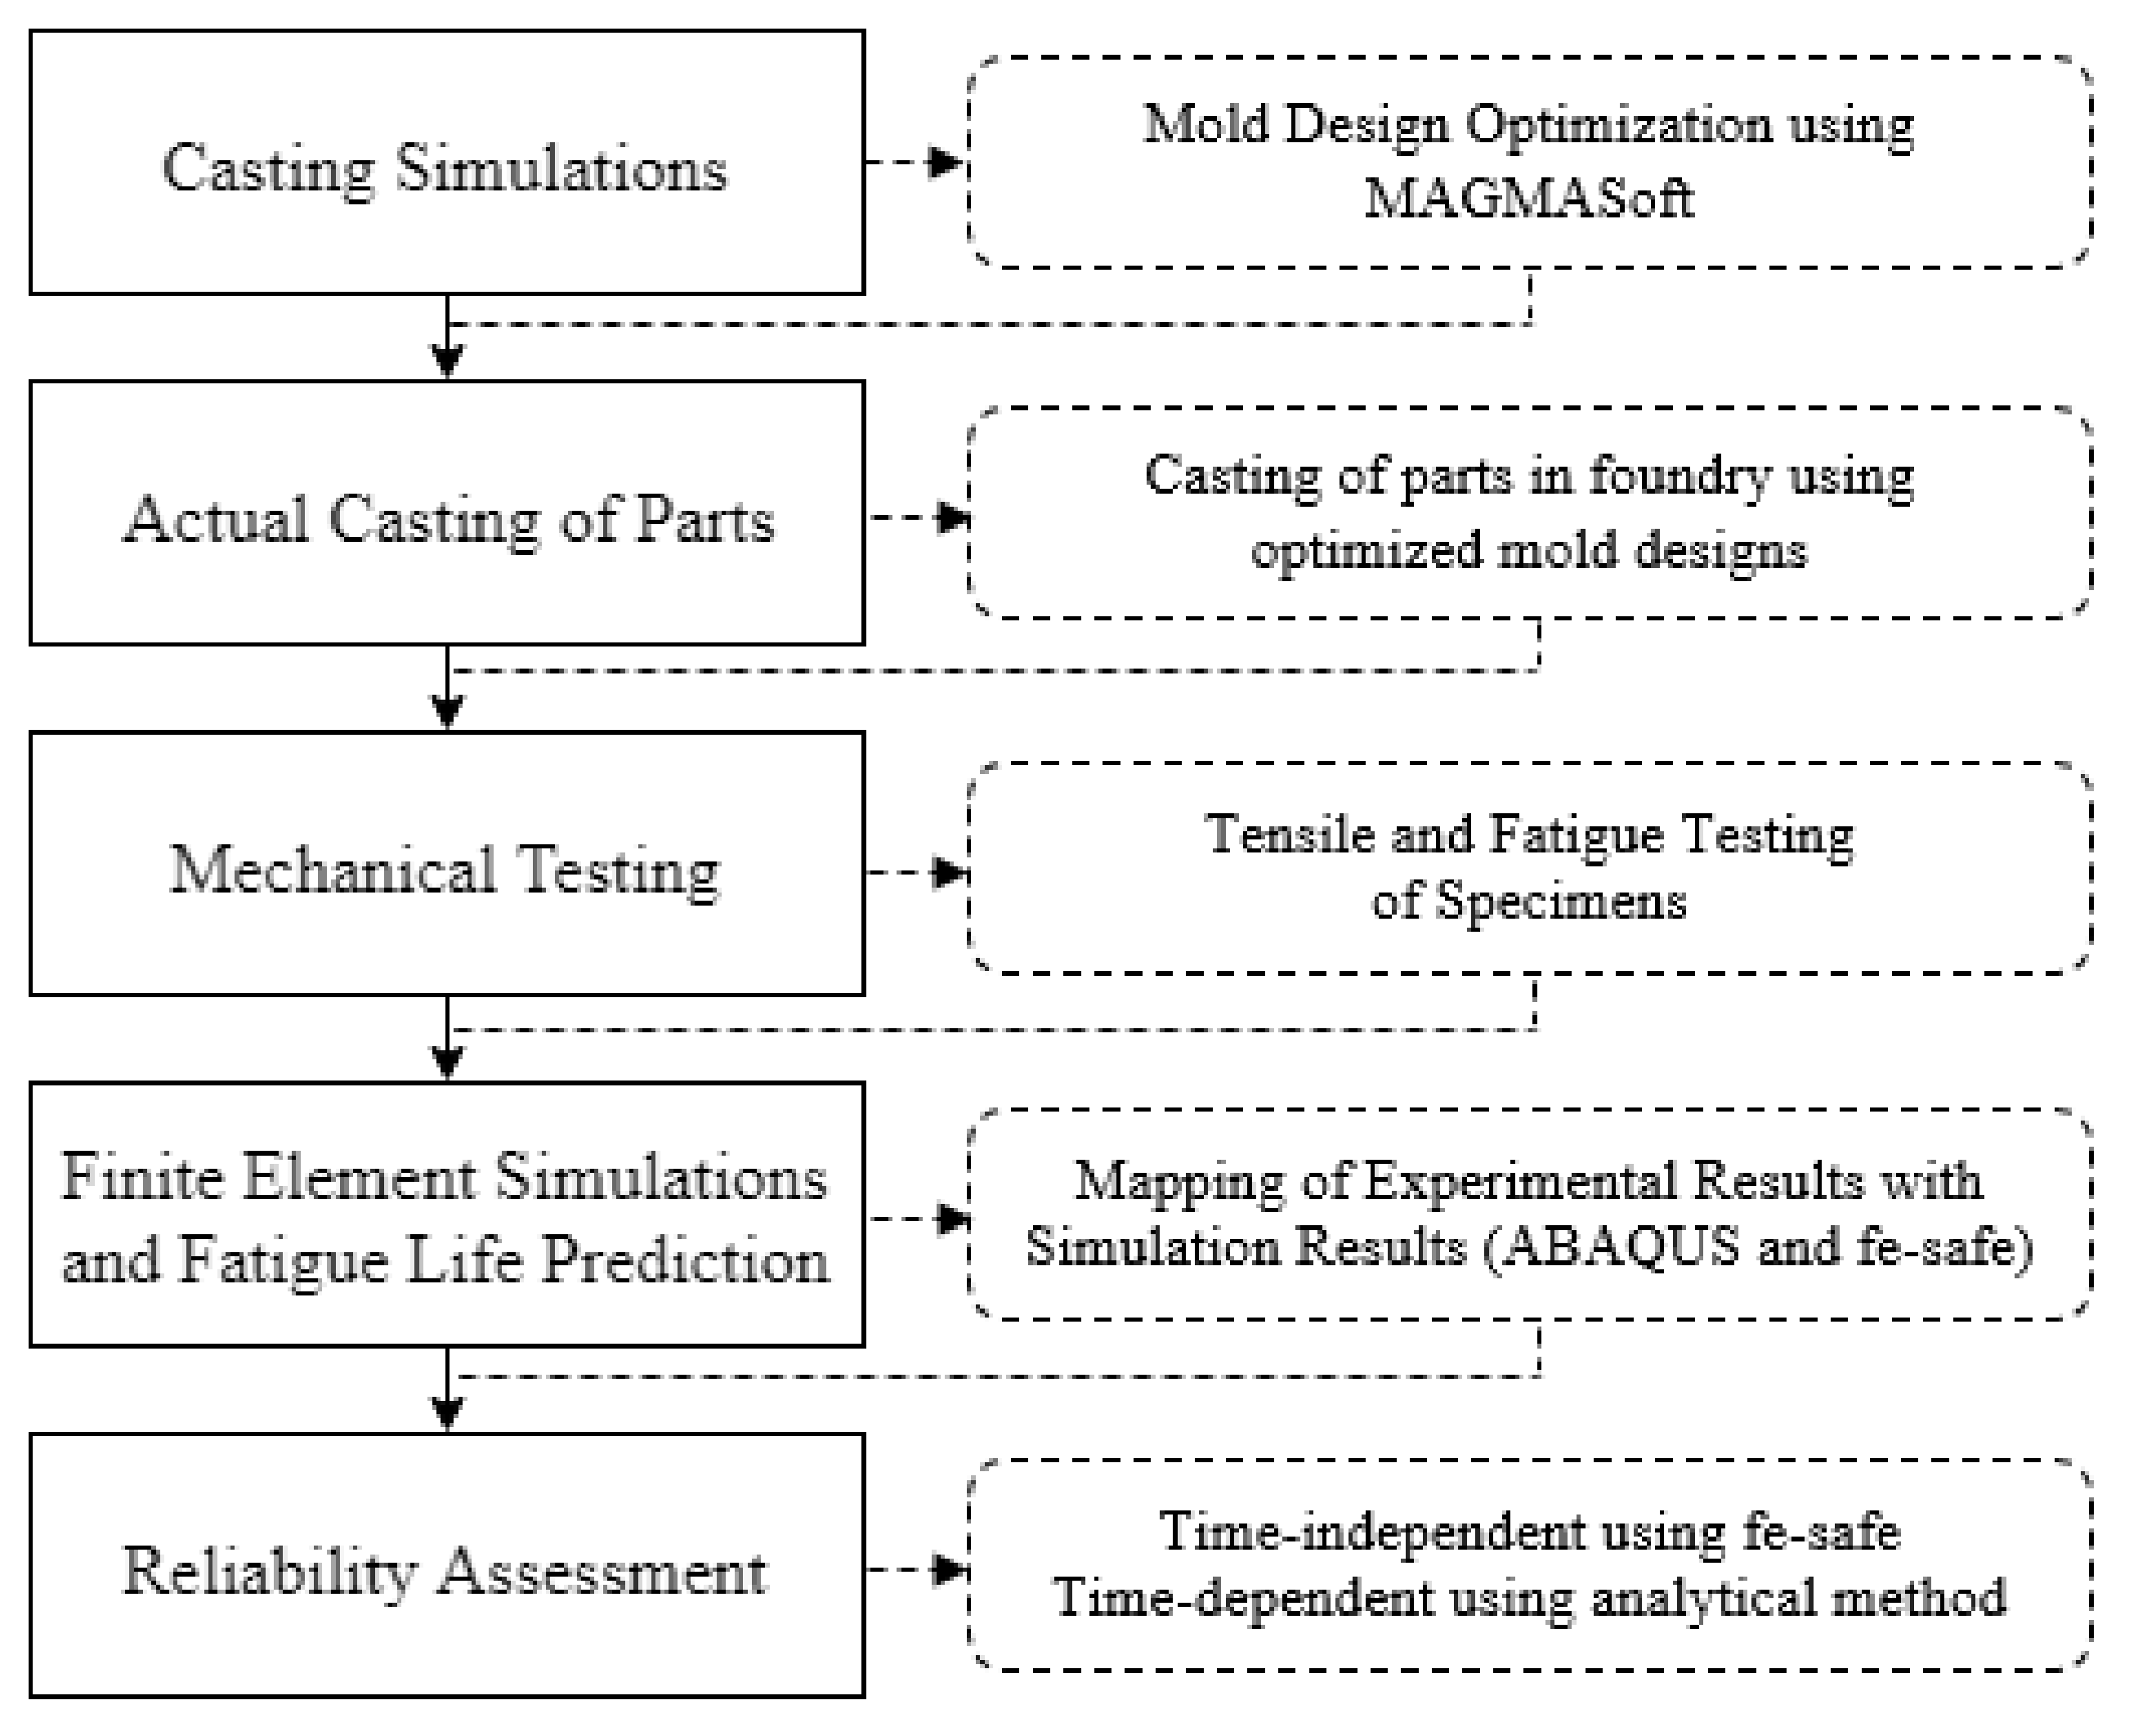
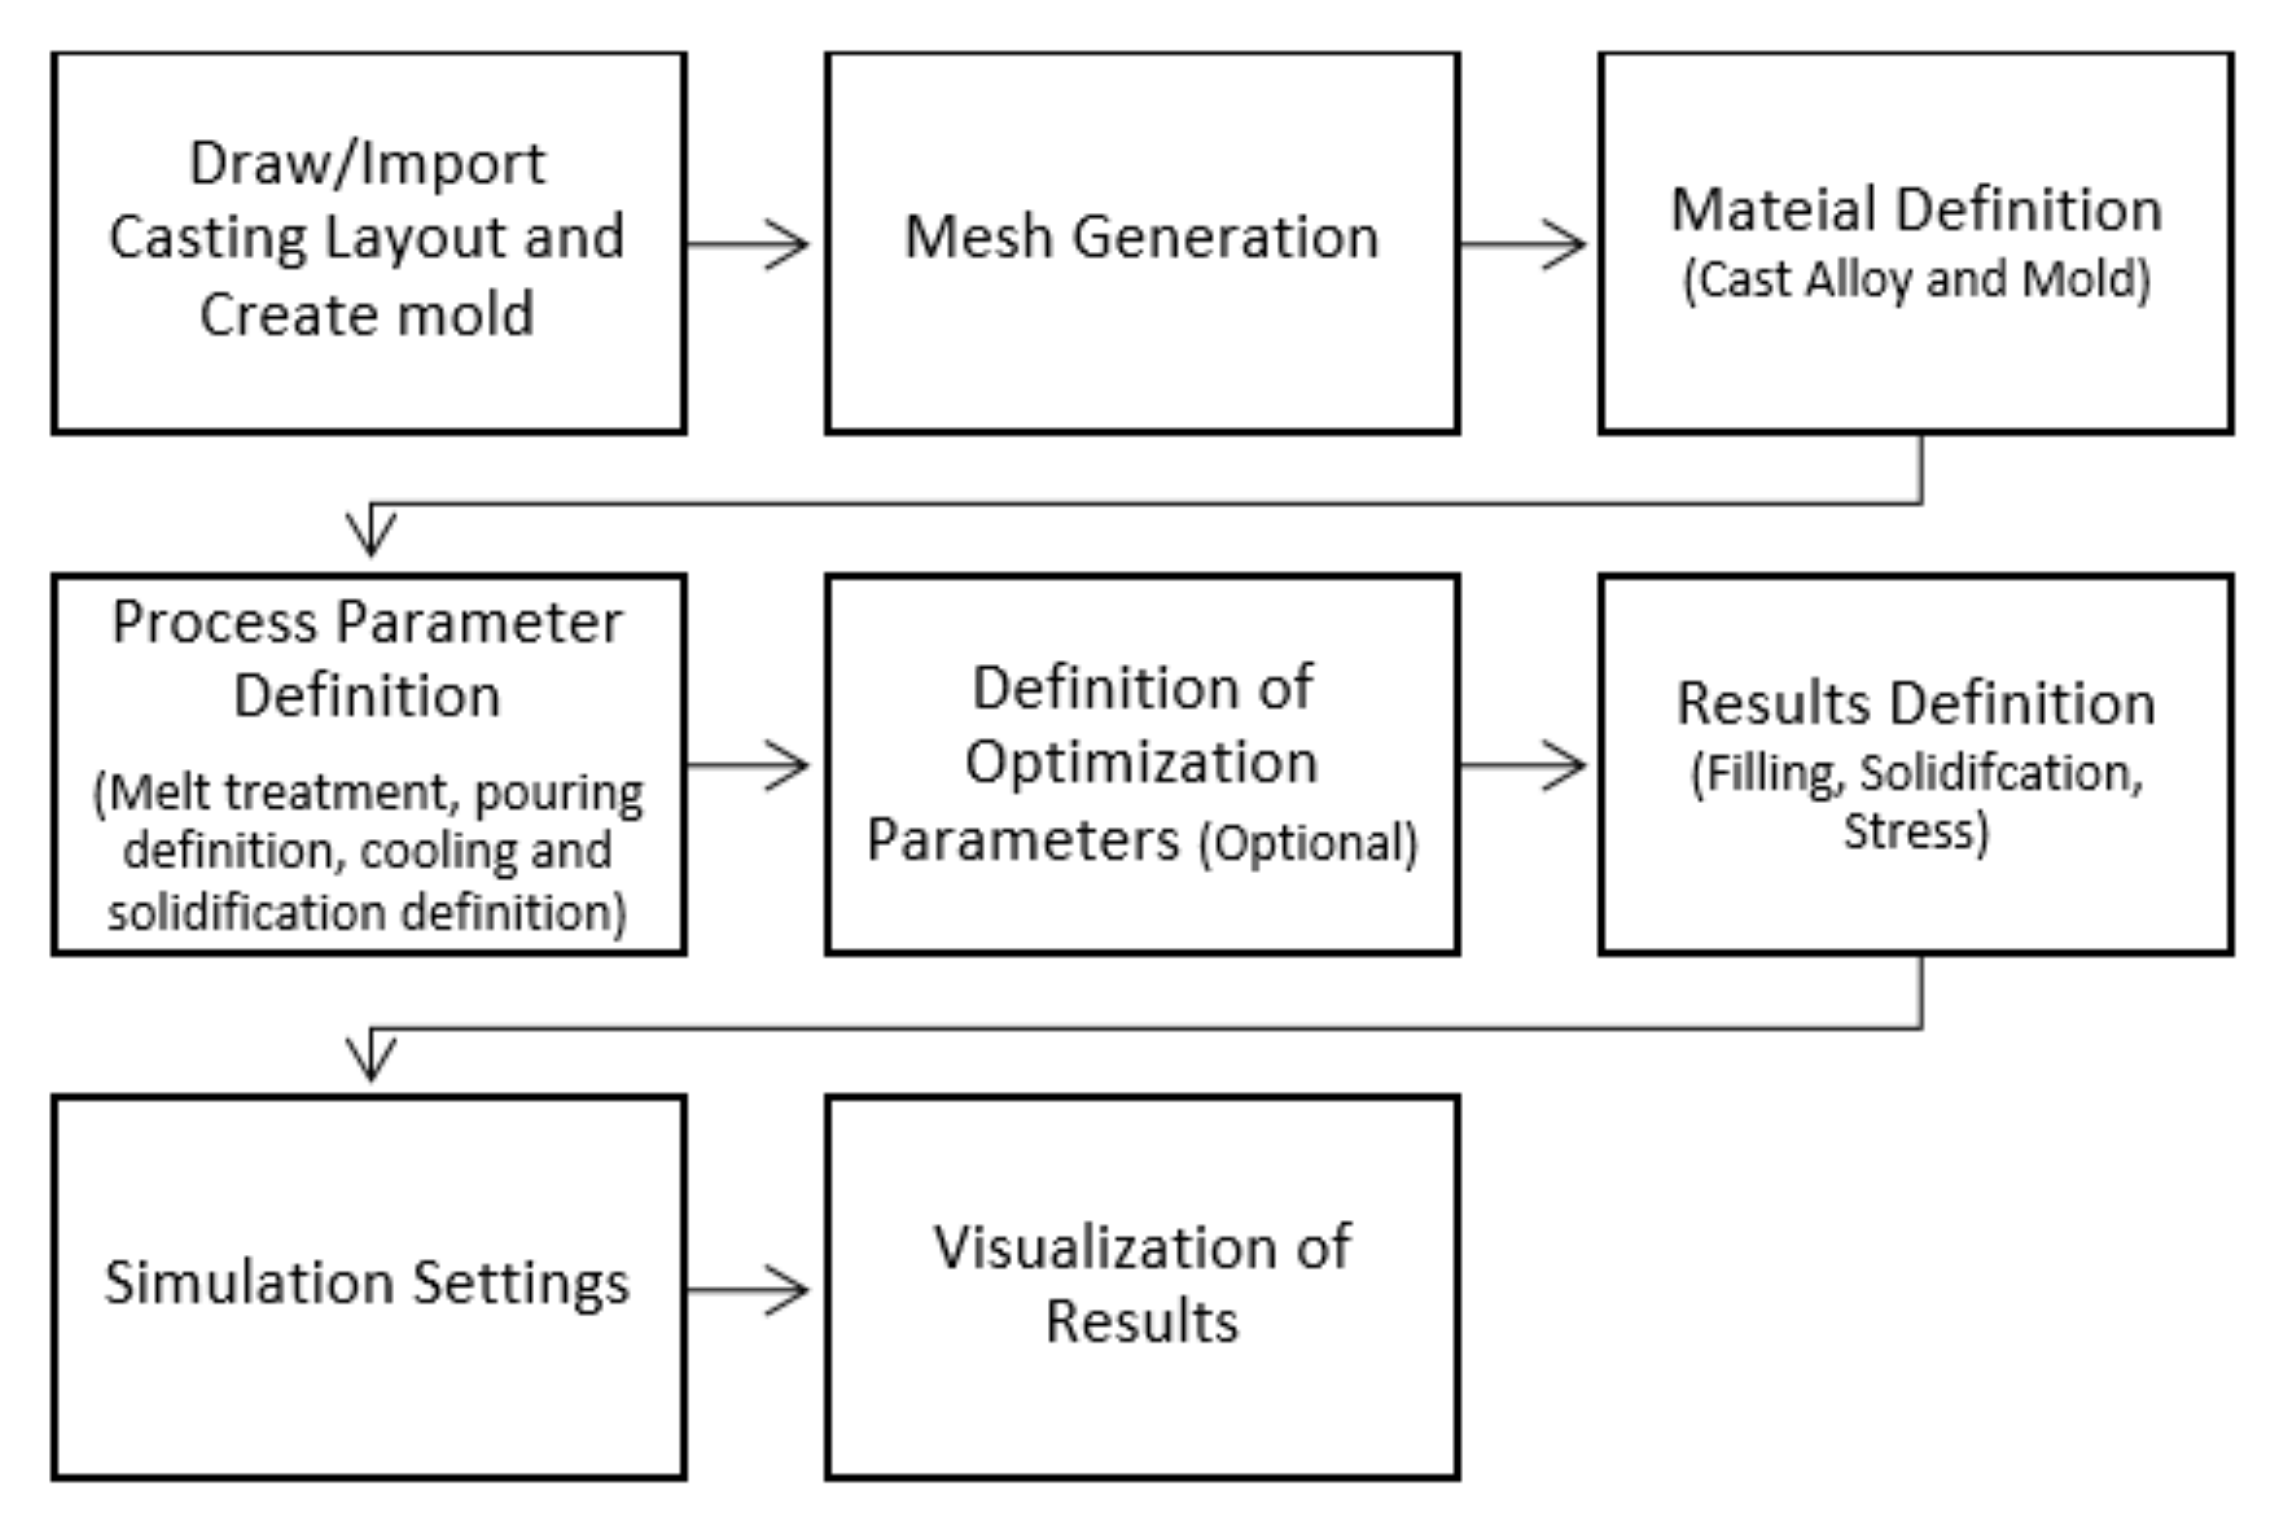
3. MAGMASoft Simulations for Casting Specimens
- (a)
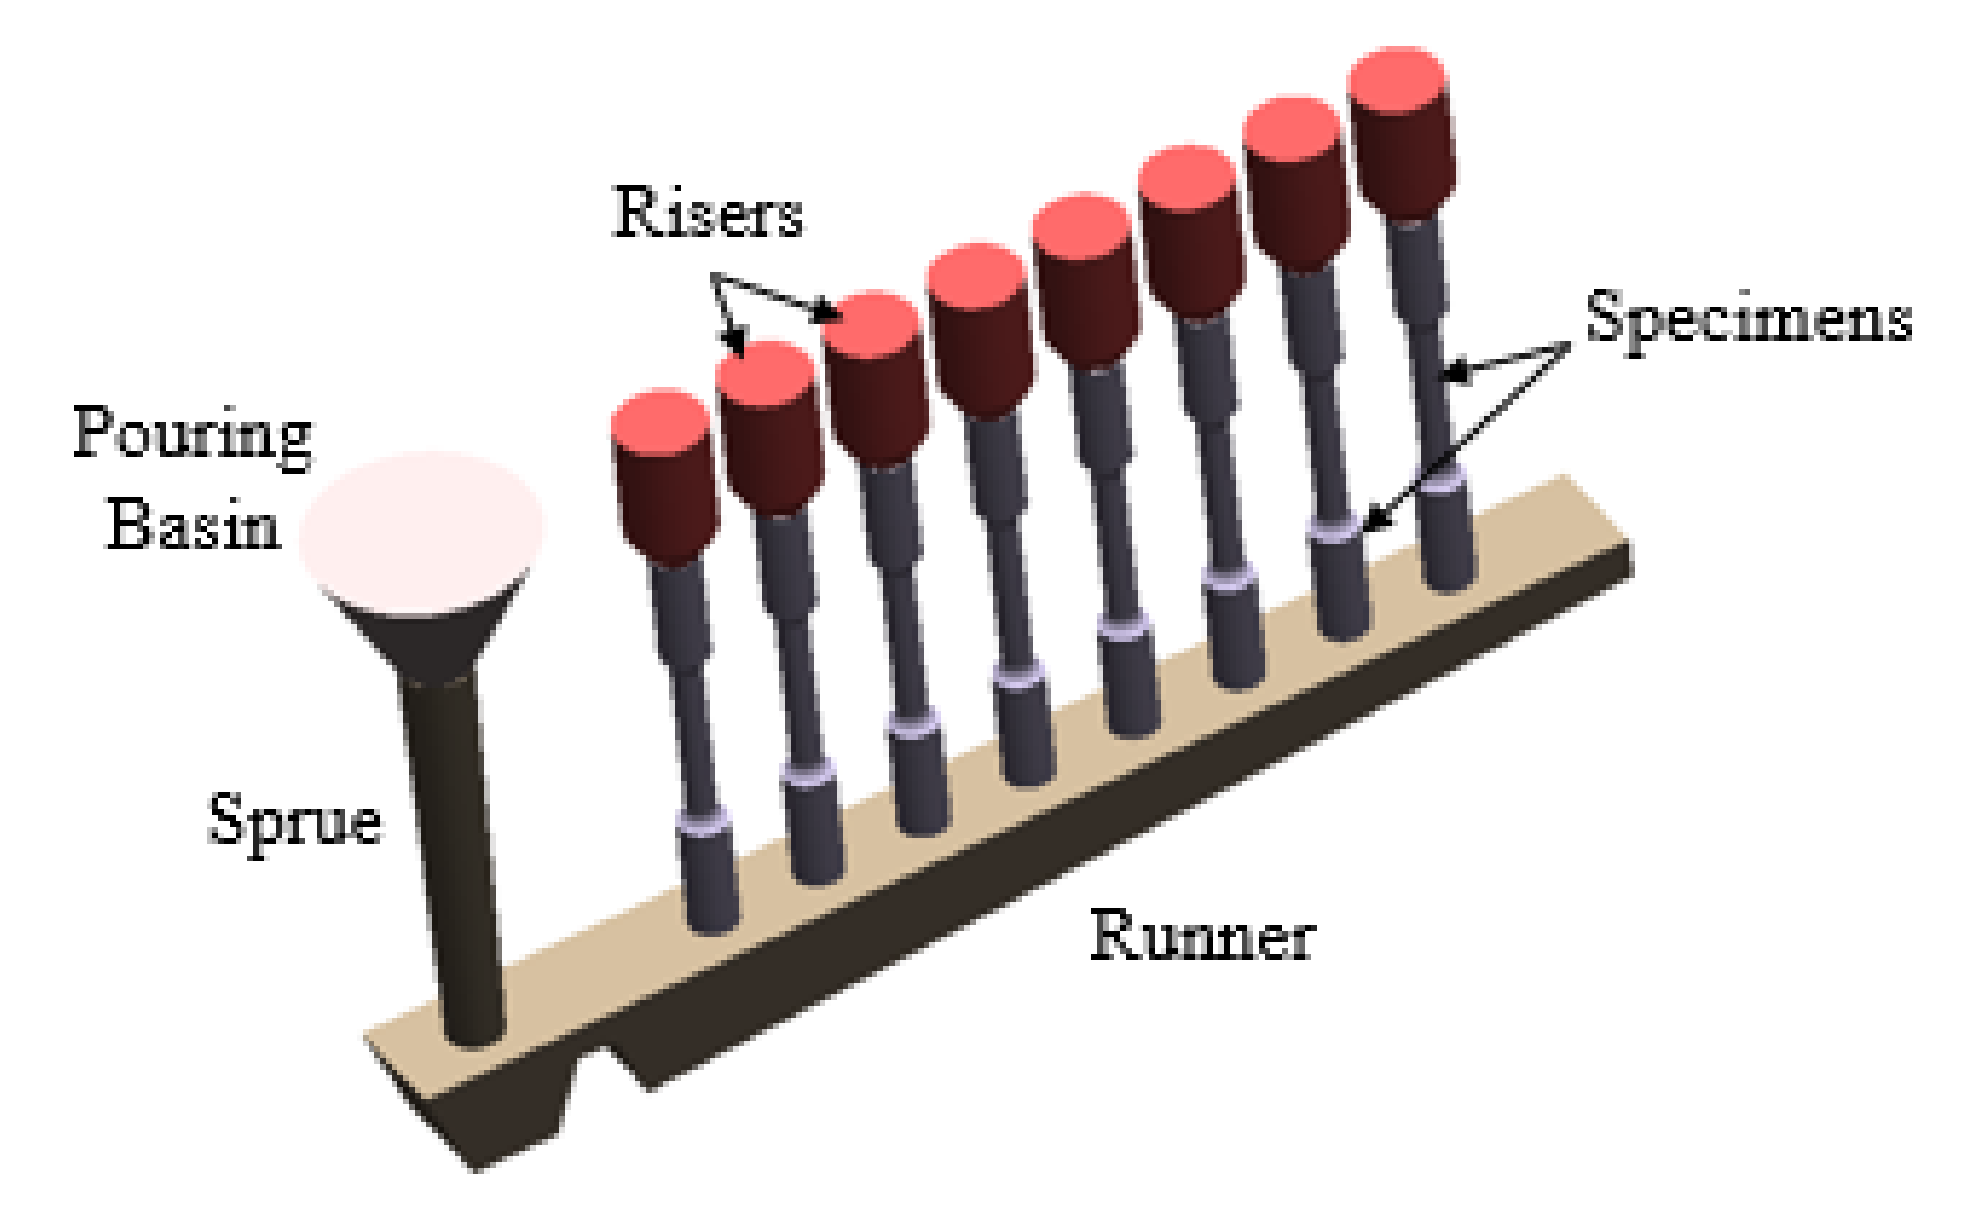
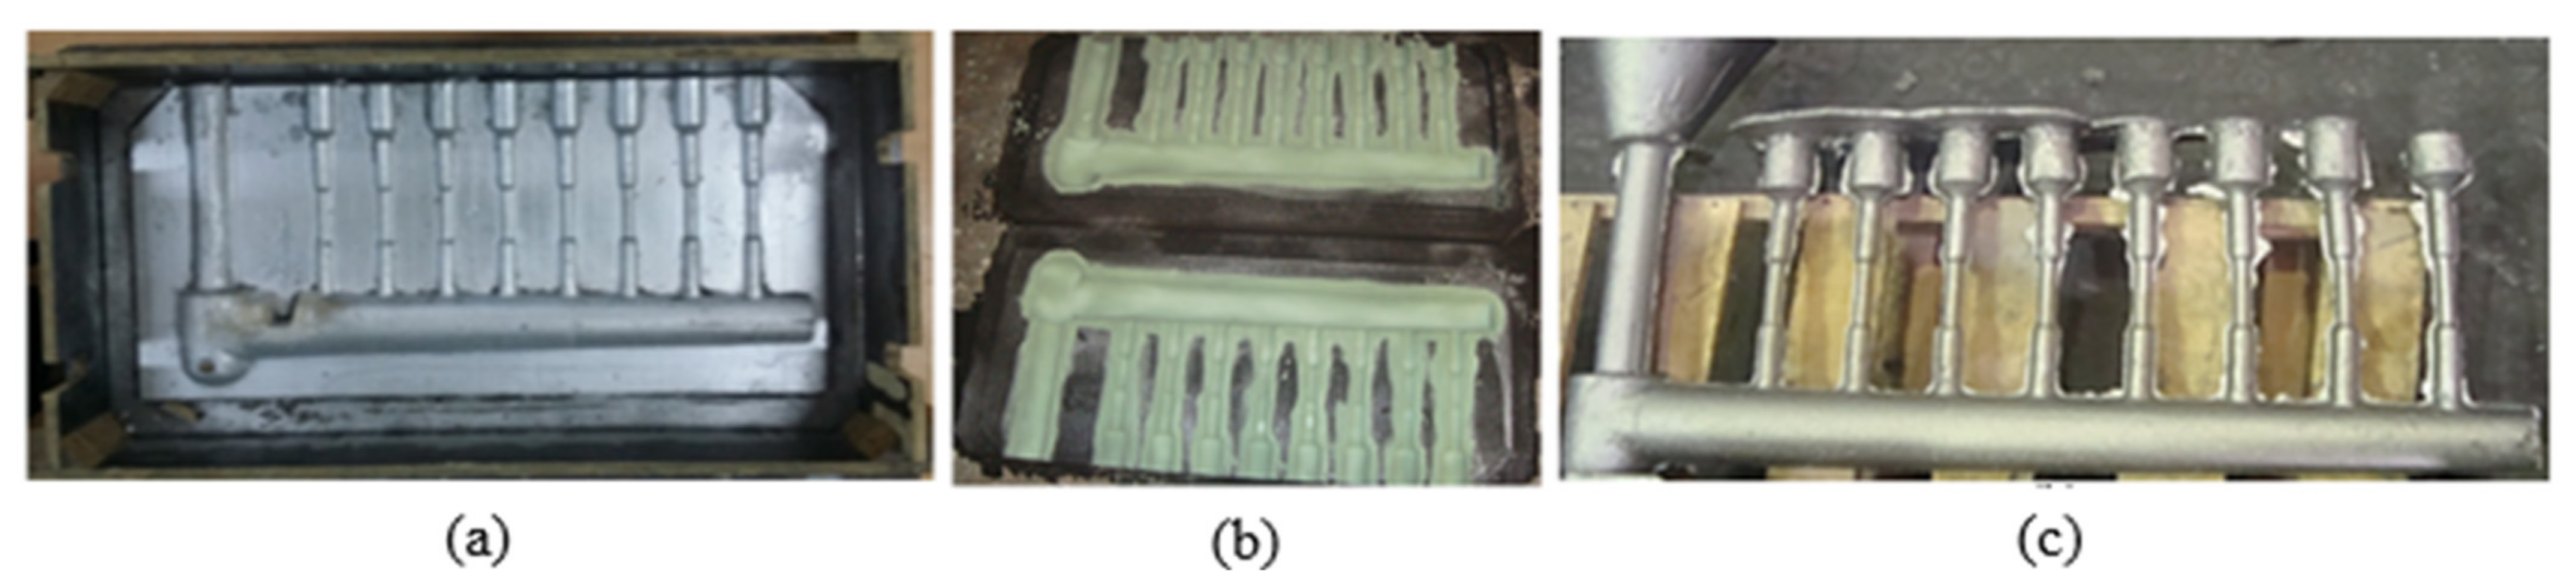
- Initial Mold Design: This mold design requires theoretical calculations, casting standards, design expertise of foundrymen and daily foundry practices.
- (b)
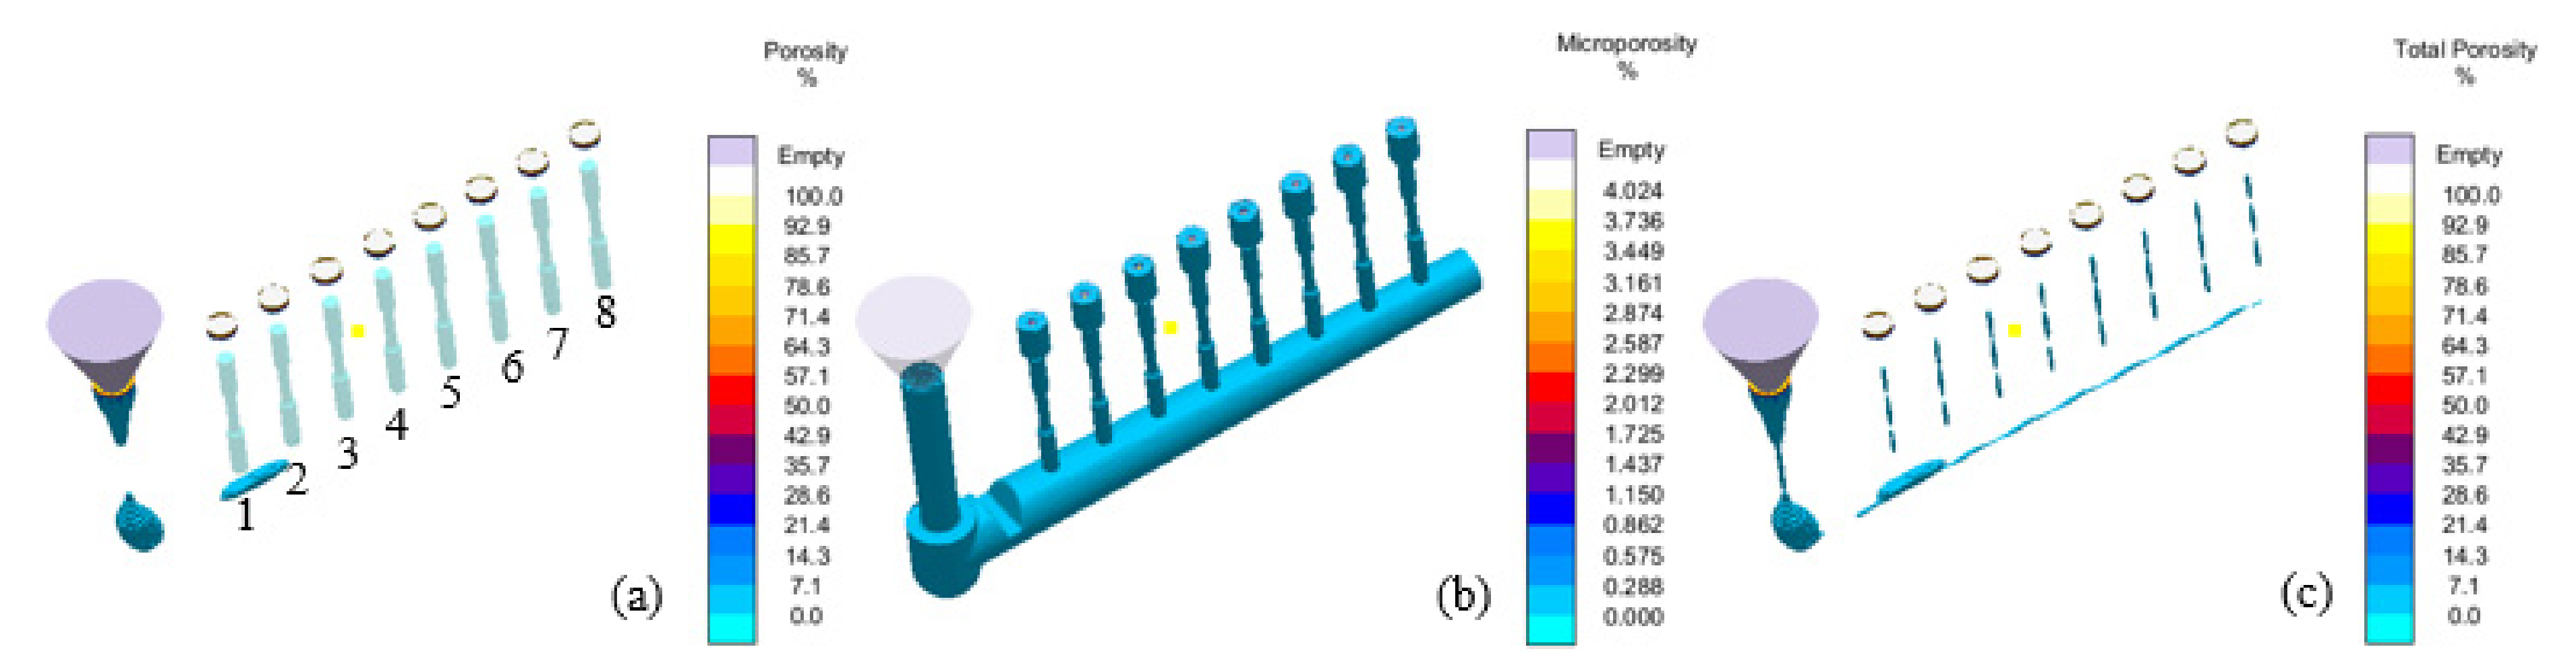
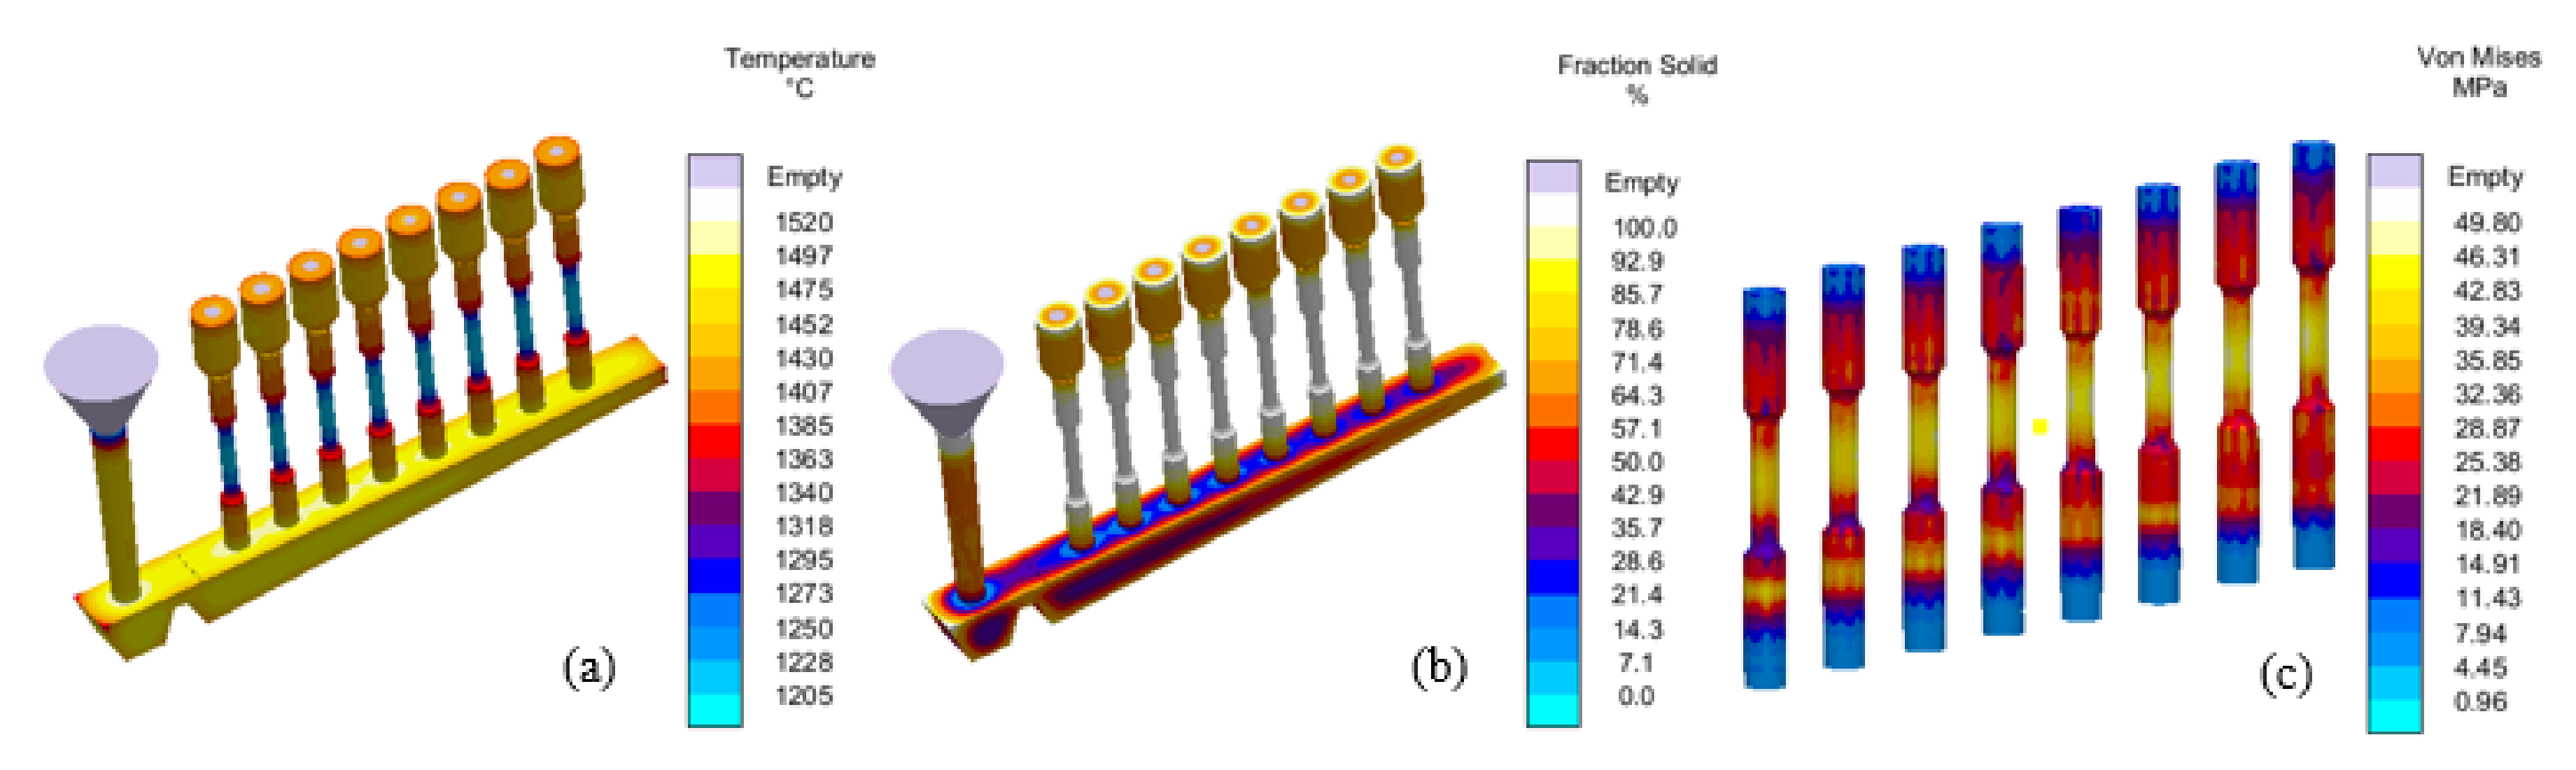
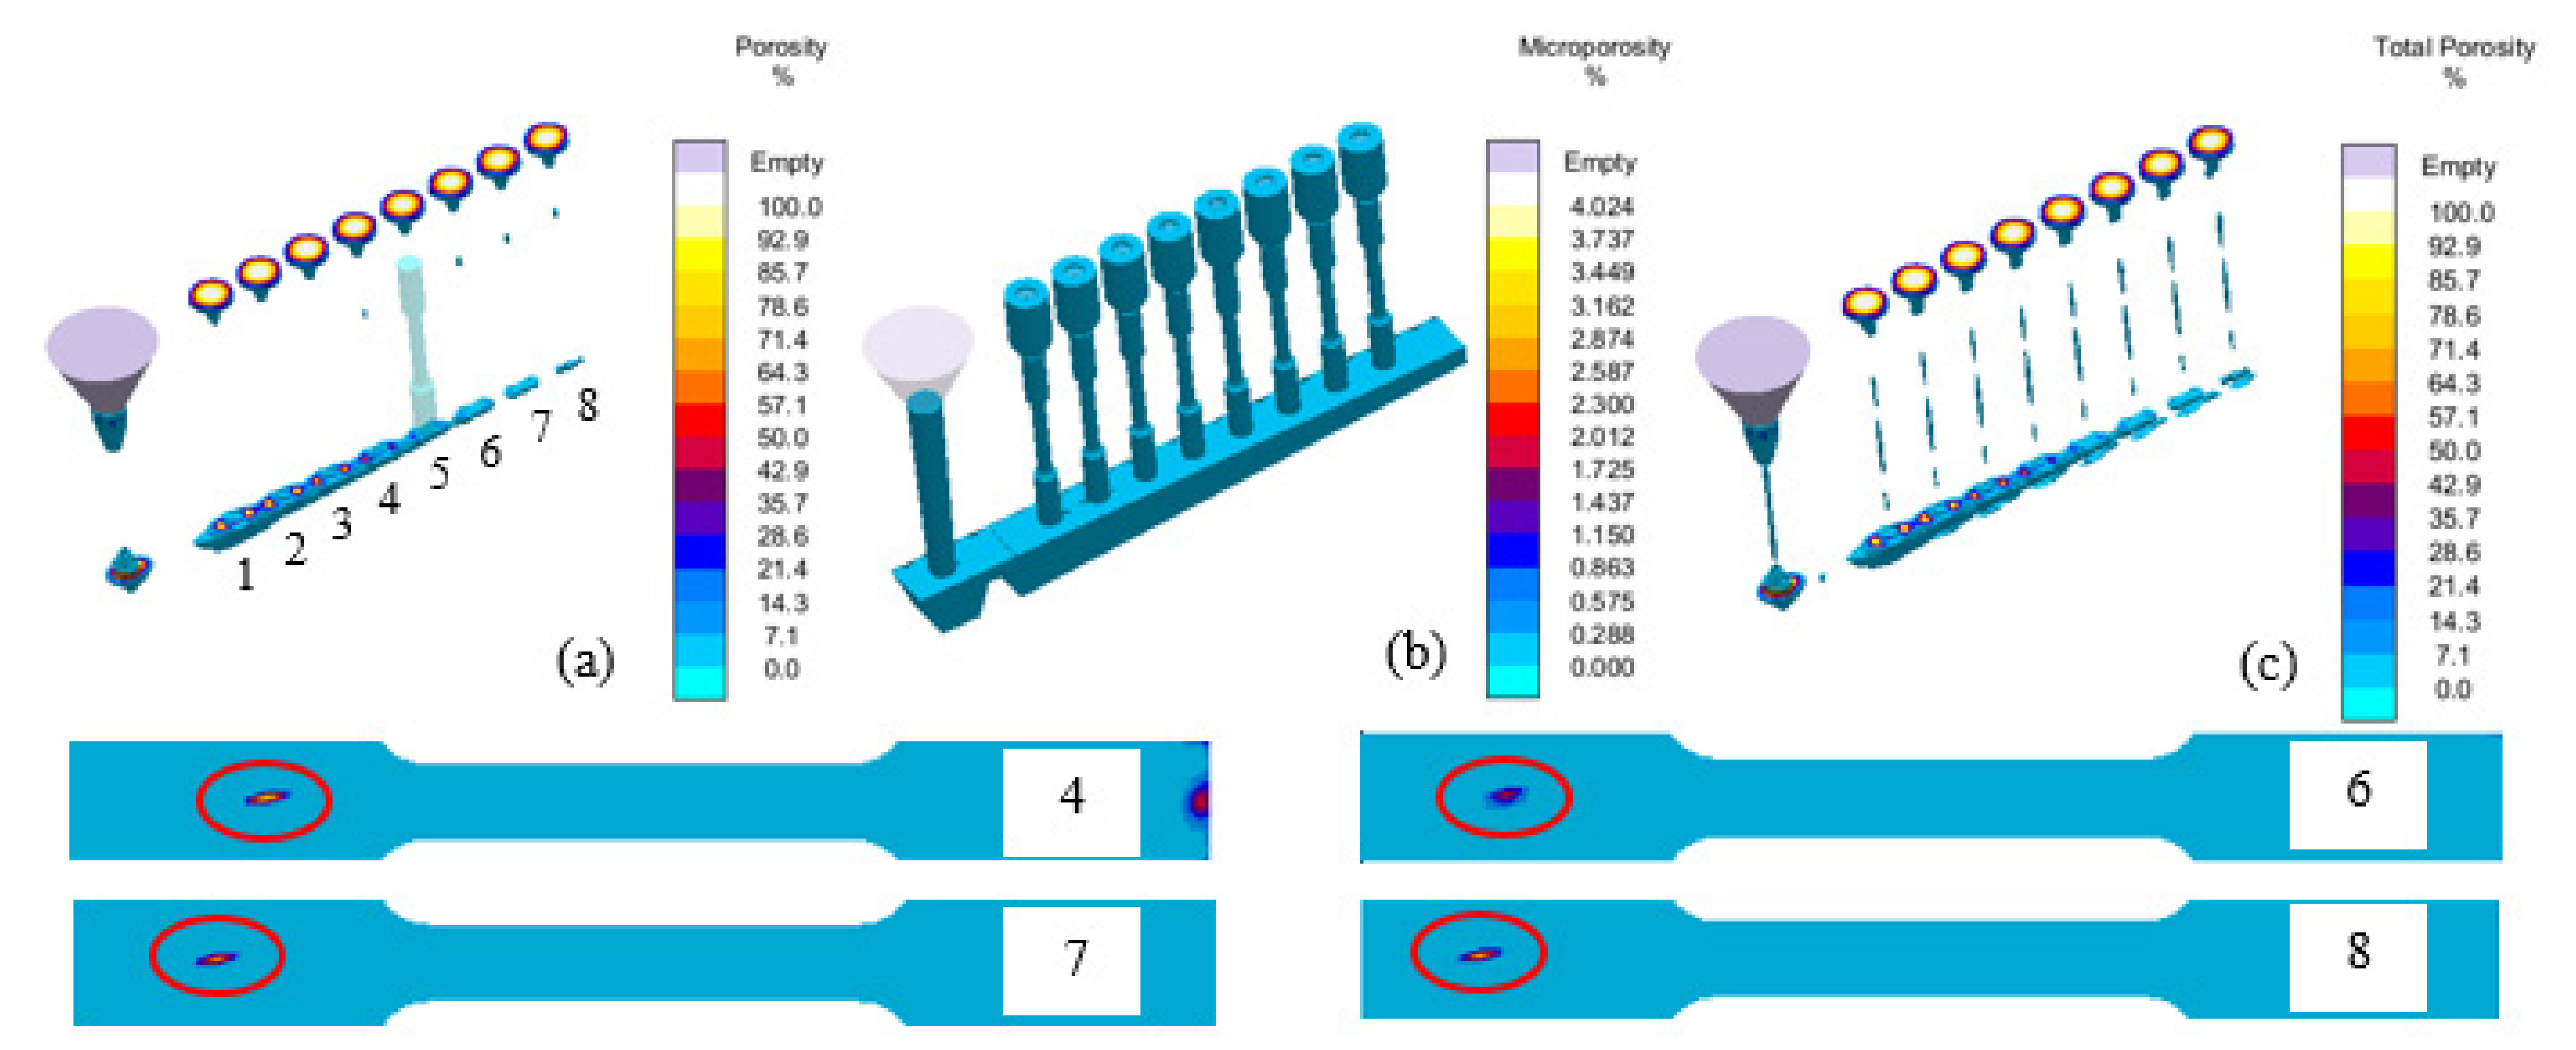
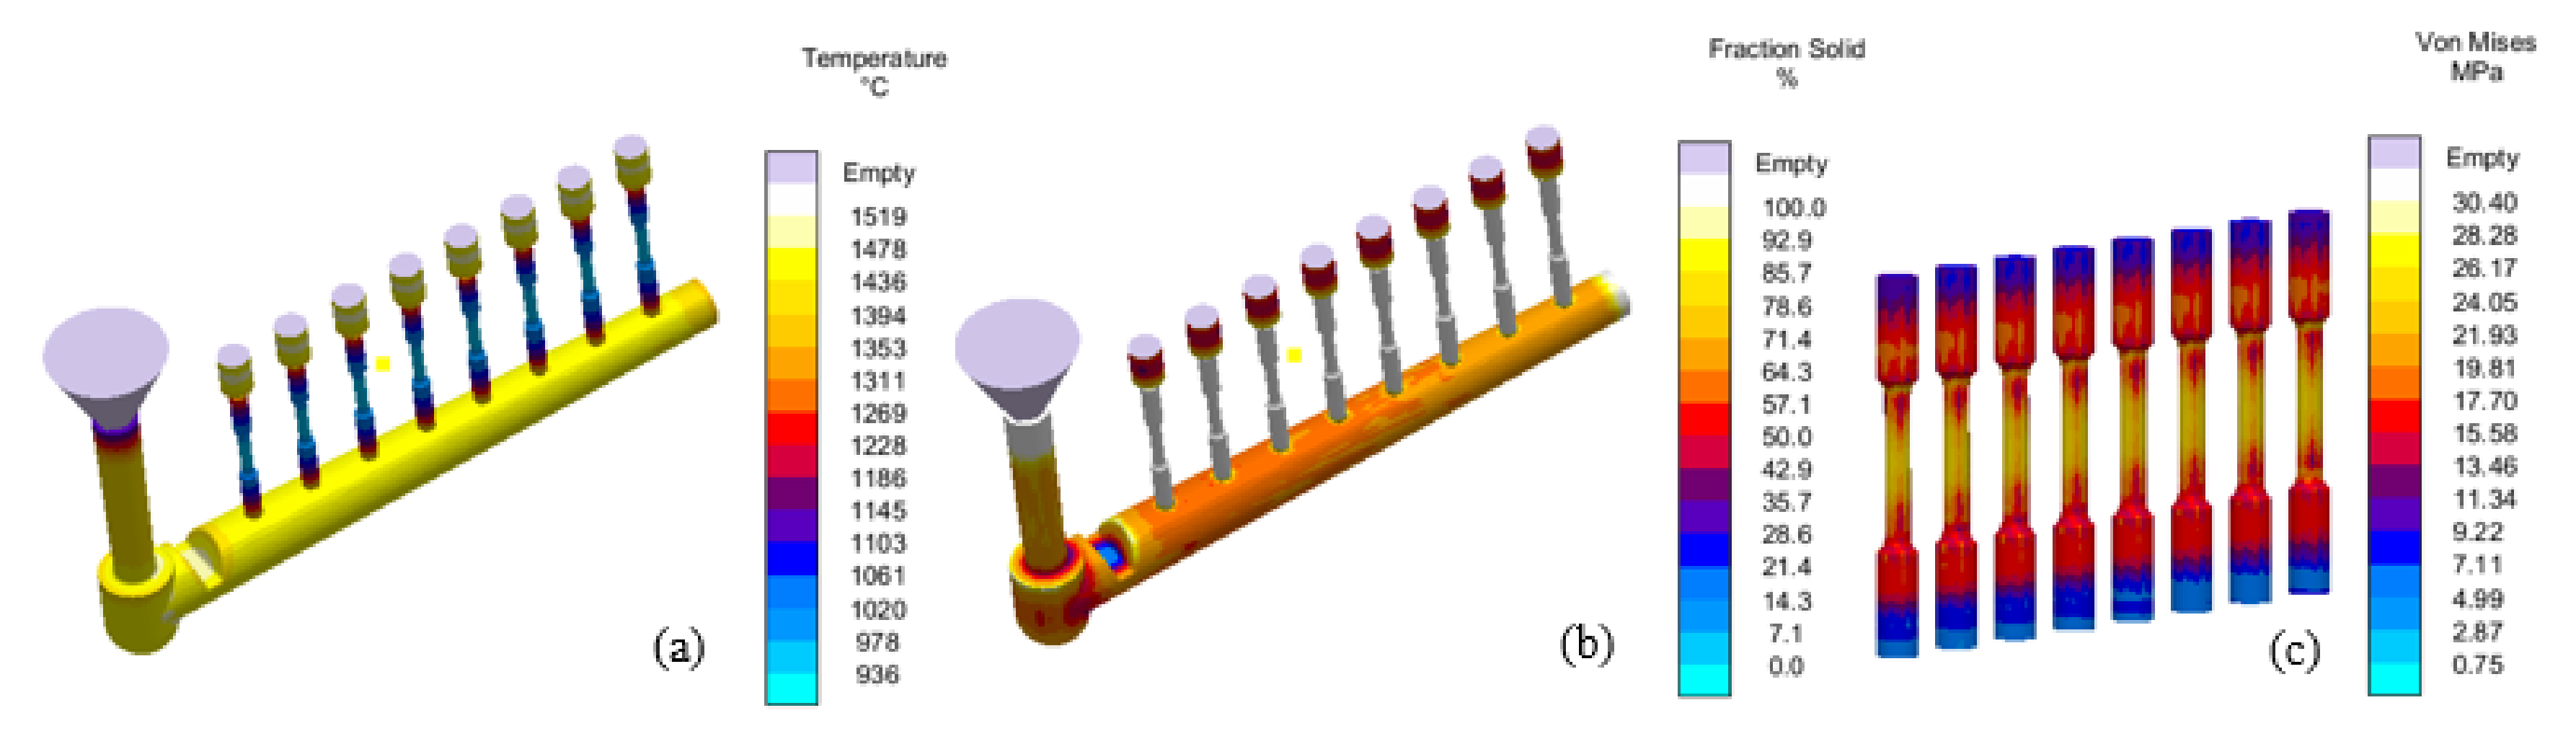
- Casting Simulation of Initial Mold Design: The resulting mold from (a) is simulated for filling and solidification behavior, stress distribution and porosity prediction in specimens using MAGMASoft.
- (c)
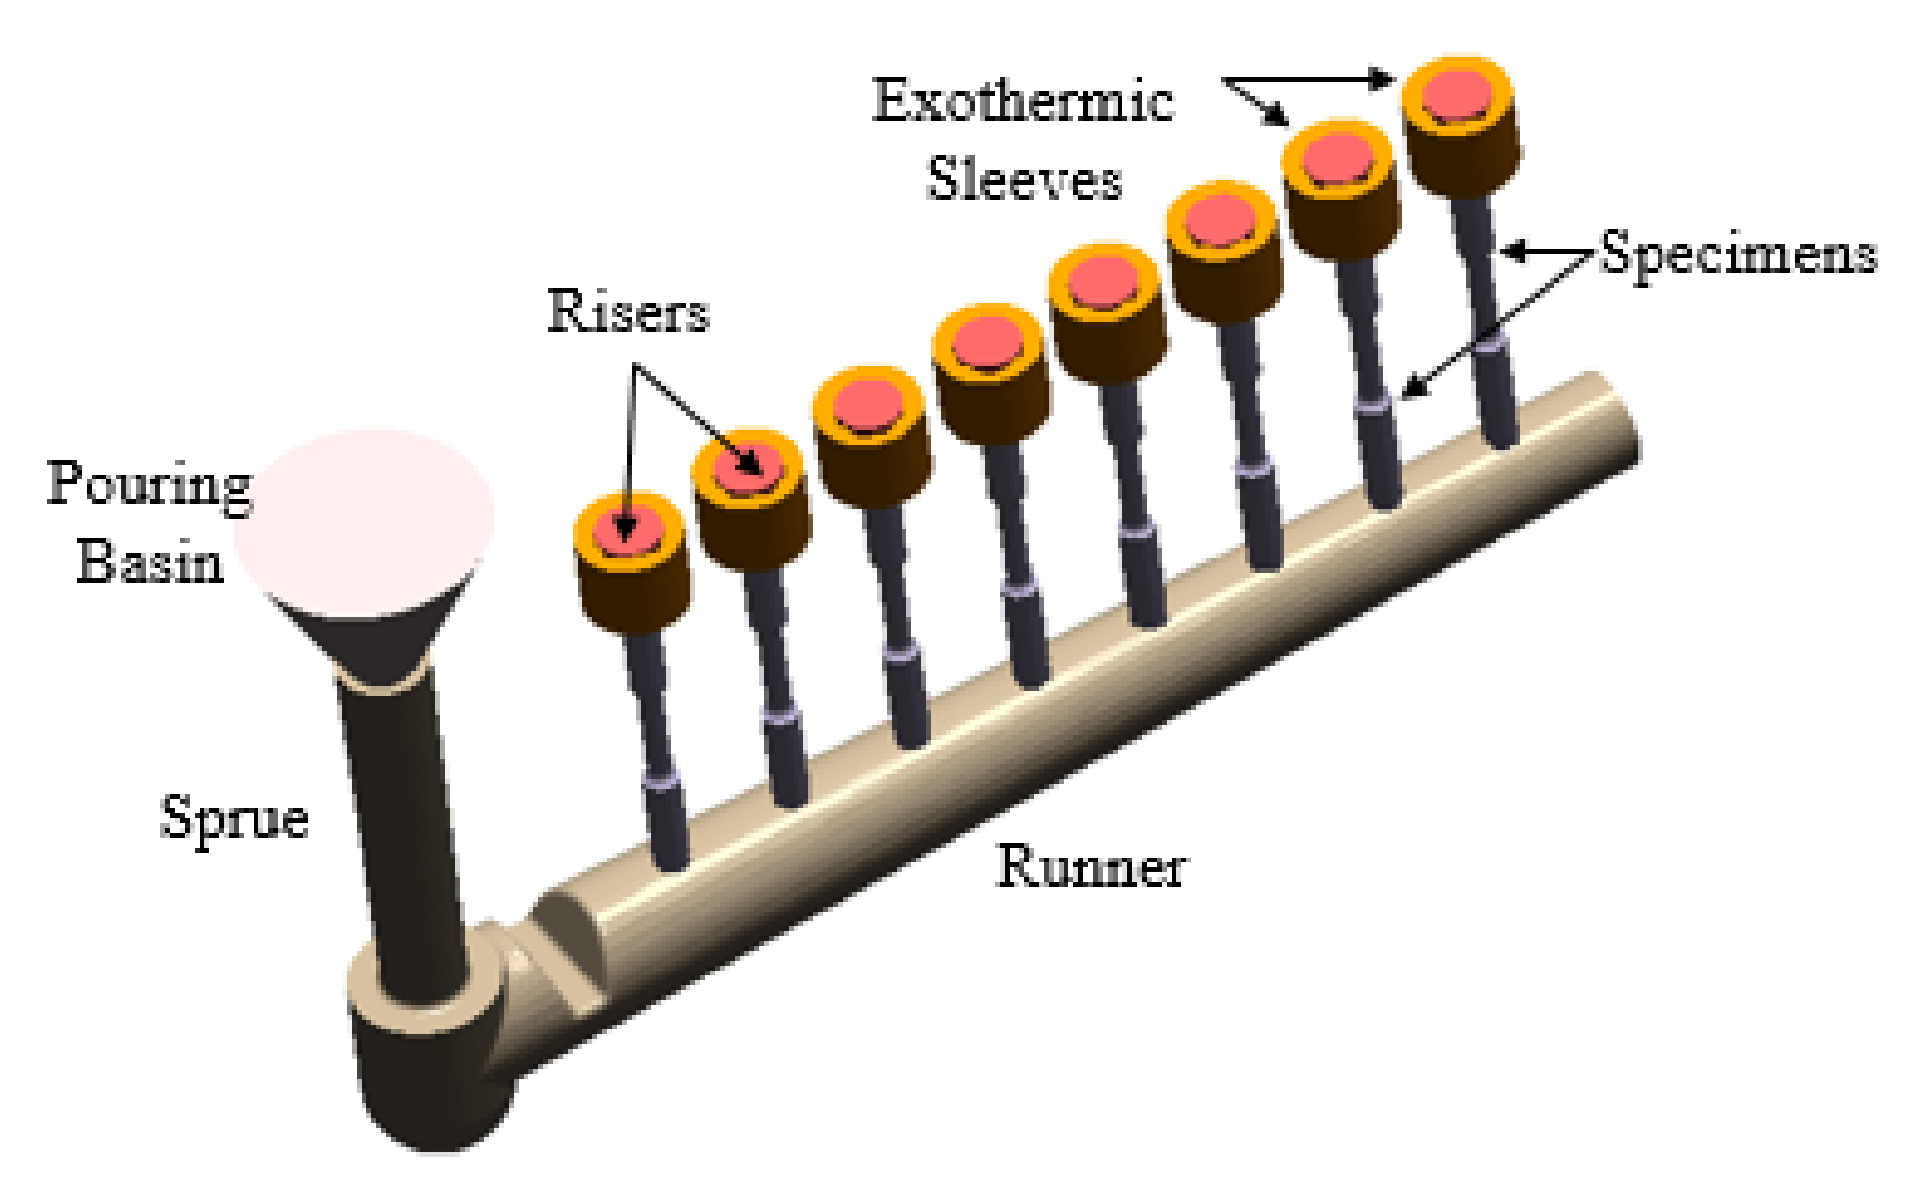
- Optimized Mold Design: Based on the results obtained in (b), the mold design is carefully optimized for casting layout and/or process parameters. It is important to set the objectives of this optimization, for example, yield maximization, defect minimization, residual stress minimization, etc. In this study, the main objective is set as porosity minimization.
3.1. Initial Mold Design
3.2. Optimized Mold Design
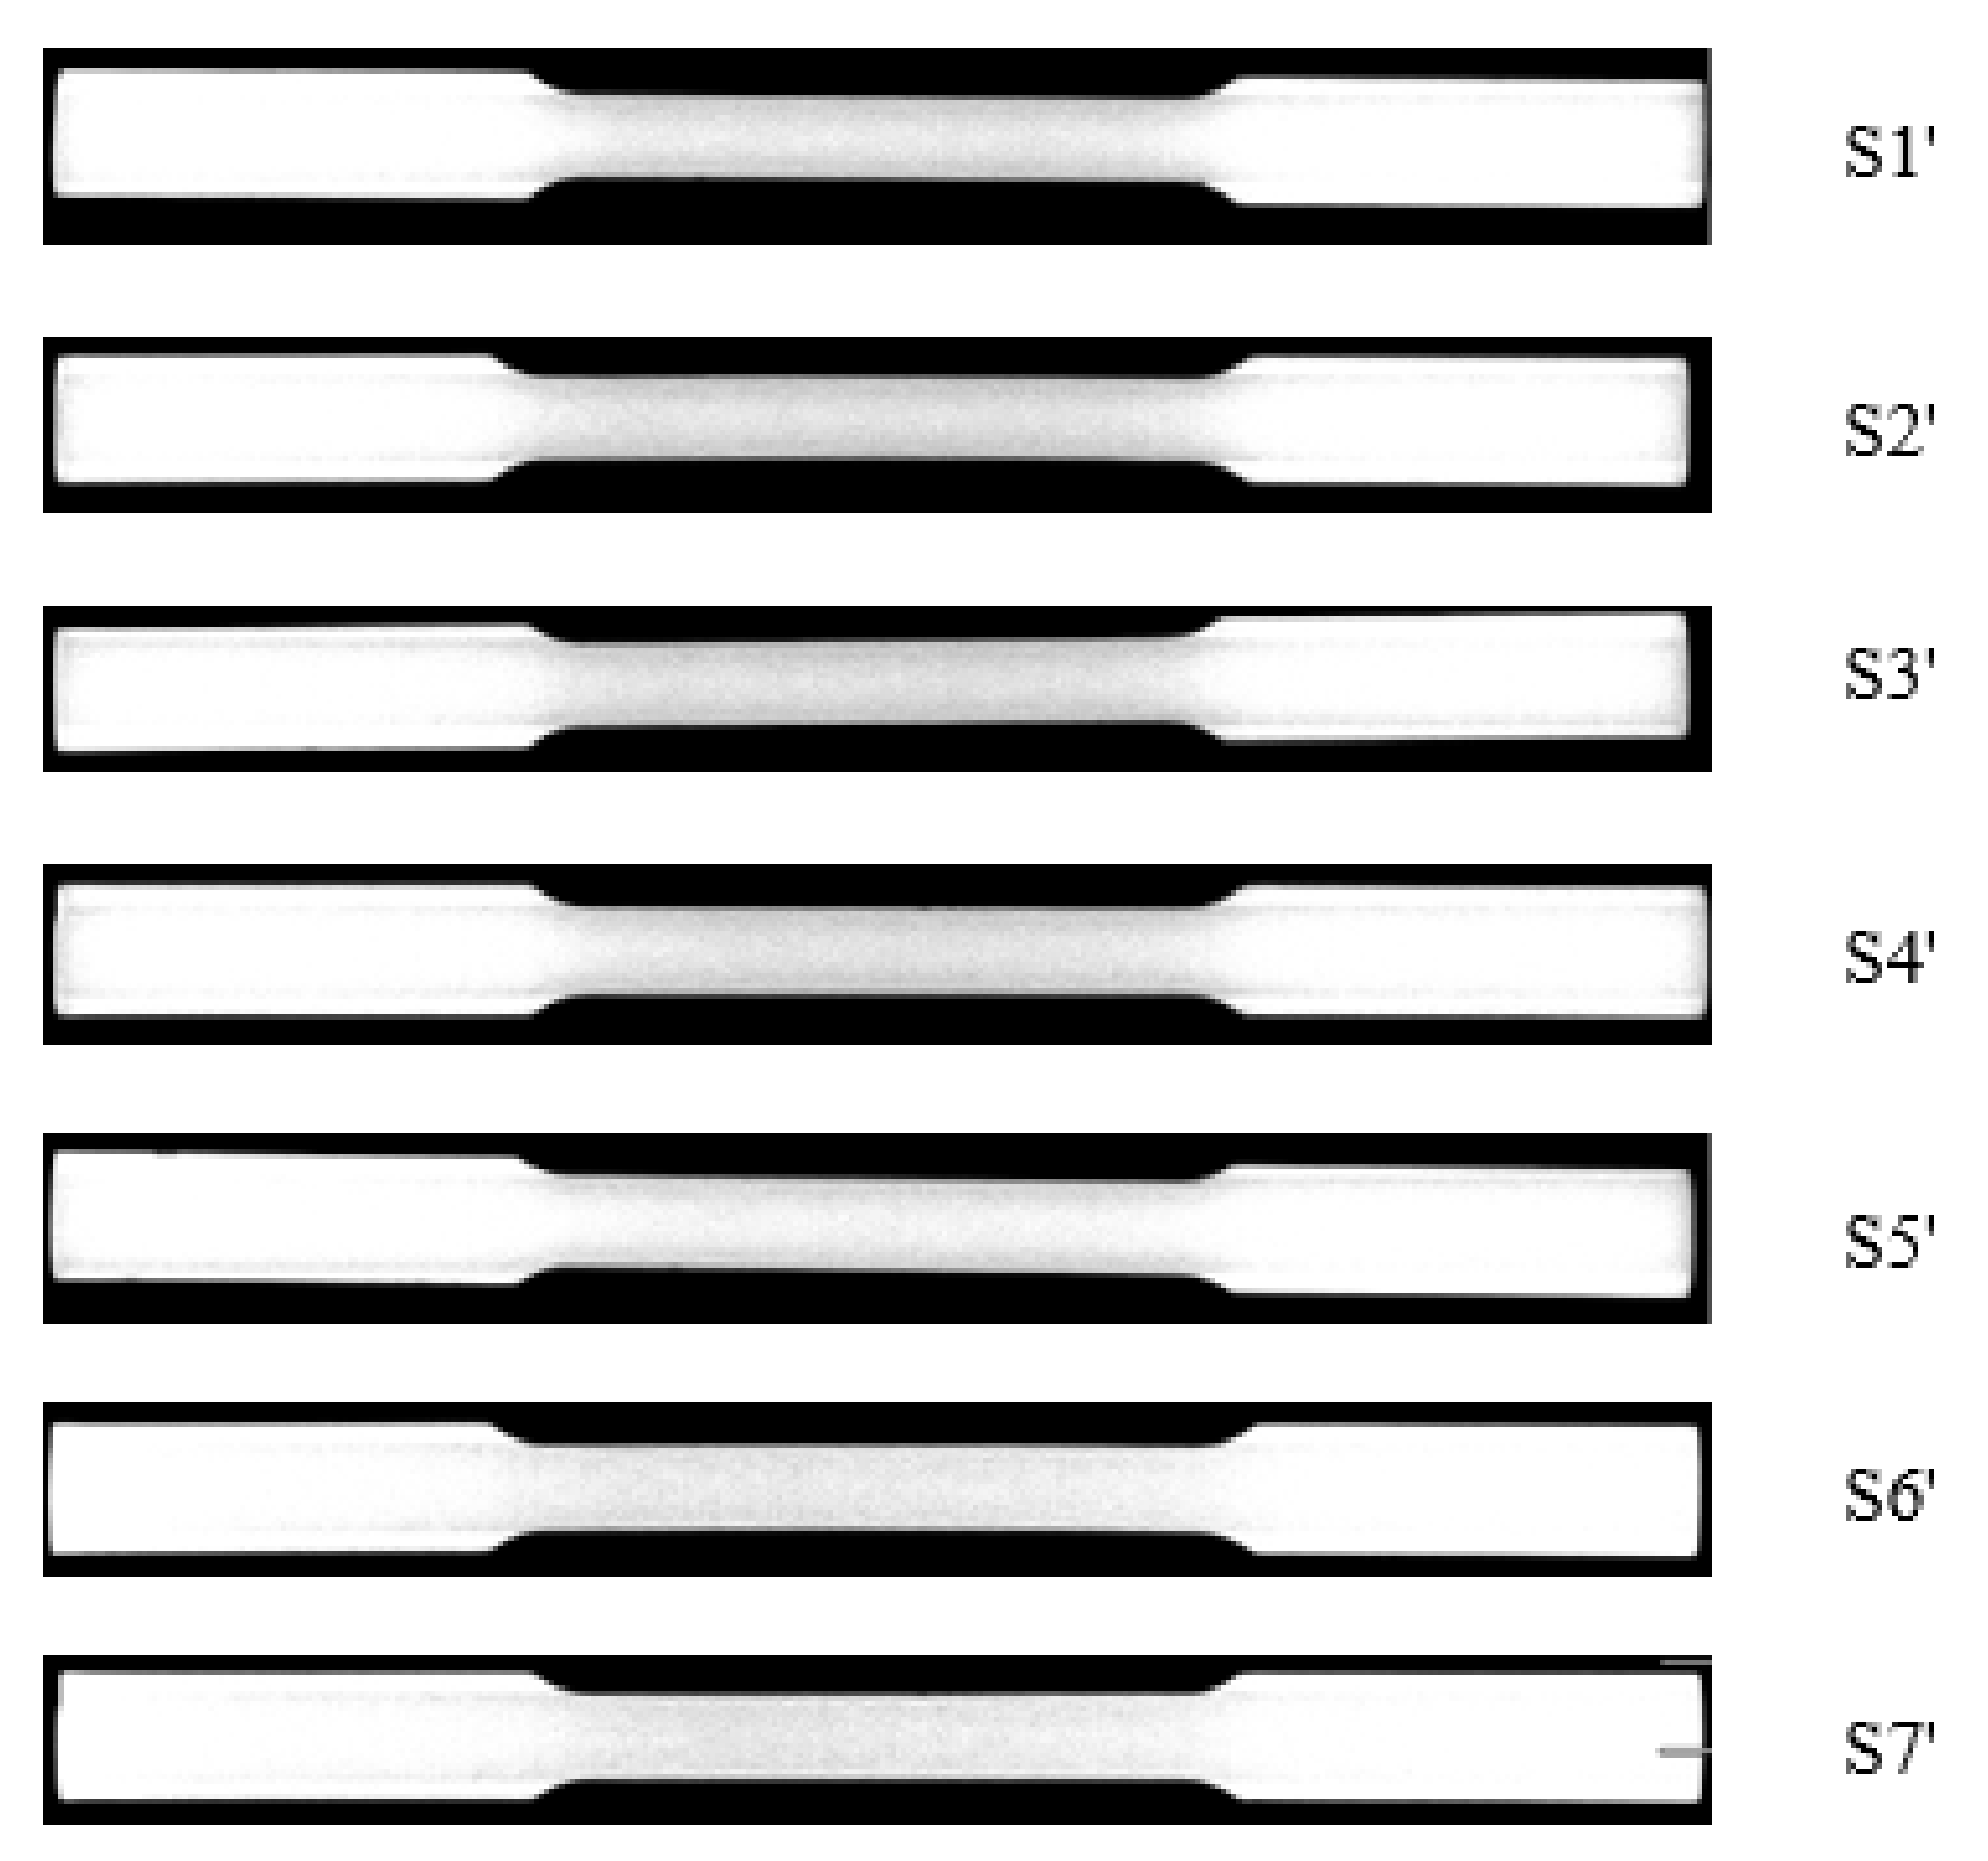
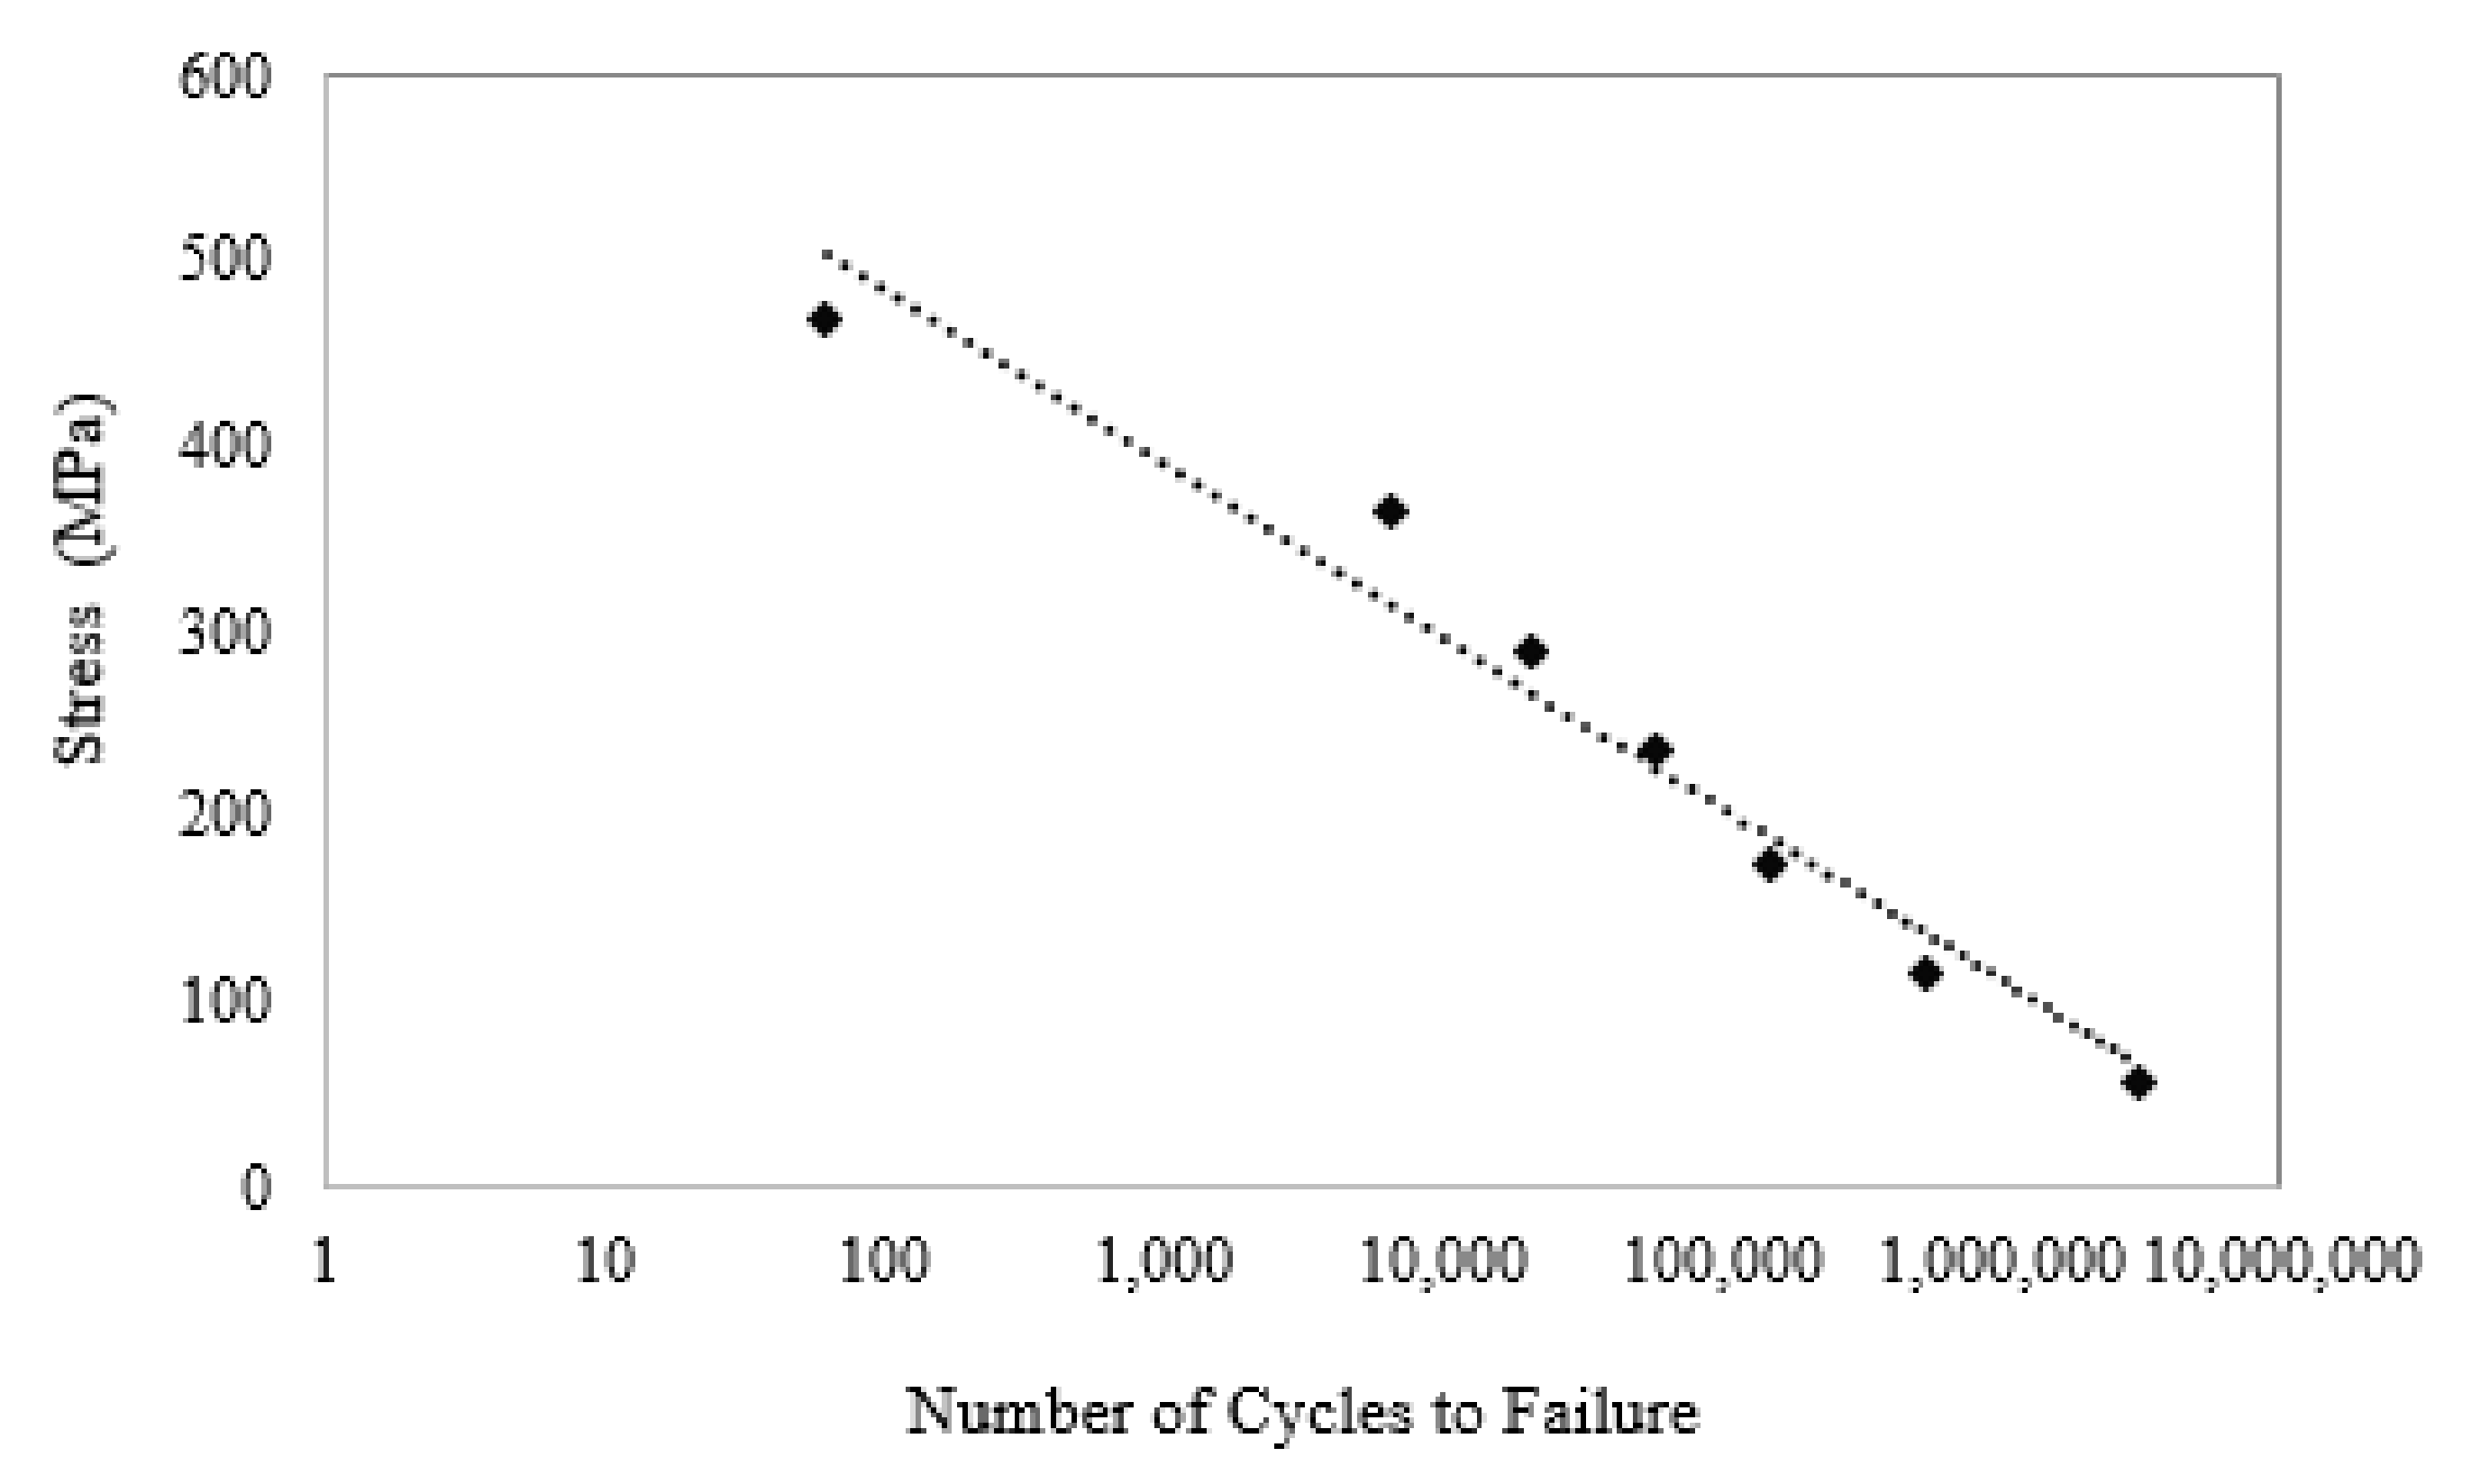
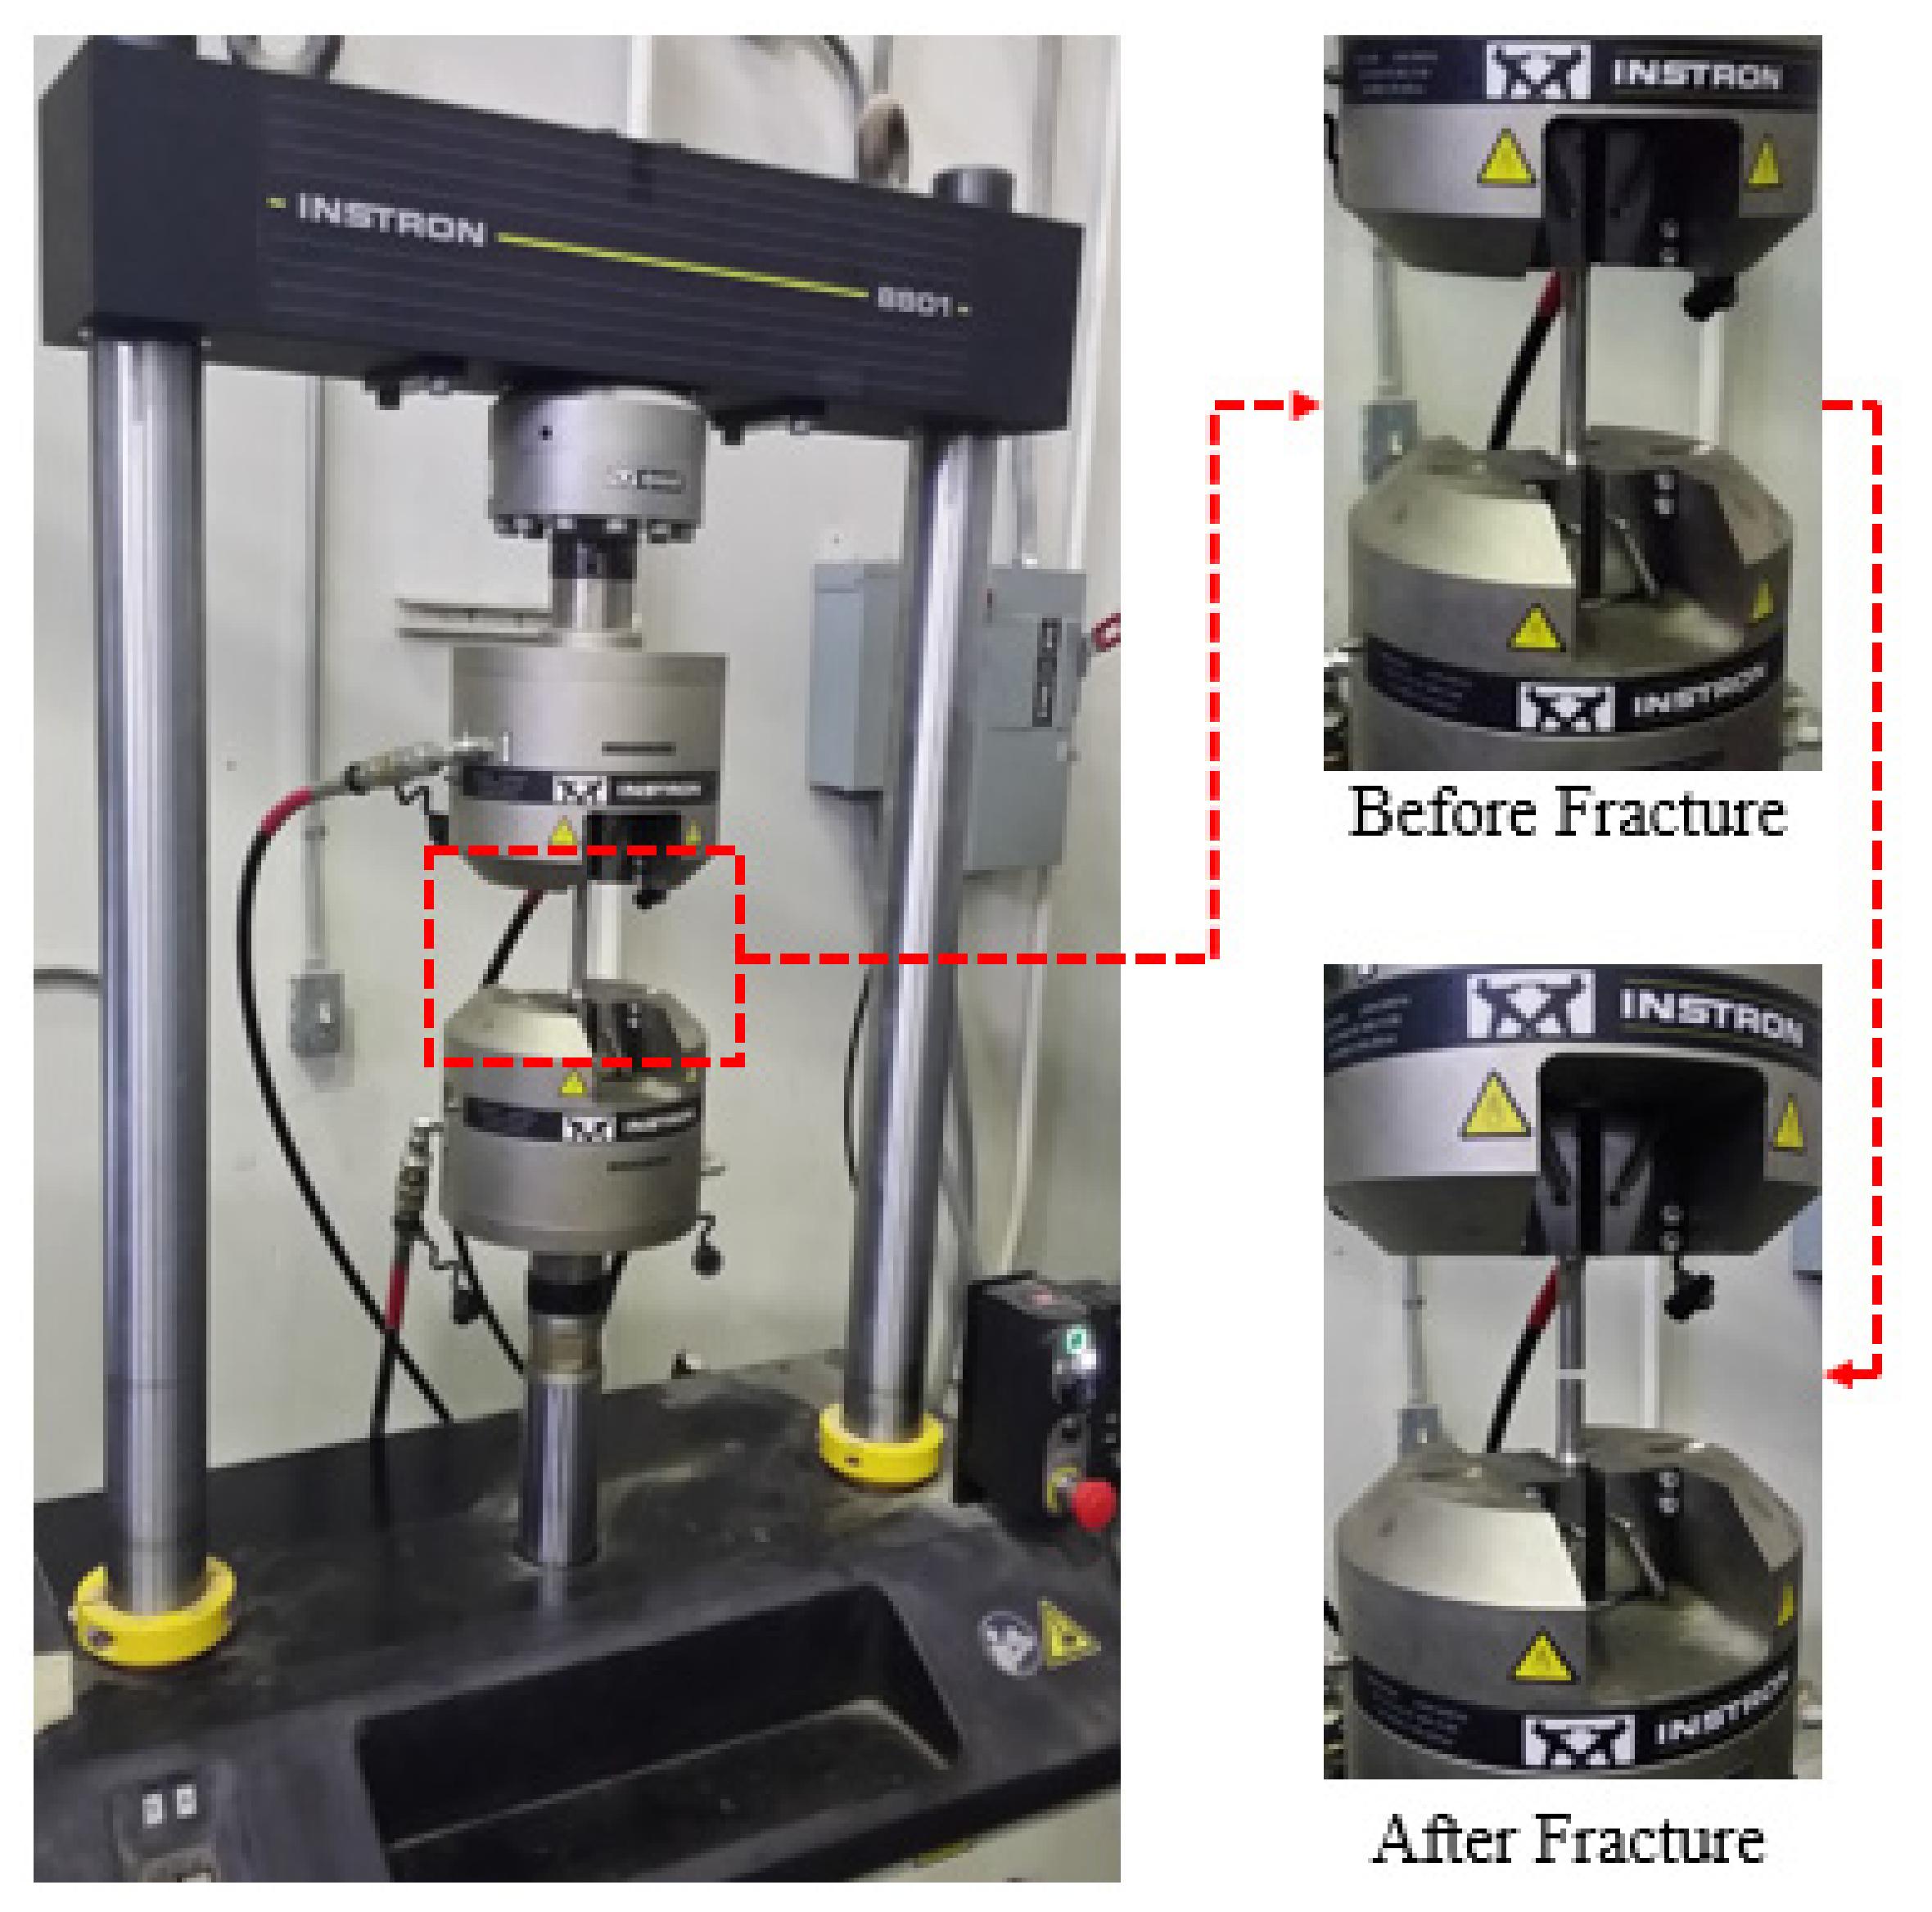
4. Casting and Mechanical Testing
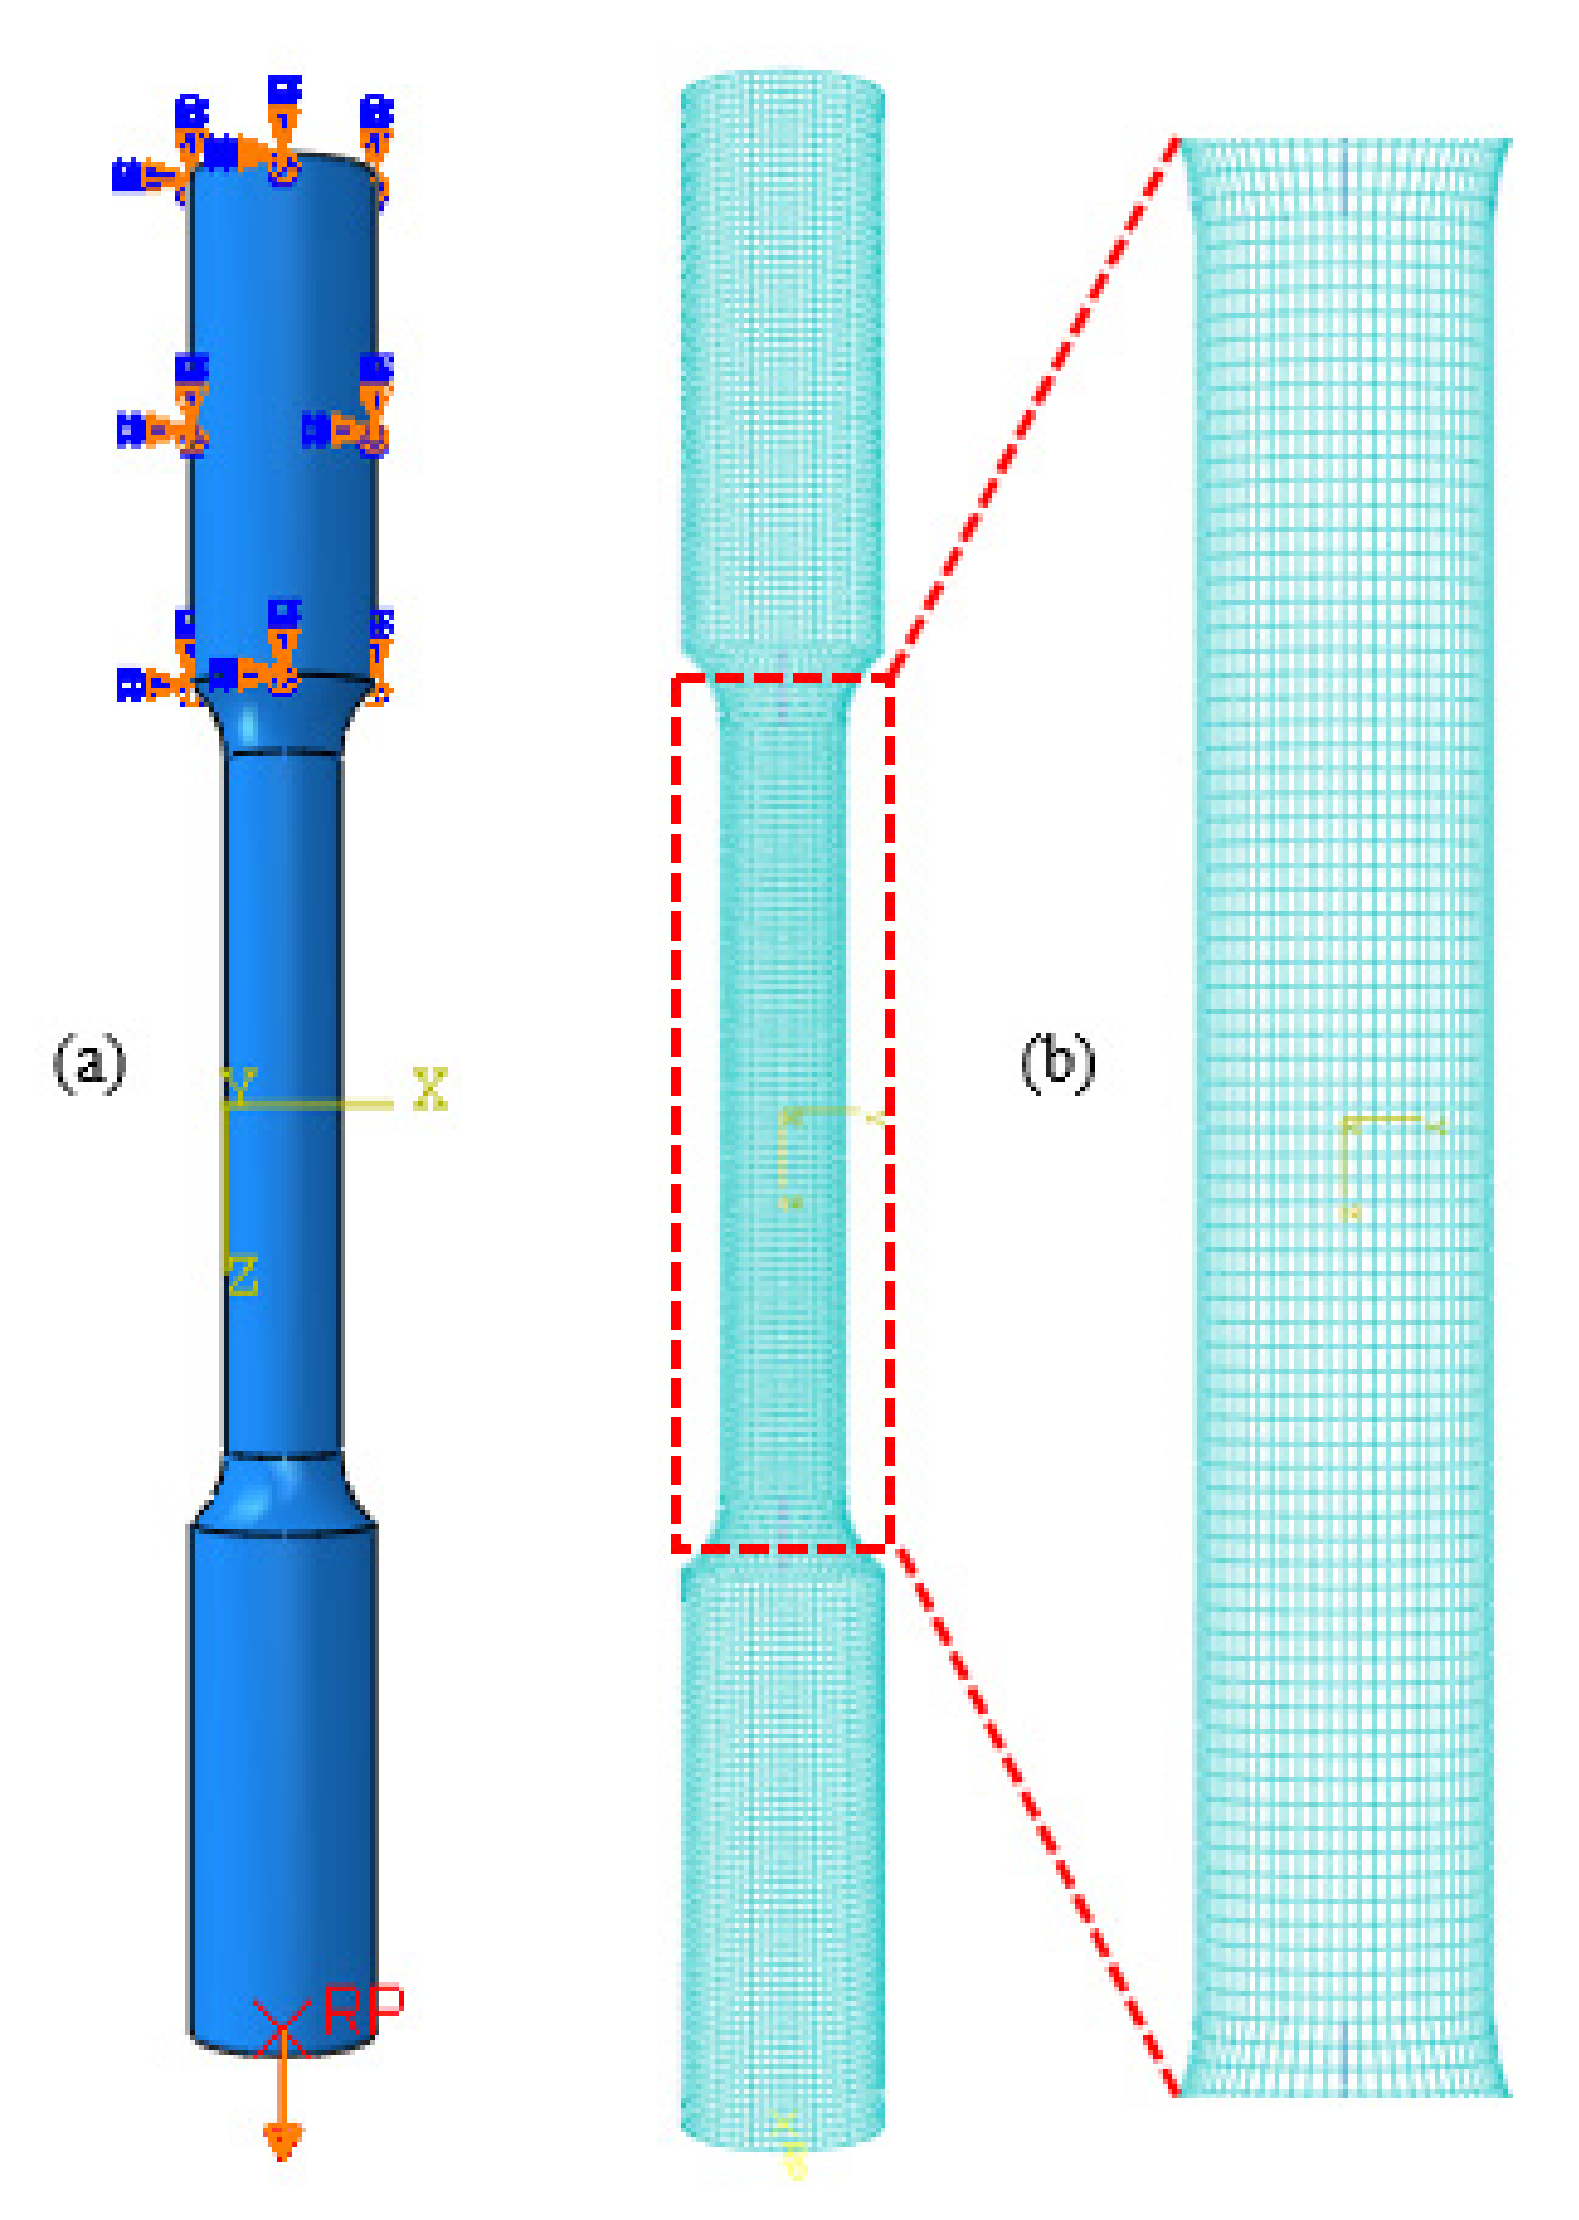
5. Fatigue Simulations and Life Prediction
5.1. Simulation Procedure
5.2. Brown–Miller Analysis
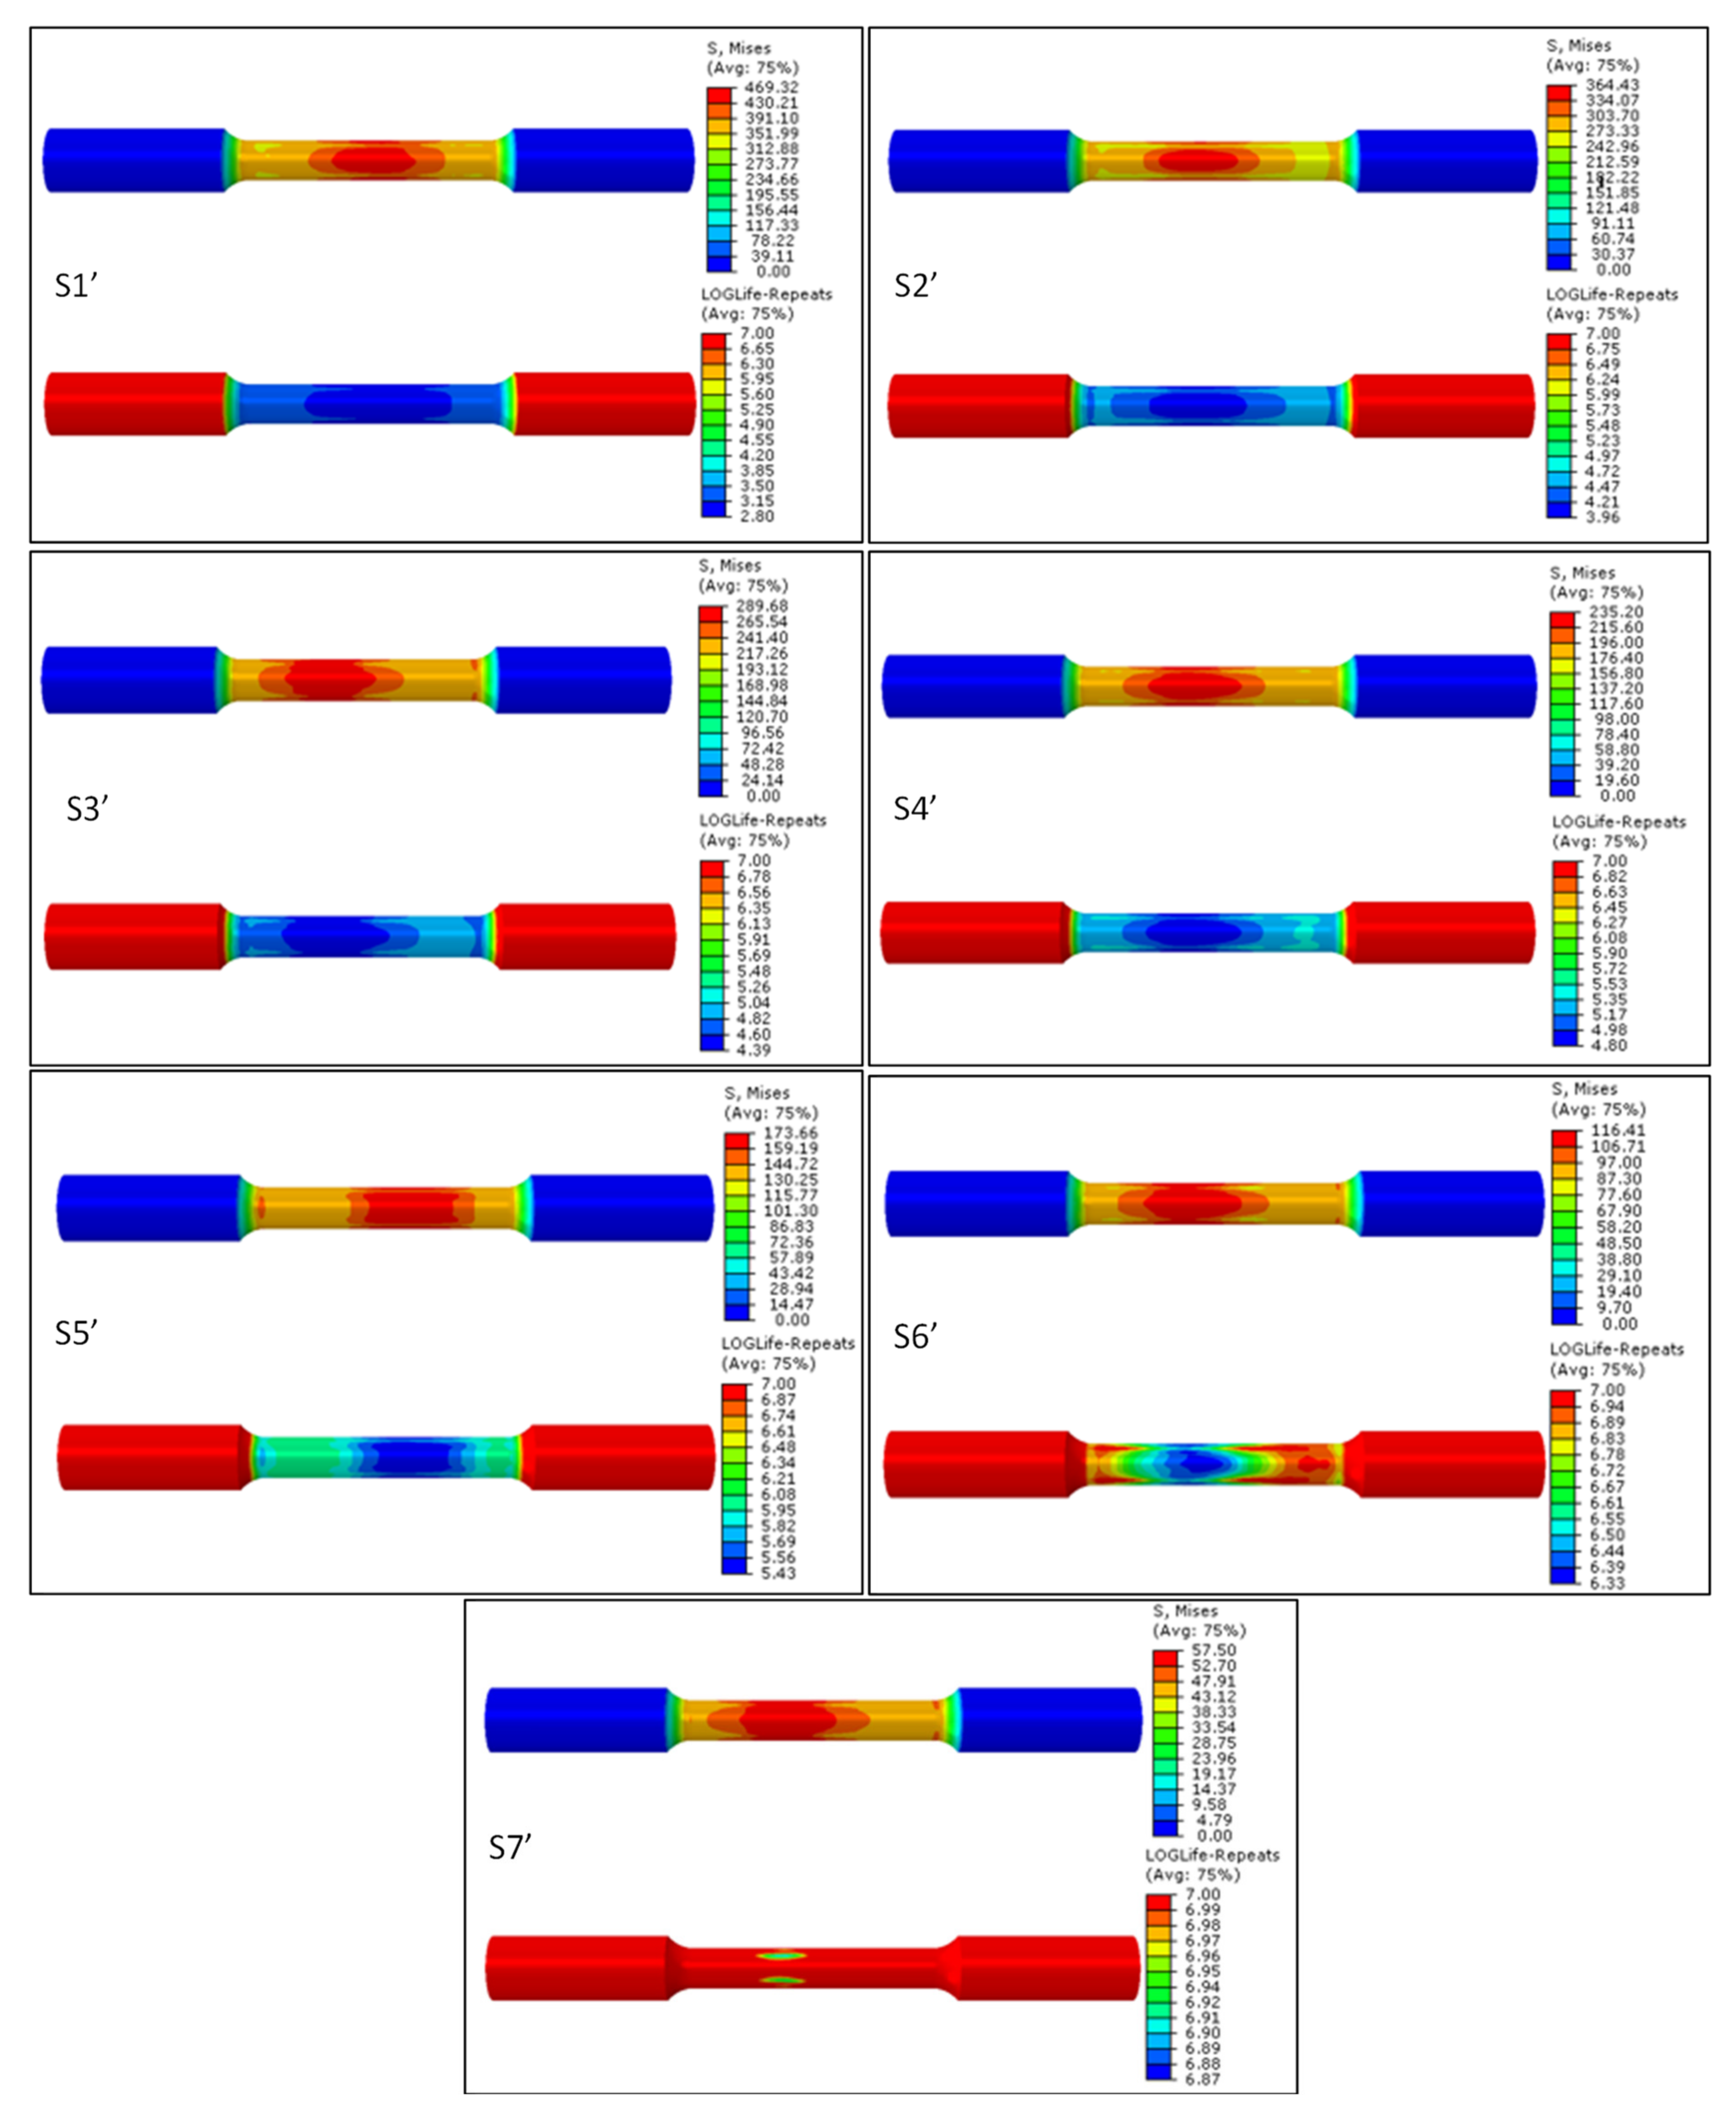
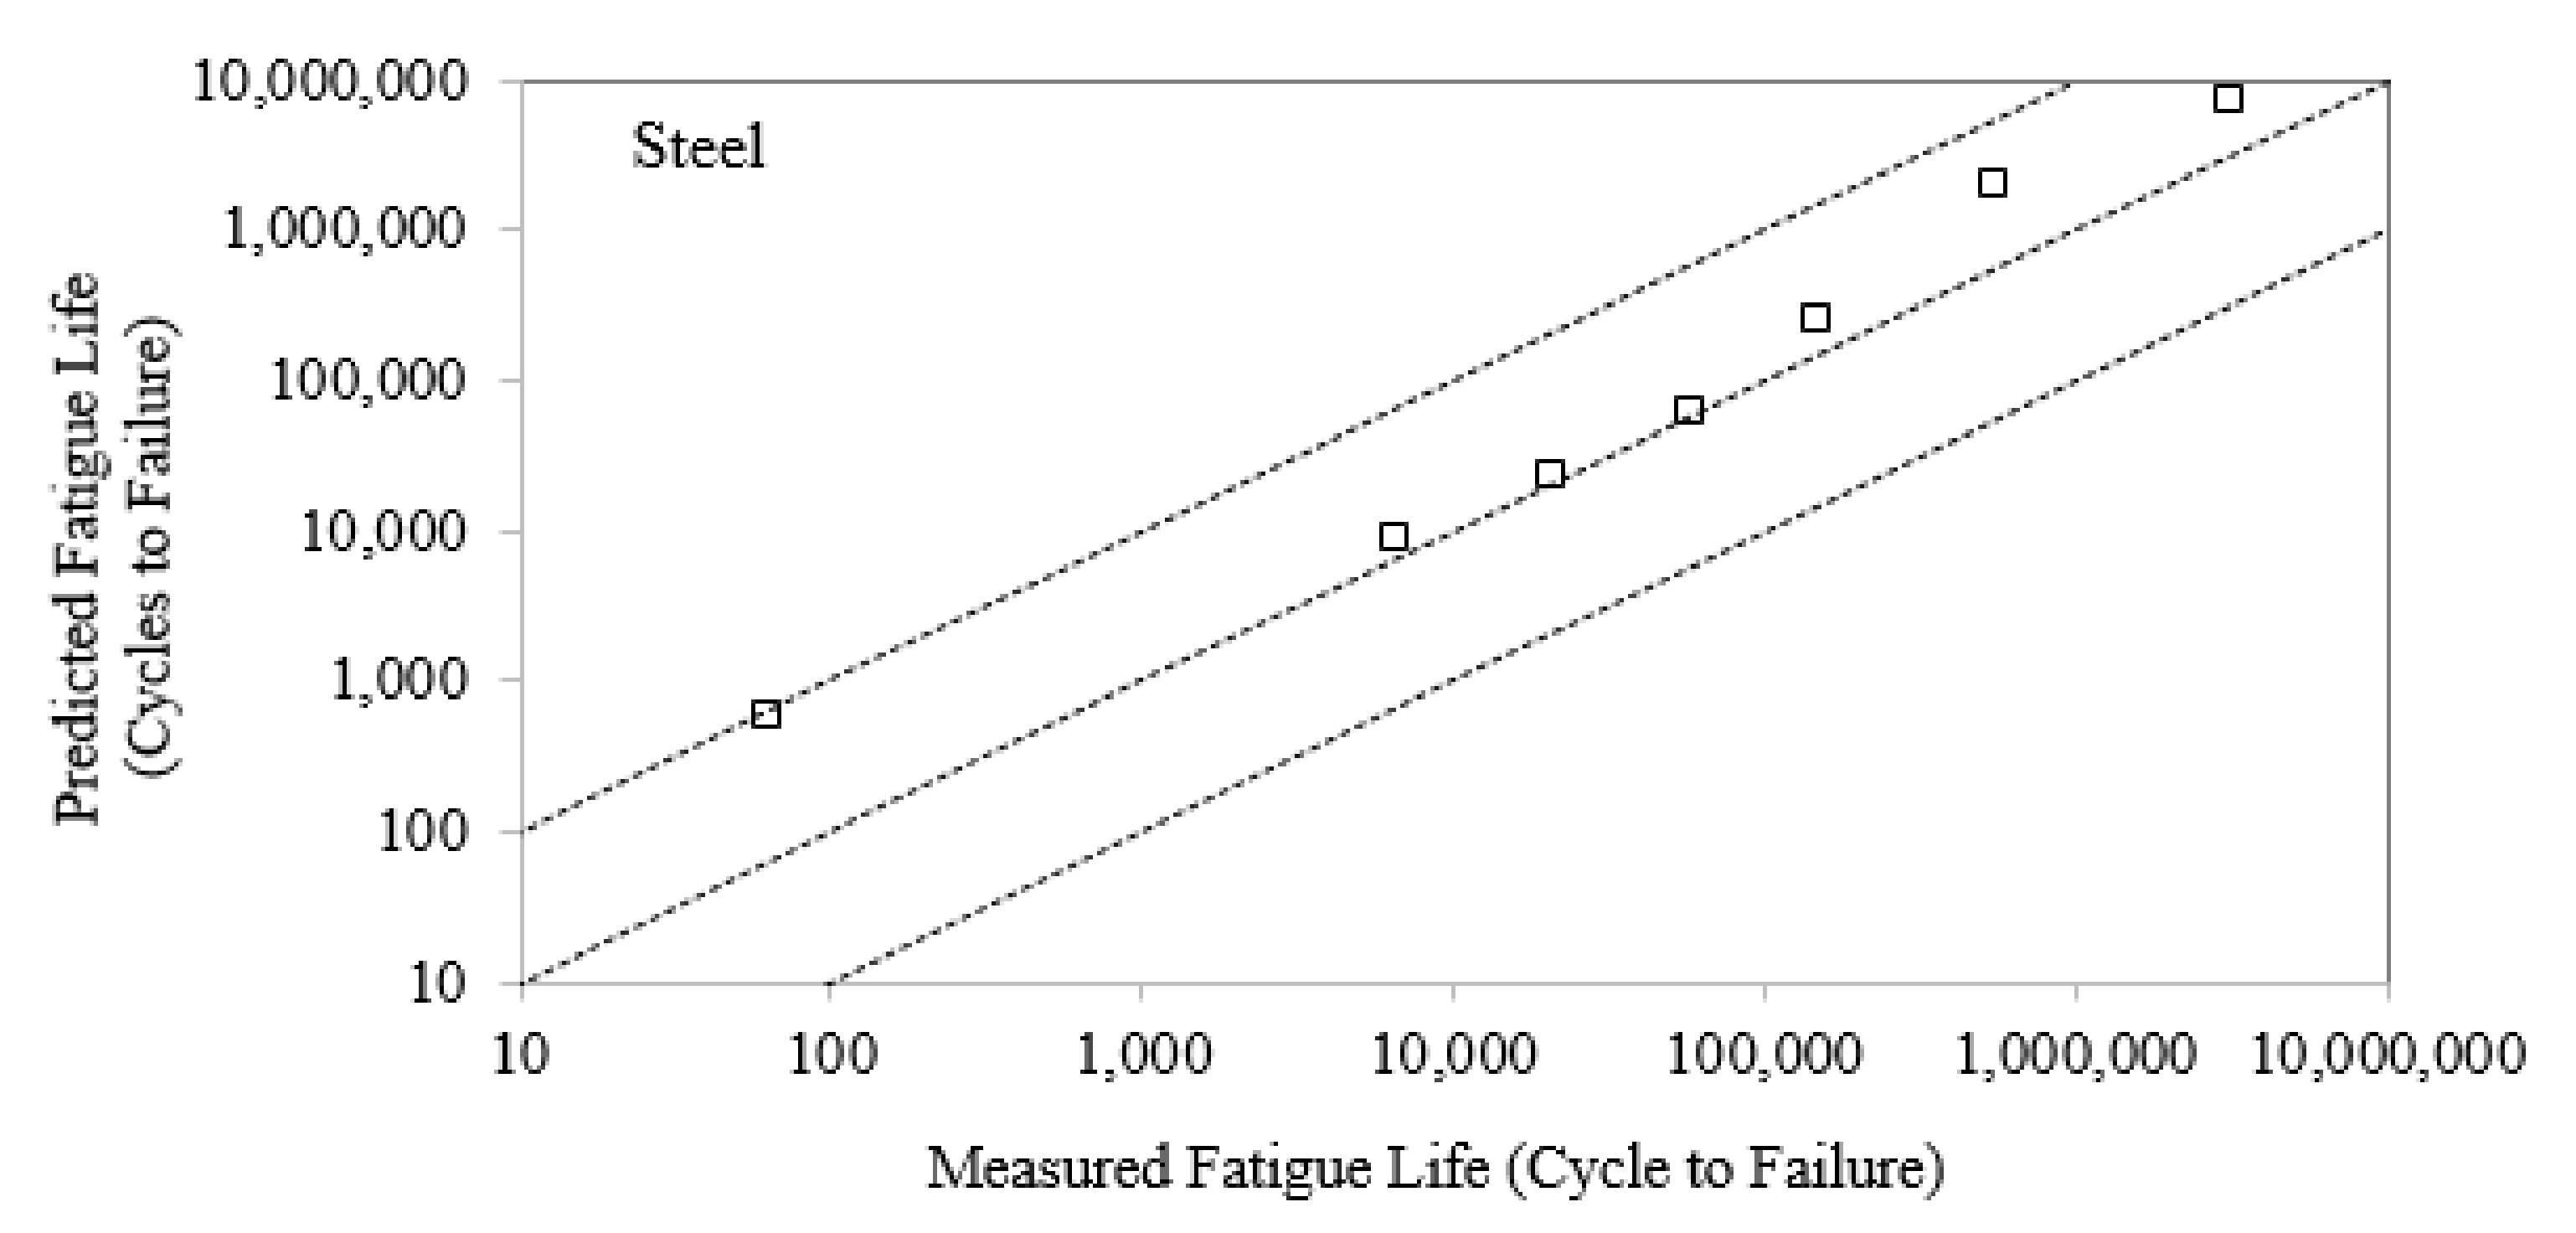
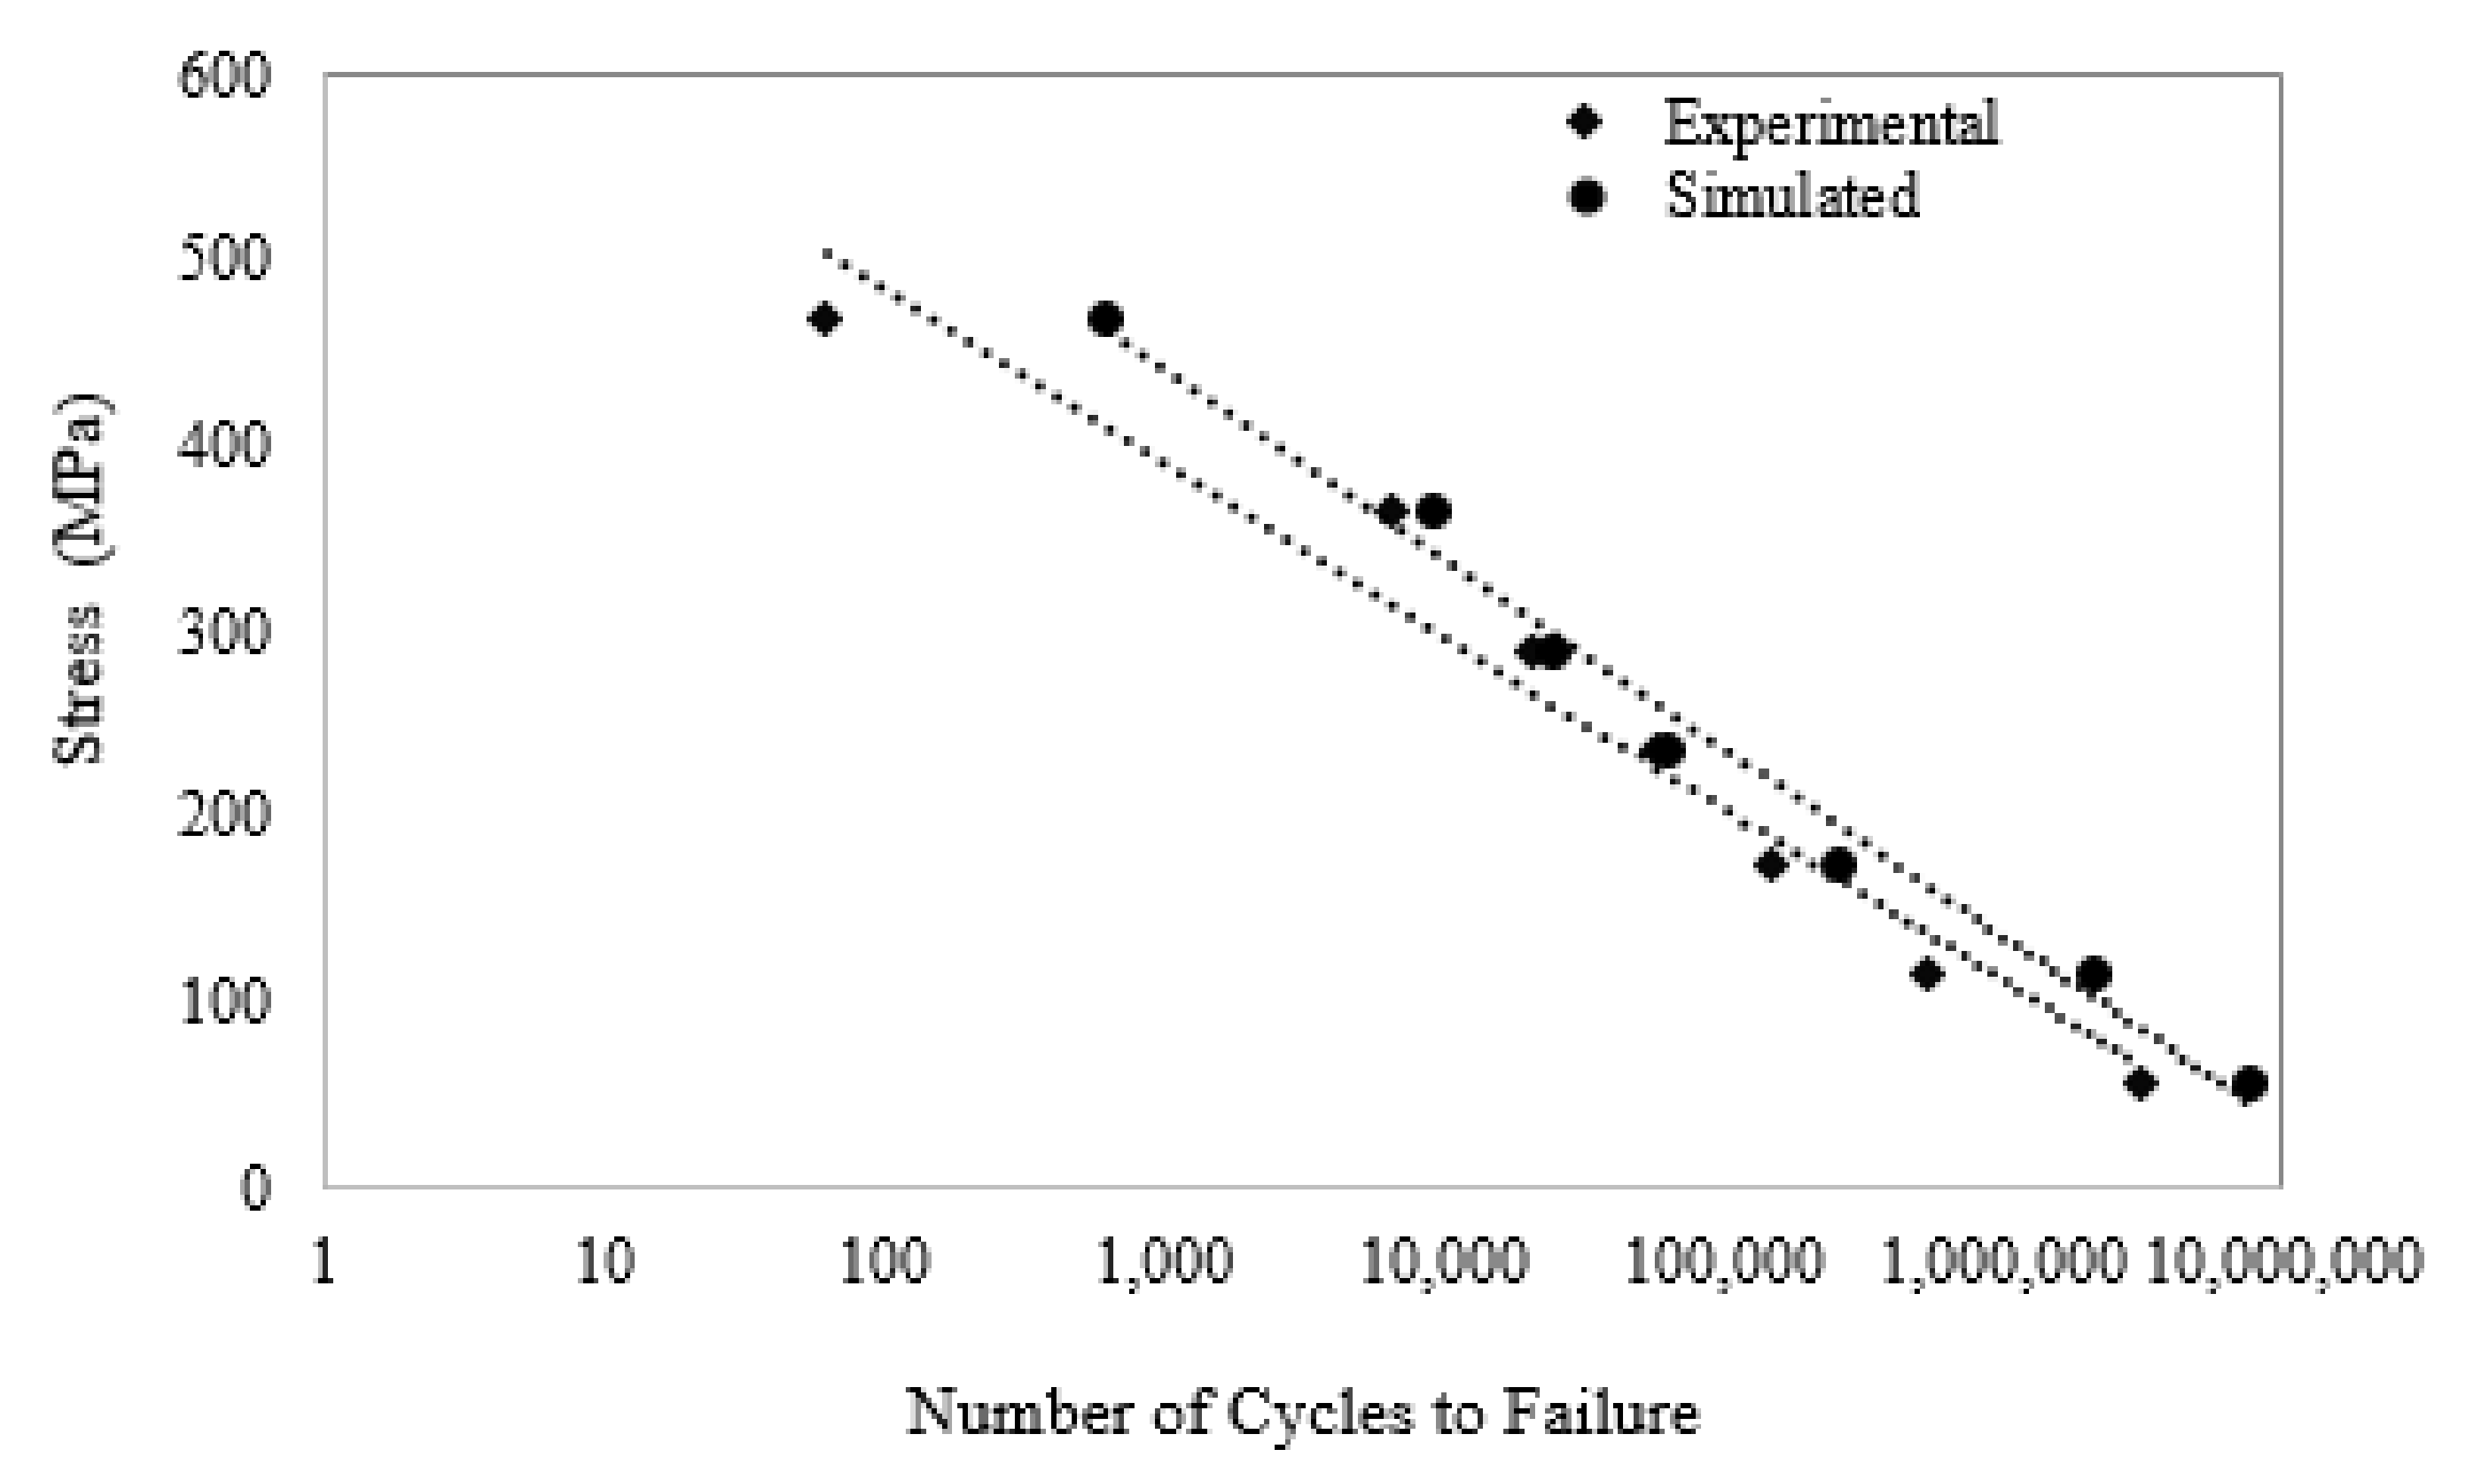
5.3. Results of Fatigue Life Simulations
6. Reliability Analysis
6.1. Strength-Stress Model and Reliability Calculations
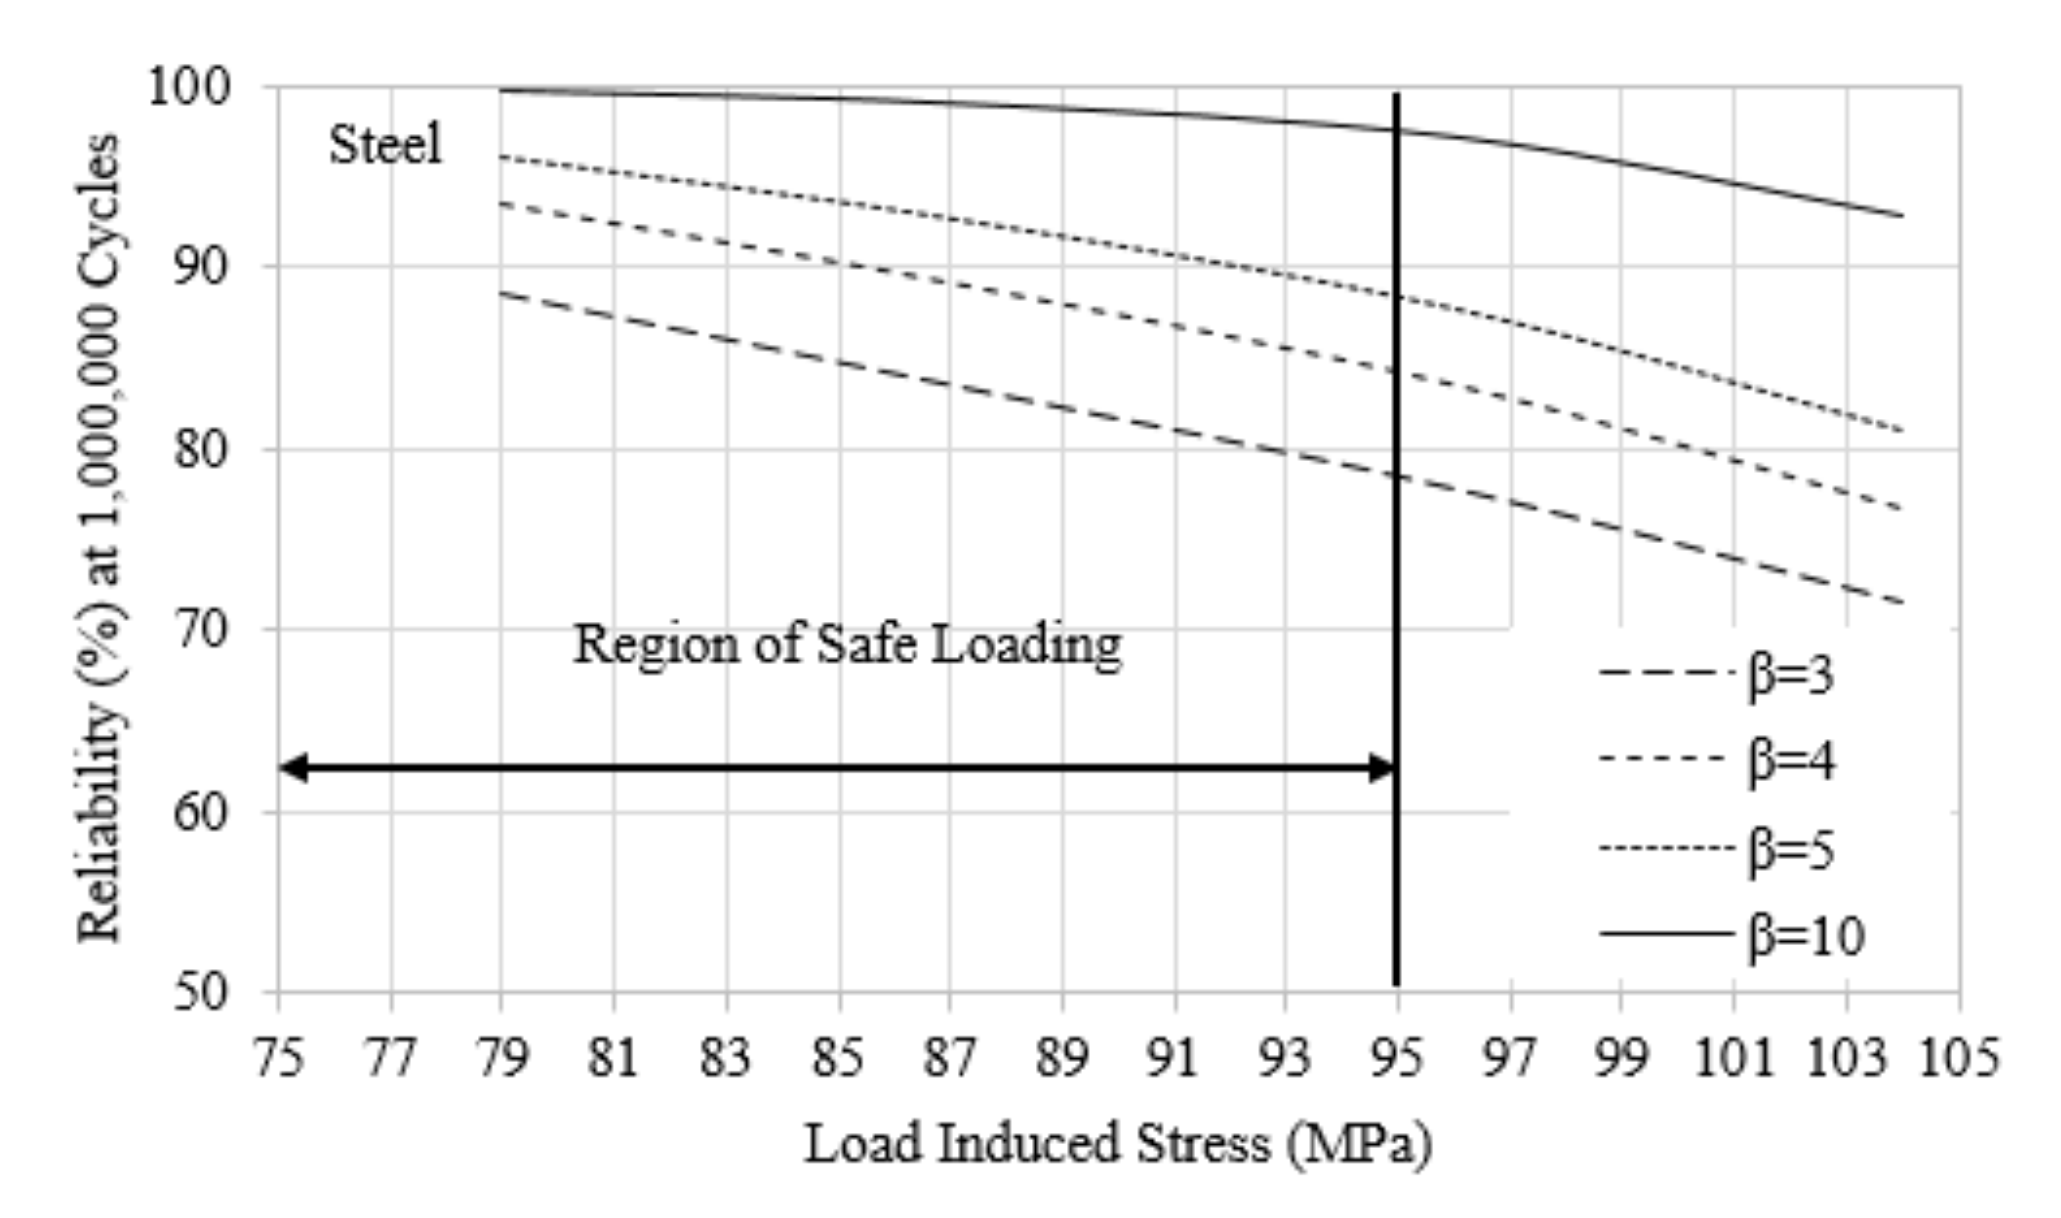
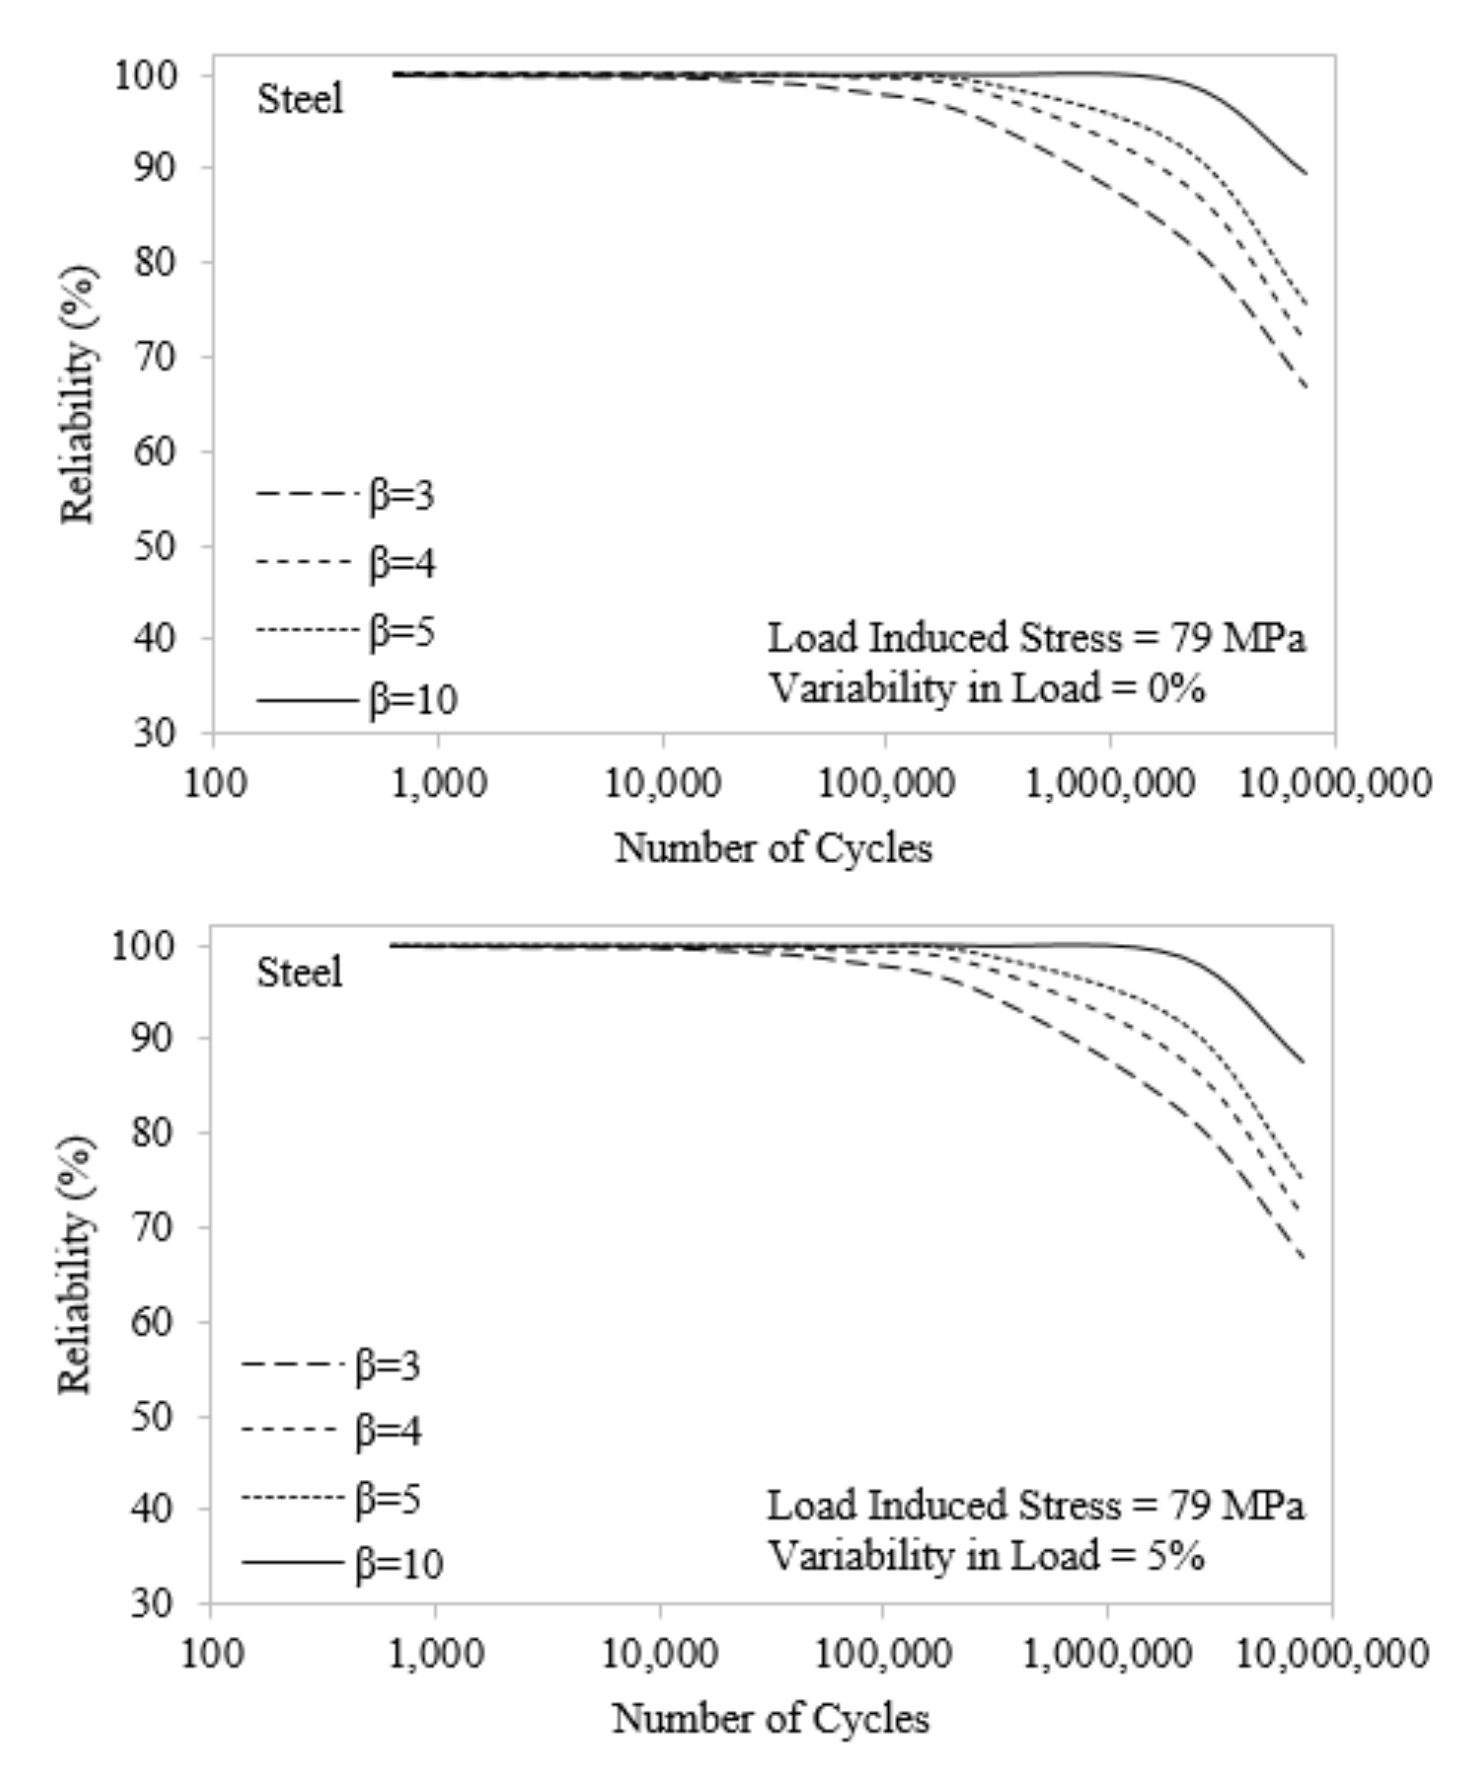
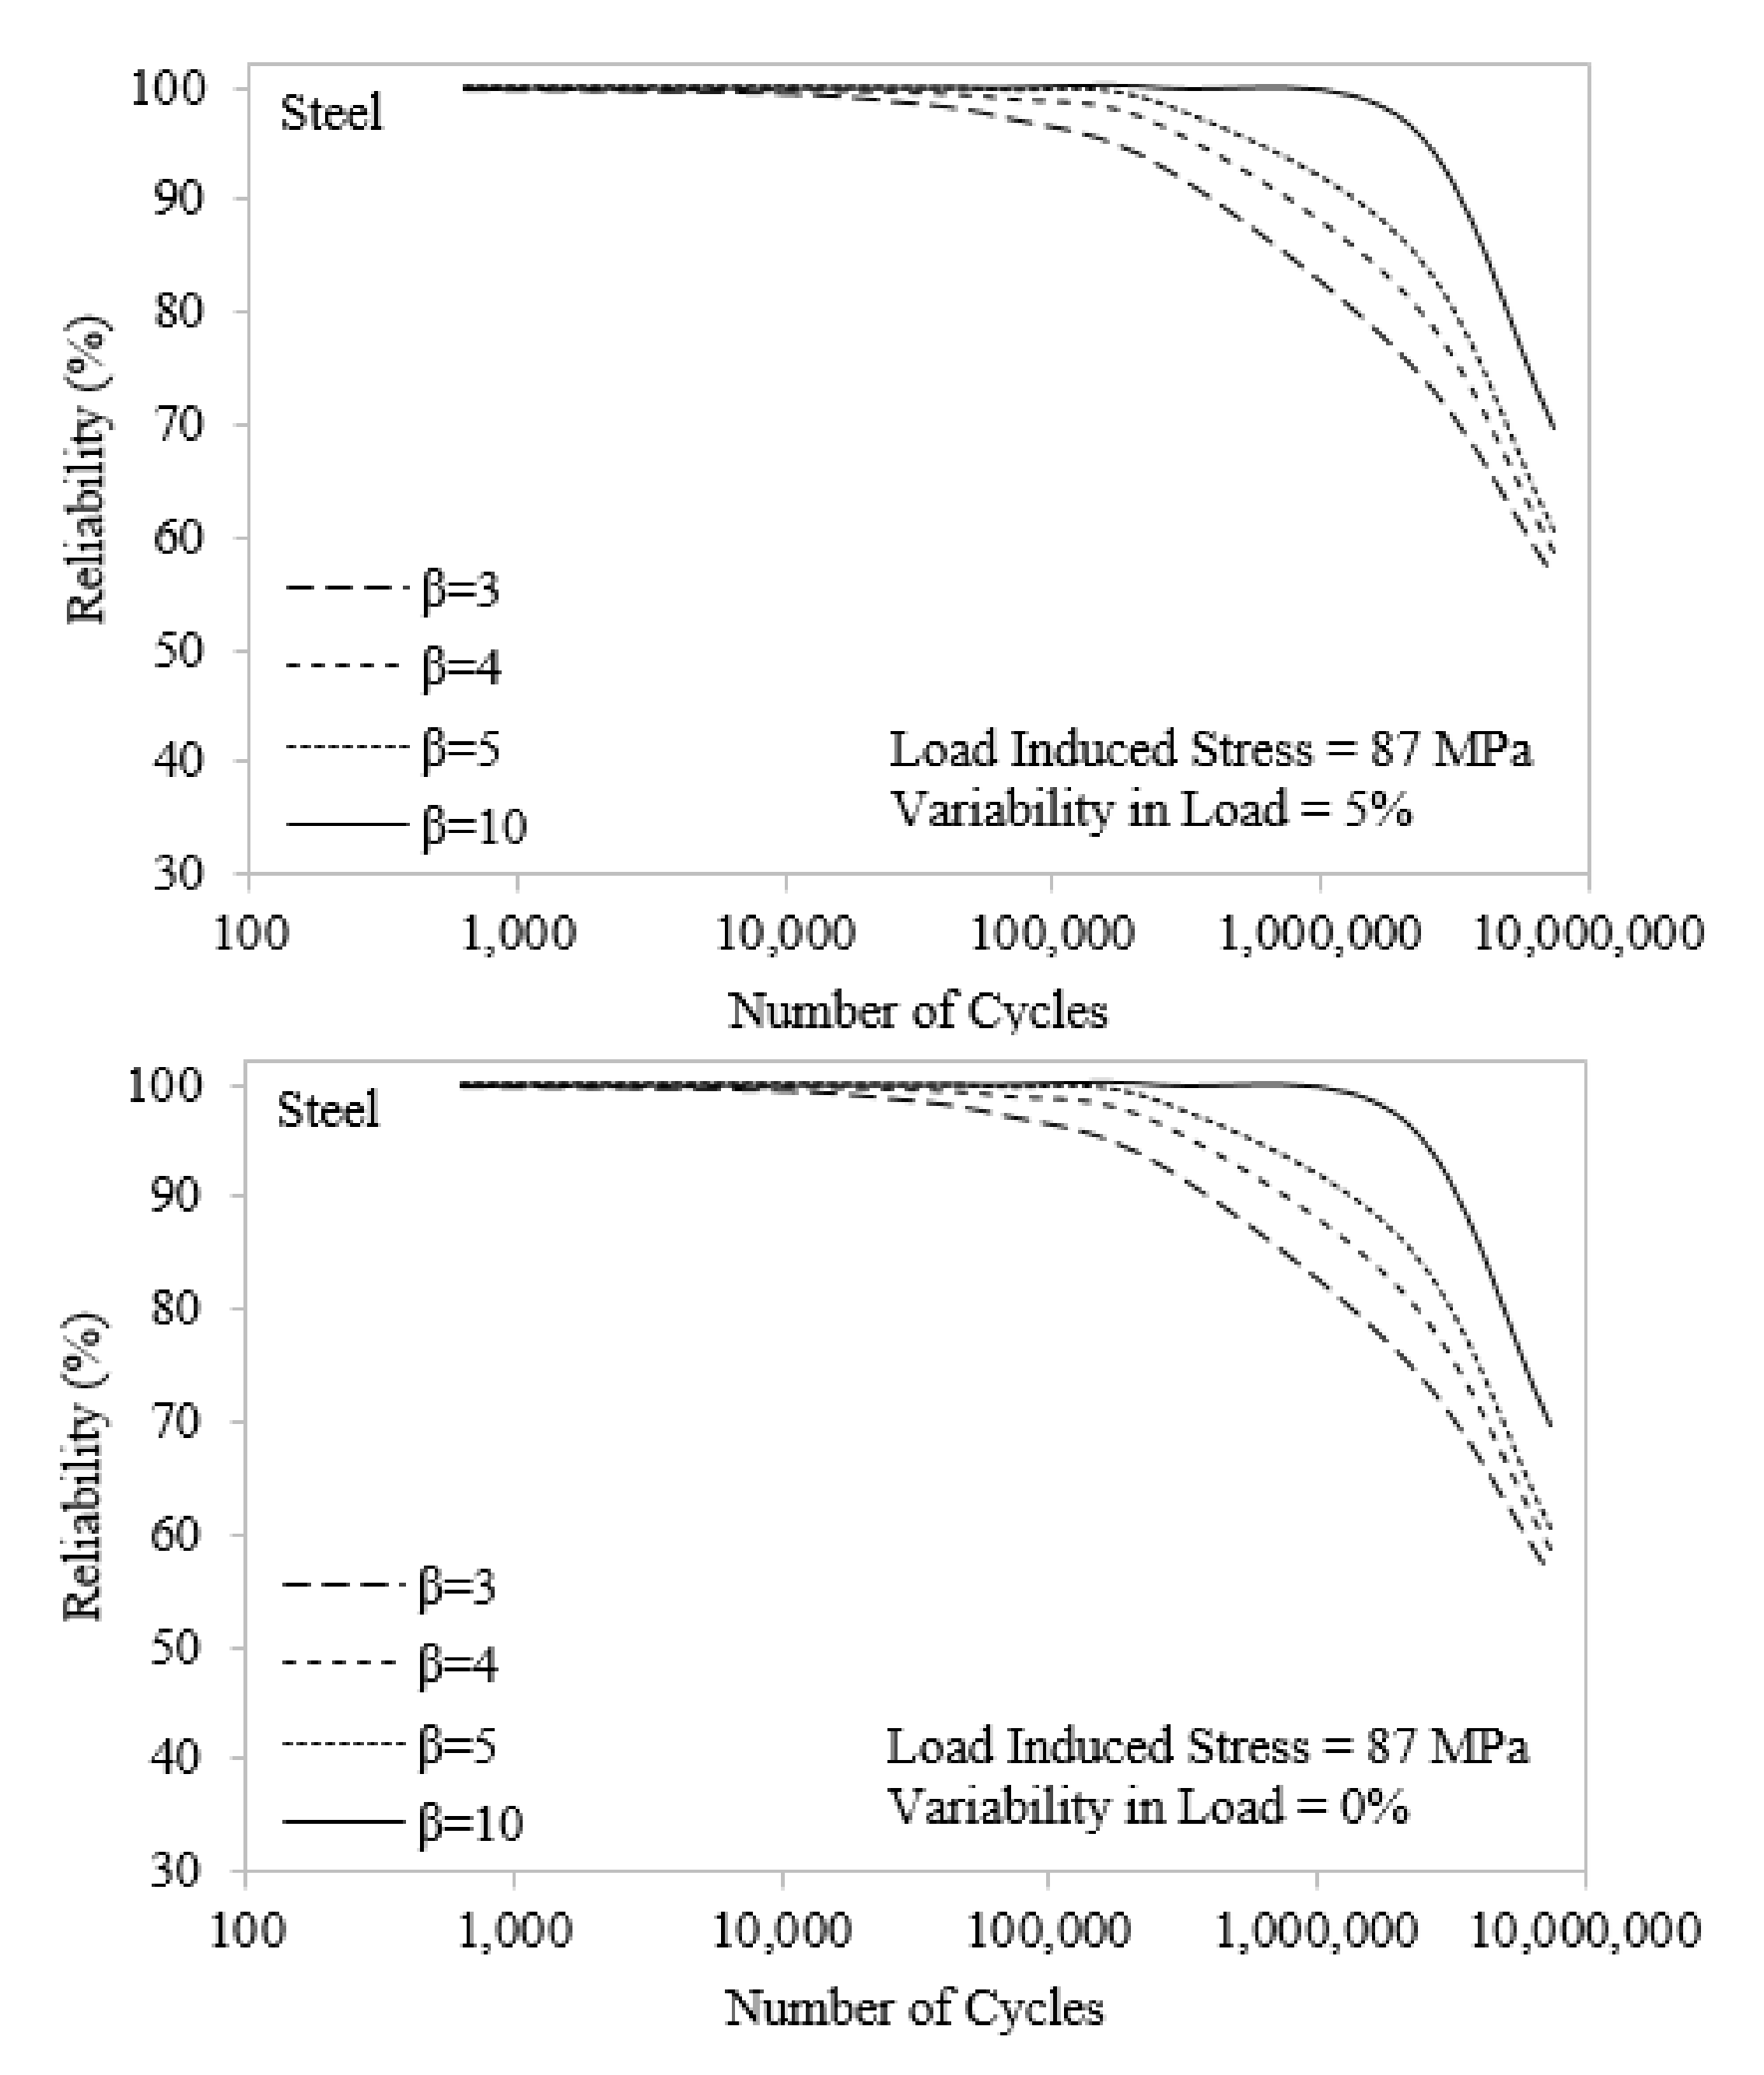
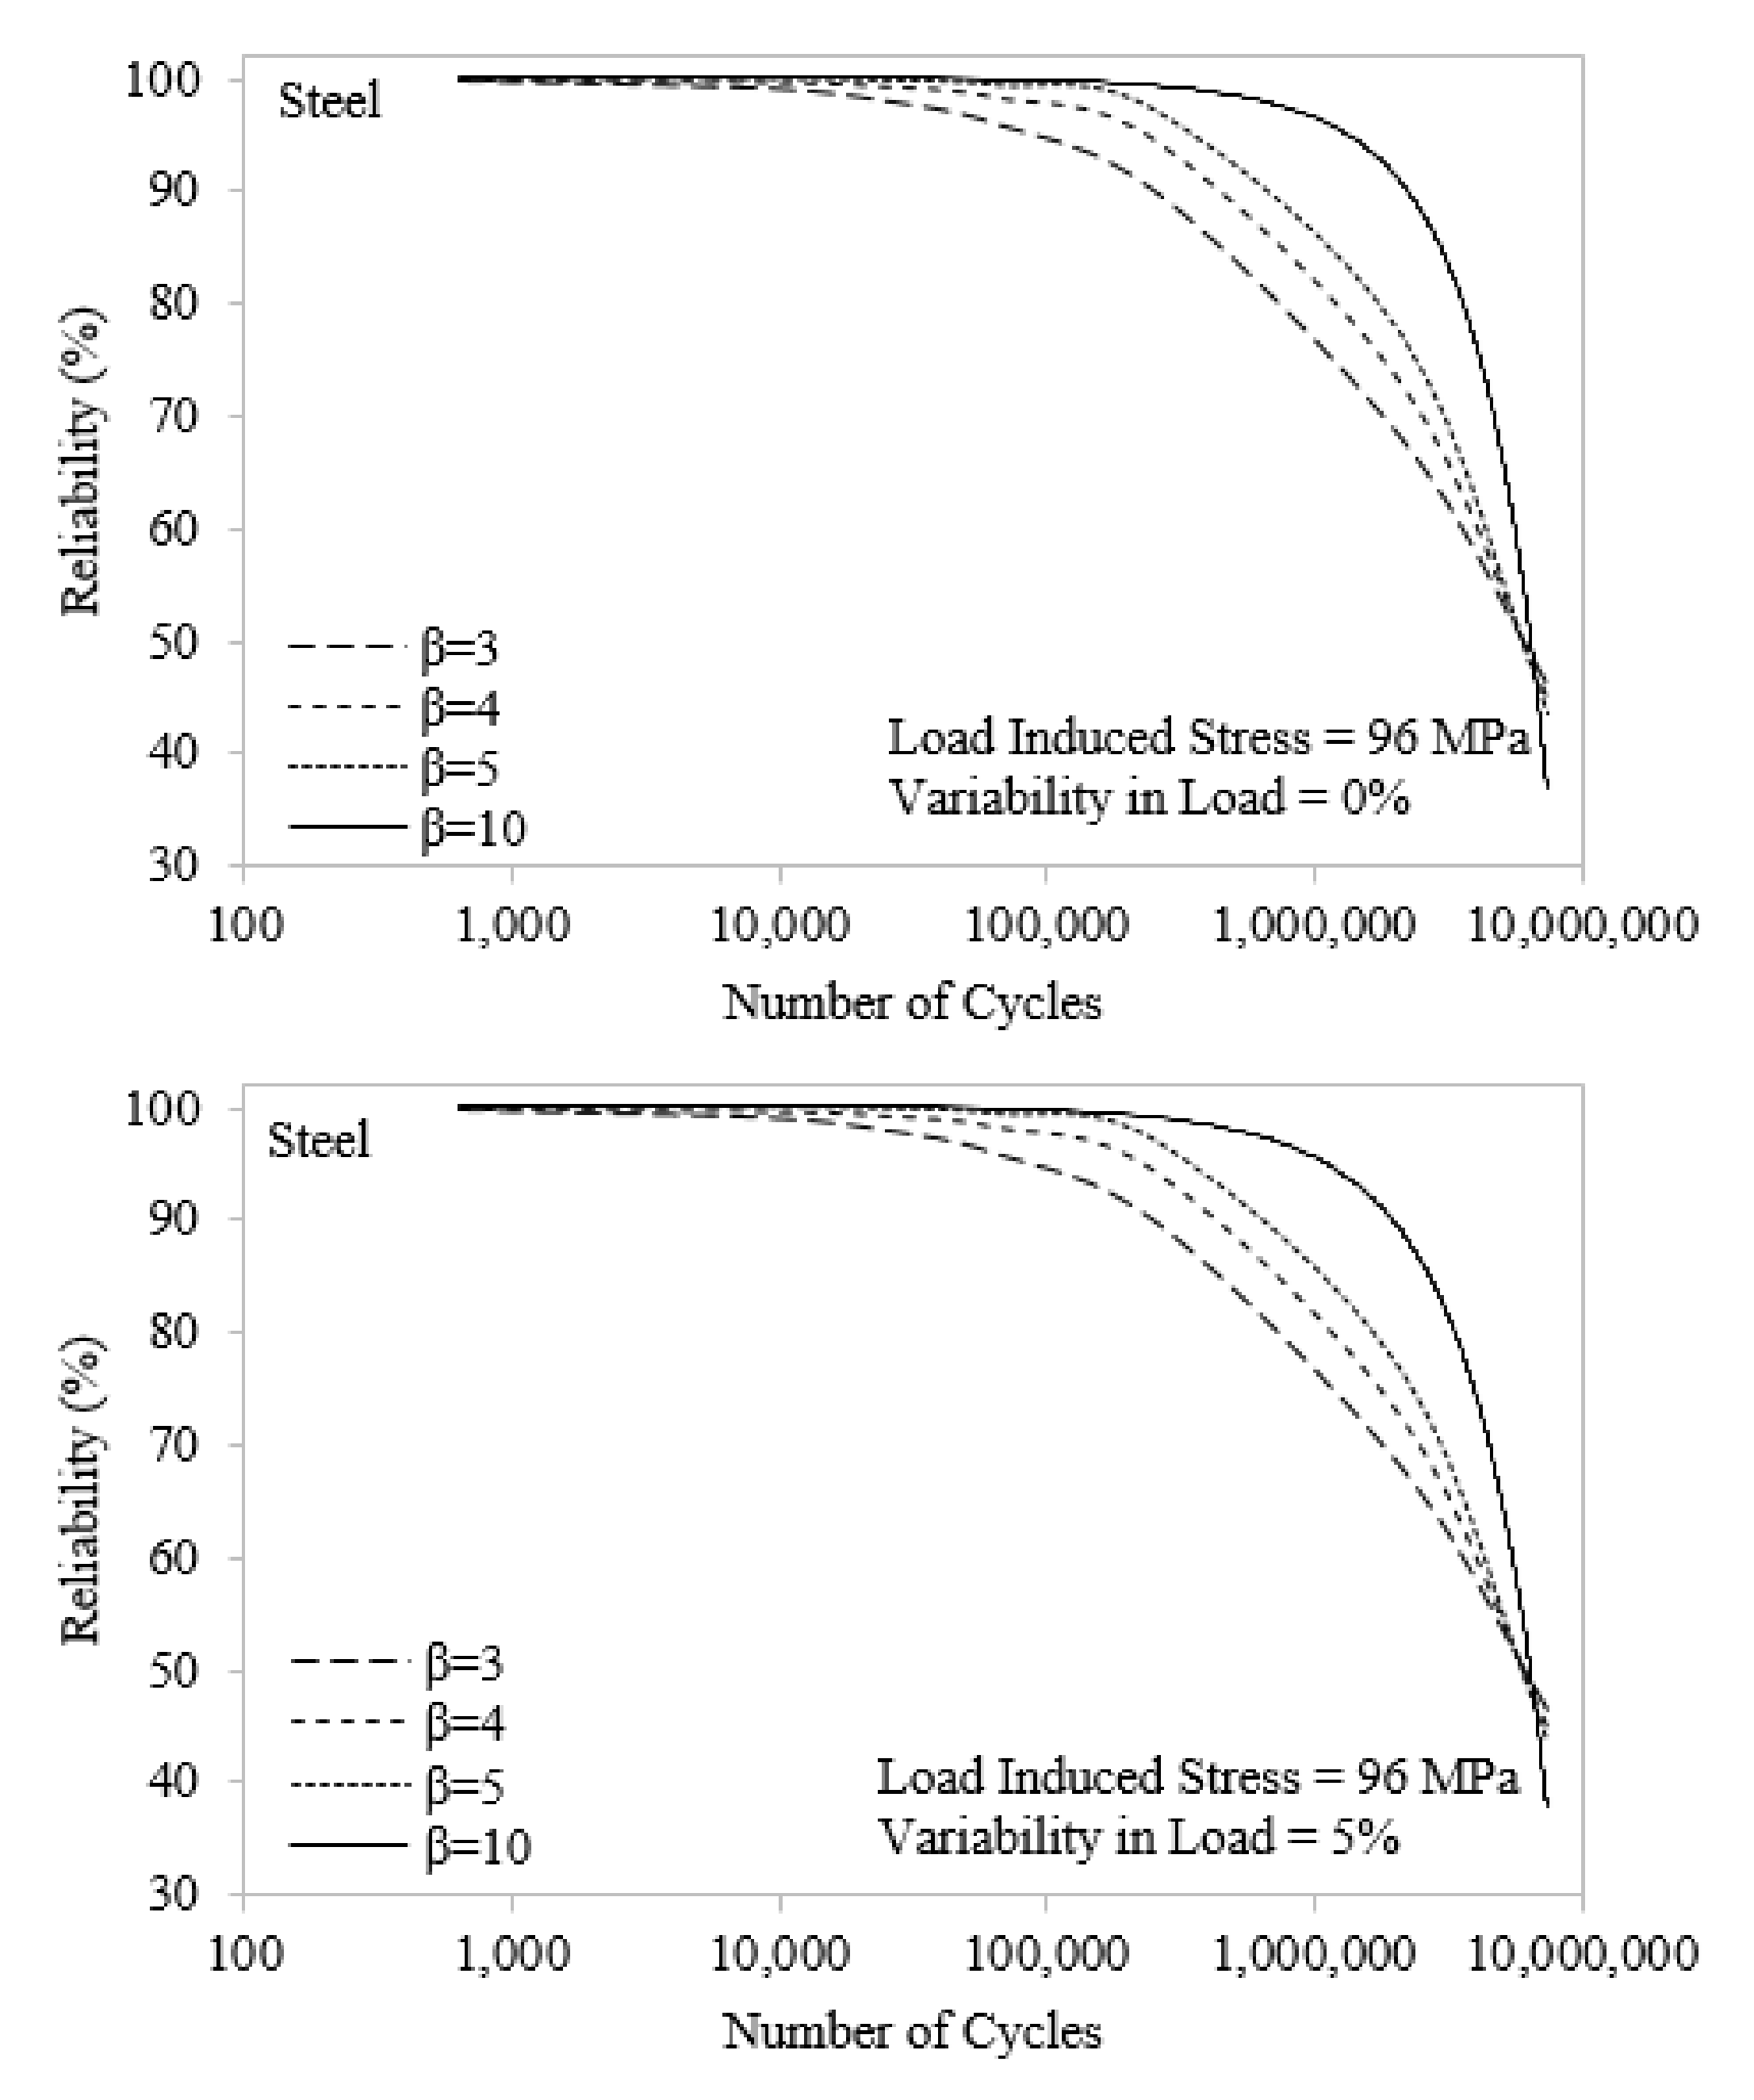
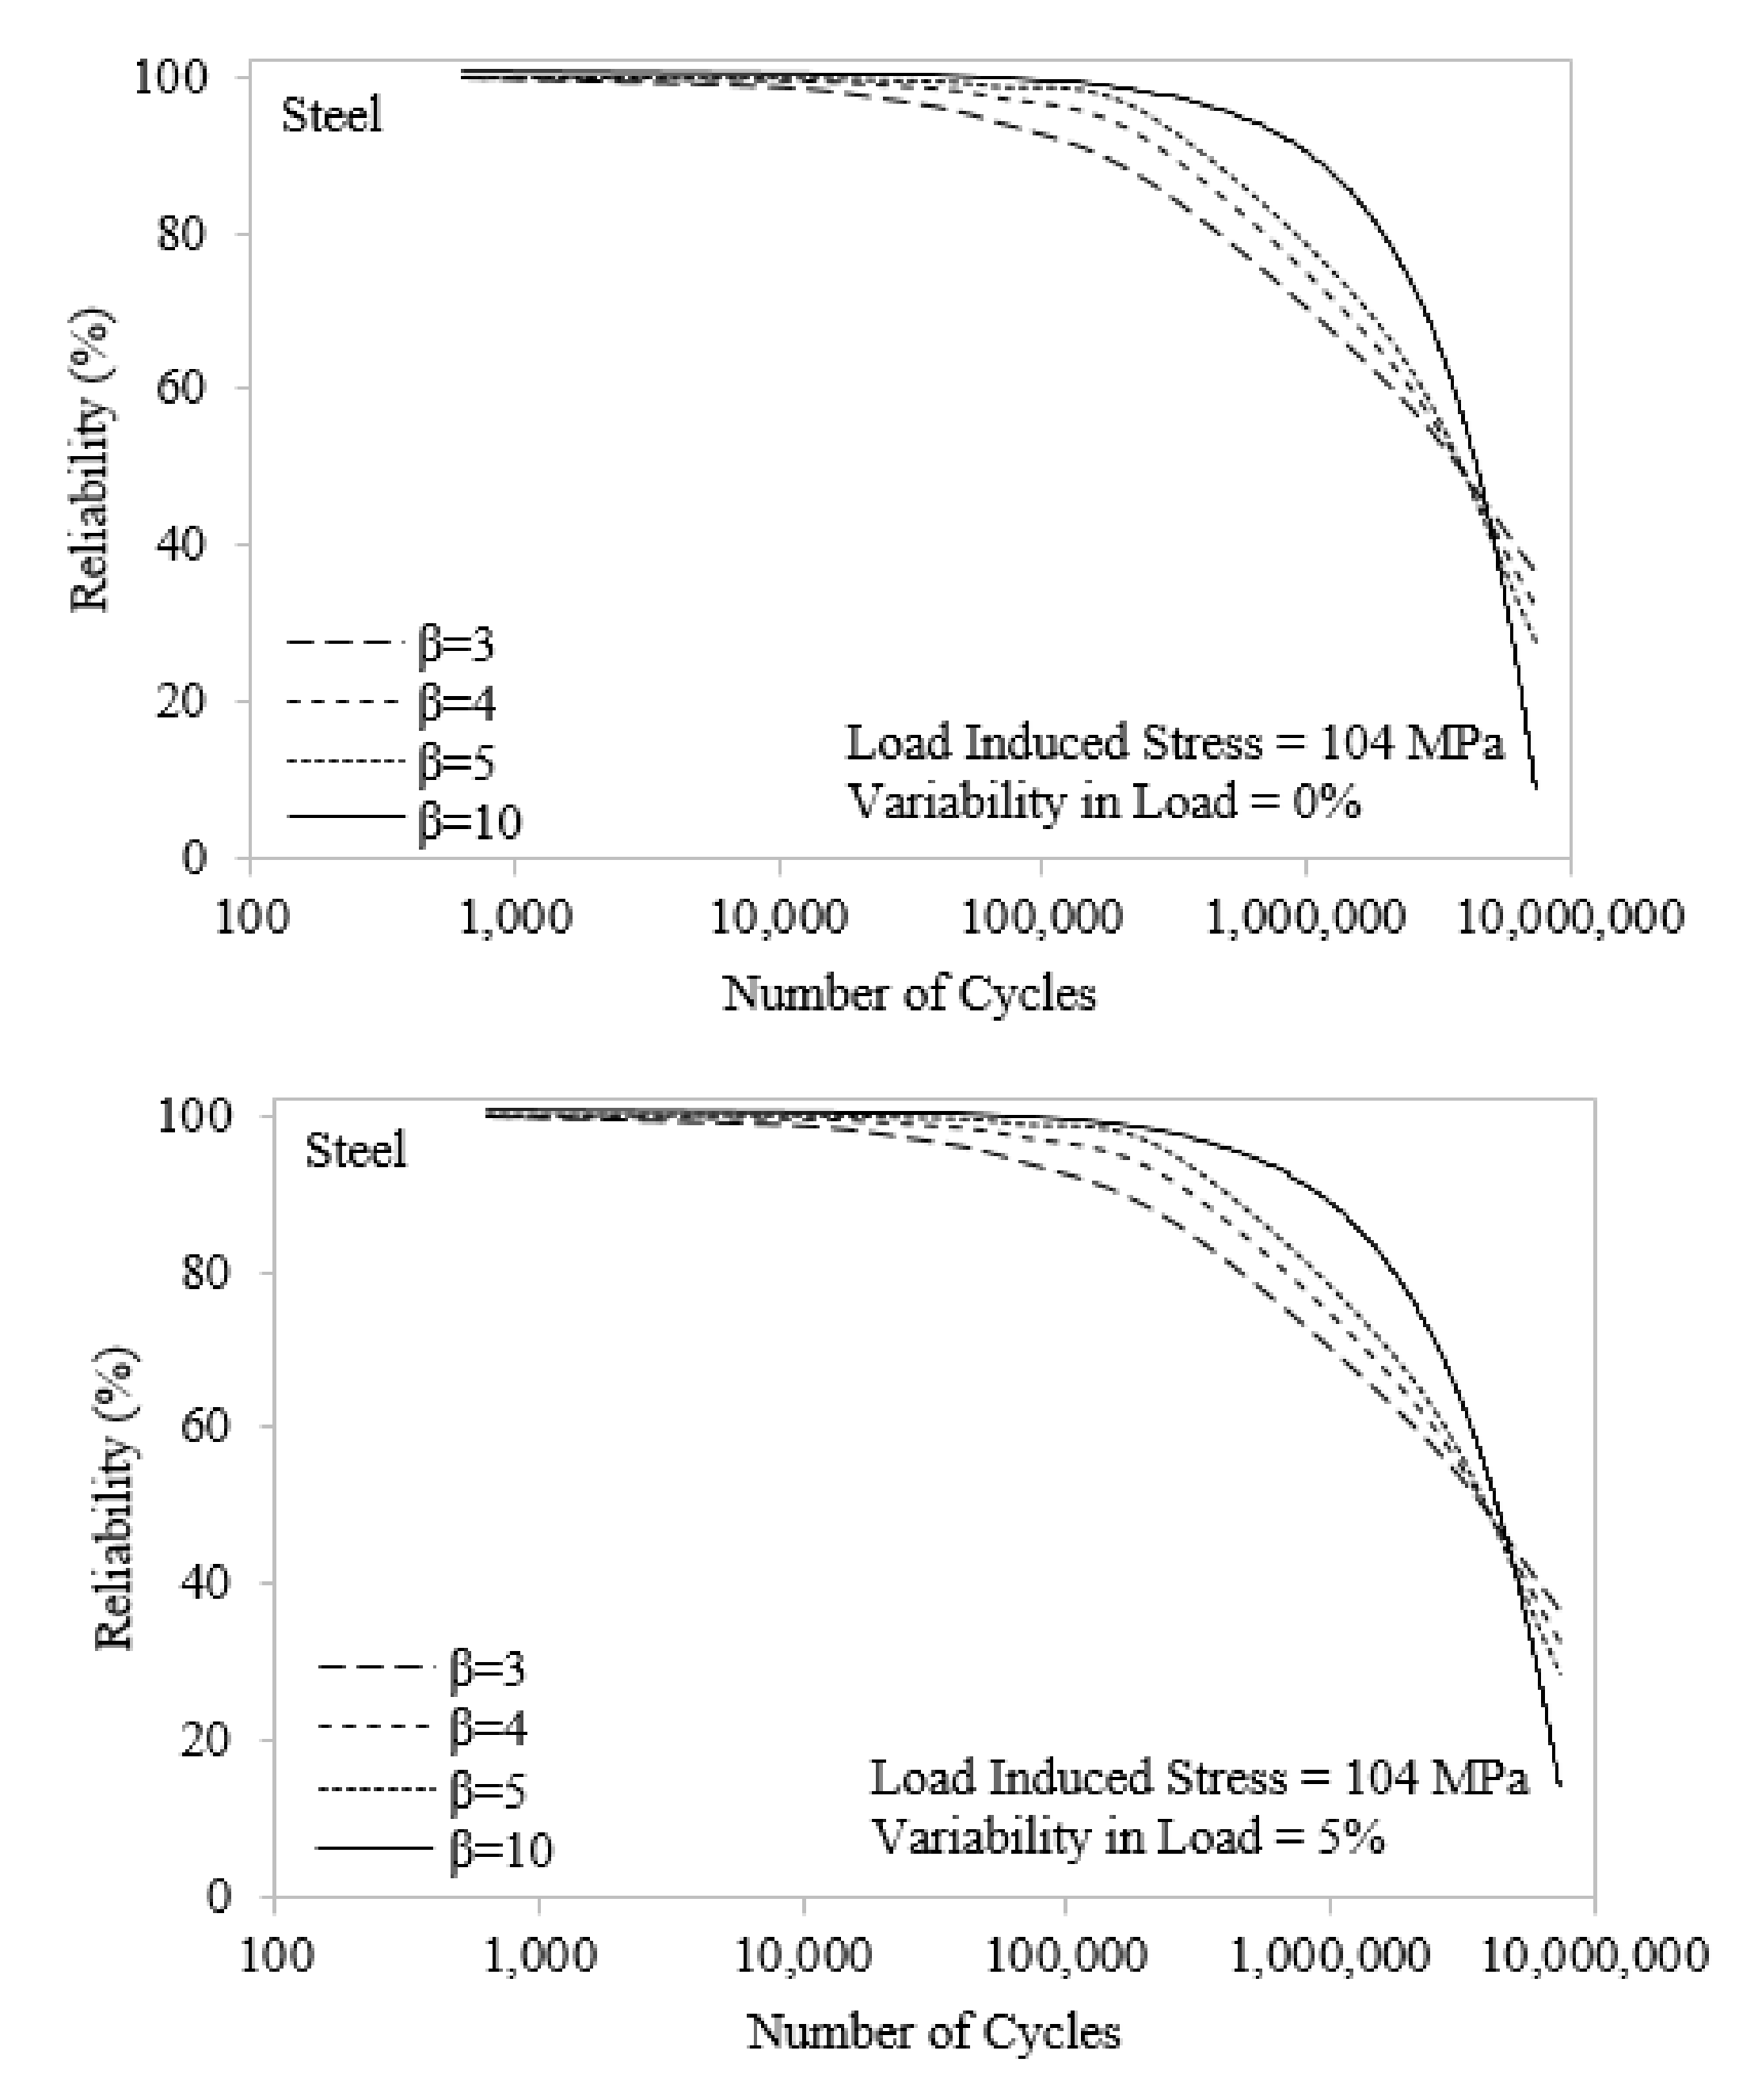
6.2. Reliability Results
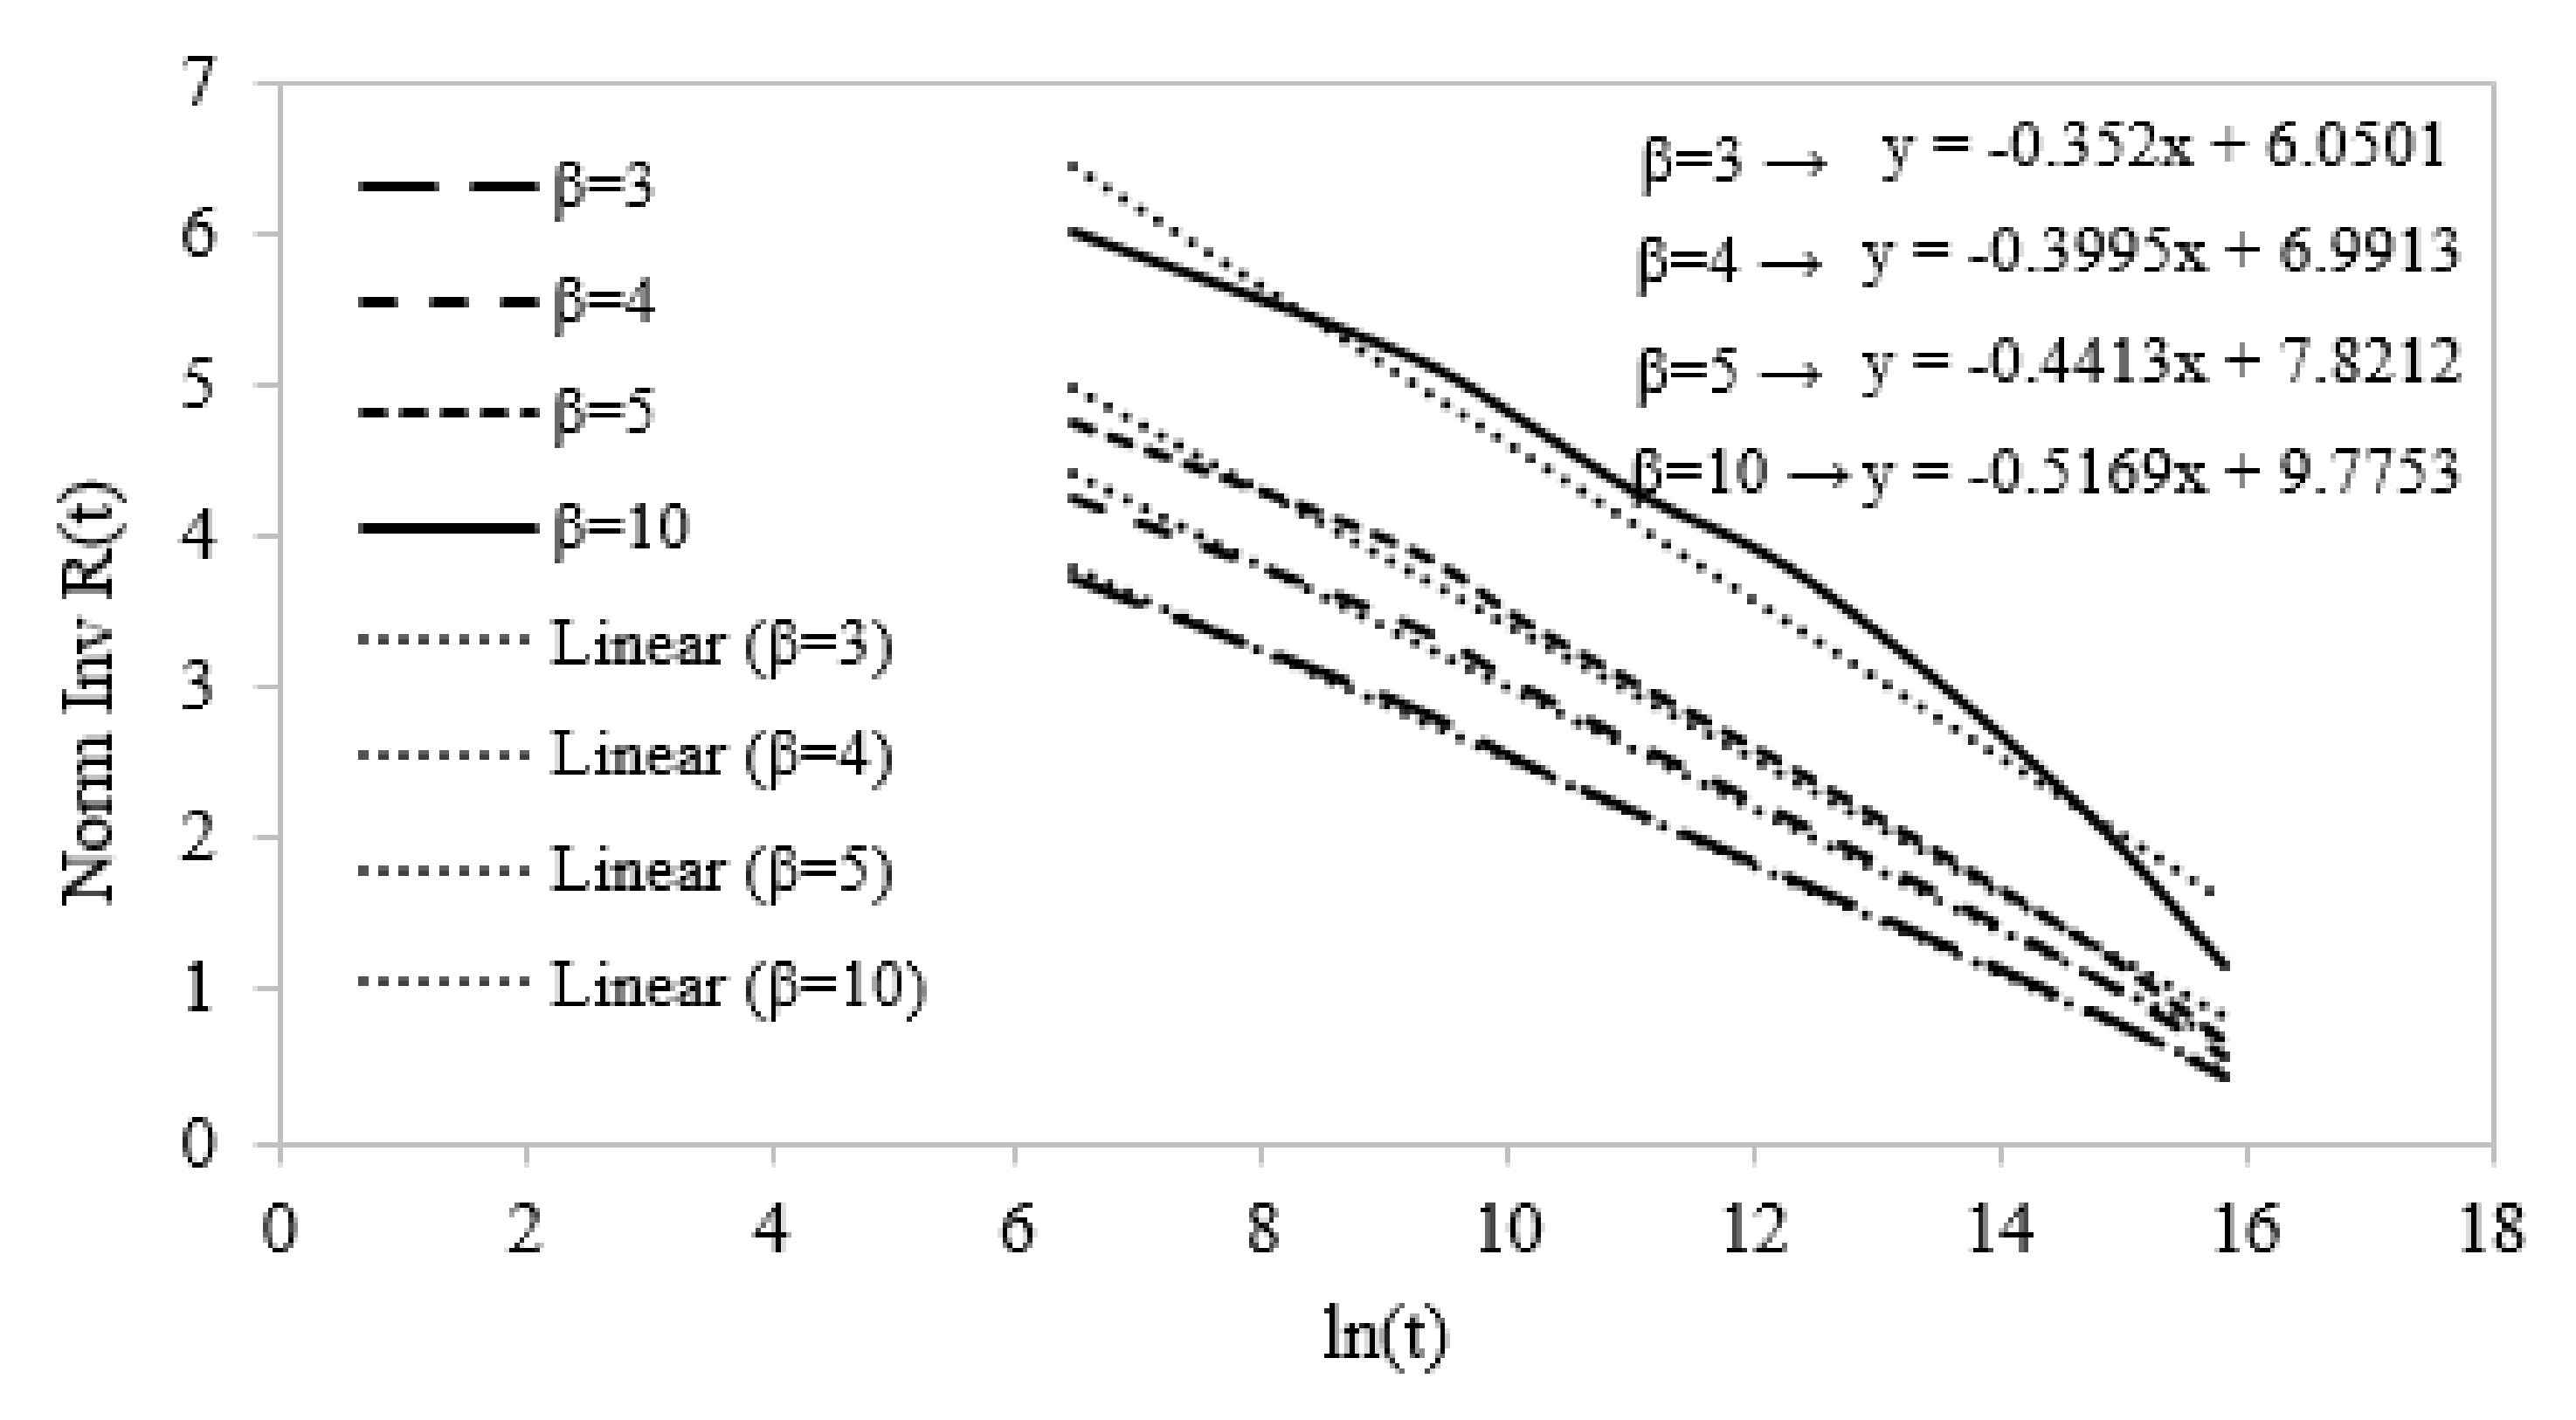
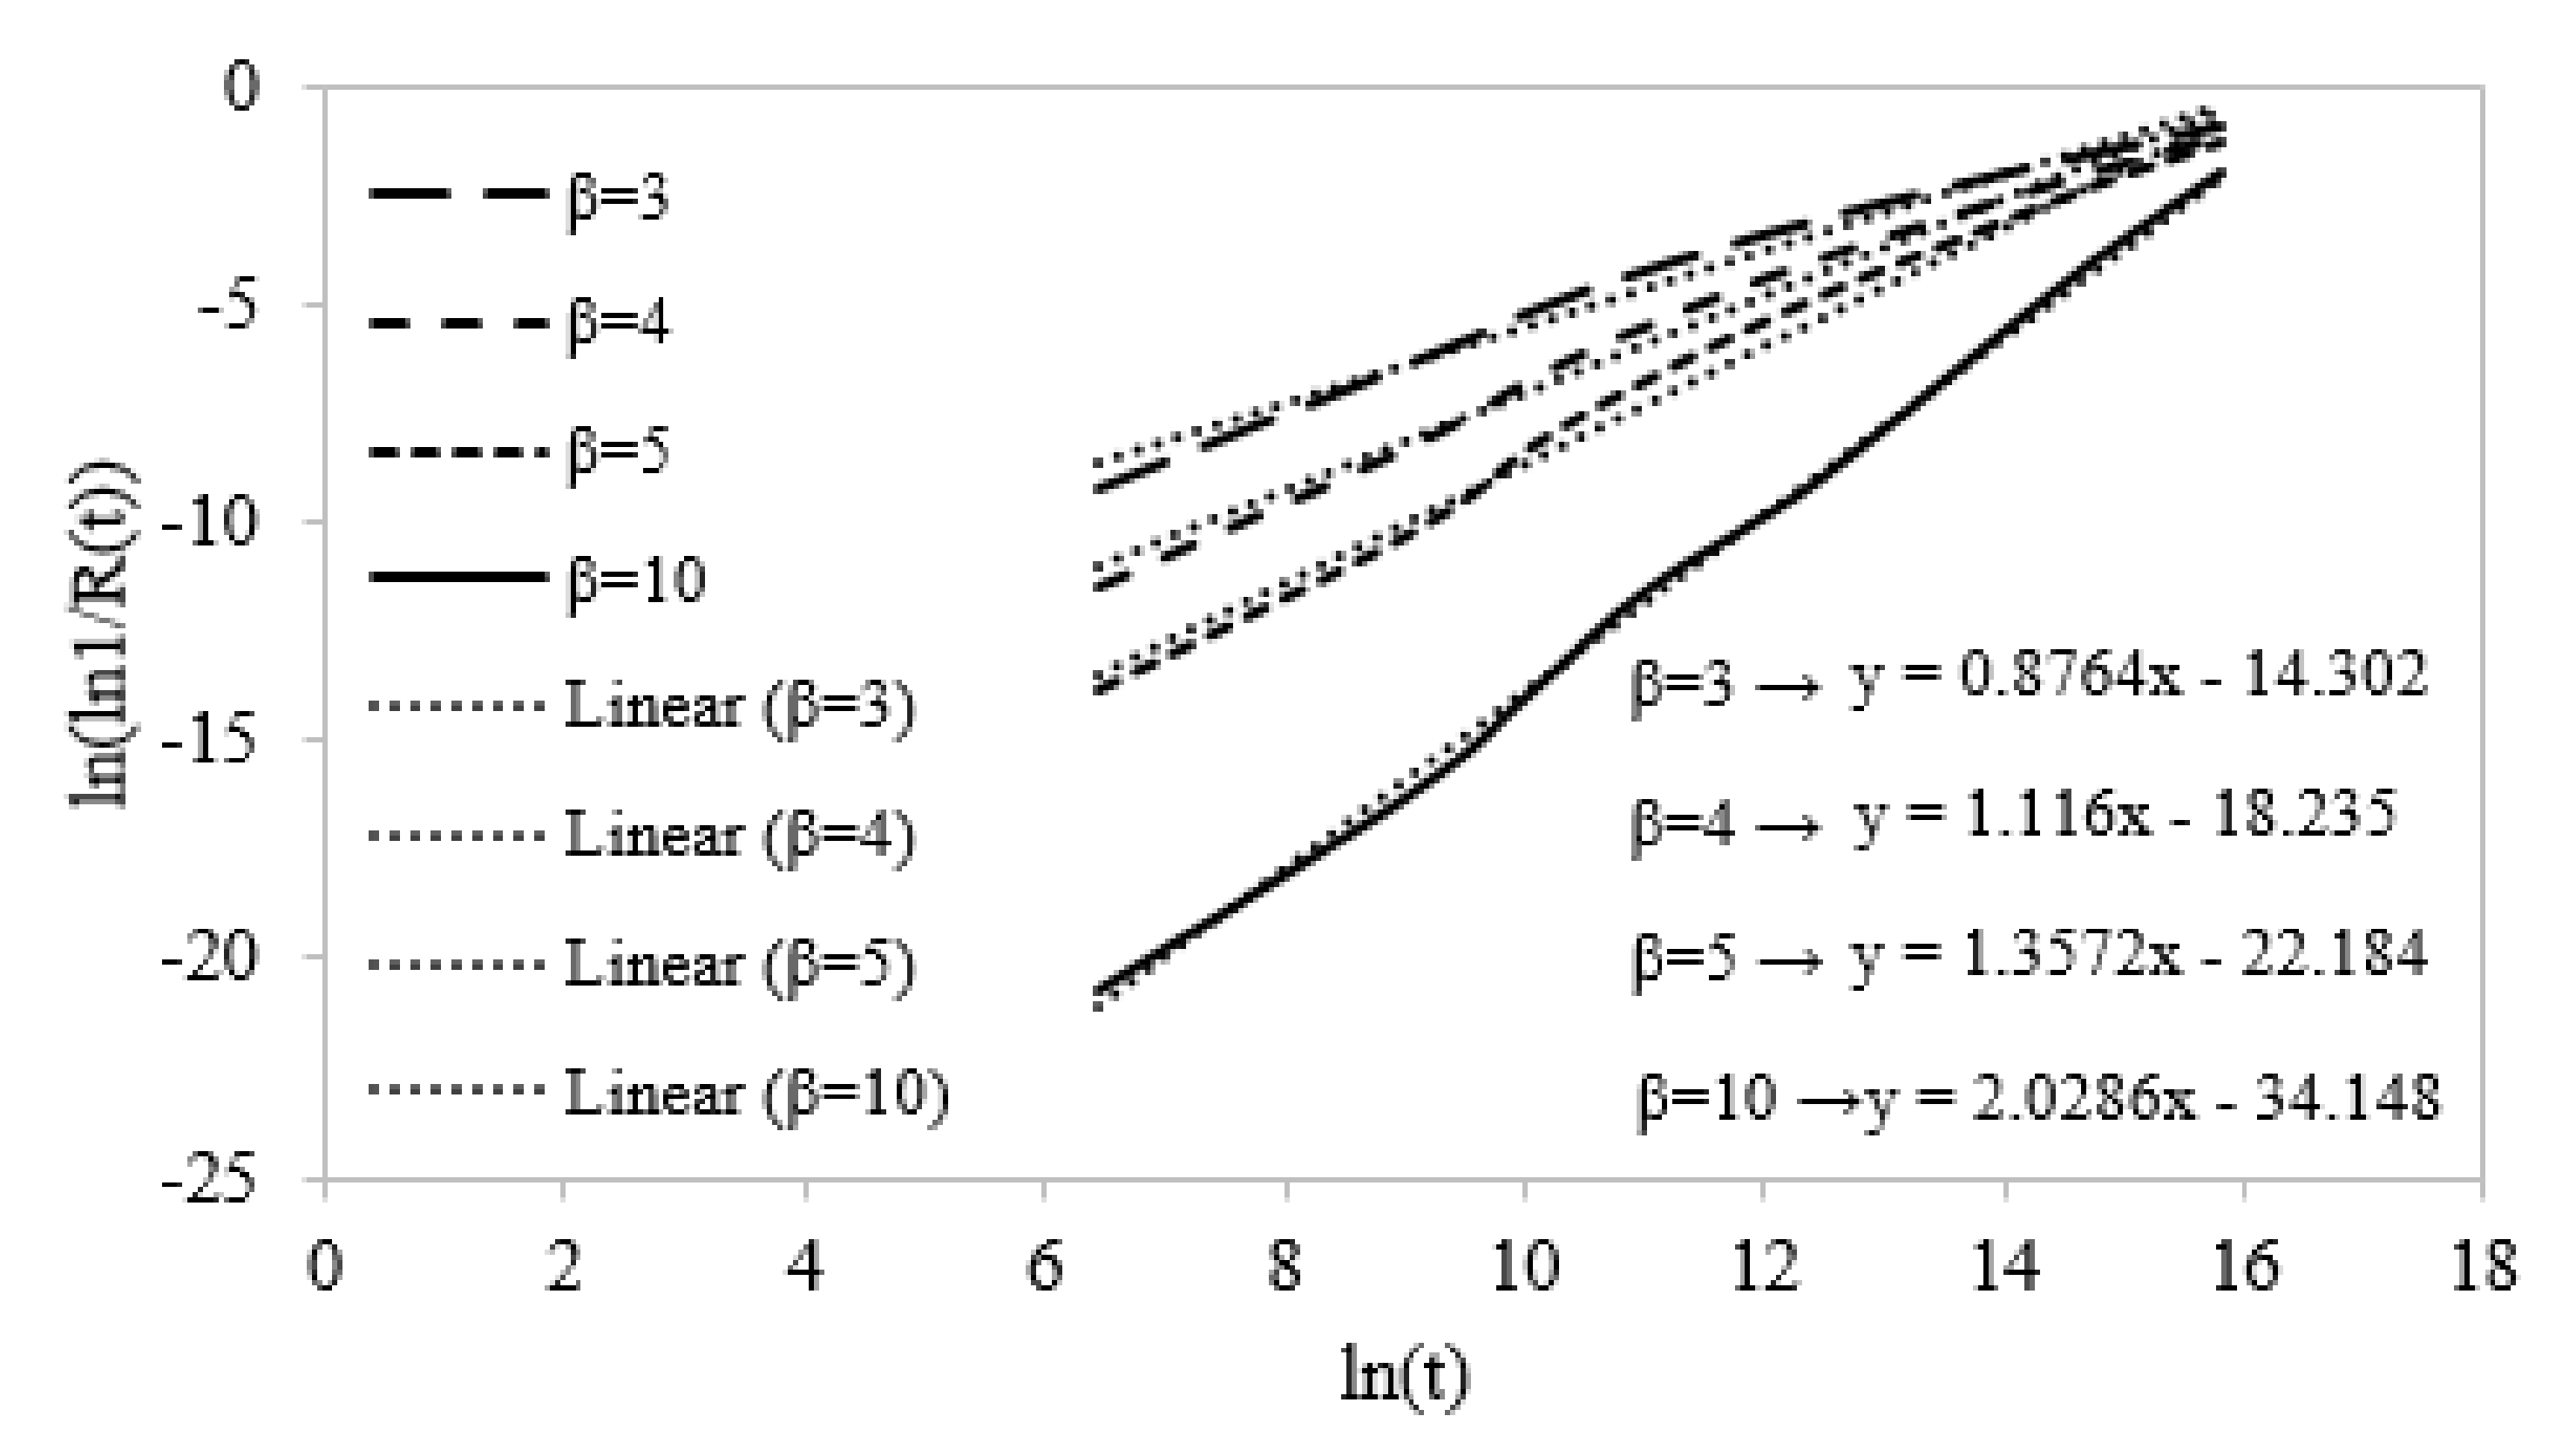
6.3. Distribution Fitting to Reliability Results
7. Conclusions and Future Work
- ○
- Casting simulation softwares such as MAGMASoft are capable of examining the effects of several factors such as temperature of molten metal, pouring time and velocity, gating and runner design, riser design, and mold configurations on the quality of castings.
- ○
- Testing of cast standard specimens is a practical approach to validate the quality of castings produced using simulation-based optimized mold designs.
- ○
- The simulations done in this work utilizes the porosity fractions which are defined over a volume that is large compared to microscopic pore geometry. The good agreement between measured and simulated fatigue lives confirms the adequate mesh used in life prediction with integrated porosity. Nevertheless, it can be expected that stress concentration around very small shrinkage pores can be modeled better with further mesh refinement, which consequently will require longer simulation time and more powerful computational facilities.
- ○
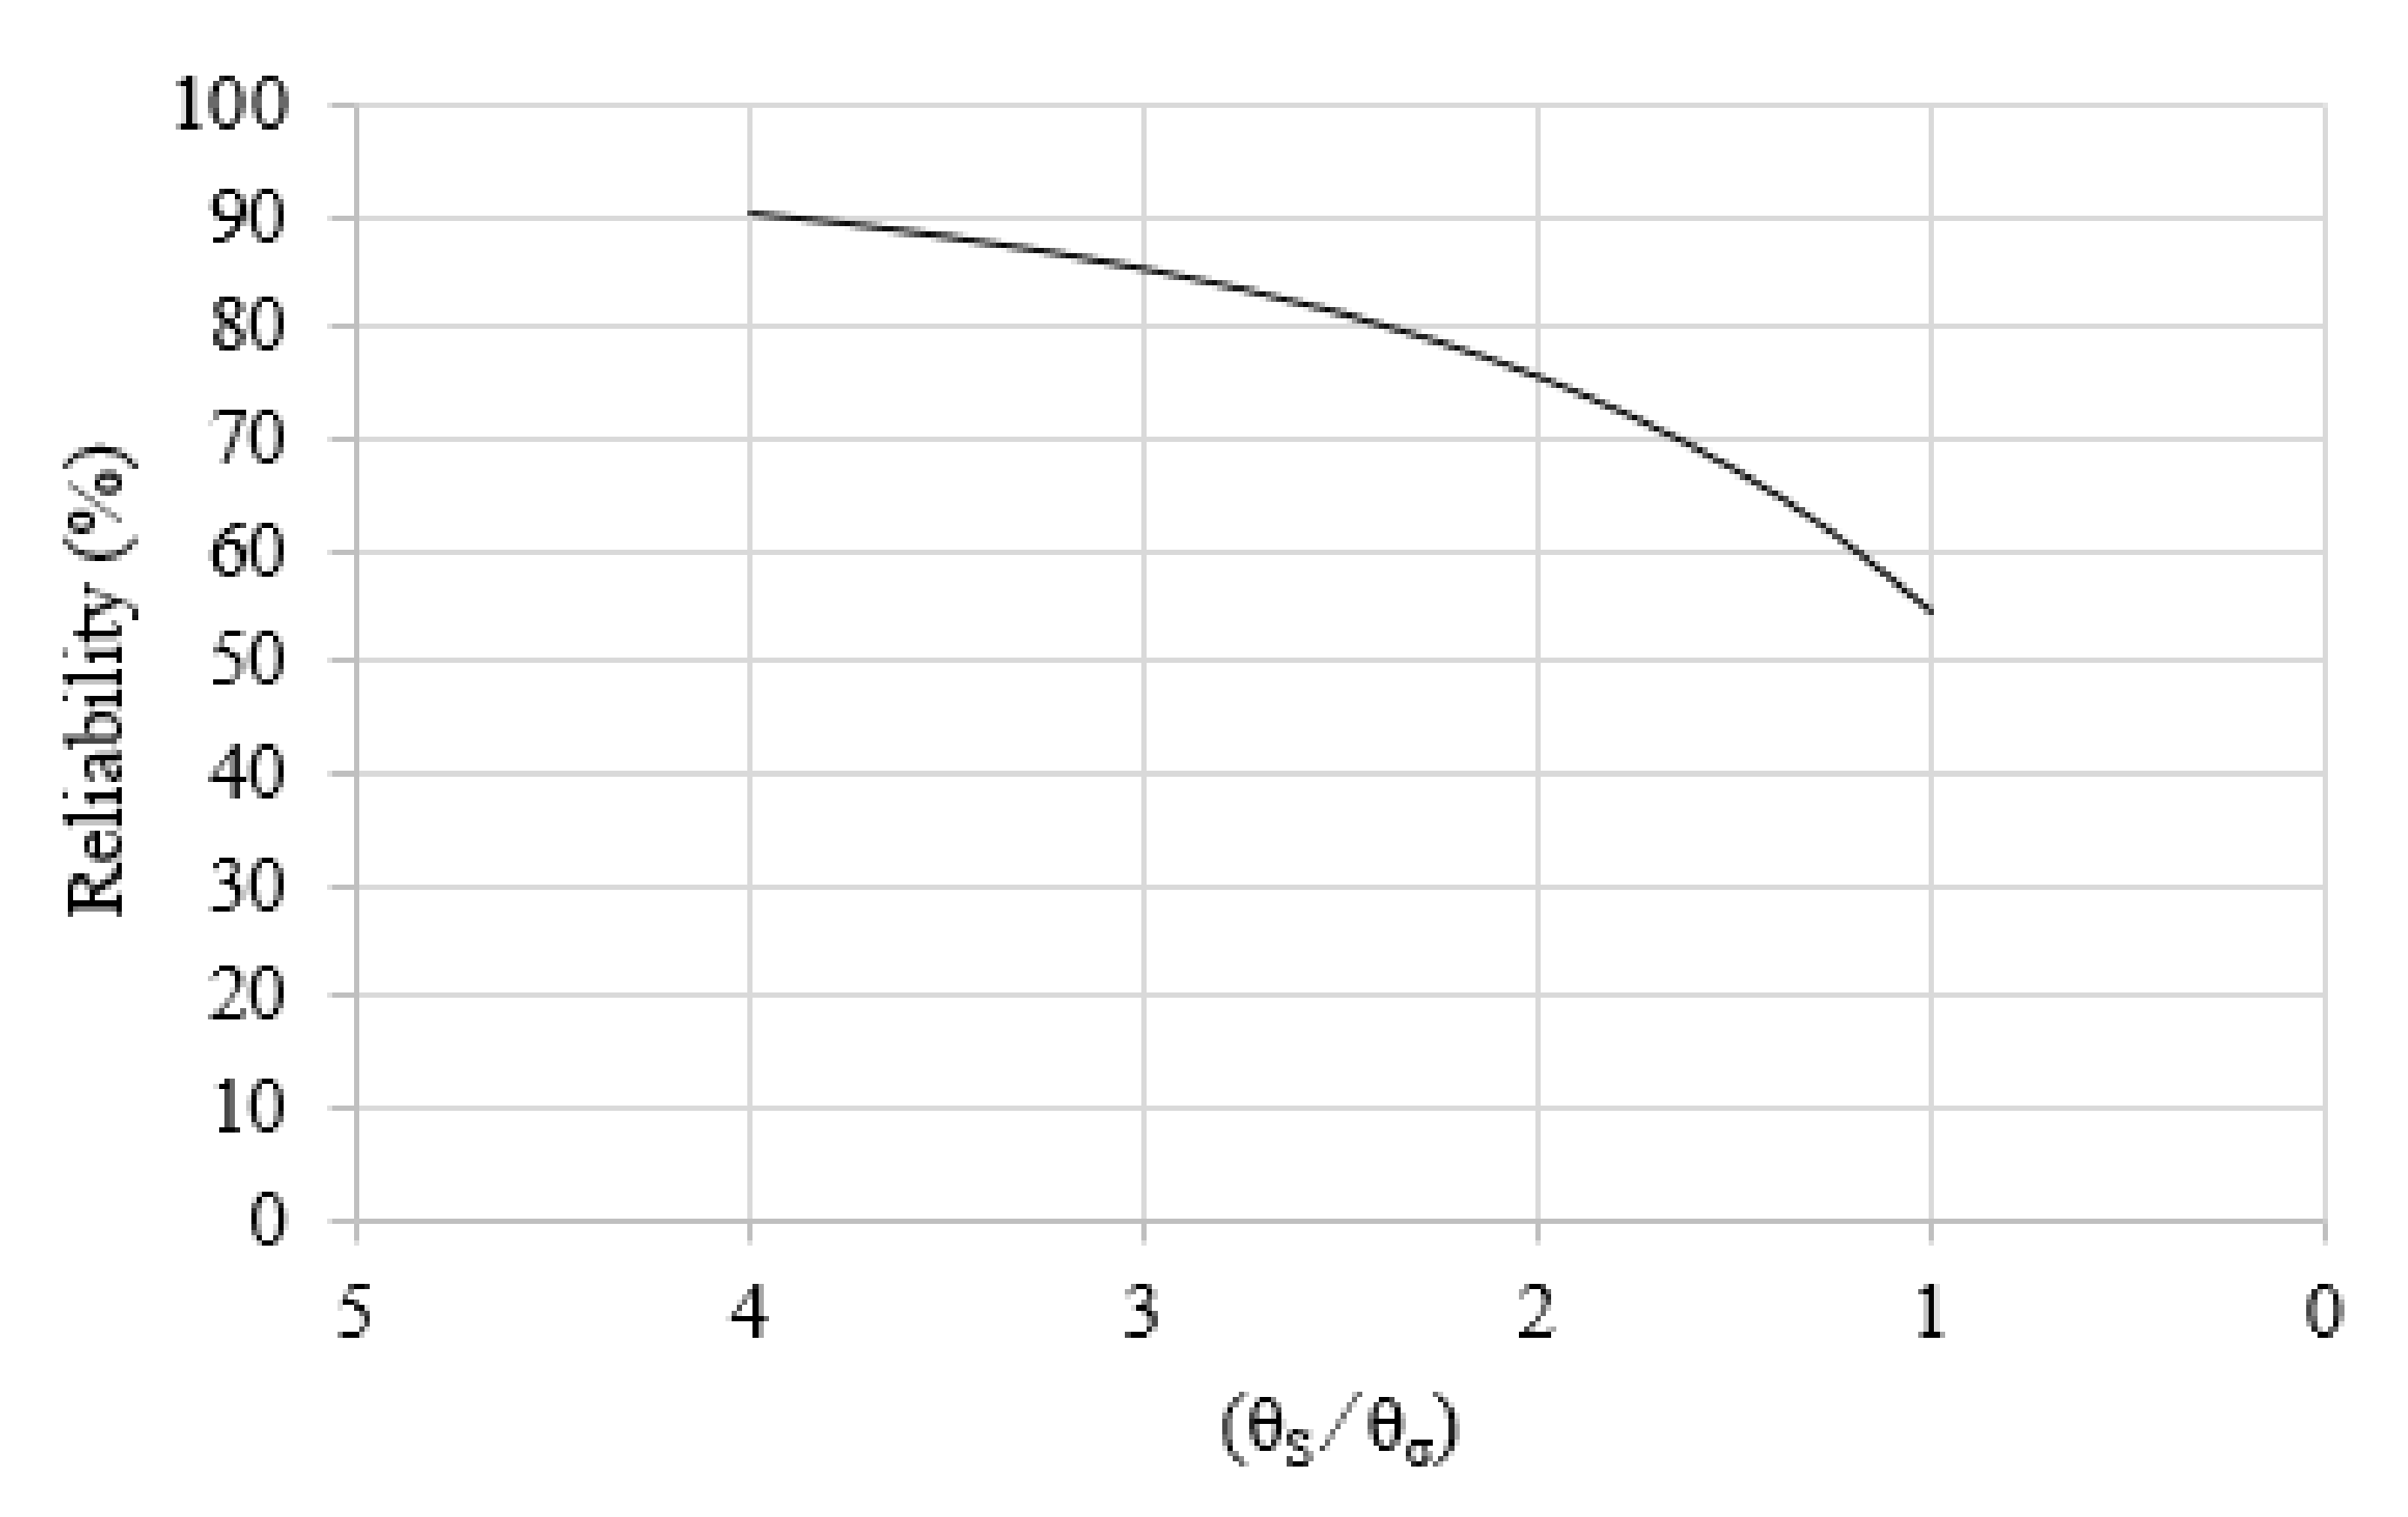
- The classical strength-stress interference theory provides realistic estimates reliability. It is concluded that the reliability for infinite life drops down with increasing load-induced stress. The overall results suggest 95 MPa as a safe stress to survive the cast steel parts for an infinite life.
- ○
- The methodology presented in this work can be applied to real cast parts. Besides cast steels, the methodology is deemed robust in cradle to grave analysis of cast parts produced with almost any alloy.
Author Contributions
Funding
Informed Consent Statement
Data Availability Statement
Acknowledgments
Conflicts of Interest
References
- Sheikh, A.K.; Khan, M.A.A. Mold Design Optimization and Quality Assessment of Steel Castings through Integrated Simulations and Experiments. J. Mech. Sci. Technol. 2020, 34, 2975–2983. [Google Scholar] [CrossRef]
- Khan, M.A.A.; Sheikh, A.K. A Comparative Study of Simulation Software for Modelling Metal Casting Processes. Int. J. Simul. Model. 2018, 17, 197–209. [Google Scholar] [CrossRef]
- Futáš, P.; Pribulová, A.; Fedorko, G.; Molnár, V.; Junáková, A.; Laskovský, V. Failure Analysis of a Railway Brake Disc with the Use of Casting Process Simulation. Eng. Fail. Anal. 2019, 95, 226–238. [Google Scholar] [CrossRef]
- Demler, E.; Götze, S.; Herbst, S.; Nürnberger, F.; Maier, H.J.; Ursinus, J.; Büdenbender, C.; Behrens, B.-A. Casting Manufacturing of Cylindrical Preforms Made of Low Alloy Steels. Procedia Manuf. 2020, 47, 445–449. [Google Scholar] [CrossRef]
- Lei, C.; Yang, Y.; Yang, G.; Huang, Y. Magma Software Simulation Assisted Optimization of the Casting System of Turbocharger Castings. Procedia Manuf. 2019, 37, 59–65. [Google Scholar] [CrossRef]
- Sunanda, A.; Jagannadha Raju, M.V. Simulation for Prediction Analysis of Defects in Pulley Casted Using Sand Casting Process. Mater. Today Proc. 2021; in press. [Google Scholar] [CrossRef]
- Kumar, R.; Madhu, S.; Aravindh, K.; Jayakumar, V.; Bharathiraja, G.; Muniappan, A. Casting Design and Simulation of Gating System in Rotary Adaptor Using Procast Software for Defect Minimization. Mater. Today Proc. 2020, 22, 799–805. [Google Scholar] [CrossRef]
- Sheikh, A.K.; Khan, M.A.A. Fatigue Life Prediction and Reliability Assessment of Ductile Iron Castings Using Optimized Mold Design. Int. J. Adv. Manuf. Technol. 2020, 106, 1945–1966. [Google Scholar] [CrossRef]
- Schmiedel, A.; Kirste, T.; Morgenstern, R.; Weidner, A.; Biermann, H. The Fatigue Life of 42CrMo4 Steel in the Range of HCF to VHCF at Elevated Temperatures up to 773 K. Int. J. Fatigue 2021, 152, 106437. [Google Scholar] [CrossRef]
- Foglio, E.; Gelfi, M.; Pola, A.; Goffelli, S.; Lusuardi, D. Fatigue Characterization and Optimization of the Production Process of Heavy Section Ductile Iron Castings. Int. J. Met. 2017, 11, 33–43. [Google Scholar] [CrossRef]
- Borsato, T.; Ferro, P.; Berto, F.; Carollo, C. Mechanical and Fatigue Properties of Pearlitic Ductile Iron Castings Characterized by Long Solidification Times. Eng. Fail. Anal. 2017, 79, 902–912. [Google Scholar] [CrossRef]
- Hattel, J. Fundamentals of Numerical Modelling of Casting Processes; Polyteknisk Forlag: Kongens Lyngby, Denmark, 2005; ISBN 978-87-502-0969-0. Available online: https://orbit.dtu.dk/en/publications/fundamentals-of-numerical-modelling-of-casting-processes (accessed on 12 November 2021).
- Egner-Walter, A.; Kothen, M. Using Stress Simulation to Tackle Distortion and Cracking in Castings. Metall. Sci. Tecnol. 2013, 24. Available online: http://78.47.113.247/index.php/MST/article/view/1122 (accessed on 12 November 2021).
- ASTM E466-15 Standard Practice for Conducting Force Controlled Constant Amplitude Axial Fatigue Tests of Metallic Materials. 2015. Available online: https://ci.nii.ac.jp/naid/10017283294/ (accessed on 12 November 2021).
- Dassault Systems UK Limited Fe-Safe User Manual, 2015.
- Khan, M.A.A. Development of a Simulation-Based Methodology for Mold Design Optimization and Reliability Assessment of Cast Parts-KFUPM EPrints; King Fahd University of Petroleum and Minerals: Dhahran, Saudi Arabia, 2018. [Google Scholar]
- Hardin, R.A.; Beckermann, C. Prediction of the Fatigue Life of Cast Steel Containing Shrinkage Porosity. Metall. Mater. Trans. A 2009, 40, 581–597. [Google Scholar] [CrossRef] [Green Version]
- Hardin, R.A.; Beckermann, C. Integrated Design of Castings: Effect of Porosity on Mechanical Performance. IOP Conf. Ser. Mater. Sci. Eng. 2012, 33, 012069. [Google Scholar] [CrossRef] [Green Version]
- Kapur, K.C.; Lamberson, L.R. Reliability in Engineering Design; Wiley: Hoboken, NJ, USA, 1977; ISBN 978-0-471-51191-5. Available online: https://ui.adsabs.harvard.edu/abs/1977nyjw.book.....K/abstract (accessed on 12 November 2021).
- Samar Ali, S.; Kannan, S. A Diagnostic Approach to Weibull-Weibull Stress-strength Model and Its Generalization. Int. J. Qual. Reliab. Manag. 2011, 28, 451–463. [Google Scholar] [CrossRef]


| Chemical Composition (Wt.%) | |||||||||
|---|---|---|---|---|---|---|---|---|---|
| Fe | C | Mn | Si | P | S | Ni | Cr | Mo | Cu |
| 96.2 | 0.3 | 1 | 0.6 | 0.035 | 0.35 | 0.5 | 0.5 | 0.2 | 0.3 |
| Mechanical Properties (at room temperature as per ASTM A216) | |||||||||
| Yield Strength (MPa) | Tensile Strength (MPa) | Elongation (%) | |||||||
| 248 | 485 | 22 | |||||||
| Mold Material | Furan |
|---|---|
| Base Materials | Silica Sand |
| Binder | Furan |
| Water Content | 0% |
| Initial Temperature | 20 °C |
| Erosion Properties | |
| Reference Velocity | 3 m/s |
| Reference Time | 6 s |
| Sand Inclusion Parameters | |
| Sand grain diameter | 240 µm |
| Sand grain density | 2650 kg/m3 |
| Specimen ID | Stress Applied for Test (MPa) | Frequency (Hz) | Fatigue Life (Cycles) |
|---|---|---|---|
| S1′ | 326 | 5 | 62 |
| S2′ | 244 | 5 | 6545 |
| S3′ | 204 | 5 | 20,561 |
| S4′ | 163 | 5 | 56,893 |
| S5′ | 122 | 5 | 145,089 |
| S6′ | 81 | 5 | 535,564 |
| S7′ | 41 | 5 | 3,061,195 |
| ASTM A216 WCB Monotonic Properties | ||
| Ultimate Tensile Strength, | (MPa) | 620 |
| Yield Strength, | (MPa) | 355 |
| Modulus of Elasticity, | (MPa) | 198,000 |
| Percentage Elongation, %EL | - | 32.5 |
| Fracture strength, | (MPa) | 293 |
| ASTM A216 WCB Cyclic Properties | ||
| Fatigue Strength, | (MPa) | 141 |
| 0.227 | ||
| Cyclic Strain Hardening Coefficient, | (MPa) | 1558 |
| Cyclic Strain Hardening Exponent, | 0.295 | |
| Fatigue Strength Coefficient, | (MPa) | 1015 |
| Fatigue Strength Exponent, | −0.136 | |
| Fatigue Ductility Coefficient, | 0.195 | |
| Fatigue Ductility Exponent, | −0.435 | |
| Specimen ID | Simulated Stress (MPa) | Measured Fatigue Life (Cycles) | Simulated Fatigue Life (Cycle) |
|---|---|---|---|
| S1′ | 469.32 | 62 | 630 |
| S2′ | 364.43 | 6545 | 9115 |
| S3′ | 289.68 | 20,561 | 24,219 |
| S4′ | 235.20 | 56,893 | 62,983 |
| S5′ | 173.66 | 145,089 | 259,682 |
| S6′ | 116.41 | 535,564 | 2,133,921 |
| S7′ | 57.50 | 3,061,195 | 7,421,449 |
| Weibull Shape Parameter for Reliability Estimate | Log-Normal Distribution Parameters | |
|---|---|---|
| µ | σ | |
| β = 3 | 17.19 | 2.84 |
| β = 4 | 17.50 | 2.50 |
| β = 5 | 17.72 | 2.27 |
| β = 10 | 18.91 | 1.93 |
| Weibull Shape Parameter for Reliability Estimate | Weibull Distribution Parameters | |
|---|---|---|
| β | θ | |
| β = 3 | 0.876 | 15,464,922 |
| β = 4 | 1.116 | 13,564,126 |
| β = 5 | 1.357 | 12,178,806 |
| β = 10 | 2.082 | 100,931,406 |
Publisher’s Note: MDPI stays neutral with regard to jurisdictional claims in published maps and institutional affiliations. |
© 2022 by the authors. Licensee MDPI, Basel, Switzerland. This article is an open access article distributed under the terms and conditions of the Creative Commons Attribution (CC BY) license (https://creativecommons.org/licenses/by/4.0/).
Share and Cite
Khan, M.A.A.; Sheikh, A.K.; Gasem, Z.M.; Asad, M. Fatigue Life and Reliability of Steel Castings through Integrated Simulations and Experiments. Metals 2022, 12, 339. https://doi.org/10.3390/met12020339
Khan MAA, Sheikh AK, Gasem ZM, Asad M. Fatigue Life and Reliability of Steel Castings through Integrated Simulations and Experiments. Metals. 2022; 12(2):339. https://doi.org/10.3390/met12020339
Chicago/Turabian StyleKhan, Muhammad Azhar Ali, Anwar Khalil Sheikh, Zuhair Mattoug Gasem, and Muhammad Asad. 2022. "Fatigue Life and Reliability of Steel Castings through Integrated Simulations and Experiments" Metals 12, no. 2: 339. https://doi.org/10.3390/met12020339
APA StyleKhan, M. A. A., Sheikh, A. K., Gasem, Z. M., & Asad, M. (2022). Fatigue Life and Reliability of Steel Castings through Integrated Simulations and Experiments. Metals, 12(2), 339. https://doi.org/10.3390/met12020339