
Effect of Microstructure on Low-Temperature Fracture Toughness of a Submerged-Arc-Welded Low-Carbon and Low-Alloy Steel Plate

 , , , ,
  and
and
Abstract
:1. Introduction
2. Experimental Section
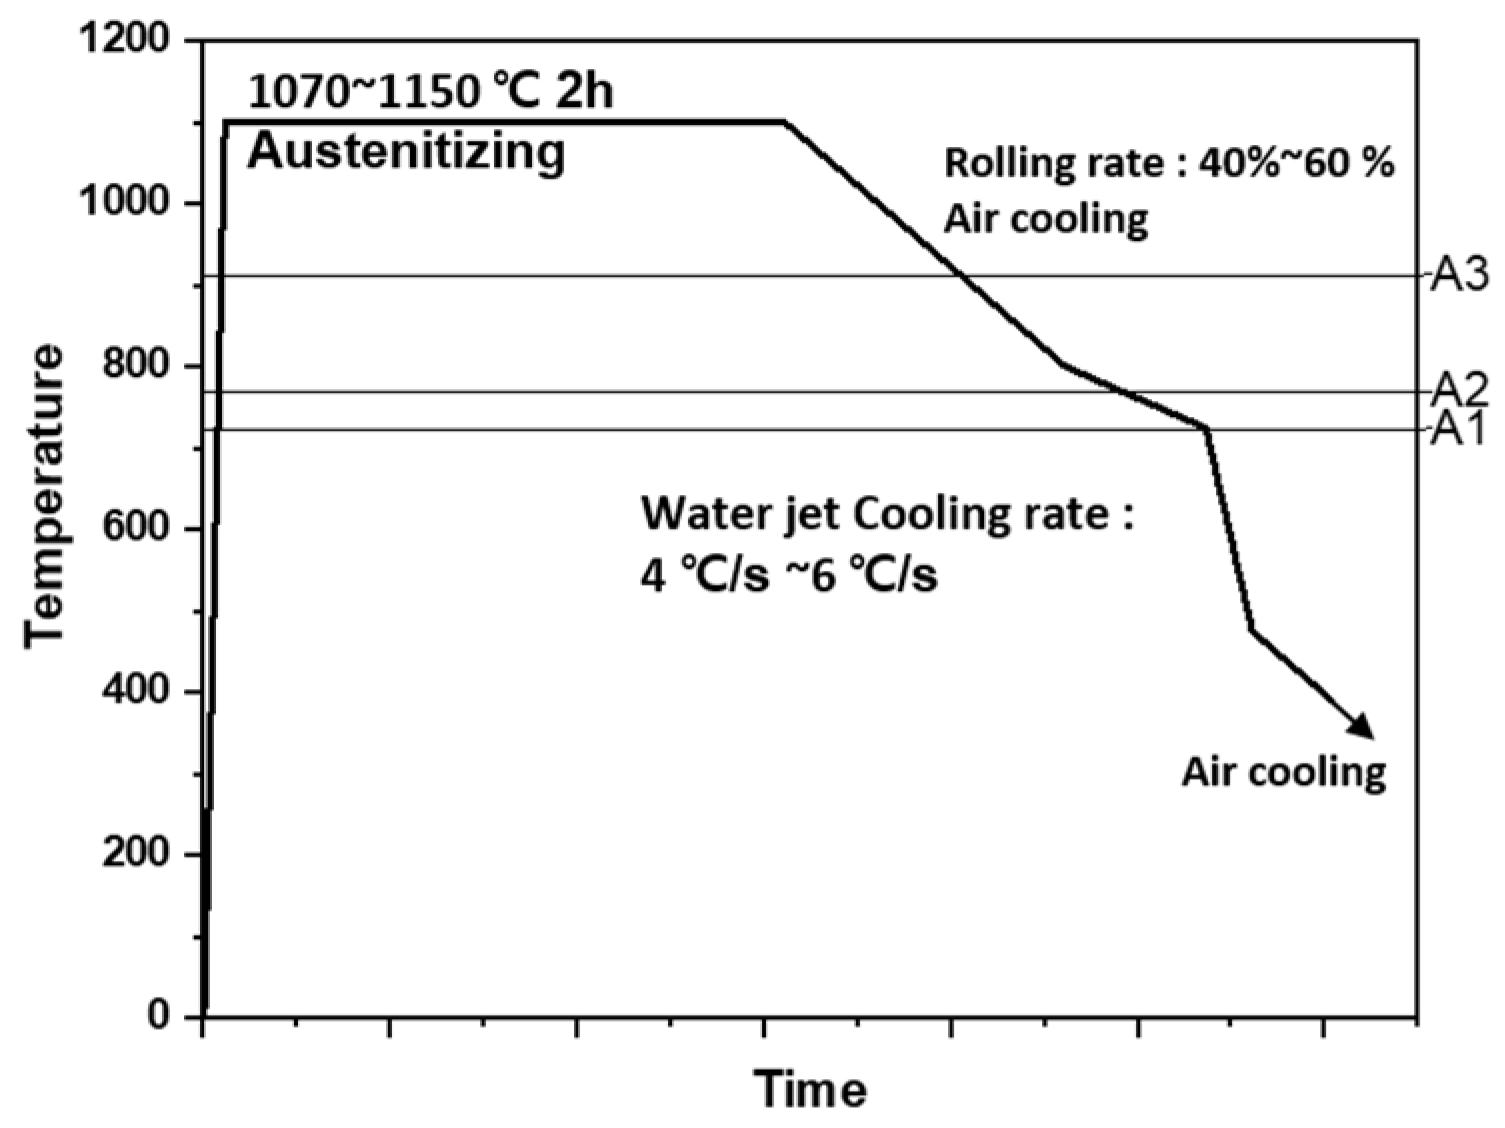
2.1. Material
2.2. Submerged Arc Welding (SAW)
2.3. Microstructure
2.4. Charpy Impact Testing
3. Result and Discussion
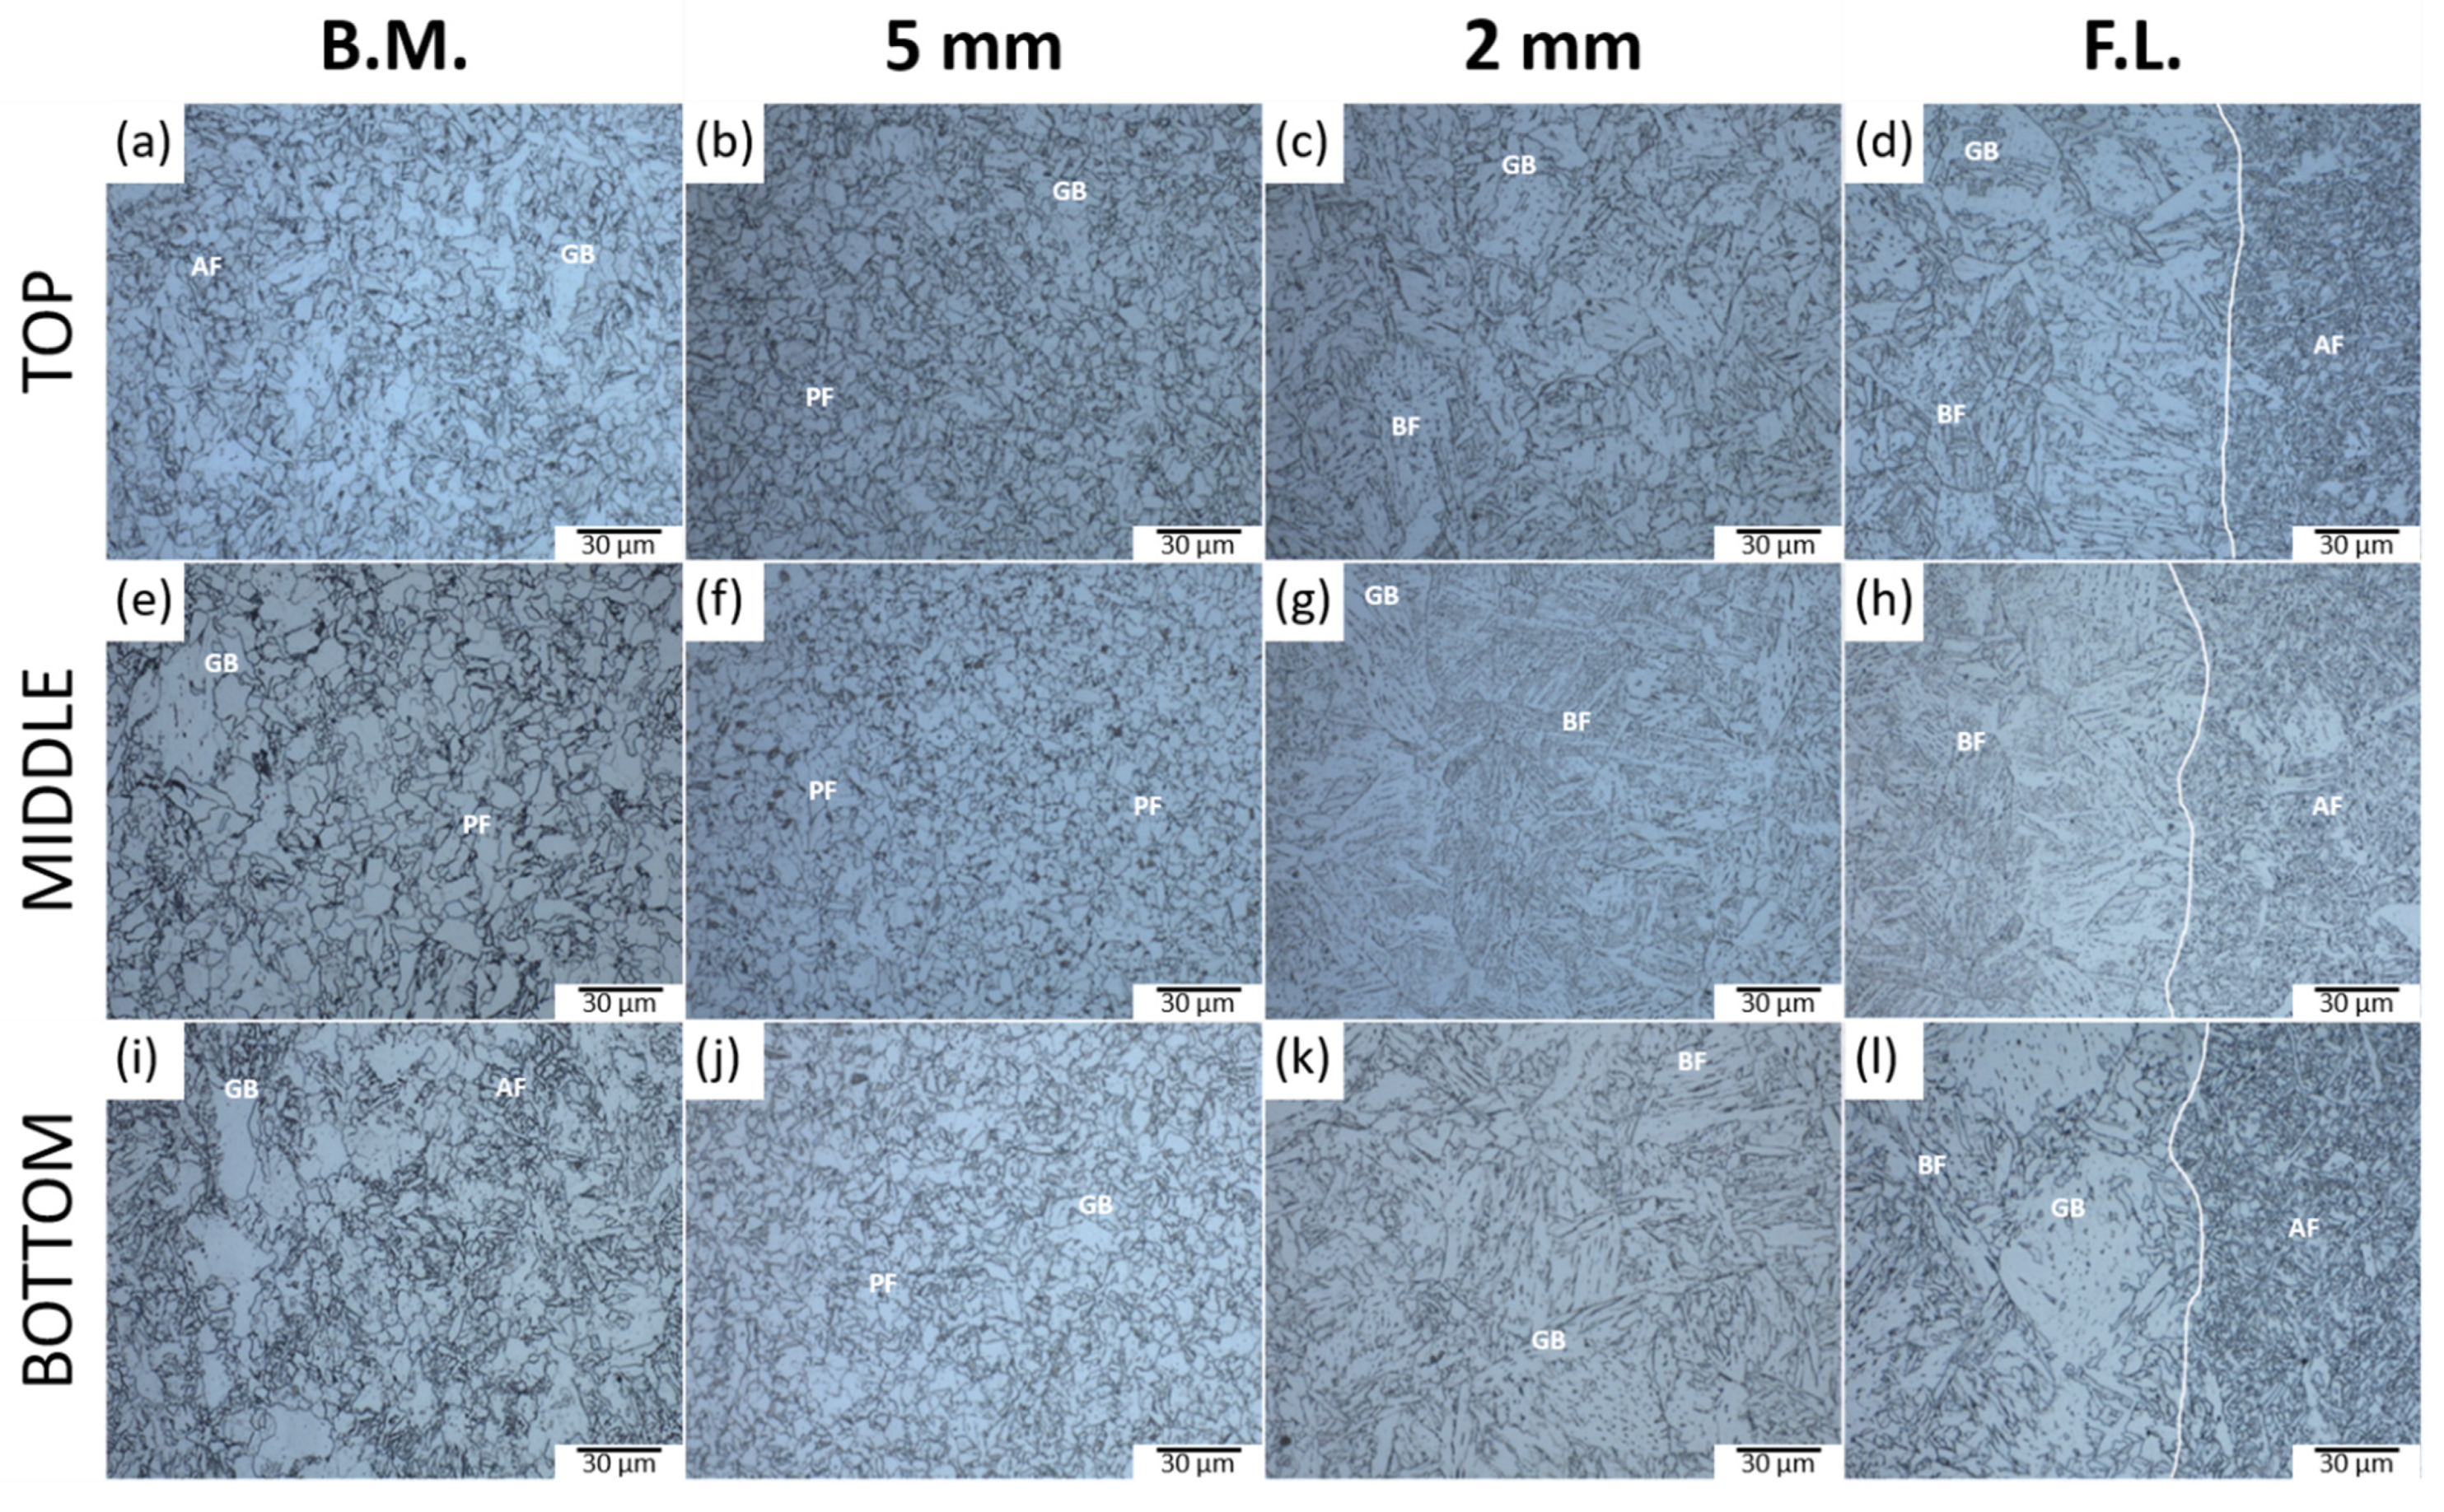
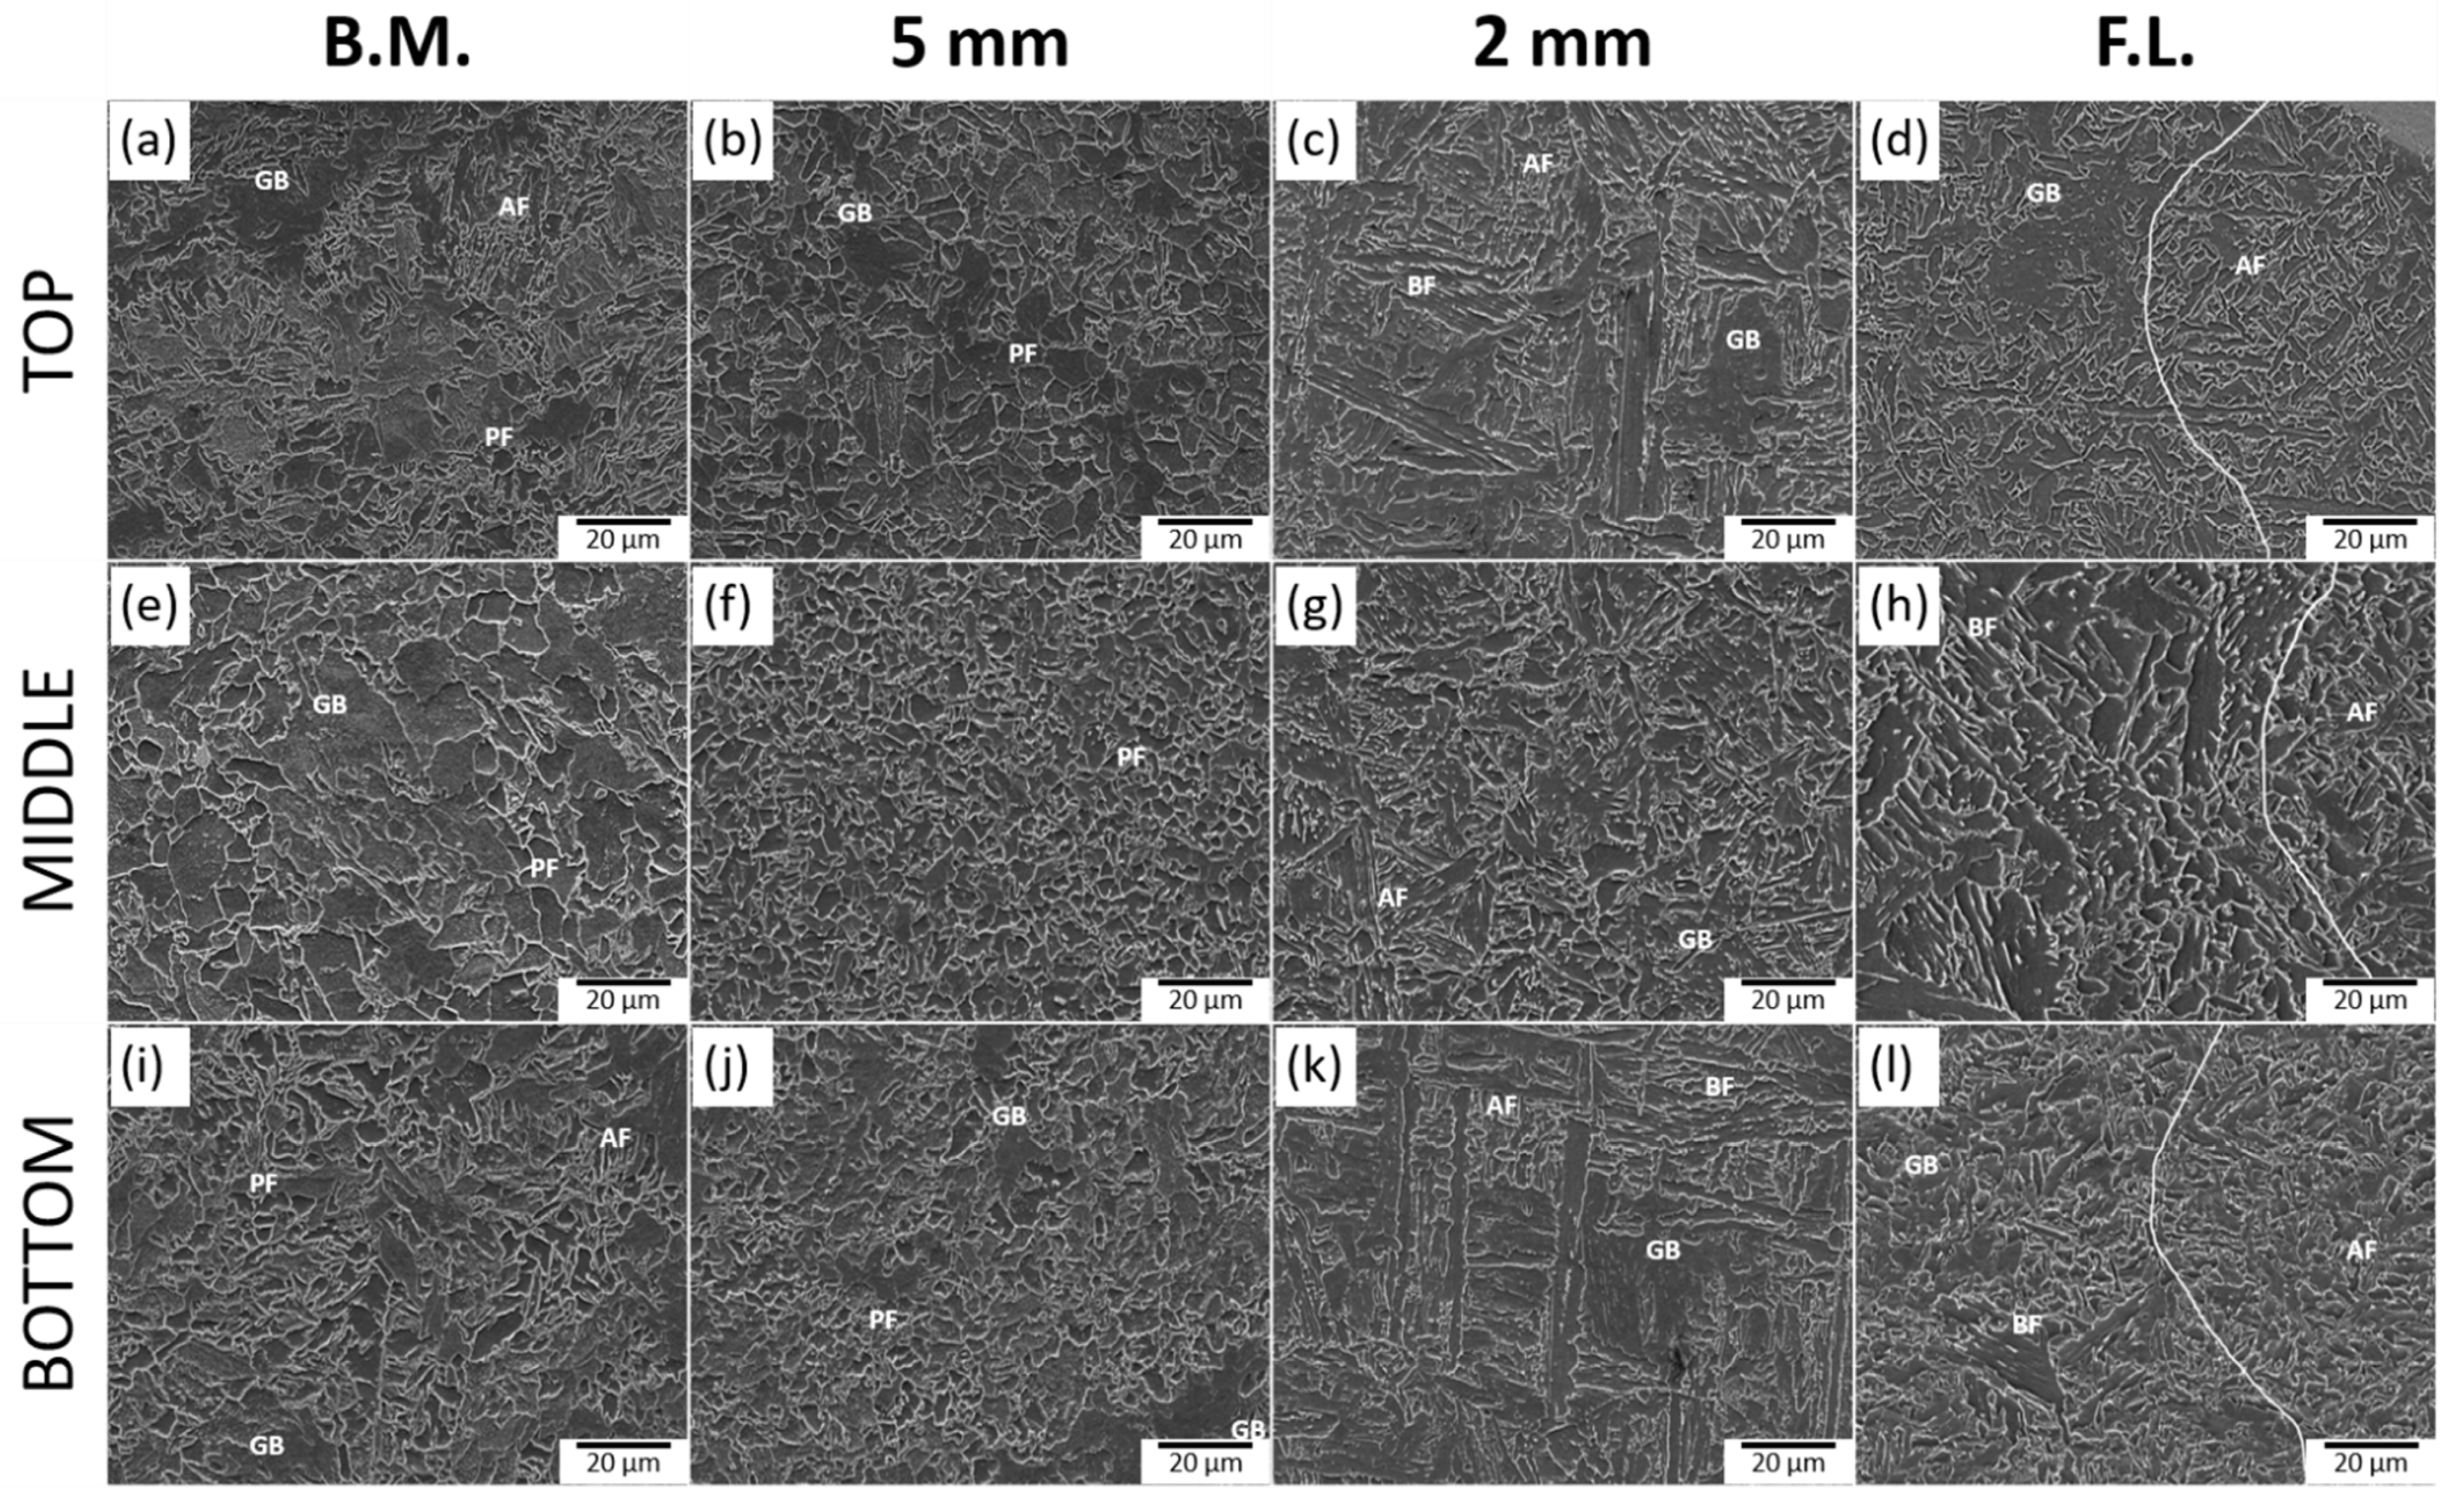
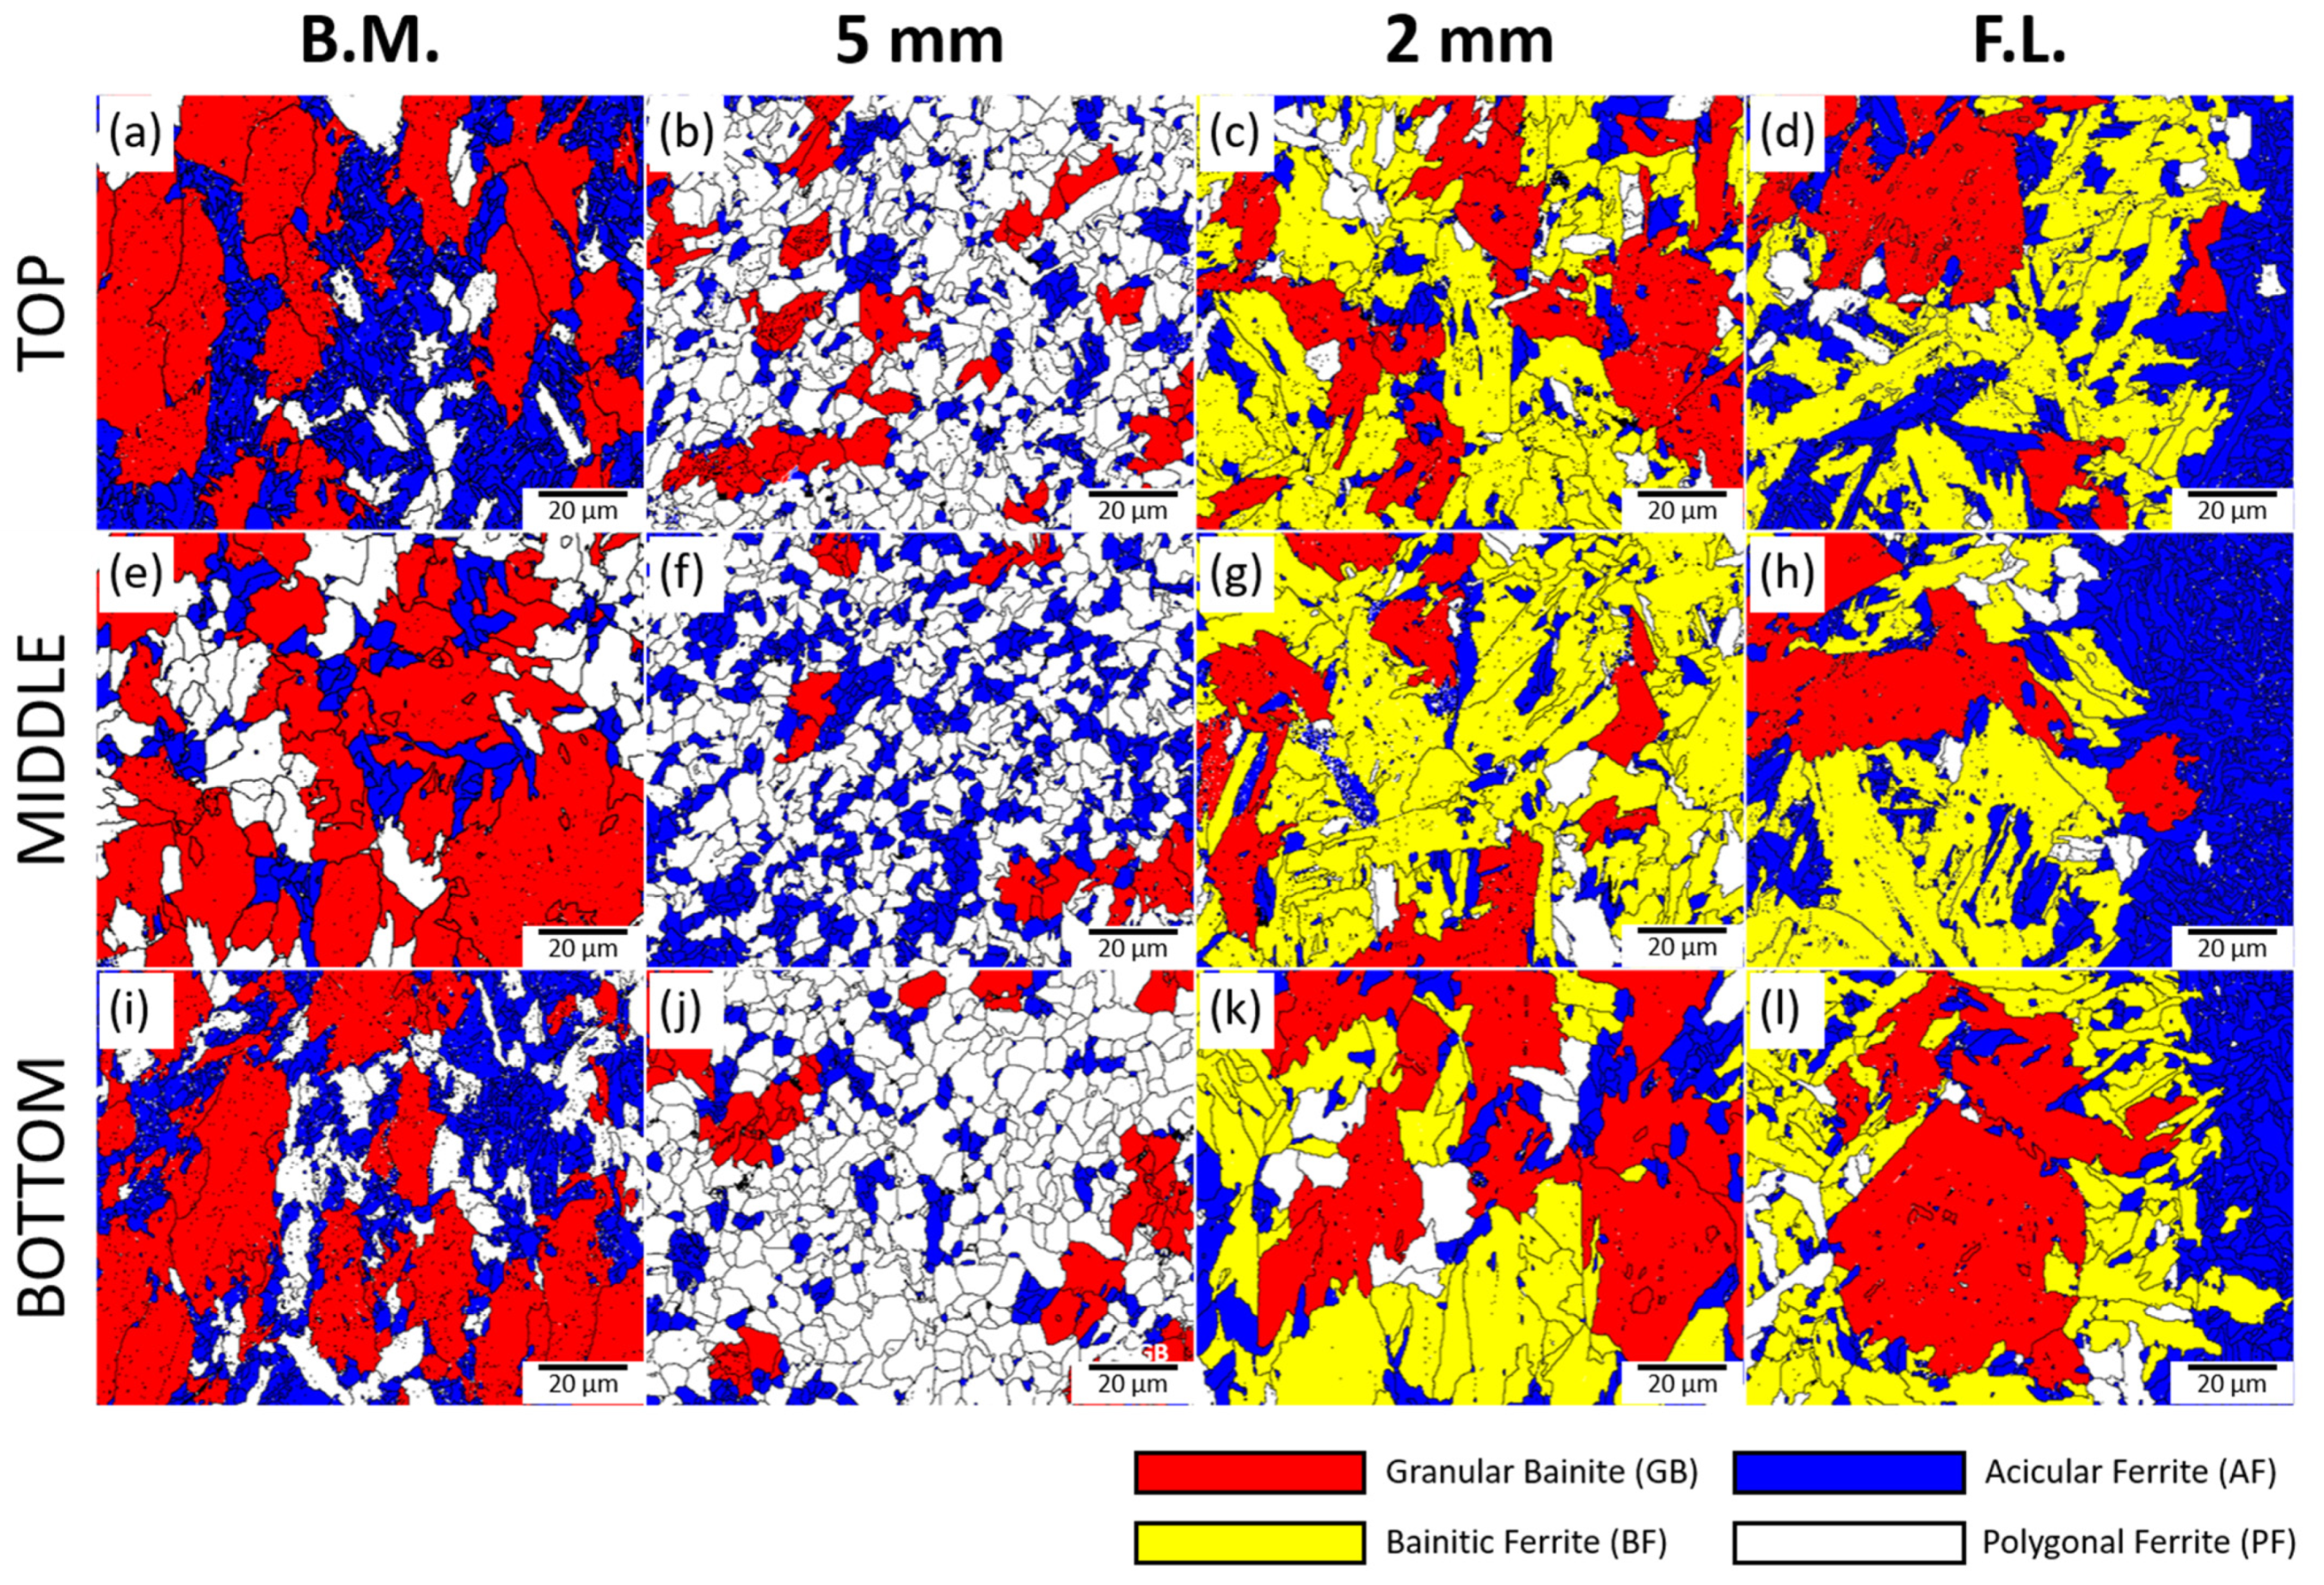
3.1. Microstructure of the Base Metal, HAZ, and Weld
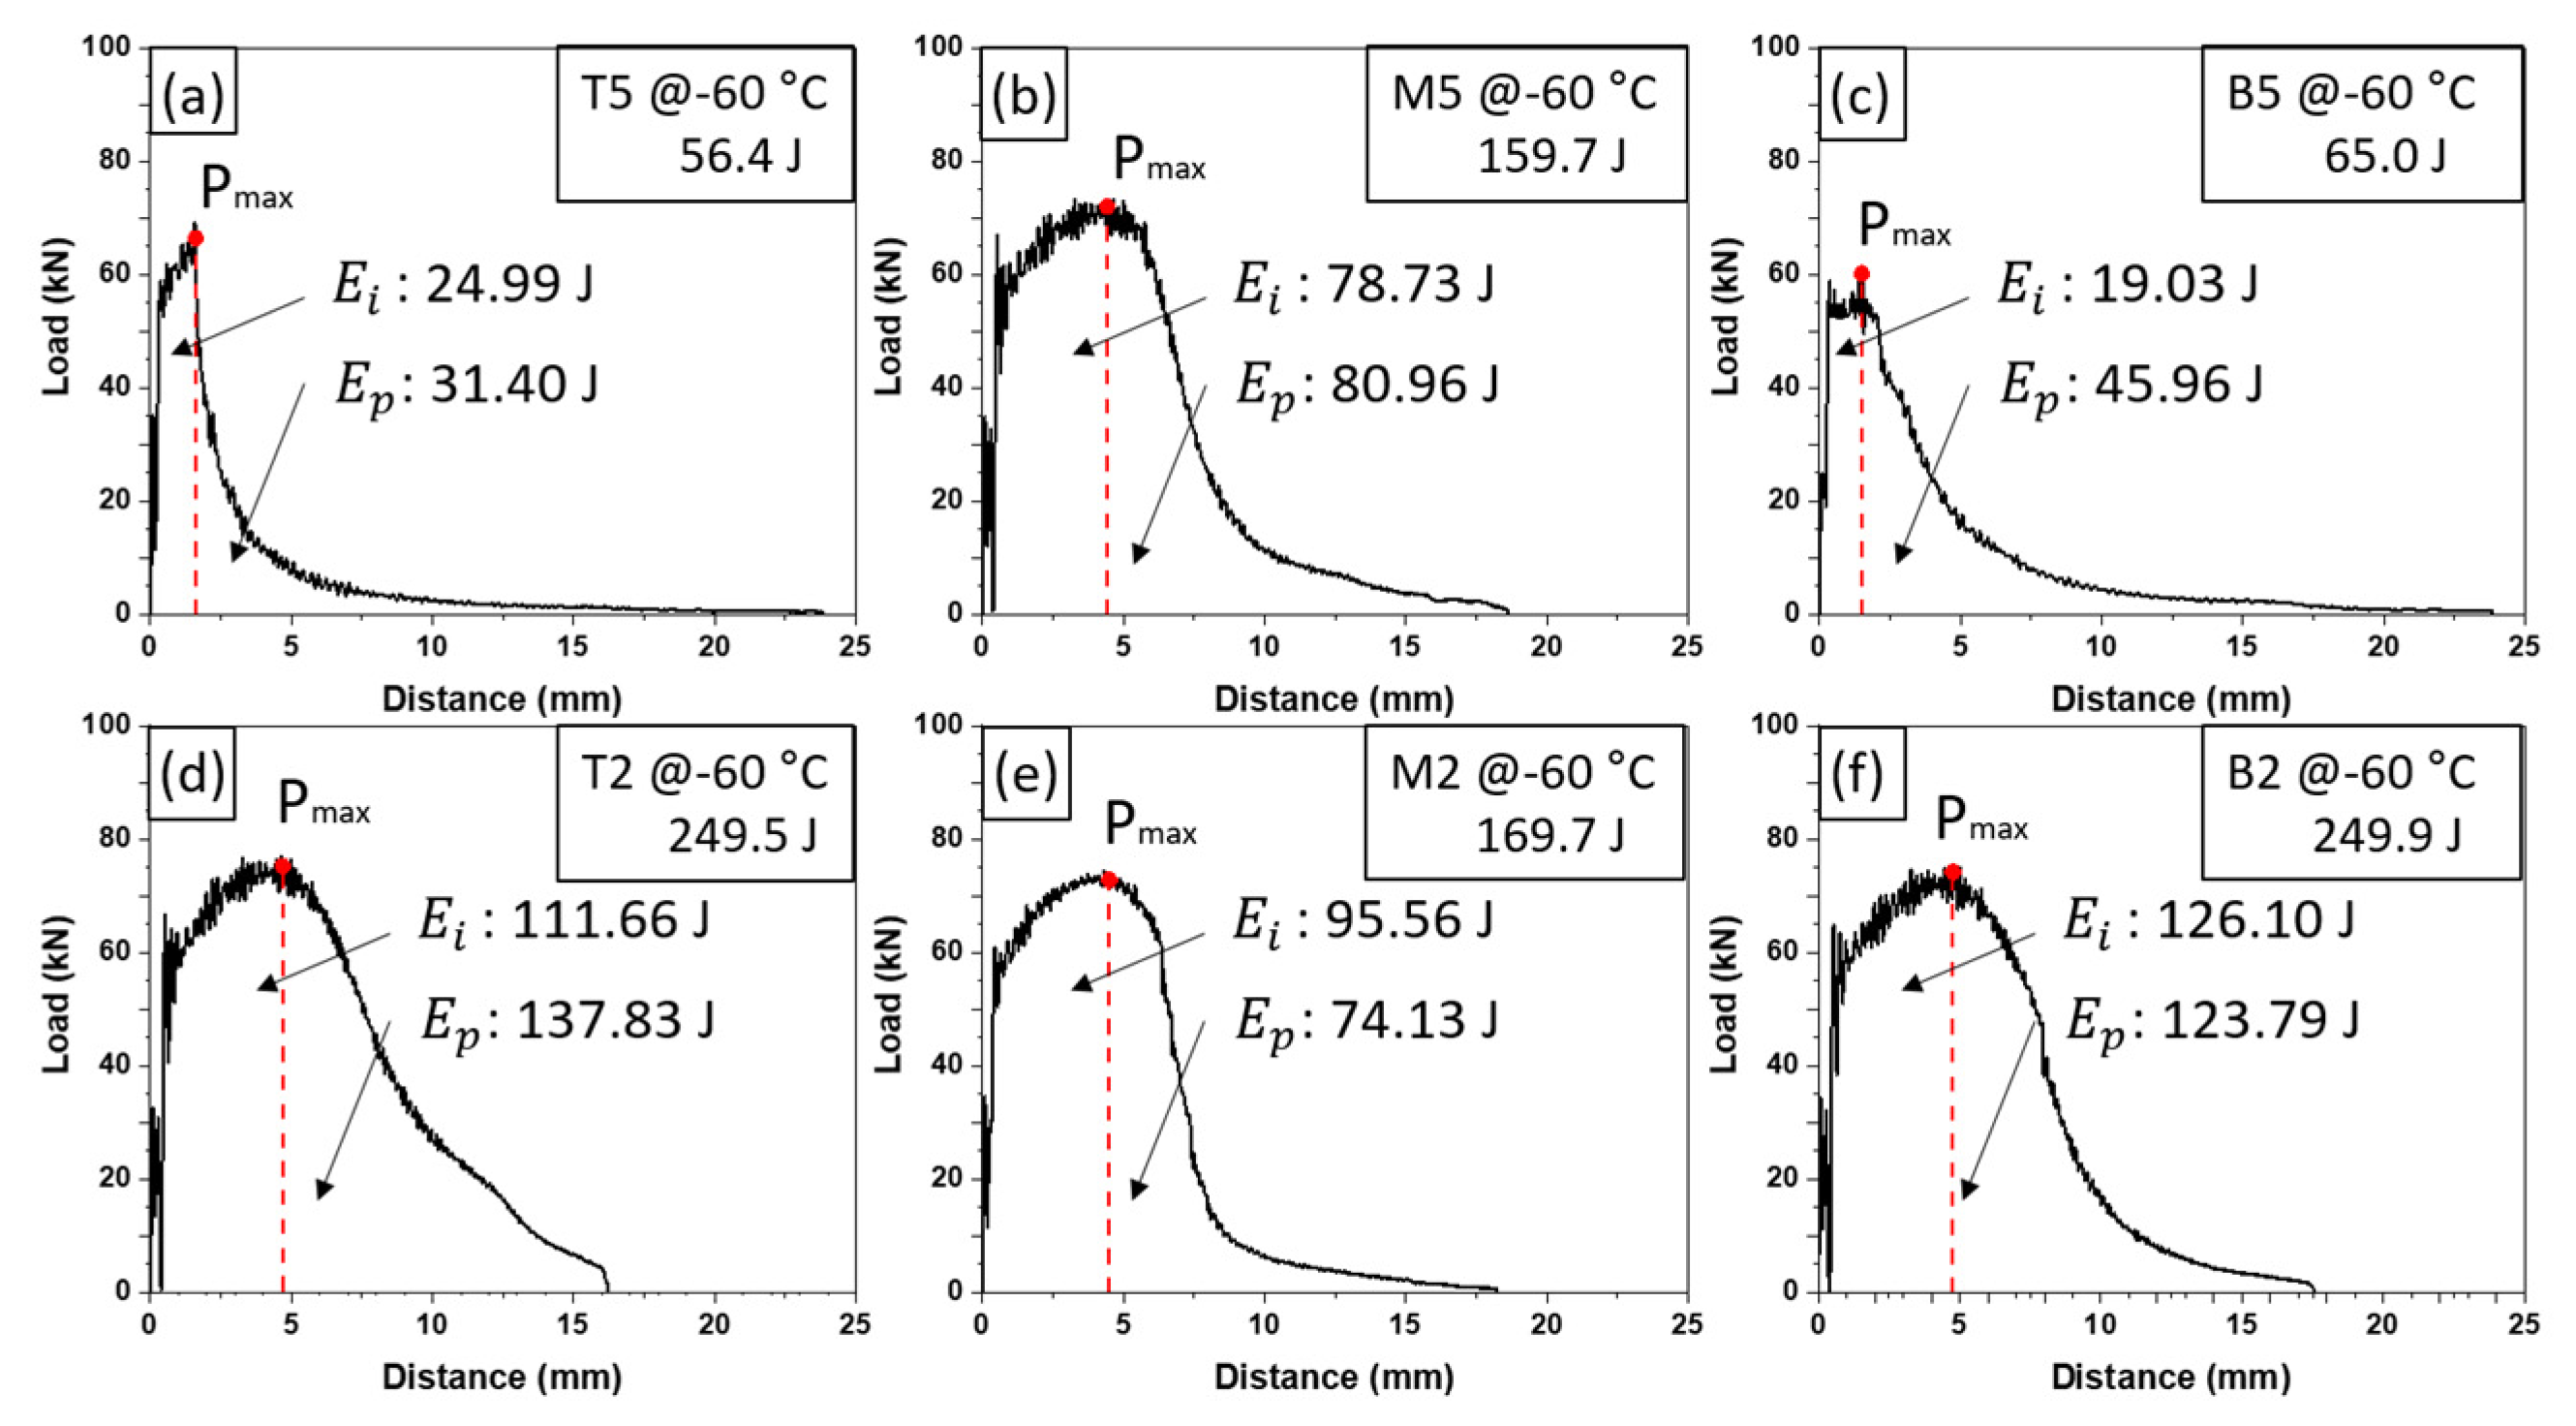
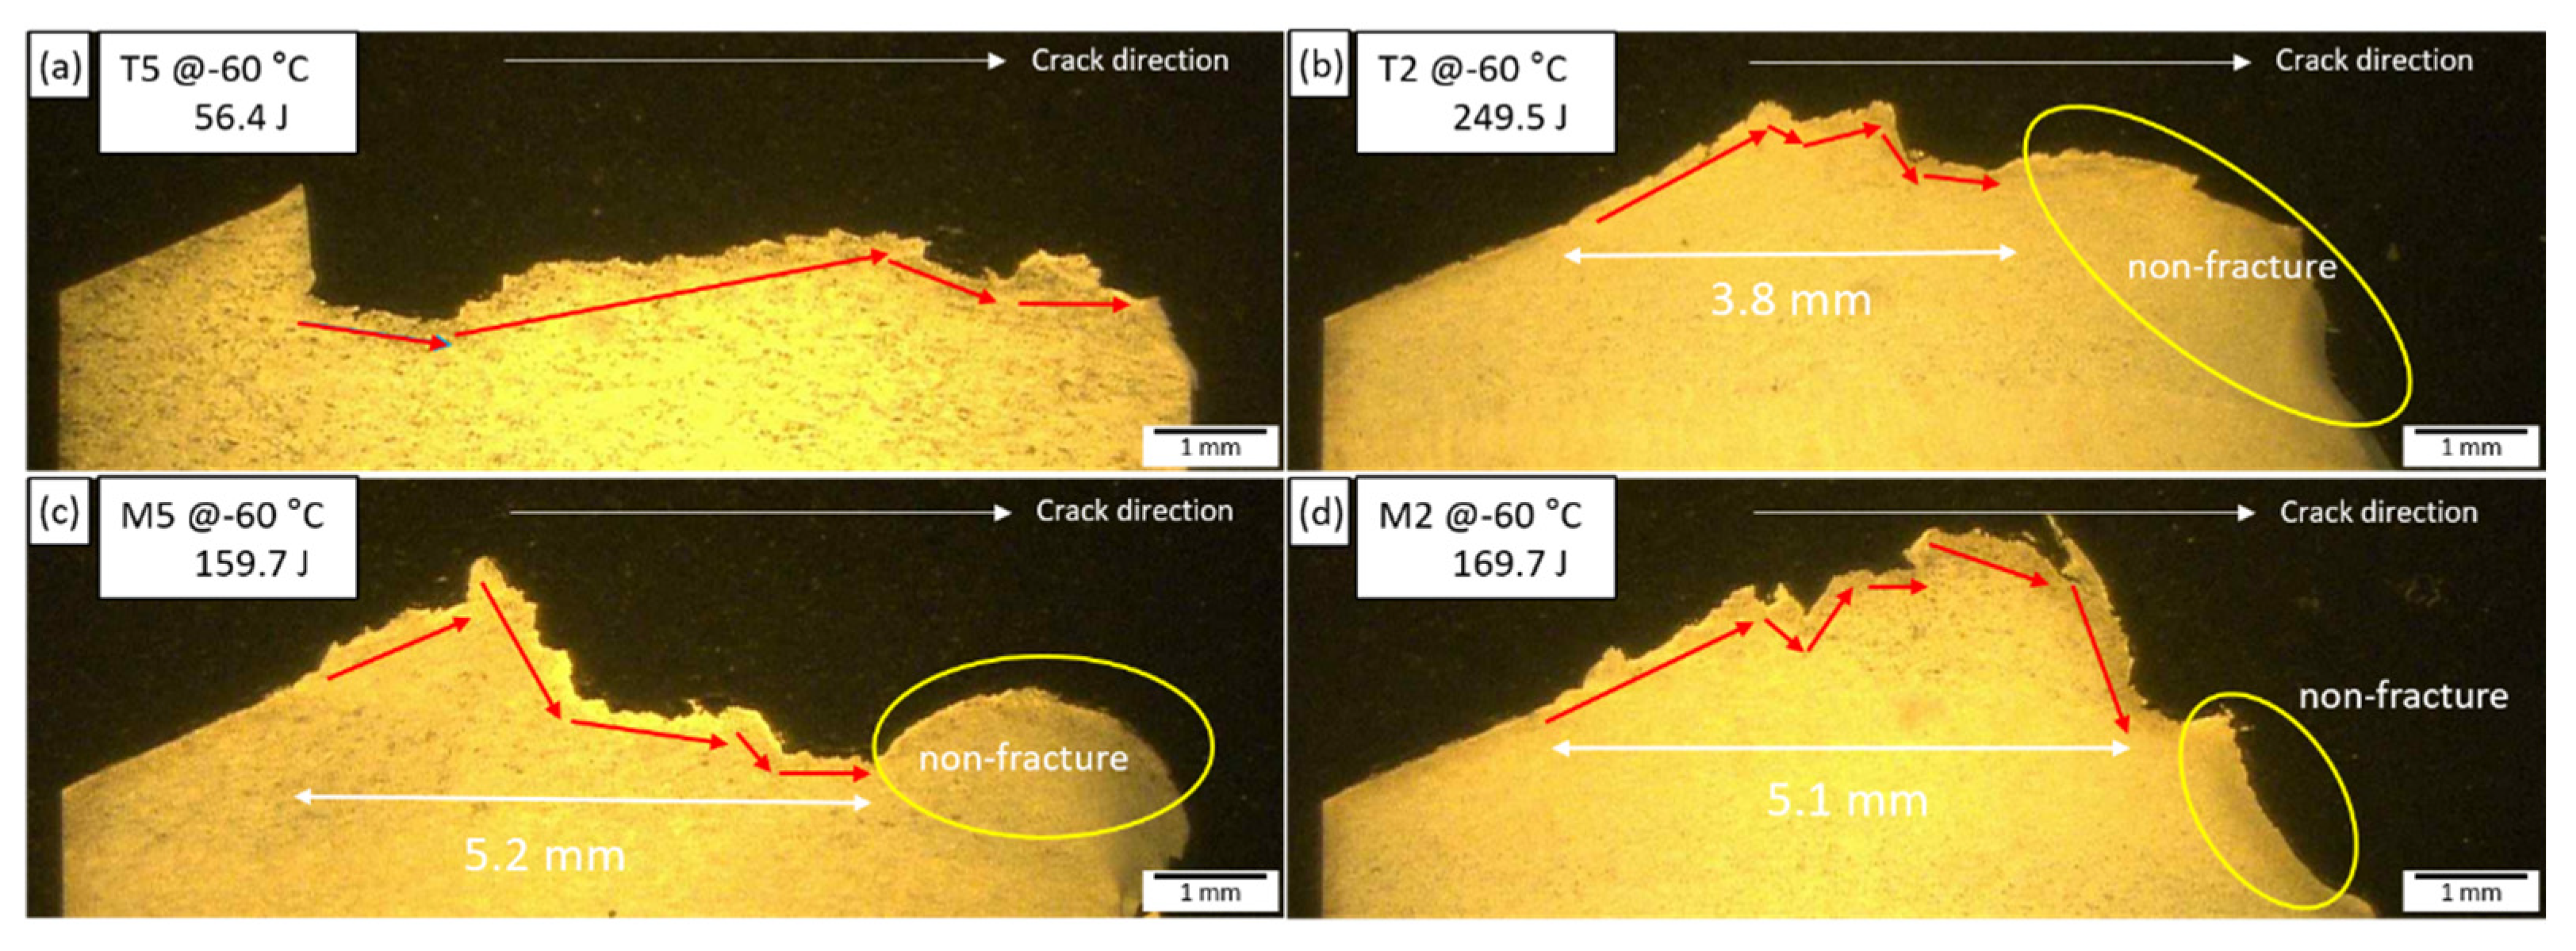
3.2. Impact Toughness of TMCP Steel and SAW Heat-Affected Zone
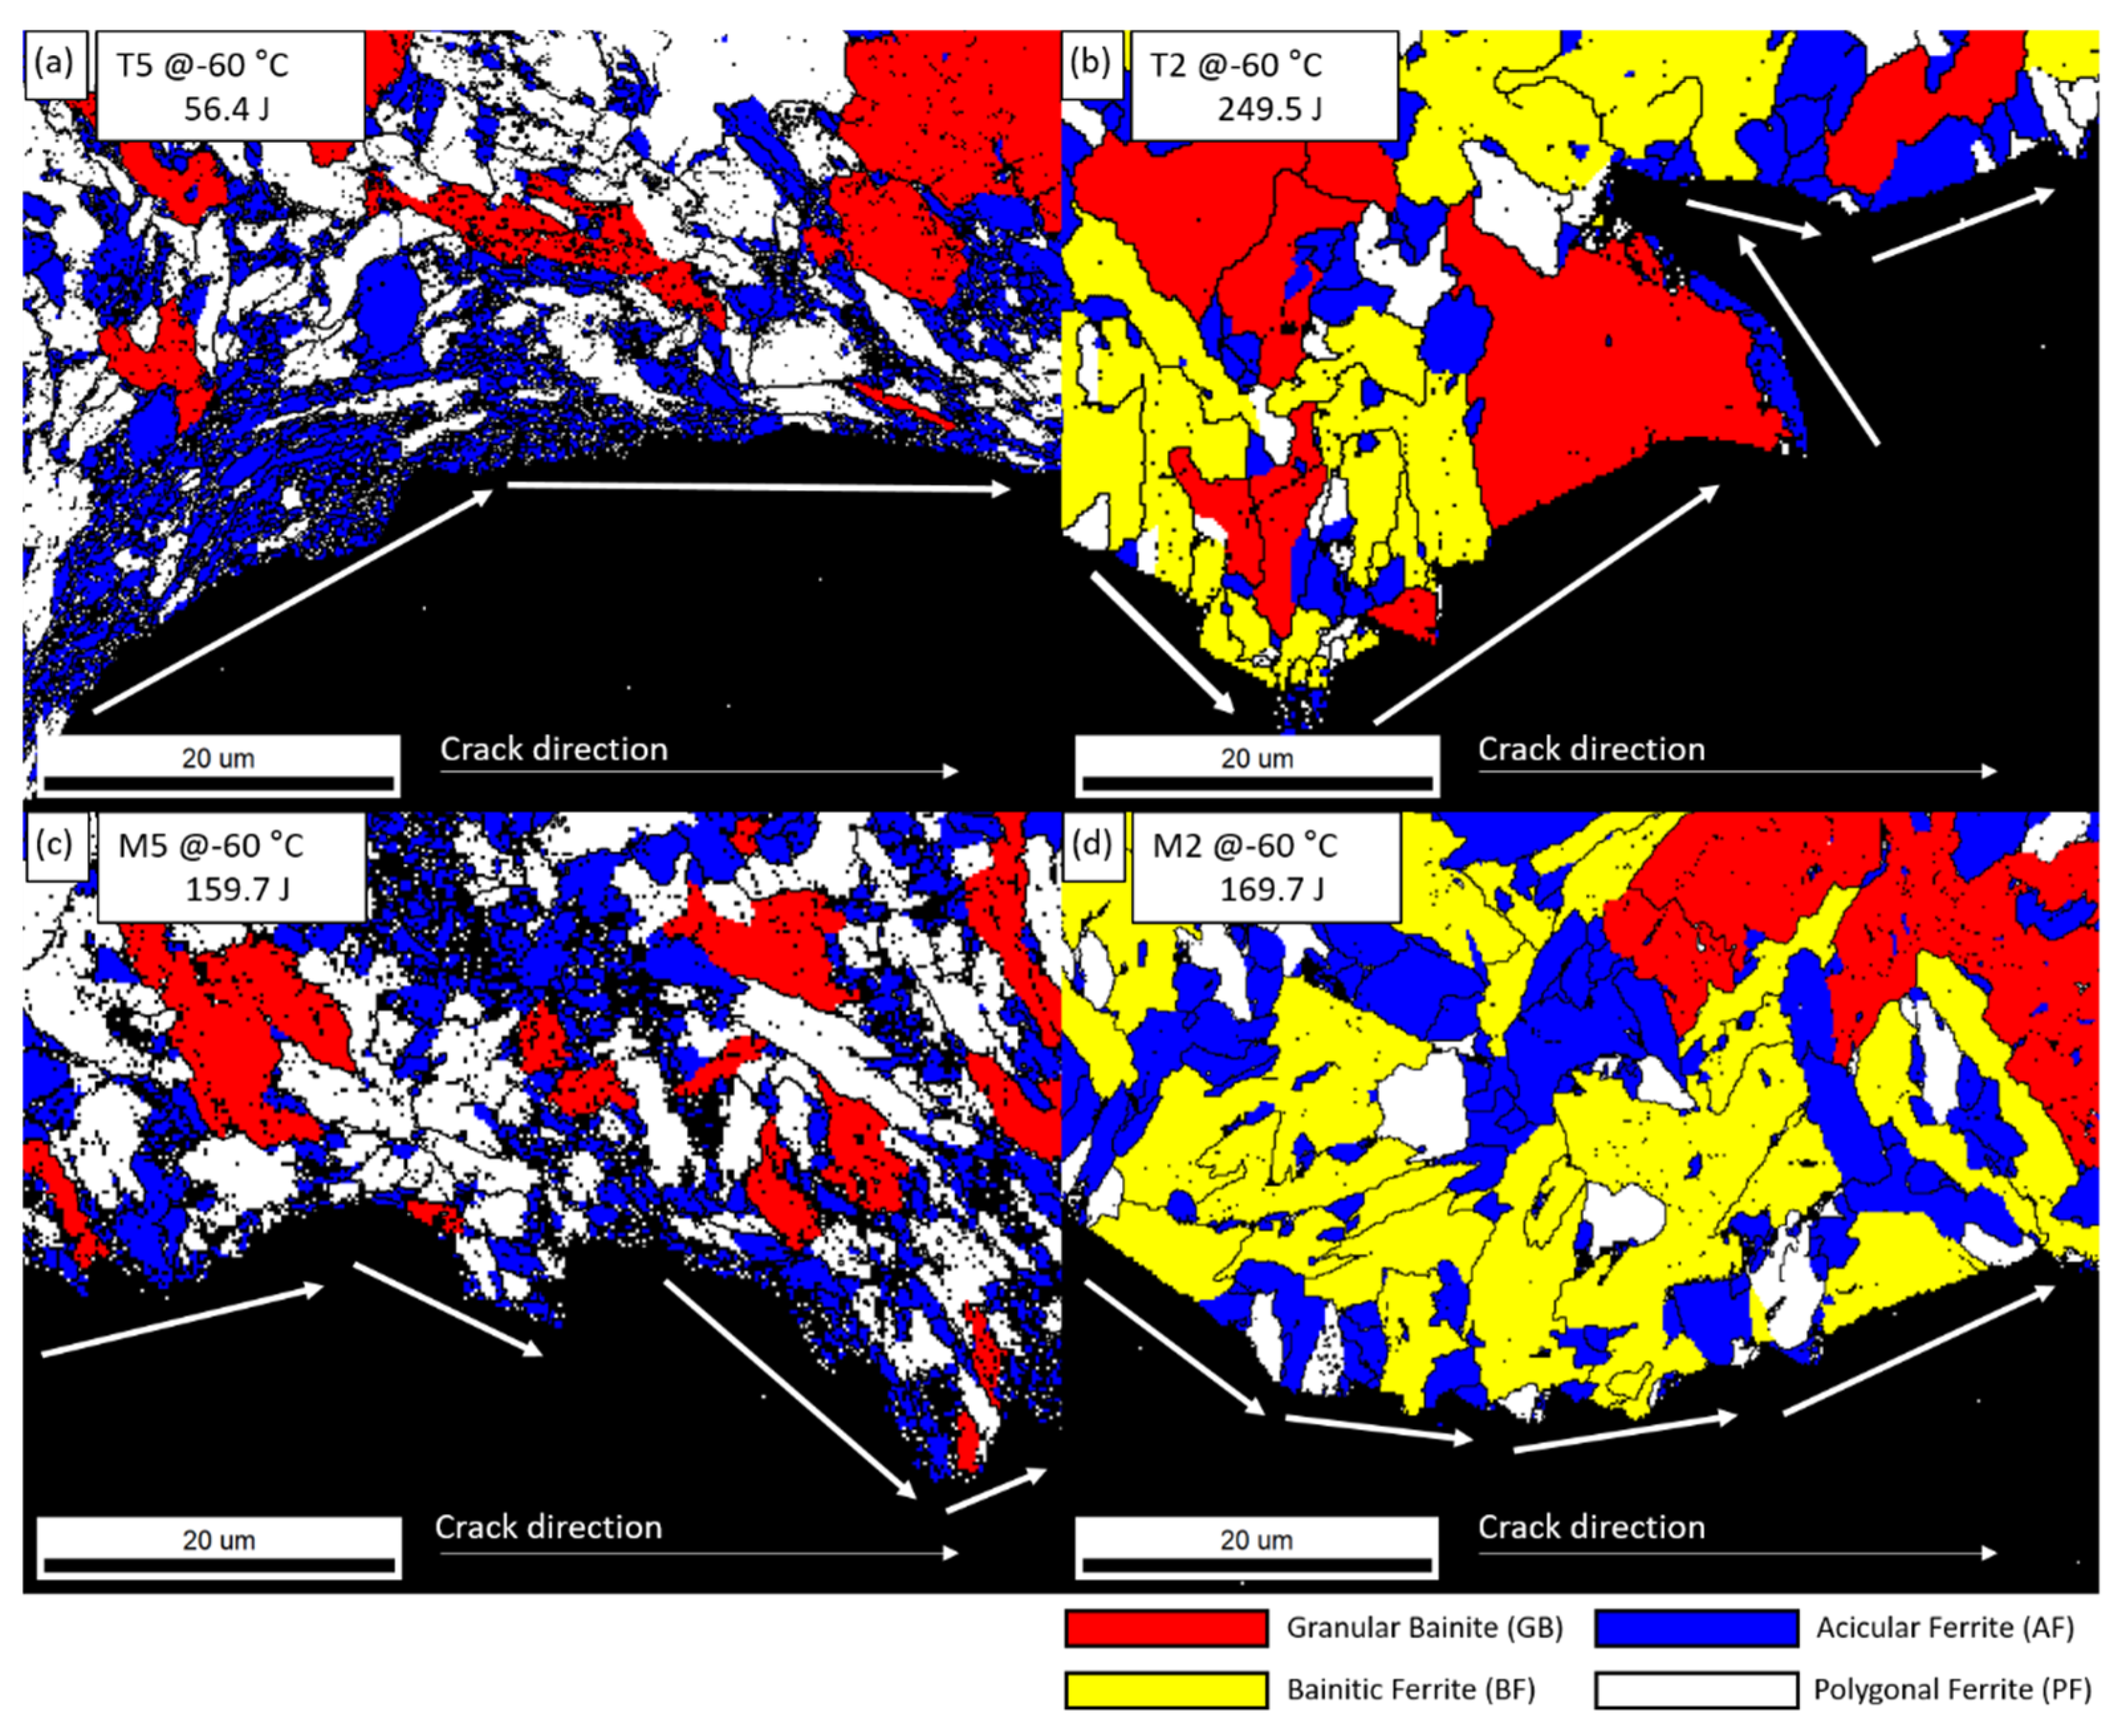
3.3. Correlation between Microstructure and Charpy Absorbed Energy
4. Conclusions
- The present TMCP steel showed a complex bainitic microstructure with PF, AF, and GB. The microstructure fraction and grain size were changed by rolling and cooling rates. Due to the large rolling reduction rate and fast cooling rate of the surface part, the GB fraction increased toward the center, the AF fraction decreased, and the grain size increased.
- With the multi-layer SAW process, changes occur in volume fraction and grain sizes of the constituent phases such as PF, GB, AF, and BF depending on the welding heat effect. The fractions of BF, AF, and GB changed as they moved away from the weld line. In the case of the central part, AF and BF of relatively small grains were observed at a faster cooling rate than the surface, and PF and GB were mainly observed in the surface.
- As a result of analyzing the effect of microstructural factors on the impact properties of TMCP steel, USE and absorbed energy depended on the microstructure fraction, and USE was improved through the absorption of impact energy of GB structure. AF structure was excellent in terms of crack resistance due to HAGB. In particular, AF dispersed in the GB and BF matrix was excellent in low-temperature toughness. However, AF packets with similar crystal orientations were vulnerable to low-temperature crack resistance.
- In the case of low-temperature impact properties, the dispersion of the AF with HAGB increases the impact absorbed energy. This is because the fine grain size and high fraction of HAGBs effectively hamper the easy propagation of cleavage cracks across the grain at low temperatures.
Author Contributions
Funding
Data Availability Statement
Acknowledgments
Conflicts of Interest
References
- George Krauss, S.W.T. Ferritc Microstructures in Continuously Cooled Low-and Ultralow-carbon Steels. ISIJ Int. 1995, 35, 937–945. [Google Scholar] [CrossRef]
- Di, X.; Tong, M.; Li, C.; Zhao, C.; Wang, D. Microstructural evolution and its influence on toughness in simulated inter-critical heat affected zone of large thickness bainitic steel. Mater. Sci. Eng. A 2019, 743, 67–76. [Google Scholar] [CrossRef]
- Lee, C.-H.; Shin, H.-S.; Park, K.-T. Evaluation of high strength TMCP steel weld for use in cold regions. J. Constr. Steel Res. 2012, 74, 134–139. [Google Scholar] [CrossRef]
- Zhou, Y.; Jia, T.; Zhang, X.; Liu, Z.; Misra, R.D.K. Microstructure and toughness of the CGHAZ of an offshore platform steel. J. Mater. Process. Technol. 2015, 219, 314–320. [Google Scholar] [CrossRef]
- Moon, J.; Kim, S.-J.; Lee, C. Effect of thermo-mechanical cycling on the microstructure and strength of lath martensite in the weld CGHAZ of HSLA steel. Mater. Sci. Eng. A 2011, 528, 7658–7662. [Google Scholar] [CrossRef]
- Zhang, J.; Xin, W.; Luo, G.; Wang, R.; Meng, Q. Significant Influence of Welding Heat Input on the Microstructural Characteristics and Mechanical Properties of the Simulated CGHAZ in High Nitrogen V-Alloyed Steel. High Temp. Mater. Process. 2020, 39, 33–44. [Google Scholar] [CrossRef]
- Qiu, H.; Enoki, M.; Kawaguchi, Y.; Kishi, T. Evaluation of dynamic fracture toughness of welding heat-affected zone of structural steel. ISIJ Int. 2000, 40, S34–S38. [Google Scholar] [CrossRef] [Green Version]
- Choi, D.; Lee, H.; Cho, S.-K.; Kim, H.C.; Hyun, S.-K.; Shin, S.Y. Microstructure and Charpy Impact Properties of FCAW and SAW Heat Affected Zones of 100 mm Thick Steel Plate for Offshore Platforms. Met. Mater. Int. 2020, 26, 867–881. [Google Scholar] [CrossRef]
- Ohtani, H.; Okaguchi, S.; Fujishiro, Y.; Ohmori, Y. Morphology and properties of low-carbon bainite. Metall. Trans. A 1990, 21, 877–888. [Google Scholar] [CrossRef]
- Hwang, B.; Lee, C.G.; Kim, S.-J. Low-Temperature Toughening Mechanism in Thermomechanically Processed High-Strength Low-Alloy Steels. Metall. Mater. Trans. A 2010, 42, 717–728. [Google Scholar] [CrossRef]
- Hu, J.; Du, L.-X.; Wang, J.-J.; Xie, H.; Gao, C.-R.; Misra, R.D.K. High toughness in the intercritically reheated coarse-grained (ICRCG) heat-affected zone (HAZ) of low carbon microalloyed steel. Mater. Sci. Eng. A 2014, 590, 323–328. [Google Scholar] [CrossRef]
- Kim, Y.M.; Kim, N.J. Effect of Microstructure on the yield ratio and low temperature toughness of linepipe steels. ISIJ Int. 2002, 42, 1571–1577. [Google Scholar] [CrossRef]
- Hu, J.; Du, L.-X.; Xie, H.; Dong, F.-T.; Misra, R.D.K. Effect of weld peak temperature on the microstructure, hardness, and transformation kinetics of simulated heat affected zone of hot rolled ultra-low carbon high strength Ti–Mo ferritic steel. Mater. Des. 2014, 60, 302–309. [Google Scholar] [CrossRef]
- Lucon, E. Mechanical tests on two batches of oxide dispersion strengthened RAFM steel (EUROFER97). Fusion Eng. Des. 2002, 61-62, 683–689. [Google Scholar] [CrossRef]
- Takamizawa, H.; Nishiyama, Y.; Hirano, T. Bayesian Uncertainty Evaluation of Charpy Ductile-to-Brittle Transition Temperature for Reactor Pressure Vessel Steels. In Proceedings of the ASME 2020 Pressure Vessels & Piping Conference, Las Vegas, NV, USA, 17–22 July 2020. [Google Scholar]
- Oldfield, W. Curve fitting impact test data: A statistical procedure. ASTM Stand News 1975, 3. [Google Scholar]
- Nikolaeva, A.V.; Nikolaev, Y.A. Mechanism of the drop in the dependence of yield stress on neutron irradiation dose for low alloy steel. Mater. Sci. Eng. A 1997, 234–236, 915–917. [Google Scholar] [CrossRef]
- Bruchhausen, M.; Holmström, S.; Lapetite, J.M.; Ripplinger, S. On the determination of the ductile to brittle transition temperature from small punch tests on Grade 91 ferritic-martensitic steel. Int. J. Press. Vessel. Pip. 2017, 155, 27–34. [Google Scholar] [CrossRef]
- Araki, T.; Kozasu, I.; Tankechi, H.; Shibata, K.; Enomoto, M.; Tamehiro, H. Atlas for bainitic microstructures. ISIJ Tokyo Jpn. 1992, 1, 4–5. [Google Scholar]
- Koo, J.Y.; Luton, M.J.; Bangaru, N.V.; Petkovic, R.A.; Fairchild, D.P.; Petersen, C.W.; Asahi, H.; Hara, T.; Terada, Y.; Sugiyama, M.; et al. Metallurgical Design of Ultra-High Strength Steels for Gas Pipelines. In Proceedings of the Thirteenth International Offshore and Polar Engineering Conference (ISOPE), Honolulu, HI, USA, 25–30 May 2003. [Google Scholar]
- Lee, M.-J.; Kang, N.-H. The Effects of Microstructure on Cold Crack in High-Strength Weld Metals. J. Korean Weld. Join. Soc. 2014, 32, 22–27. [Google Scholar] [CrossRef] [Green Version]
- ZAEFFERER, S.; ROMANO, P.; FRIEDEL, F. EBSD as a tool to identify and quantify bainite and ferrite in low-alloyed Al-TRIP steels. J. Microsc. 2008, 230, 499–508. [Google Scholar] [CrossRef]
- Kim, D.W.; Sohn, S.S.; Kim, W.-K.; Kim, K.-S.; Lee, S. Study of Bauschinger effect of acicular ferrite and polygonal ferrite through ex-situ interrupted bending tests in API X80 linepipe steels. Sci. Rep. 2018, 8, 15598. [Google Scholar] [CrossRef]
- Kim, D.W.; Kim, W.-K.; Bae, J.-h.; Choi, W.-D.; Sohn, S.S.; Lee, S. Effects of finish rolling temperature and yield ratio on variations in yield strength after pipe-forming of API-X65 line-pipe steels. Sci. Rep. 2020, 10, 14742. [Google Scholar] [CrossRef]
- Han, S.Y.; Shin, S.Y.; Seo, C.-H.; Lee, H.; Bae, J.-H.; Kim, K.; Lee, S.; Kim, N.J. Effects of Mo, Cr, and V Additions on Tensile and Charpy Impact Properties of API X80 Pipeline Steels. Metall. Mater. Trans. A 2009, 40, 1851–1862. [Google Scholar] [CrossRef] [Green Version]
- Kang, J.S.; Seol, J.-B.; Park, C.G. Three-dimensional characterization of bainitic microstructures in low-carbon high-strength low-alloy steel studied by electron backscatter diffraction. Mater. Charact. 2013, 79, 110–121. [Google Scholar] [CrossRef]
- Diaz-Fuentes, M.; Iza-Mendia, A.; Gutierrez, I. Analysis of Different Acicular Ferrite Microstructures in Low-Carbon Steels by Electron Backscattered Diffraction. Study of Their Toughness Behavior. Metall. Mater. Trans. A 2003, 34A, 2505–2516. [Google Scholar] [CrossRef]
- Lee, S.G.; Lee, D.H.; Sohn, S.S.; Kim, W.G.; Um, K.-K.; Kim, K.-S.; Lee, S. Effects of Ni and Mn addition on critical crack tip opening displacement (CTOD) of weld-simulated heat-affected zones of three high-strength low-alloy (HSLA) steels. Mater. Sci. Eng. A 2017, 697, 55–65. [Google Scholar] [CrossRef]
- Lee, S.-I.; Lee, J.; Hwang, B. Microstructure-based prediction of yield ratio and uniform elongation in high-strength bainitic steels using multiple linear regression analysis. Mater. Sci. Eng. A 2019, 758, 56–59. [Google Scholar] [CrossRef]
- Lee, S.; Kim, B.; Kim, W.; Um, K.-K.; Lee, S. Effects of Mo addition on crack tip opening displacement (CTOD) in heat affected zones (HAZs) of high-strength low-alloy (HSLA) steels. Sci. Rep. 2019, 9, 229. [Google Scholar] [CrossRef] [Green Version]
- Eom, H.; Cho, S.K.; Cho, Y.W.; Shin, G.; Kwon, Y.; Lee, J.G.; Shin, S.Y. Effect of Carbon and Nickel on Microstructure and Low Temperature Charpy Impact Properties of HSLA Steels. Korean J. Mater. Res. 2020, 30, 184–196. [Google Scholar] [CrossRef]
- Zuo, X.; Zhou, Z. Study of Pipeline Steels with Acicular Ferrite Microstructure and Ferrite-bainite Dual-phase Microstructure. Mater. Res. 2015, 18, 36–41. [Google Scholar] [CrossRef]
- Jia, T.; Zhou, Y.; Jia, X.; Wang, Z. Effects of Microstructure on CVN Impact Toughness in Thermomechanically Processed High Strength Microalloyed Steel. Metall. Mater. Trans. A 2016, 48, 685–696. [Google Scholar] [CrossRef]
- Yang, Z.; Liu, Z.; He, X.; Qiao, S.; Xie, C. Effect of microstructure on the impact toughness and temper embrittlement of SA508Gr.4N steel for advanced pressure vessel materials. Sci. Rep. 2018, 8, 207. [Google Scholar] [CrossRef] [PubMed] [Green Version]
- Tarpani, J.R.; Maluf, O.; Gatti, M.C.A. Charpy impact toughness of conventional and advanced composite laminates for aircraft construction. Mater. Res. 2009, 12, 395–403. [Google Scholar] [CrossRef] [Green Version]
- Kim, H.; Park, J.; Jung, J.E.; Sohn, S.S.; Lee, S. Interpretation of cryogenic-temperature Charpy fracture initiation and propagation energies by microstructural evolution occurring during dynamic compressive test of austenitic Fe–(0.4,1.0)C–18Mn steels. Mater. Sci. Eng. A 2015, 641, 340–347. [Google Scholar] [CrossRef]
- Kim, H.; Park, J.; Kang, M.; Lee, S. Interpretation of Charpy impact energy characteristics by microstructural evolution of dynamically compressed specimens in three tempered martensitic steels. Mater. Sci. Eng. A 2016, 649, 57–67. [Google Scholar] [CrossRef]
- Tavares, S.S.M.; Abreu, H.F.; Strohaecker, T.R.; Silva, M.B.; Macêdo, M.C.S.d. Influence of Heat Treatments on the Impact Toughness of a Ti-stabilized 12%Cr Supermartensitic Stainless Steel. Mater. Res. 2017, 20, 469–473. [Google Scholar] [CrossRef] [Green Version]
- Chaouadi, R.; Fabry, A.M. On the utilization of the instrumented Charpy impact test for characterizing the flow and fracture behavior of reactor pressure vessel steels. Eur. Struct. Integr. Soc. 2002, 30, 103–117. [Google Scholar]
- Chaouadi, R.; Puzzolante, J.L. Loading rate effect on ductile crack resistance of steels using precracked Charpy specimens. Int. J. Press. Vessel. Pip. 2008, 85, 752–761. [Google Scholar] [CrossRef]
- Lee, H.; Wu, X.; Kim, Y.; Kim, N. Effect of Second Phase on Mechanical Properties of Bainite-Base Steels. Adv. Mater. Res. 2007, 15, 780–785. [Google Scholar] [CrossRef]
- Zhu, Z.; Han, J.; Li, H.; Lu, C. High temperature processed high Nb X80 steel with excellent heat-affected zone toughness. Mater. Lett. 2016, 163, 171–174. [Google Scholar] [CrossRef]
- Rees, G.I.; Bhadeshia, H.K.D.H. Thermodynamics of acicular ferrite nucleation. Mater. Sci. Technol. 1994, 10, 353–358. [Google Scholar] [CrossRef]
- Lee, C.H.; Bhadeshia, H.K.D.H.; Lee, H.C. Effect of plastic deformation on the formation of acicular ferrite. Mater. Sci. Eng. A 2003, 360, 249–257. [Google Scholar] [CrossRef]
- Kim, Y.M.; Shin, S.Y.; Lee, H.; Hwang, B.; Lee, S.; Kim, N.J. Effects of Molybdenum and Vanadium Addition on Tensile and Charpy Impact Properties of API X70 Linepipe Steels. Metall. Mater. Trans. A 2007, 38, 1731–1742. [Google Scholar] [CrossRef] [Green Version]
- Mao, G.; Cayron, C.; Cao, R.; Logé, R.; Chen, J. The relationship between low-temperature toughness and secondary crack in low-carbon bainitic weld metals. Mater. Charact. 2018, 145, 516–526. [Google Scholar] [CrossRef]
- Waqas, A.; Qin, X.; Xiong, J.; Zheng, C.; Wang, H. Analysis of Ductile Fracture Obtained by Charpy Impact Test of a Steel Structure Created by Robot-Assisted GMAW-Based Additive Manufacturing. Metals 2019, 9, 1208. [Google Scholar] [CrossRef] [Green Version]


| Element | C | Si | Mn | P | S | Cr | Ni | Mo | N | Al | Cu | Nb | Ti | V |
|---|---|---|---|---|---|---|---|---|---|---|---|---|---|---|
| Content | 0.14 | 0.55 | 2.00 | 0.02 | 0.01 | 0.30 | 1.00 | 0.25 | 0.01 | 0.02 | 0.035 | 0.05 | 0.025 | 0.08 |
| Specimen | Horizontal Direction | ||||
|---|---|---|---|---|---|
| Base | 5 mm | 2 mm | 0 mm | ||
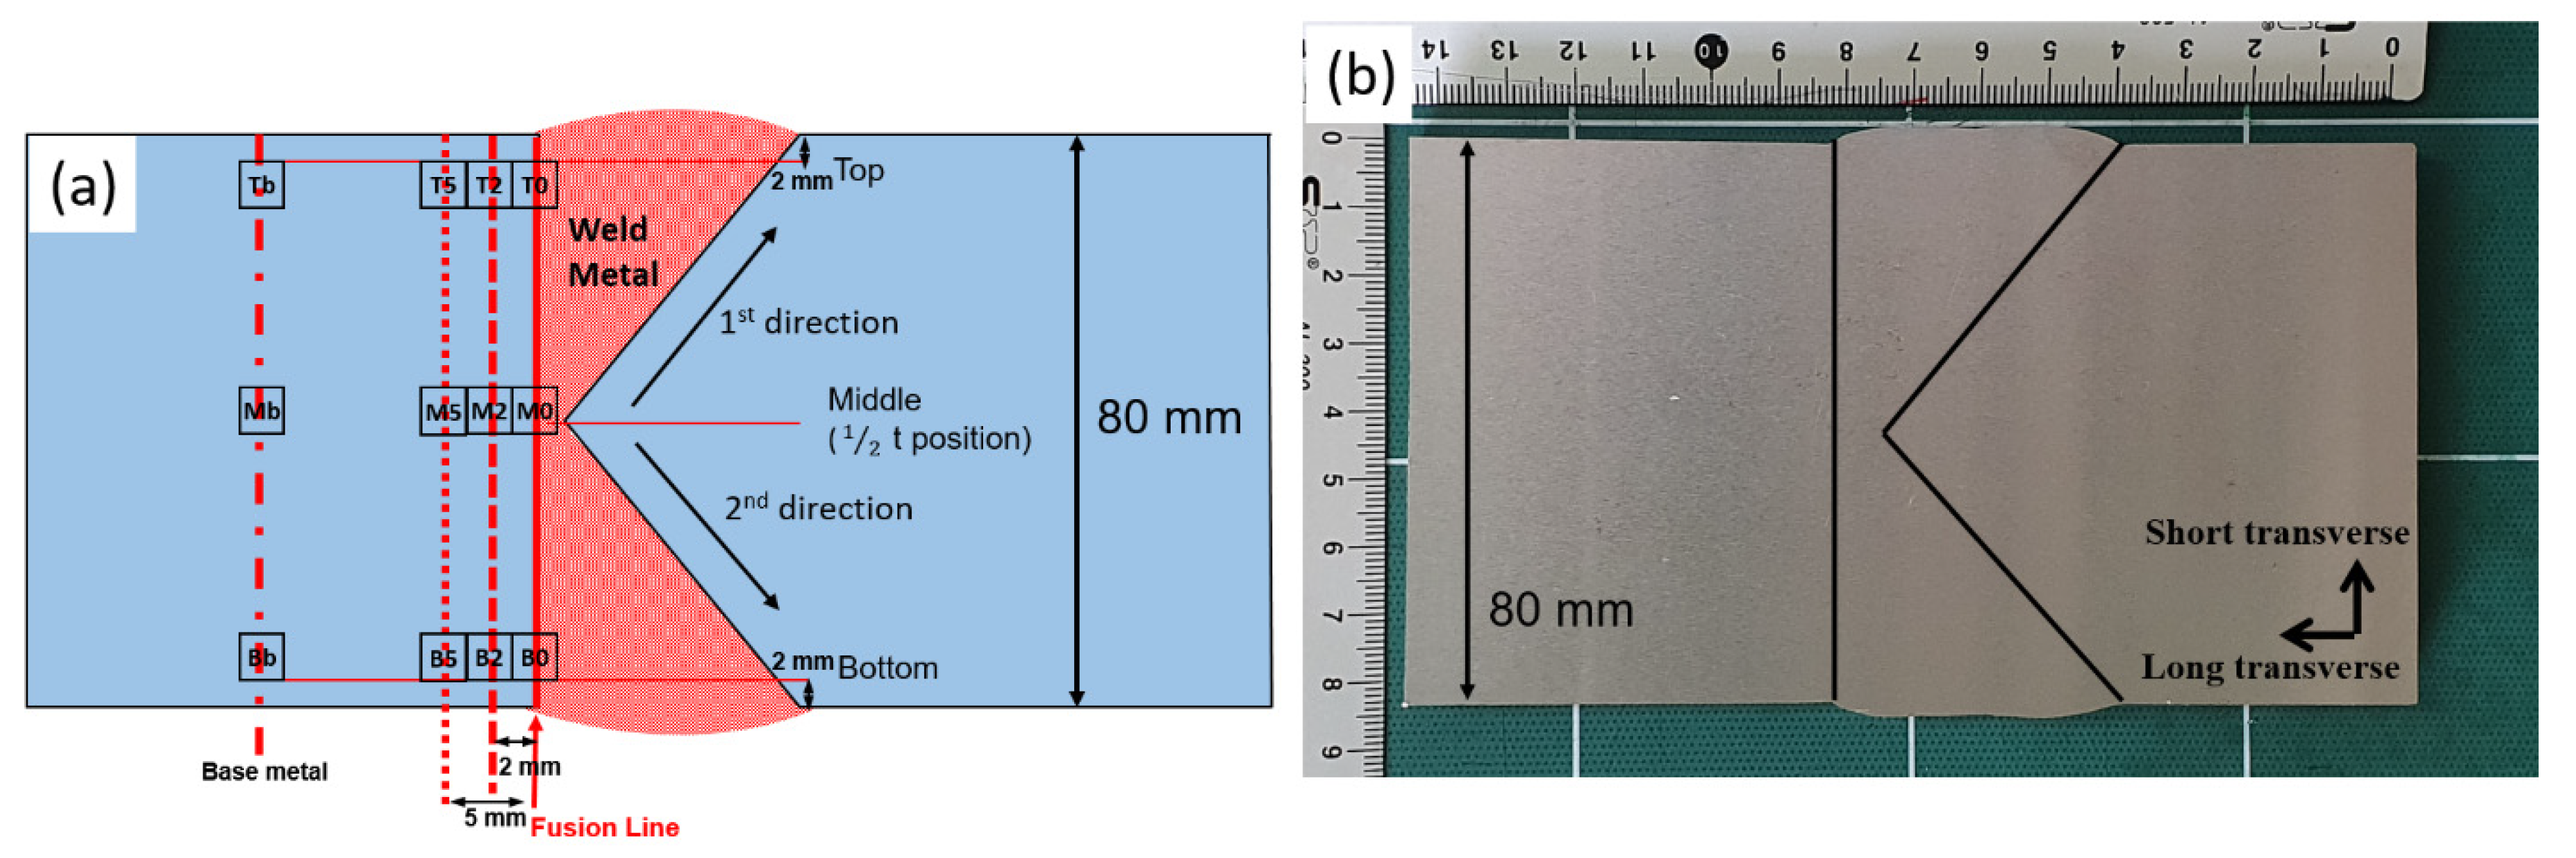
| Vertical direction | Top | Tb | T5 | T2 | T0 |
| Middle | Mb | M5 | M2 | M0 | |
| Bottom | Bb | B5 | B2 | B0 | |
| Compositions | C | Si | Mn | P | S | Ni | Mo | Cu |
| Wire | 0.10~0.18 | ≤0.30 | 1.50~2.40 | ≤0.025 | ≤0.025 | 0.7~2.75 | 0.40~0.65 | ≤0.35 |
| Compositions | SiO2 + TiO2 | CaO + MgO | Al2O3 + MnO | CaF2 | ||||
| Flux | 20 | 40 | 20 | 15 | ||||
| Welding Process | Heat Input (kJ/cm) | Welding Current (I, A) | Welding Voltage (U, A) | Welding Speed (cm/min) | Preheating Temperature (°C) | Inter-Pass Temperature (°C) |
|---|---|---|---|---|---|---|
| SAW | 25~32 | 600~610 | 32~34 | 40~45 | 125~250 | 125~250 |
| Specimen | Microstructure Area Fraction (%) | Average Grain Size (μm) | |||
|---|---|---|---|---|---|
| PF | GB | AF | BF | ||
| Tb | 11.8 | 54.0 | 34.2 | - | 12.5 ± 10.3 |
| T5 | 70.0 | 15.7 | 14.3 | - | 5.2 ± 2.4 |
| T2 | 8.6 | 32.8 | 10.9 | 47.7 | 12.2 ± 6.7 |
| T0 | 4.5 | 22.1 | 32.8 | 40.7 | 13.5 ± 11.8 |
| Mb | 27.6 | 59.5 | 12.8 | - | 15.5 ± 12.6 |
| M5 | 59.3 | 7.0 | 33.7 | - | 4.7 ± 2.3 |
| M2 | 7.4 | 20.0 | 6.8 | 65.8 | 12.5 ± 7.9 |
| M0 | 4.5 | 20.5 | 40.0 | 35.0 | 20.7 ± 19.4 |
| Bb | 16.0 | 52.8 | 31.3 | - | 11.8 ± 9.2 |
| B5 | 69.9 | 16.6 | 13.5 | - | 5.7 ± 2.5 |
| B2 | 8.8 | 37.1 | 12.4 | 41.7 | 16.9 ± 10.2 |
| B0 | 6.0 | 33.7 | 24.1 | 36.2 | 17.8 ± 17.3 |
| Position | Base Metal | F.L.+ 5 mm | F.L.+ 2 mm | F.L. | ||||
|---|---|---|---|---|---|---|---|---|
| USE (J) | DBTT (°C) | USE (J) | DBTT (°C) | USE (J) | DBTT (°C) | USE (J) | DBTT (°C) | |
| Top | 285 | −70 | 230 | −50 | 250 | −85 | 260 | −50 |
| Middle | 280 | −65 | 220 | −75 | 220 | −70 | 265 | −45 |
| Bottom | 290 | −70 | 230 | −55 | 245 | −90 | 255 | −50 |
Publisher’s Note: MDPI stays neutral with regard to jurisdictional claims in published maps and institutional affiliations. |
© 2021 by the authors. Licensee MDPI, Basel, Switzerland. This article is an open access article distributed under the terms and conditions of the Creative Commons Attribution (CC BY) license (https://creativecommons.org/licenses/by/4.0/).
Share and Cite
Choi, B.C.; Kim, B.; Kim, B.J.; Choi, Y.-W.; Lee, S.J.; Jeon, J.B.; Kim, Y.; Kim, H.C. Effect of Microstructure on Low-Temperature Fracture Toughness of a Submerged-Arc-Welded Low-Carbon and Low-Alloy Steel Plate. Metals 2021, 11, 1839. https://doi.org/10.3390/met11111839
Choi BC, Kim B, Kim BJ, Choi Y-W, Lee SJ, Jeon JB, Kim Y, Kim HC. Effect of Microstructure on Low-Temperature Fracture Toughness of a Submerged-Arc-Welded Low-Carbon and Low-Alloy Steel Plate. Metals. 2021; 11(11):1839. https://doi.org/10.3390/met11111839
Chicago/Turabian StyleChoi, Byeong Chan, Byoungkoo Kim, Byung Jun Kim, Yong-Wook Choi, Sang Joon Lee, Jong Bae Jeon, Yangdo Kim, and Hyoung Chan Kim. 2021. "Effect of Microstructure on Low-Temperature Fracture Toughness of a Submerged-Arc-Welded Low-Carbon and Low-Alloy Steel Plate" Metals 11, no. 11: 1839. https://doi.org/10.3390/met11111839
APA StyleChoi, B. C., Kim, B., Kim, B. J., Choi, Y.-W., Lee, S. J., Jeon, J. B., Kim, Y., & Kim, H. C. (2021). Effect of Microstructure on Low-Temperature Fracture Toughness of a Submerged-Arc-Welded Low-Carbon and Low-Alloy Steel Plate. Metals, 11(11), 1839. https://doi.org/10.3390/met11111839