
Mathematical Modelling for Furnace Design Refining Molten Aluminum
by
 , and
, and
Alfredo Alan Flores Saldívar
1,* ,
,
Rodrigo Juárez Martínez
2,
Alfredo Flores Valdés
3,
Jesús Torres Torres
3,
Rocío Maricela Ochoa Palacios
4 and
Yun Li
5,6 1
School of Mechanical Engineering, University of Electronic Science and Technology of China, Chengdu 611731, China
2
Bachillerato General Militarizado, Guadalupe 98064, Mexico
3
Cinvestav Saltillo, Industria Metalúrgica 1062, Ramos Arizpe 25900, Mexico
4
Metal-Mecánica Departamento, Instituto Tecnológico de Saltillo, Saltillo Coahuila 25280, Mexico
5
Shenzhen Institute for Advanced Study, University of Electronic Science and Technology of China, Shenzhen 518110, China
6
i4AI Ltd., London WC1N 3AX, UK
*
Author to whom correspondence should be addressed.
Metals 2021, 11(11), 1798; https://doi.org/10.3390/met11111798
Submission received: 29 September 2021
/
Revised: 30 October 2021
/
Accepted: 1 November 2021
/
Published: 9 November 2021
(This article belongs to the Section Computation and Simulation on Metals)
Abstract
:The design of an aluminium melting furnace has faced two challenges: mathematical modelling and simulative optimization. This paper first uses fluid dynamics to model the aluminium process mathematically. Then, the model is utilized to simulate a round shaped reverberatory furnace for melting aluminium alloys. In order to achieve the highest thermal efficiency of the furnace, modelling and simulation are performed to predict complex flow patterns, geometries, temperature profiles of the mixture-gas air through the main chamber, as well as the melting tower attached to the furnace. The results led to the establishment of optimal position and angle of the burner, which are validated through physical experiments, ensuring recirculation of the combustion gases through the melting chamber and the melting tower. Furthermore, a proper arrangement of refractory materials is derived to avoid heat losses through the outer surface of the furnace. Temperature profiles are also determined for the optimization to arrive at the final design of the furnace. Compared with manual designs previously practiced, the simulation-based optimal design of furnaces offers excellent guidance, an increase in the aluminium processing and magnesium removal for more refined alloys, and an increased processing rate of aluminium chip accession.
1. Introduction
Computer modelling of the melting and refining processes of aluminium alloys is a challenging precondition for manual design and soft learning of better furnaces, which has attracted the attention of researchers [1]. With modelling and simulations, it has been demonstrated that the behaviour of aluminium alloys in its liquid phase processed in a reverberatory furnace can be shaped by setting initial points on design variables [2]. The results obtained by Heugenhauser, Kaschnitz and Schumacher [3] have been favourably used for determining optimal process parameters in numerous areas such as the aerospace industry, the transport industry and materials manufacturing.
It is well known that aluminium, together with its alloys, present a good combination of mechanical, physical and casting characteristics, as discussed by Zhan [4], since these are frequently utilized in building, transportation, and packaging industries. Nonetheless, the industrial processes of aluminium are highly energy consuming and pose high contamination. Jepson and Kim [5] explain that after melting, molten aluminium is kept at a constant temperature indispensable in order to satisfy quality standards for further ejection or foundry processes. A way forward to this is presented by Wei [6], where a reverberatory furnace typically operates at 12% of efficiency in thermal conversion. To address such an issue, Haraldsson et al. [7] illustrate the importance of how to measure the energy efficiency in production processes where aluminium is used. They emphasize the importance of recycled aluminium alloys where sometimes such waste can represent a challenge of decreasing the magnesium (Mg) concentration. Recently, Brimmo et al. [8] have discovered that reverberatory furnaces used in the preparation of most aluminium alloys have deficiencies, such as low production and energy efficiency, labour force and major contamination problems. However, optimal design can improve performance, but, as Wan [9] reported, this trial-and-error process is ineffective and leads companies to higher experimentation costs.
According to Sviželová [10], with the use of a mathematical model, optimization for various stages of furnace processing can be achieved. Brimmo [11] consider in their work that mathematical models are helpful evaluating ventilation and heat transfer systems for the aluminium melting industry because of accessible or inexpensive parametric studies. Popa et al. [12] explain how various models have been developed to evaluate furnace efficiency and examine strategies for energy-saving cast houses. Such models have successfully shown potential of energy-saving for immersion heaters, according to Hassan et al. [13]. For example, studies have been carried out by Niehoff et al. [14] on maximizing oxy-fuel burners, which has improved the burner injection angle effect and furnace roof extent on the total thermal efficiency. Nonetheless, Walter [15] argues that neither of these modelling efforts have illustrated the potential of applying mathematical models to finding optimal solutions for the circulation of hot gas inside the furnace, whereas various experimental studies were carried out. Despite the fact that good efforts have been made to improve energy efficiency for the melting process, present optimization results in many reverberatory furnaces are still at a minimum.
Early work by Li et al. [16] suggested a way forward for analysing the highest possible energy and the lowest flow of gas heat waste in aluminium reverberatory furnaces. Understanding the basis and interactions of heat transfer and flow in the furnace are significant in making the energy use more efficient, whereby maximizing the production rate and minimizing the concentration of contaminants. A study on computational fluid dynamics (CFD) was presented by Golchert [17], which in detail described how the inconsistency of nitrogen concentration linked with partial substitution of air with pure oxygen impacted heat transfer and the formation of pollutants in aluminium melting furnaces. Particle trajectory and fluid flow analysis for reverberatory furnace applications were carried out by R. Juarez [18], where they studied the liquid’s behaviour in an impeller-stirred system. To establish mixing and circulation times, numerical and physical simulations were used, as well as patterns of fluid flow and velocity profiles in the turbulence and melting furnace.
In this work, we determine the interaction between circulating solid particles and turbulent flows by using experimental data with signal processing. The reverberatory furnace’s original design is, hence, altered considering the numerical and physical simulation analysis. The new design is to indicate an increment on the magnesium elimination rate through a faster and more efficient mixing. Because a simulation can be carried out quickly and cheaply, we investigate the parameter set a priori to capital expenditure on an industrial furnace, given that Viswanath et al. [19] have illustrated that an obvious advantage over experimentation goes to computational simulations. However, Qiu et al. [1] have discussed that numerical simulation concerning aluminium melting furnace has not taken into account the molten aluminium in furnaces and the interplay among its velocity pattern profiles and the combustion gases. We shall therefore obtain significant information through signal processing about the molten aluminium.
At an industrial level, the use of numerical tools for modelling and validating the performance of different metal alloys is of great importance, as discussed in [20] where different applications involve specific challenges to tackle, i.e., geometries, velocities, temperatures and turbulence. Optimizing the fusion processes is important for saving fuel consumption, minimizing the fusion cycles, reducing wear on the refractories, and increasing production [21]. In such work, a prediction model was necessary through control simulation and was implemented on to a Programmable Logic Controller (PLC). The controlled combustion and gas flow reduced energy consumption by 6%, and the liquid metal temperature by around 20 °C, among other evaluated characteristics. Their efforts helped to understand such phenomena through numerical simulations.
In particular, we shall develop a 3D mathematical model for the determination of fluid flow patterns and velocity profiles of the exhaust combustion gases, where the position of the burner inside a reverberatory furnace of rounded design plays an important role on the furnace efficiency. Using thermal modules and solidification tools available in the Engineering System International (ESI) Group ProCast, 2015 version, software package, we should be able to elucidate a concise and clear method of observing furnace performance. Using a finite element method [22] in CFD allows us to obtain an approximate numerical solution on a body (piece), structure or domain to which differential equations that characterize the physical behaviour of the problem is coupled. This way, the subdomains form discretization zones. This feature allows us to adjust the nodes in areas where a higher quality is required in the simulation, and thus to save time for more information in the areas of more interest.
The main objective of this work is to establish a mathematical model for simulation-based design to obtain velocity patterns, velocity vectors of the flue gases for a burner position of 45°, temperature profiles of the exhaust gases, temperature profiles of the melting chamber, the melting tower, and the furnace exterior, so as to shorten the melting time and the Mg removal rate. This is validated by a newly constructed reverberatory furnace for melting aluminium, operating at higher efficiency and optimal performance of the molten metal. It helps obtain a new insight into the aluminium processing and how to obtain a proper design to preheat the metal charge. The importance of focusing on such phenomena helps deal with the given conditions and considerations. The modelling process indicates the importance of geometry in the furnace and exhaust pipes, in which case simulation helps explore how efficient round shape designs can be.
The rest of the paper is organized as follows. In Section 2, the mathematical procedure is presented with dynamic equations and conditions for running simulations. Section 3 develops the CFD simulations and obtains results. Section 4 analyses the results with comparison and validation through tests performed on the real industrial process operated. Finally, in Section 5, we draw conclusions from the simulation results and trials at an industrial level.
2. Mathematical Modelling
In this section, the mathematical procedure is presented for simulation settings. The models are developed to fit the ProCast k-ε model. The equations are derived from those by Wang et al. [23], since their work encompasses casting and aluminium alloys.
Consider the continuity Equation:
and the momentum Equation:
where V is the flow velocity vector field of the fluid density, and the terms of residual stresses τxx, τyy, and τzz along the x, y and z axis are:
Here, u, v, w are internal energy, flow velocity, diffusion velocity, respectively. All symbols used in the equations in this paper are listed and explained in the Appendix A.
The energy conservation equation is presented in Wang et al. [23], as discussed previously, where the mathematical Equations are:
Here, u is the internal energy and h is the enthalpy value.
The Turbulence Equations are:
where the turbulent viscosity remains as:
There are five coefficients used in this model, which have the following forms and values: .
2.1. Boundary Conditions
The boundary conditions can be divided according to the zones inside the furnace, as follows:
At the gas inlet to specifying the mass flow and temperatures. ProCast has an option to specify the input of turbulence quantities, depending on the mass flow and diameter of the burners.
At the exit of the gases. According to [24], this condition is usually handled as:
where ϕ would be velocity, temperature, or amount of turbulence depending on the interest of study.
2.2. Discretization
The solution field is separated within a non-overlapping set of sub-regions which cover the volume in total. The variables in all the elements are interjected from values at discrete nodal positions. Duplicated indices in a terminus demonstrate the utilization of Einstein’s addition convention, further discussed by Bazhenov [25,26] in the following equation:
where the variable ϕ can be the velocity, temperature, or amount of turbulence depending on the interest of study.
2.2.1. Discretization for Momentum Equation
Accepting that fluid is almost incompressible, and viscosity spatial derivatives are minuscule, numerous terms in the tensor viscous stress can be disregarded. In the momentum equation, we apply Galerkin’s approach to obtain the following expression previously used in [27]:
An estimation for streamline upwind is applied in an advection term:
where Us is the streamline velocity and s is the streamline arrange.
Applying the divergence theorem to the dispersion term of the momentum Equation, we obtain a similar order in the weighting and interpolating functions:
Following this, we have the momentum Equation in the final discretized form:
where:
A two-level time-stepping method can be used here. Then, finding the solution for an adjusted value produces yields:
2.2.2. Discretization for Continuity Equation
Ragab et al. [24] considered discretized momentum expressions in reference to the obtained uj nodal velocities, and Bij coefficients. Thus, the result of pressure gradients can be partitioned as:
where
Assuming that the pressure gradient is continual within the integral and considering Galerkin’s procedure of Green’s Lemma and weighted residuals:
Then, replacing the above velocity correction relationship in the discretized continuity expression the pressure equation, we obtain:
Hence
The correction form is thus solved as:
where:
3. Simulation-Based Design
3.1. CFD Meshing for Simulations
The conditions in which the theoretical analysis is carried out for the heat balances and the numerical modelling are presented next. The furnace has a rounded geometry, a configuration to facilitate fluid dynamics of a molten stream, and an efficient performance of the combustion gases in the system. This furnace also has a melting tower which is designed to be an area of solid preload, where the flue gases are forced to pass through this tower. The main chamber (melting chamber) has a capacity of 3 tons of molten aluminium, although most simulations will be referred to a melting cycle of 1000 kg. A modelling diagram of the entire furnace is shown in Figure 1, where a part of the melting tower is observed in Figure 1b. Part 2 of 1b represents a cut-off of the melting tower; part 3 represents a cut-off of the main or melting chamber; part 4 represents the cylindrical volumes comprising the two front chambers.
To validate the model for simulation, data from cameras need to be signal processed. The main camera is equipped with high-efficiency burners with a capacity of 756,493 kcal, and 252,164 kcal located in the melting tower. The furnace was manufactured by Fundicion JV, as stated further on the acknowledgements part, their facilities are located in Ramos Arizpe, Coahuila, Mexico. The furnace has two front chambers (burr feeding and agitation chambers). The lining of the furnace consists of 4 type-built volumes comprising the steel sheet, the ceramic blanket, the insulation, and the refractory concrete. The physical properties of the refractory materials were selected in order to verify the insulating conditions to be attained, as a way to avoid heating losses from the inside to the outside of the furnace considering the design point of view.
Following pre-processing data, numerical simulations were carried out to corroborate the temperature profile of the furnace wall, where the thermal conductivity values were taken from the data sheets provided by the manufacturer. Once the heat balance within the main or melting chamber is analysed, the behavior of the combustion gases inside the melting chamber and the melting tower for a normal position of the burner in the melting chamber is obtained. From the information provided by the manufacturer, it was possible to carry out a study of the areas of great influence of the furnace (area near the flame, insulation of the furnace) that helped elucidate the sensitivity analysis to select the correct mesh size for simulation studies. This helps to identify the most important areas and to select the type of key elements for use in each area’s detailed simulations. The areas with the highest density of element nodes are the main chamber and fusing tower flames. In contrast, the walls of the furnace are of equal importance. Therefore, the density of the number of elements are placed in the areas close to the periphery or steel plate.
Then, the model is fully simulated using ProCast in areas where greater precision of the prediction zone is required, as depicted in Figure 2. The finite element meshing of the model with a smaller number of 10 elements is used in the close sections of the flame. The size of the elements for the other components of the system are 27 and 400. For the materials and initial temperatures, the ceramic coating inside the furnace starts at a temperature of 20 °C, while the flame introduces hot air at 950 °C at a speed of 12 m/s. The size of the mesh elements is 2 cm × 2 cm × 2 cm in the case of the tetrahedral and hexahedral nodes, each of which are assigned up to 80% for the tetrahedral and 20% the hexahedral nodes accordingly.
3.2. Simulation-Based Design Settings
For the finite element method, in the case where the calculation of the insulation system needs to be performed, the properties of the different component materials (thermal conductivity, specific heat, density) are shown in Table 1 with respective values. The parameters for the simulation runs are shown in Table 2.
The density of nodes is increased by 50% for zones where the flow inlet is close to the refractory walls, while the amount of finite elements is increased by 20% for the hexahedral elements and the remaining tetrahedral elements. Once the meshing is formed considering the construction plans of the furnace, the Computer-Aided Design (CAD) runs for the furnace system with a mesh element size of 27 to 400 nodes as aforementioned. For the simulation of this model, only the internal refractory ceramic section of the furnace is considered. This is with the intention of simplifying the model so as to obtain results faster for working concrete, insulating concrete and refractory blanket. To simulate the heating of the furnace by hot air at 950 °C, a heat boundary condition in the inner wall of the furnace is established, i.e., for temperature T = 950 °C at t = 0, for velocity X = 0 and V = 0.
4. Analysis and Optimization
4.1. Energy Balance Analysis
Energy balances can be analysed according to the materials used in the manufacture of the furnace (sheet metal, mineral wool, insulating concrete, castable, etc.). Note that in a reverberatory furnace used for melting aluminium, heat transfer occurs in two ways from the burner to the metal: radiation and convection. As a first step, the energy balance was held in the furnace’s main chamber. The objective function used for the optimization design problem was Mg refining, considering a minimization problem.
The first calculation carried out was the energy balance for the amount of heat absorbed by the refractory concrete in the main chamber, initiating with a temperature of 20 °C and then operating at a temperature of 950 °C. The values of energy absorbed by the refractory in the main chamber, the required energy for melting 1000 kg of aluminium, and the energy required for the phase change are shown in Table 3.
In these energy calculations, burners generate enough energy to perform different tasks: (1) preheating the furnace to the working temperature; (2) changing the phase of aluminium (solid–liquid); (3) melting the loaded aluminium. Once the calculations of the energy required are made for different stages of the melting process and based on the established designs of the furnace (geometry and configuration), simulations begin. These include the fluid flow (exhaust gases) on the melting chamber and through the melting tower, as well as the velocity and temperature profiles of these gases (from the inside to the outside). During the first simulation, the behaviours of the combustion gases and its fluid dynamics are observed. Figure 3 shows a cut-off made in the (z, x) plane, observing the temperature distribution of the plume of air inside the furnace, after 869 s of the melting process was initiated. As seen in this representation, the direction of the flame is perpendicular to the surface of the bath. However, aluminium, as shown in this representation, does not correspond to a full operating cycle, but can be used to establish the operational point of view because the flame, regardless of whether or not the gas has a good re-circulation, impinges on the surface of the metal bath, probably causing oxidation losses during melting.
In Figure 4, changes in the angle and location of the burner with respect to the horizontal are shown. This is a burner configuration that allows better gas re-circulation. It is worth mentioning that other angles were considered for the simulation, i.e., 20°, 35°, and 40°. In this sense, observations arose demonstrating that an obstruction in the escape of the furnace chimney helped to preheat the mass of air stored at the end of the furnace, and the angles influenced this since the 45° inclination resulted in more hot gases reaching the bottom of the melting chamber. Figure 5 shows that an angle of 45° provokes a good re-circulation of the combustion gases through the system, with maximum velocities of 2.696~3 m/s, attained after a simulation time of 5200 s.
One of the most important results of the simulation is the measurement of velocity vectors, because the values determined are of paramount importance to controlling the fluid dynamics of the gas–air mixture. The velocity is dependent on the burner capacity. So, in turn, the capacity of the burner is controlled by the pressure used at that moment. In this sense, the velocity vectors are shown in Figure 6a, just at the beginning of the melting cycle, while the velocity vectors illustrated in Figure 6b attains after a simulation time of 4800 s. As it can be seen, after 4800 s the flame goes straight to the wall, allowing afterwards a rapid circulation due to the geometry of the wall. The velocity vectors in the main chamber are presented in Figure 7a, taking the image from the top of the furnace, while Figure 7b shows the temperature profiles along the melting tower after 3600 s of simulating time.
The results depicted in Figure 7 demonstrate that the flow pattern of the combustion gases is of the vortex type. Such results also show that the temperature distribution of the combustion gases along the melting tower does not attain enough temperature to heat this chamber faster, as 950 °C is the operating temperature. Aluminium has worked with regenerative burners, as the rapid exhaust of the combustion gases through the melting tower could be the cause for such an important inefficiency in the operation of the furnace [28]. Therefore, it is advisable to block off the chimney during the preheating furnace each time the melting tower is loaded. Regeneration of heat from the gases flowing to the combustion air increases the temperature of the air and the temperature of the flue gas diminishes. This reflects an increment of the accessible energy towards the metal bath considered as a net gain.
4.2. Temperature Profile
Following the above analyses, a temperature profile can be established from the inside to the outside of the furnace, so as to verify the insulating conditions attained from the physical properties of refractory materials, as of the design of their configuration. As a first approximation, to perform these simulations it was proceeded to establish boundary conditions from the inside, where the temperature held at 950 °C, to the outside of the furnace, and the temperature remained at 25 °C. The onset is gradual heating, up to attain the boundary condition, restricting the heating conditions on the surfaces of the main chamber (roof, walls, and floor). During the analysis, the values of the physical properties of the refractory concrete, the insulation and the ceramic blanket were considered, as to establish the temperature profile of the wall.
To simulate exposure to air at room temperature (25 °C), only the outer surfaces were selected. In this sense, Figure 8 shows the meshing drawn and temperature time curve for performing these simulations, while Figure 9 shows the temperature profiles of (a), at the outside of the furnace, and (b) at the inside of the furnace, for a simulation time of 3671 s. As shown in Figure 9, the configuration of insulating layers is sufficient to retain the heat in the main chamber. Note that the temperatures at the outside of the furnace are in the order from 52 to 112 °C.
Figure 10 depicts a cross-section of the reverberatory furnace including the melting tower, where the temperature profiles after a simulation time of 5400 s are observed. It is noteworthy that the charge inside the melting tower represents this by the rectangular box shown inside the melting tower in Figure 10. While the hot gases inside the melting chamber attain temperatures close to 950 °C, these gases allow preheating the charge inside the melting tower to temperatures around 800 °C, before they go through the chimney and pass to the atmosphere.
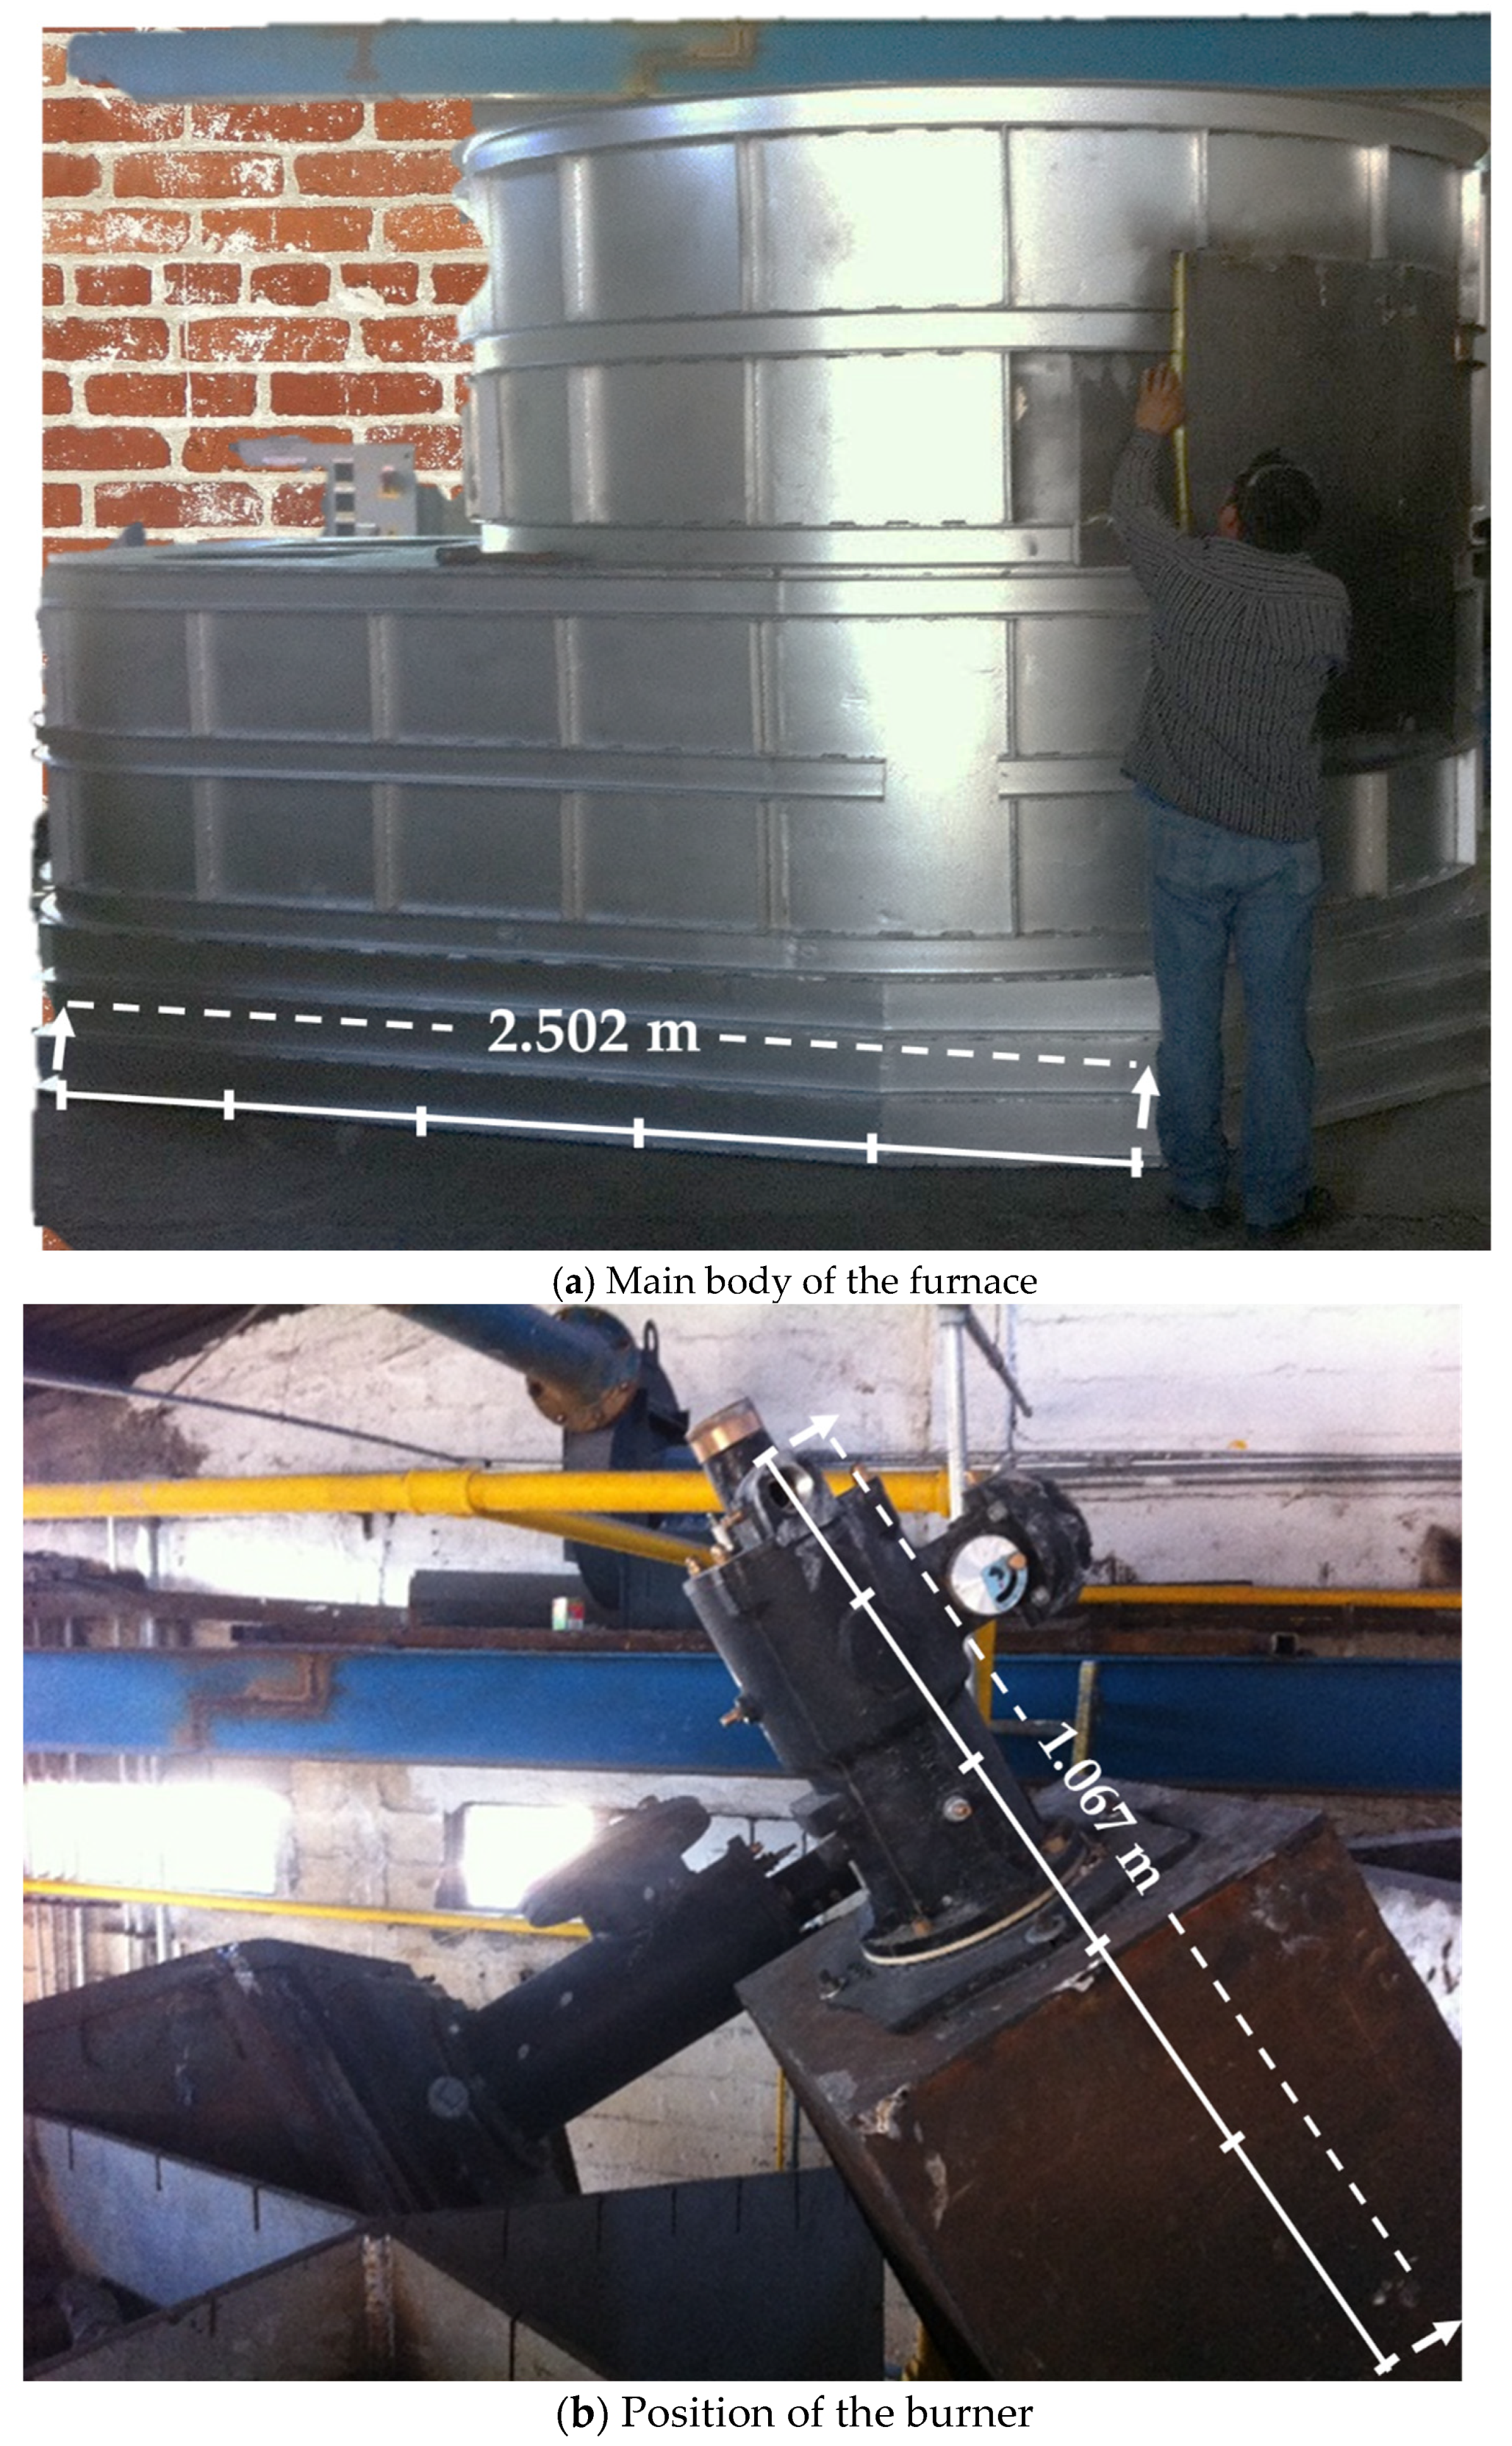
Shown in the results presented above, the burner position can be to optimize the design of the furnace, so as to ensure the heat capacity retention for sufficiency in the main chamber. With optimization, it is expected to melt more aluminium per hour, and less gas consumption per melting cycle. The chosen physical properties of the refractory materials were made suitable to avoid heat losses through the outer surface of the furnace. Thus, the furnace is constructed accordingly. It is expected to be in full operation shortly. Images of Figure 11 show a close-up of the furnace and the burner position at 45°, as suggested from the optimization through simulations. The furnace is located in a metallurgical plant in Mexico where all the experiments were carried out.
4.3. Optimization Conditions
For corroborating the results obtained from the finite element analysis out of the mathematical modelling, a number of tests were undertaken using experimental data with signal processing. This is to validate the model and to generalize results. Further, productivity measurements were made to compare the simulated results with previous production results. The comparisons are presented in Table 4. The measurements have been made for a full month, where the melting-metal units worked for 24 h during 6 consecutive days.
From Table 4, the optimized capacity is expected to be doubled, thanks to the modifications made to the furnace design. This is mainly attributed to the improvement made to the dynamic conditions attained. The optimization to the geometry of the furnace led to an increase in the average production for an up to 53% efficiency gain on the process and optimal conditions compared to the previous stage, where the maximum average production was 7.5 tons a day. Optimization also reflected on the capacity to process the aluminium chip, since after the modifications the increment reflects 1.2 tons/h, this is 0.7 ton/h more than before. The furnace modification also led to a 58% efficiency gain. The corresponding increment for the thick aluminium chip after modifications to the furnace is 0.6 ton/day when reaching the maximum capacity, yielding a 10% efficiency gain on the aluminium processing.
When analysing the results of the Mg removal, in weight %, we have considered that a company uses granulated sodium silicofluoride (Na2SiF6) as a Mg removal agent, where the size of particles is of 1 mm in a proportion of 3 to 1, combined with sodium and potassium chlorides (NaCl plus KCl), sodium carbonate (Na2CO3), and sodium nitrate (NaNO3). In this combination 33% NaCl + KCl, 33% Na2SiF6, 15% Na2CO3, and the rest is NaNO3. For such a process, the alloy A380.1 requires to be elaborated, and this alloy must contain less than 0.20% of Mg according to the ASM standard. The optimization made to the furnace through simulations also allowed the company to reach the specifications of having less than 0.20% of Mg. Before optimization, this was 0.2%, which made it difficult for the process of melting the standard. Following optimization, Mg has decreased to 0.15%, satisfying the requirements and standards. Solving such problem gave us the opportunity to consider the changes in the burner position and geometries for combustion inside the melting chamber, therefore, meeting the objective function stated in Section 4, i.e., minimizing the Mg concentration present in the alloy.
Worth to mention that in this process, the scrap used is mainly provided by the automotive industry, where inside the process the aforementioned aluminium chip enters through the stirrers area, and the aluminium chip thick enters through the chimney, so as to benefit from the heat produced by the combustion gases, making the processed energy more efficient.
5. Conclusions
In this paper, a mathematical model has been established to address precondition challenges in simulation and optimization for aluminium furnace design. Both heat balance and numerical simulations have been developed to facilitate the design and configuration of the furnace for achieving objectives set for an industrial level operation. With the model and simulation, optimization becomes achievable for the highest thermal efficiency in the furnace design.
Following the obtained results, a configuration of the burner of 45° in respect to the horizontal axis has allowed obtaining better re-circulation of the combustion gases generated by the burner in the melting chamber and through the melting tower. Optimal distribution of gases has been obtained, with heating geometry of the furnace (6.40 m) allowing heat through the optimized system. The velocity and temperature profiles obtained indicate that the operating conditions of such a round shaped reverberatory furnace can lead to performing most efficient melting cycles, no greater than 90 min for melting, and holding a molten aluminium charge of 1000 kg, which provides new insight into aluminium processing. This also supports the idea that the high insulating conditions attained by the arrangement of refractory materials can indeed maintain the heat at 950 °C in 3671 s, reflecting minimal heat losses through the outer surface of the furnace.
The modelling and simulation have allowed a proper design for constructing an improved and optimal performance reverberatory furnace with lower costs reflected on less difficult ways of constructing the furnace and long-term thermal efficiency. Through the finite element analysis, we have been able to optimize the furnace by giving the correct position and angle of the burner chamber. The percentage of Mg and the capacity for processing the aluminium alloy A380.1 are thus also addressed in this paper. The real industrial process can now benefit from these efficient ways of melting the aluminium and increasing production significantly. In particular, 20% of thick aluminium chips and 58% of regular chips can now be processed after optimization. An increase of 53% on the average production is also reflected after concluding the modifications of the furnace. This has led to producing a double amount of aluminium and to refining the alloy until reaching a double Mg removal rate. Finally, the temperature profiles have helped optimize operations for minimum energy losses.
Author Contributions
Conceptualization A.A.F.S., A.F.V. and R.J.M.; methodology, A.A.F.S., A.F.V. and R.J.M.; software A.A.F.S. and R.J.M.; validation, A.A.F.S., A.F.V. and R.J.M.; formal analysis, A.A.F.S., A.F.V. and R.J.M.; investigation, A.A.F.S., A.F.V., R.J.M., J.T.T. and R.M.O.P.; resources A.F.V. and Y.L.; data curation, A.A.F.S., A.F.V. and Y.L.; writing—original draft preparation, A.A.F.S., A.F.V., R.J.M.; writing—review and editing, A.A.F.S., A.F.V., R.J.M., J.T.T., R.M.O.P. and Y.L.; visualization, A.A.F.S., A.F.V. and Y.L.; supervision, A.F.V. and Y.L.; project administration, A.F.V. and J.T.T.; funding acquisition, A.F.V. All authors have read and agreed to the published version of the manuscript.
Funding
This research was funded by CONACYT, under the C0003V-2013-1 PROINNOVA Coahuila State grant. This work was supported by the Ministry of Science and Technology of China as part of a National Key Project (Grant No. 2018YFB1003203).
Data Availability Statement
Not applicable.
Acknowledgments
All the authors would like to thank FUNDICIÓN J.V. S.A. de C.V., especially its director, José de Jesus Velázquez Rodríguez, for allowing conduct the project in their facilities. A.F.V., R.J.M., J.T.T and R.M.O.P., would like to thank CONACYT for the financial support. A.A.F.S., and Y.L., would like to thank the Ministry of Science and Technology of China for their financial support.
Conflicts of Interest
The authors declare no conflict of interest.
Appendix A
Mathematical Symbols and Units Used
| Mathematical Expression | Equation Number | Description | Units |
| (1) | Fluid density | kg/m3 | |
| (1) | Time | s | |
| (1) | Flow velocity vector field | m/s | |
| (2) | Momentum per unit volume | kg⋅m/s | |
| (2) | gravitational force per unit volume | m/s2 | |
| (2) | Stress tensor | N/m2 | |
| (2) | Molecular viscosity | kg⋅m⋅s | |
| (2) | Bulk viscosity coefficient | kg⋅m⋅s | |
| (9) | Internal energy | kcal | |
| h | (9) | Enthalpy value | kJ/kg |
| (10) | Turbulent kinetic energy | m2/s2 | |
| (10) | Production of turbulence kinetic energy | m2/s3 | |
| (10) | Rate of turbulent kinetic energy dissipation | m2/s3 | |
| (11) | Concentration constant | ||
| (12) | Eddy viscosity | kg·m−1·s−1 | |
| (14) | FEM shape function i | ||
| (17) | Dynamic viscosity | kg/s·m | |
| (18) | Moment | kg·m2/s2 | |
| (18) | Deformation rate tensor | N/m2 | |
| (18) | Source term for gravity vector | ||
| (18) | Source term for density | ||
| (19) | Angle | ||
| (20) | Coefficient for continuity | ||
| (20) | Nodal velocities | m/s | |
| (20) | Tangential friction factor, generic variable | ||
| (24) | Source term for internal energy | ||
| (24) | Source term for density |
Appendix B
Modelling Assumptions
The following list shows the assumptions used for the simulation and for obtaining the mathematical model of the furnace.
- Pressure gradients at continuous rate
- Furnace inner wall at an initial temperature of 950 °C
- Air inside the furnace at an initial temperature of 750 °C
- Room temperature 20 °C
- A boundary condition is selected of “air cooling” at a temperature of 20 °C
- Air properties were selected a temperature range of 20 to 1000 °C such as thermic conductivity (Wm/K), density (kg/m2), specific heat (KJ, Kg/Kg-K), and Newtonian viscosity (centipoise)
- The geometry of the processing aluminium chip used was spherical shape of 1 cm of diameter.
- The chemical composition of the aluminium chip used for the simulation was a homogeneous mix according to the AA390 norm.
References
- Qiu, L.; Feng, Y.; Chen, Z.; Li, Y.; Zhang, X. Numerical simulation and optimization of the melting process for the regenerative aluminum melting furnace. Appl. Therm. Eng. 2018, 145, 315–327. [Google Scholar] [CrossRef]
- Grachev, V. Aluminium Alloys Smelting in Shaft-Reverberatory Furnaces in a Liquid Bath Mode. Arch. Foundry Eng. 2017, 17, 183–189. [Google Scholar] [CrossRef]
- Heugenhauser, S.; Kaschnitz, E.; Schumacher, P. Development of an aluminum compound casting process—Experiments and numerical simulations. J. Mater. Process. Technol. 2020, 279, 116578. [Google Scholar] [CrossRef]
- Zhan, X.; Wang, Z.; Li, M.; Hu, Q.; Chen, J. Investigations on failure-to-fracture mechanism and prediction of forming limit for aluminum alloy incremental forming process. J. Mater. Process. Technol. 2020, 282, 116687. [Google Scholar] [CrossRef]
- Jepson, S.; Kim, H. Calculated Aluminum Oxidation Rates during Rotary Furnace Melting through Flue Gas Analysis—Part Two. In Light Metals 2016; Williams, E., Ed.; Springer International Publishing: Berlin/Heidelberg, Germany, 2016; pp. 767–771. [Google Scholar]
- Wei, X.; Wang, H.; Liu, C.; Cao, H.; Yan, P.; Sun, Z. A review on recycling of waste aluminum alloy. A review on recycling of waste/Chin. J. Process. Eng. 2019, 19, 45–54. [Google Scholar]
- Haraldsson, J.; Johansson, M.T. Review of measures for improved energy efficiency in production-related processes in the aluminium industry—From electrolysis to recycling. Renew. Sustain. Energy Rev. 2018, 93, 525–548. [Google Scholar] [CrossRef] [Green Version]
- Brimmo, A.T.; Hassan, M.I. Furnace Modeling for Efficient Combustion Gas Circulation. In Light Metals 2016; Williams, E., Ed.; Springer International Publishing: Berlin/Heidelberg, Germany, 2016; pp. 757–761. [Google Scholar]
- Wan, B.; Chen, W.; Mao, M.; Fu, Z.; Zhu, D. Numerical simulation of a stirring purifying technology for aluminum melt. J. Mater. Process. Technol. 2018, 251, 330–342. [Google Scholar] [CrossRef]
- Sviželová, J.; Tkadlečková, M.; Michalek, K.; Walek, J.; Saternus, M.; Pieprzyca, J.; Merder, T. Numerical Modelling Of Metal Melt Refining Process In Ladle With Rotating Impeller And Breakwaters. Arch. Metall. Mater. 2019, 64, 659–664. [Google Scholar]
- Brimmo, A.T.; Hassan, M.I.; Shatilla, Y. Transient heat transfer computational model for the stopped aluminium reduction pot —Cooling techniques evaluation. Appl. Therm. Eng. 2014, 73, 116–127. [Google Scholar] [CrossRef]
- Popa, M.; Sava, I.; Petre, M.; Ducu, C.; Moga, S.; Nicola, A.-V.; Drăghici, C.-N. Coupled Fluid Flow and Heat Transfer Analysis of Ageing Heat Furnace. In Book Coupled Fluid Flow and Heat Transfer Analysis of Ageing Heat Furnace; Springer International Publishing: Berlin/Heidelberg, Germany, 2019; pp. 279–284. [Google Scholar]
- Hassan, M.I.; Brimmo, A.T. CFD Comparison of Immersed Heater and Open Fire Burner Designs for Casting Furnaces. In Light Metals 2015; Hyland, M., Ed.; Springer International Publishing: Berlin/Heidelberg, Germany, 2016; pp. 915–920. [Google Scholar]
- Niehoff, T.; Viyyuri, S. Oxyfuel Optimization using CFD Modeling. In Light Metals 2011; Lindsay, S.J., Ed.; Springer International Publishing: Berlin/Heidelberg, Germany, 2016; pp. 1185–1187. [Google Scholar]
- Walter, G.; Kiss, L.; Charette, A.; Goutière, V. Flame Object Heat Transfer using Different Burner Types and Orientations. TMS Light Met. 2006, 2006, 741–746. [Google Scholar]
- Li, T.X.; Hassan, M.; Kuwana, K.; Saito, K.; Viswanathan, S.; Han, Q.; King, P. Thermodynamic analyses of energy utilization and pollutant formation control in secondary aluminum melting furnaces. In Proceedings of the Technical Sessions Presented by the Materials Processing and Manufacturing Division of TMS, San Diego, CA, USA, 2–6 March 2003. [Google Scholar]
- Golchert, B.; Ridenour, P.; Walker, W.; Selvarasu, N.K.; Gu, M.; Zhou, C.Q. Effect of Nitrogen and Oxygen Concentration on NOx Emissions in an Aluminum Furnace. In Effect of Nitrogen and Oxygen Concentration on NOx Emissions in an Aluminum Furnace; ASME: New York, NY, USA, 2006; pp. 323–333. [Google Scholar]
- Juárez, R.; Flores, A.; Macias, E.; Reyes, N. Análisis del comportamiento de flujo de fluidos en un horno de reverbero agitado con diferentes impulsores, mediante la modelación física y numérica. Rev. De Metal. 2009, 45, 384–396. [Google Scholar] [CrossRef]
- Viswanath, A.; Manu, M.V.; Savithri, S.; Pillai, U.T.S. Numerical simulation and experimental validation of free surface flows during low pressure casting process. J. Mater. Process. Technol. 2017, 244, 320–330. [Google Scholar] [CrossRef]
- Humphreys, N.J.; McBride, D.; Shevchenko, D.M.; Croft, T.N.; Withey, P.; Green, N.R.; Cross, M. Modelling and validation: Casting of Al and TiAl alloys in gravity and centrifugal casting processes. Appl. Math. Model. 2013, 37, 7633–7643. [Google Scholar] [CrossRef]
- Malikov, Z.M. Mathematical model of turbulent heat transfer based on the dynamics of two fluids. Appl. Math. Model. 2021, 91, 186–213. [Google Scholar] [CrossRef]
- Patankar, S.V. Computational modeling of flow and heat transfer in industrial applications. Int. J. Heat Fluid Flow 2002, 23, 222–231. [Google Scholar] [CrossRef]
- Wang, Z.H.; Wang, J.; Yu, L.B.; Wu, J.; Wang, M.; Su, B. Numerical Simulation and Process Optimization of Vacuum Investment Casting for Be–Al Alloys. Int. J. Met. 2019, 13, 74–81. [Google Scholar] [CrossRef]
- Ragab, K.A.; Bouaicha, A.; Bouazara, M. Optimization of Casting Design Parameters on Fabrication of Reliable Semi-Solid Aluminum Suspension Control Arm. J. Mater. Eng. Perform. 2017, 26, 4450–4461. [Google Scholar] [CrossRef]
- Bazhenov, V.E.; Koltygin, A.V.; Fadeev, A.V. The use of the ProCast software to simulate the process of investment casting of alloy based on titanium aluminide TNM-B1 into ceramic molds. Russ. J. Non-Ferr. Met. 2014, 55, 15–19. [Google Scholar] [CrossRef]
- Skripalenko, M.M.; Bazhenov, V.E.; Romantsev, B.A.; Skripalenko, M.N.; Huy, T.B.; Gladkov, Y.A. Mannesmann piercing of ingots by plugs of different shapes. Mater. Sci. Technol. 2016, 32, 1712–1720. [Google Scholar] [CrossRef]
- Skripalenko, M.M.; Romantsev, B.A.; Bazhenov, V.E.; Tran, B.H.; Skripalenko, M.N.; Galkin, S.P.; Savonkin, M.B.; Gladkov, Y.A. Computer Simulation of Mannesmann Piercing of Aluminium Alloy Ingots. Russ. J. Non-Ferr. Met. 2019, 60, 27–34. [Google Scholar] [CrossRef]
- Hassan, M.I.; Al Kindi, R. Feasibility Study of Regenerative Burners in Aluminum Holding Furnaces. JOM 2014, 66, 1603–1611. [Google Scholar] [CrossRef]
Figure 1.
(a) Schematic of the reverberatory furnace and melting tower, (b) cut-offs of the main parts of the furnace.
Figure 1.
(a) Schematic of the reverberatory furnace and melting tower, (b) cut-offs of the main parts of the furnace.
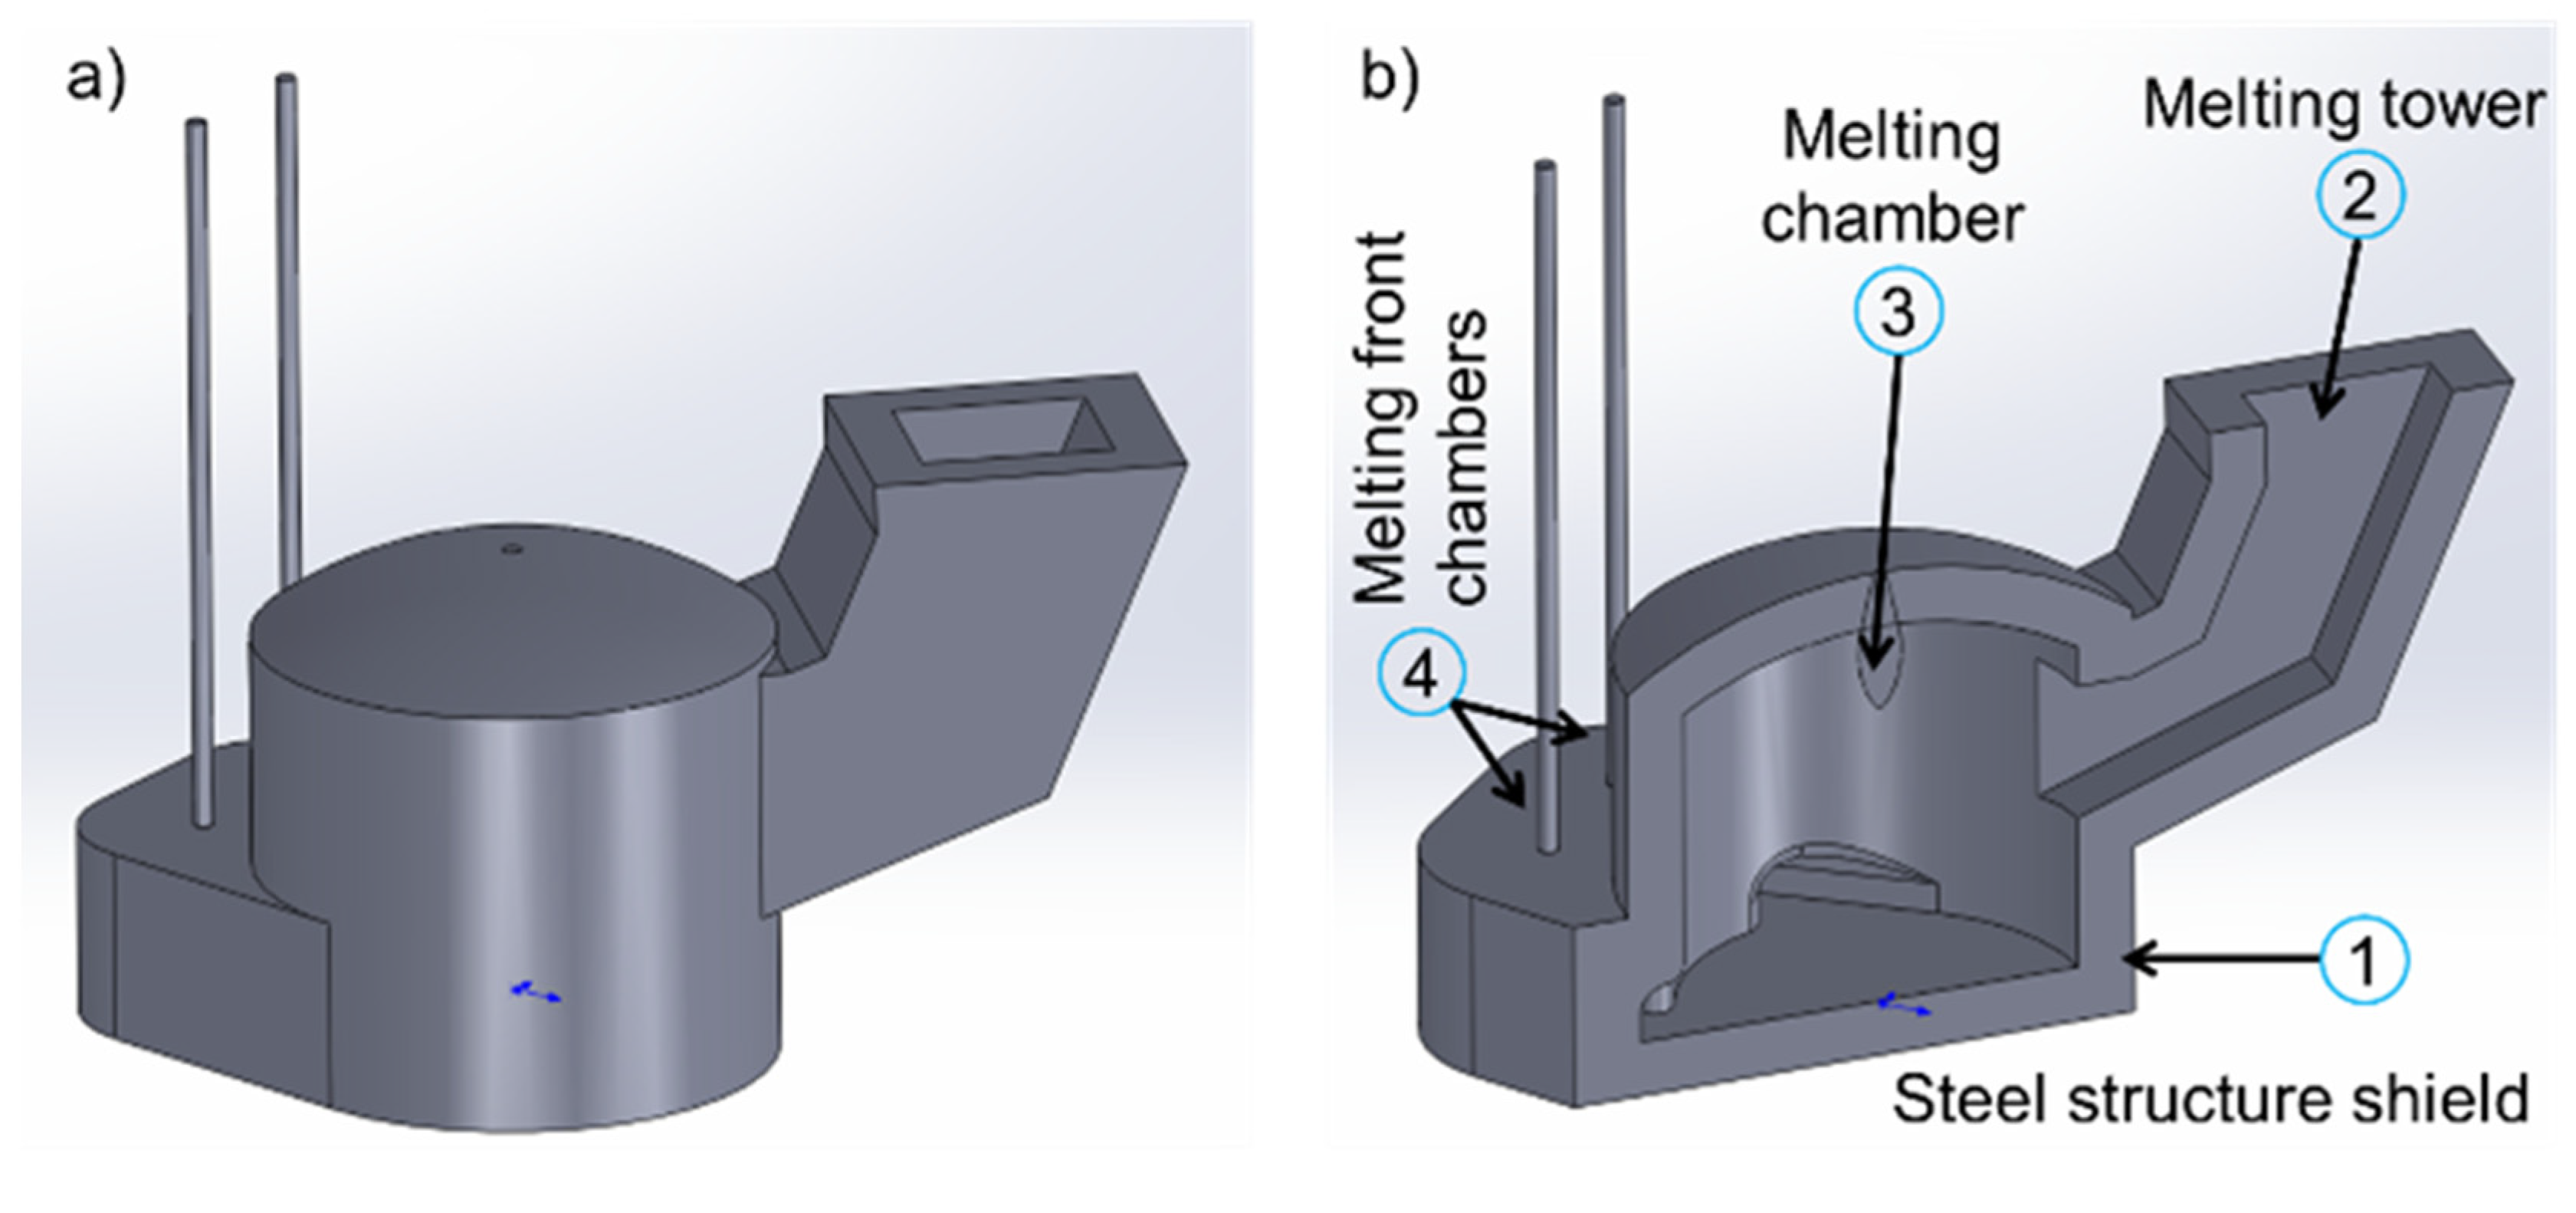
Figure 2.
Meshing of the Finite Element Model.
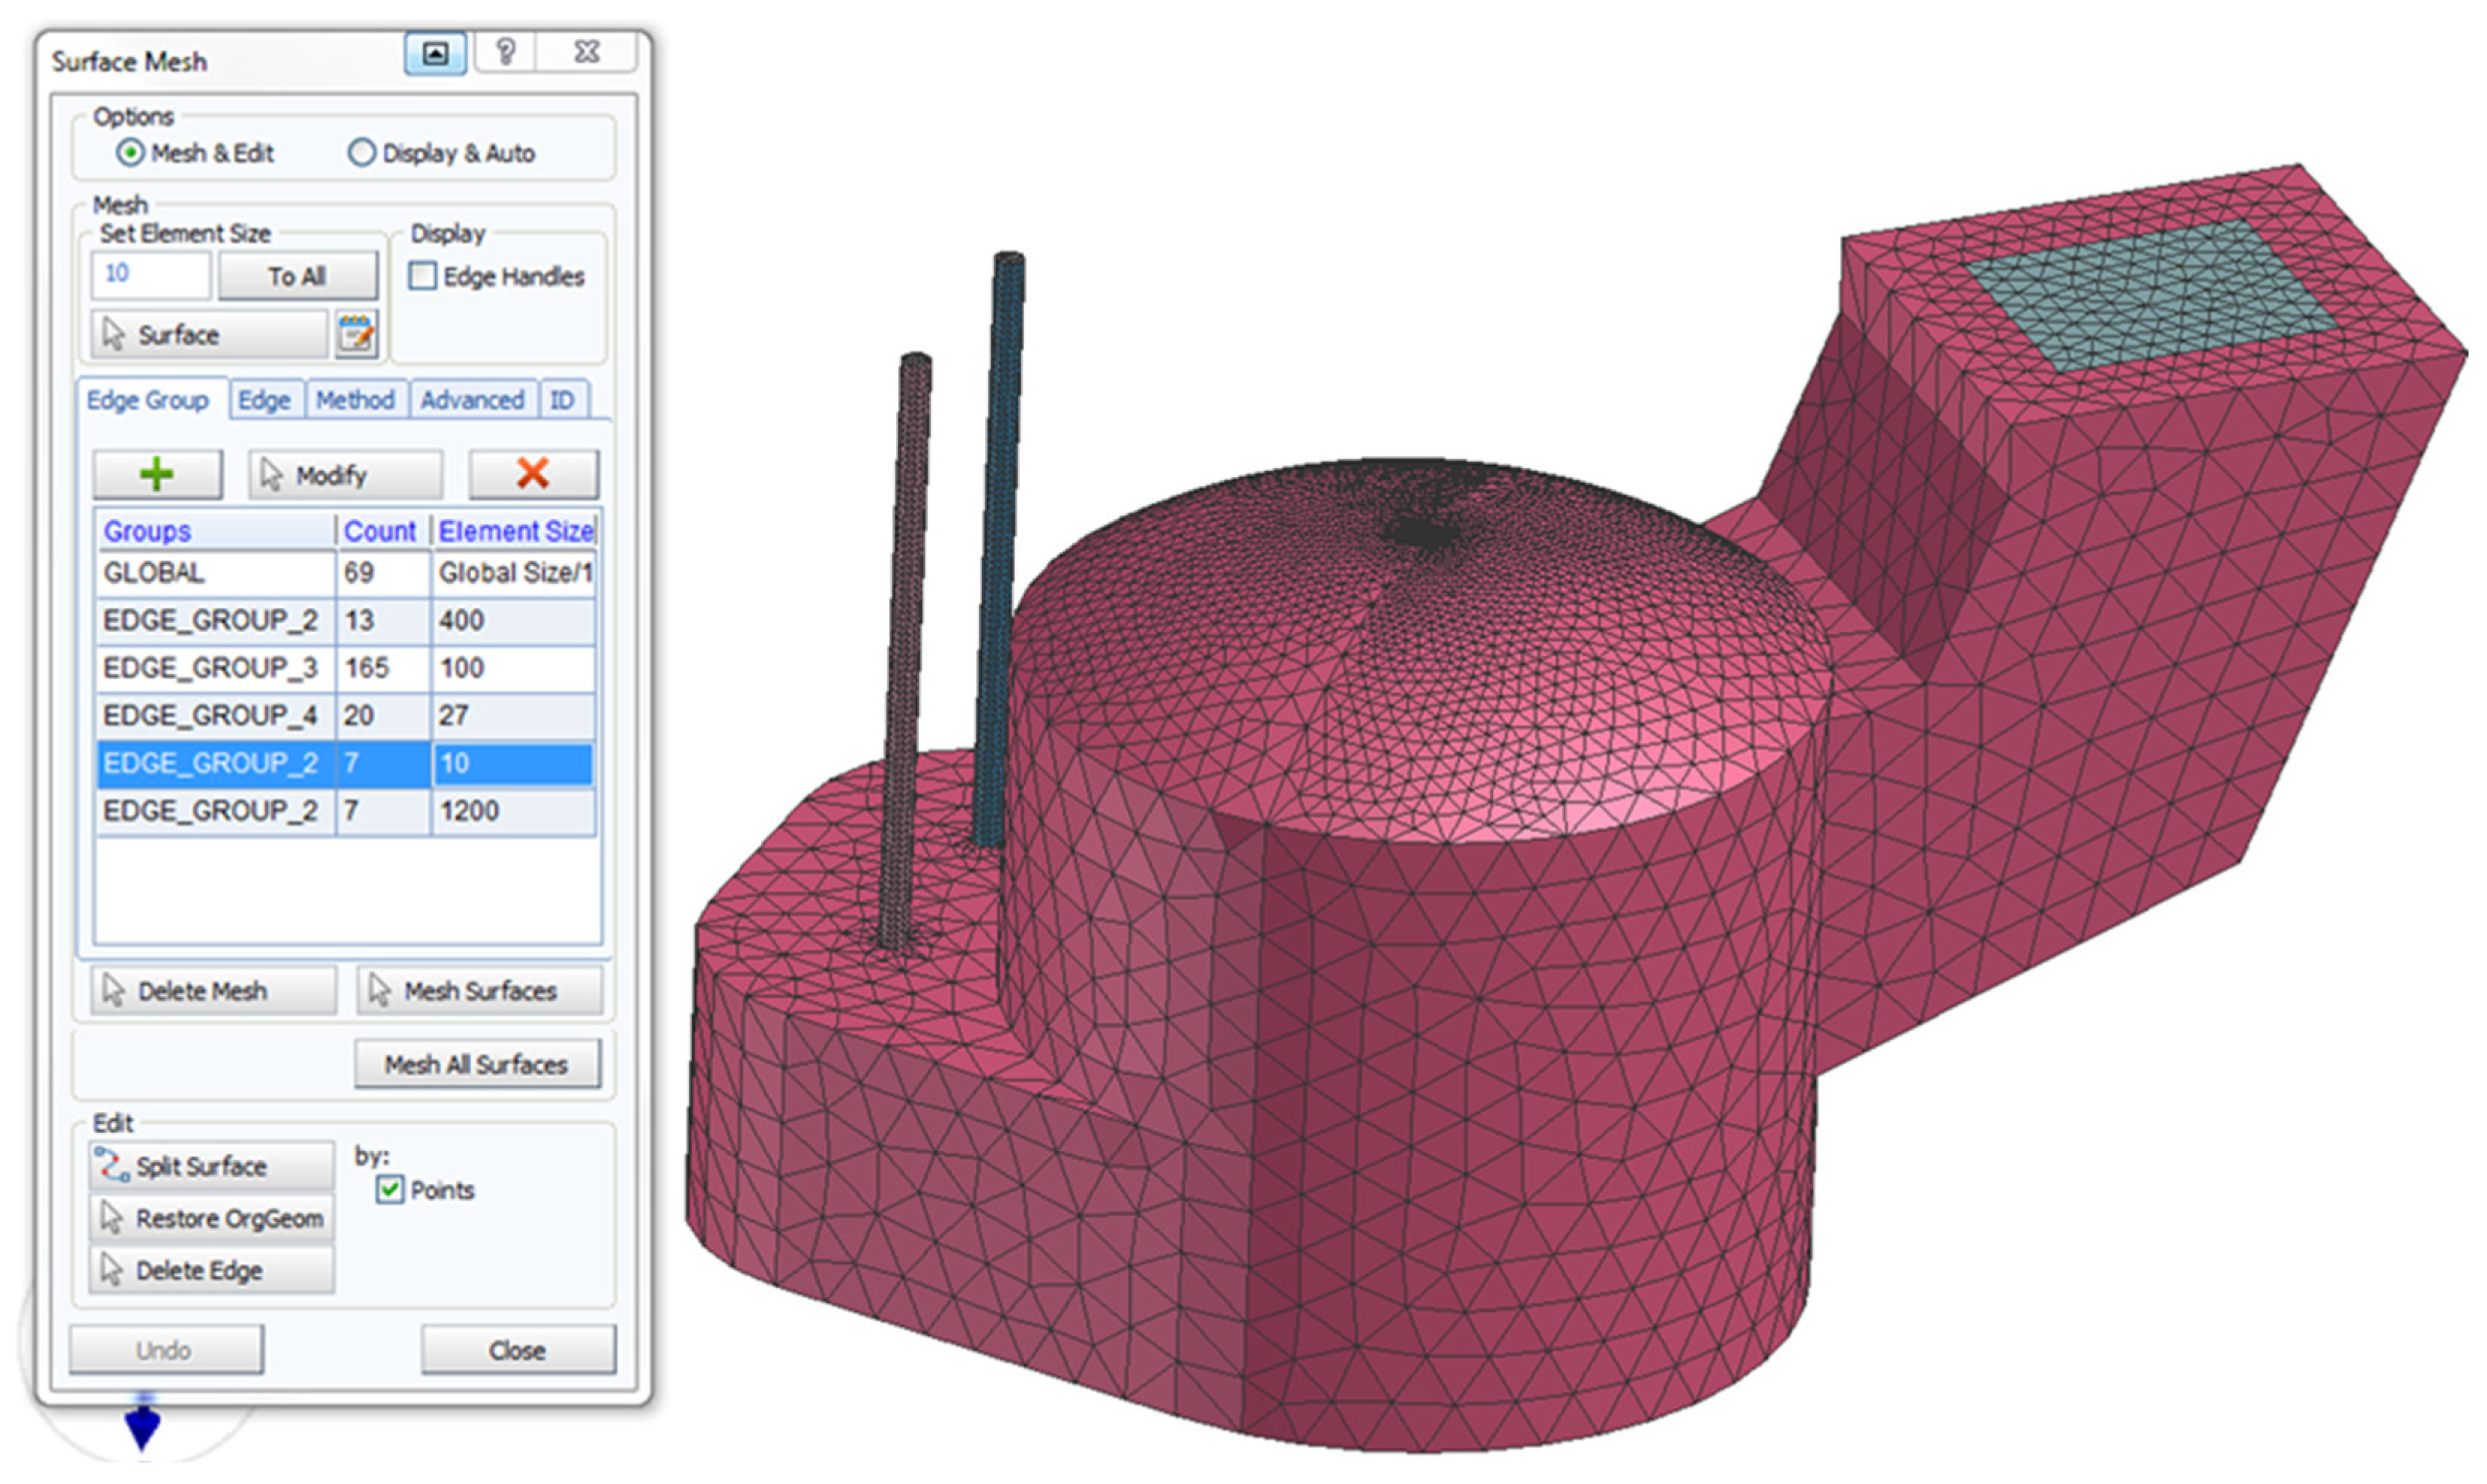
Figure 3.
Temperature profile of the gases within the main chamber, after 869 s of simulation.
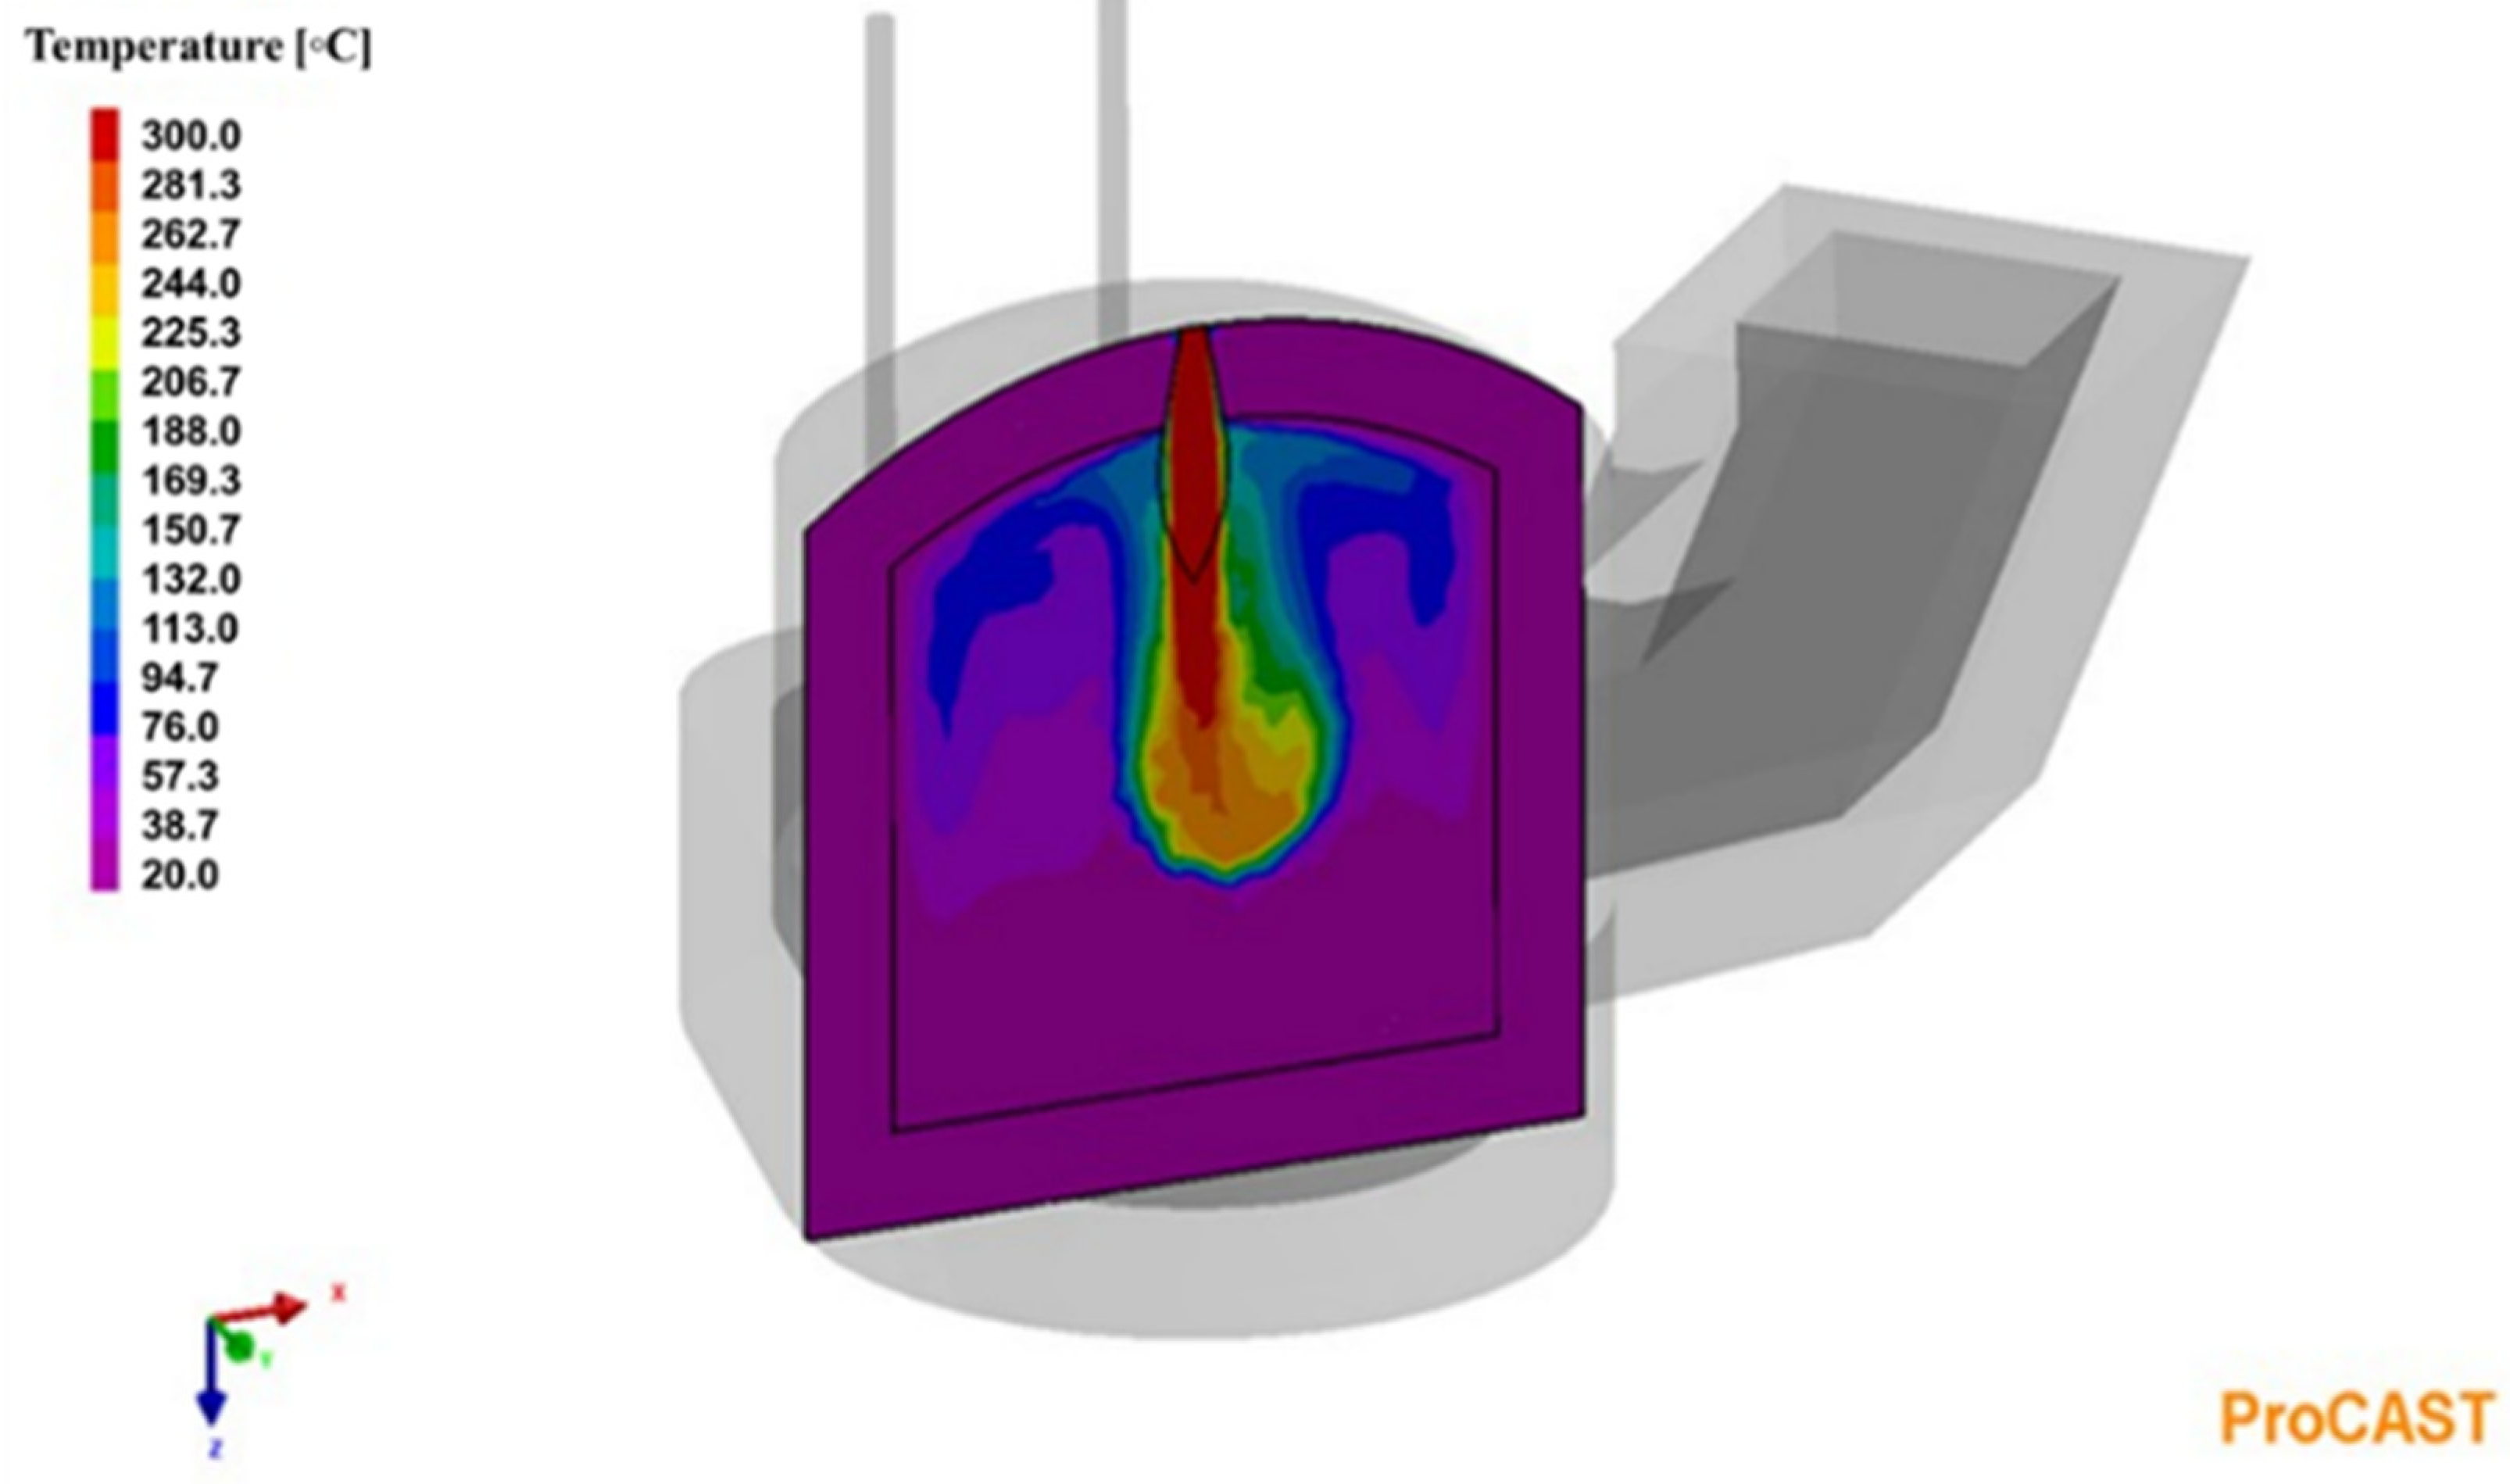
Figure 4.
Angle and position of the burner, (a) front view and (b) top view.
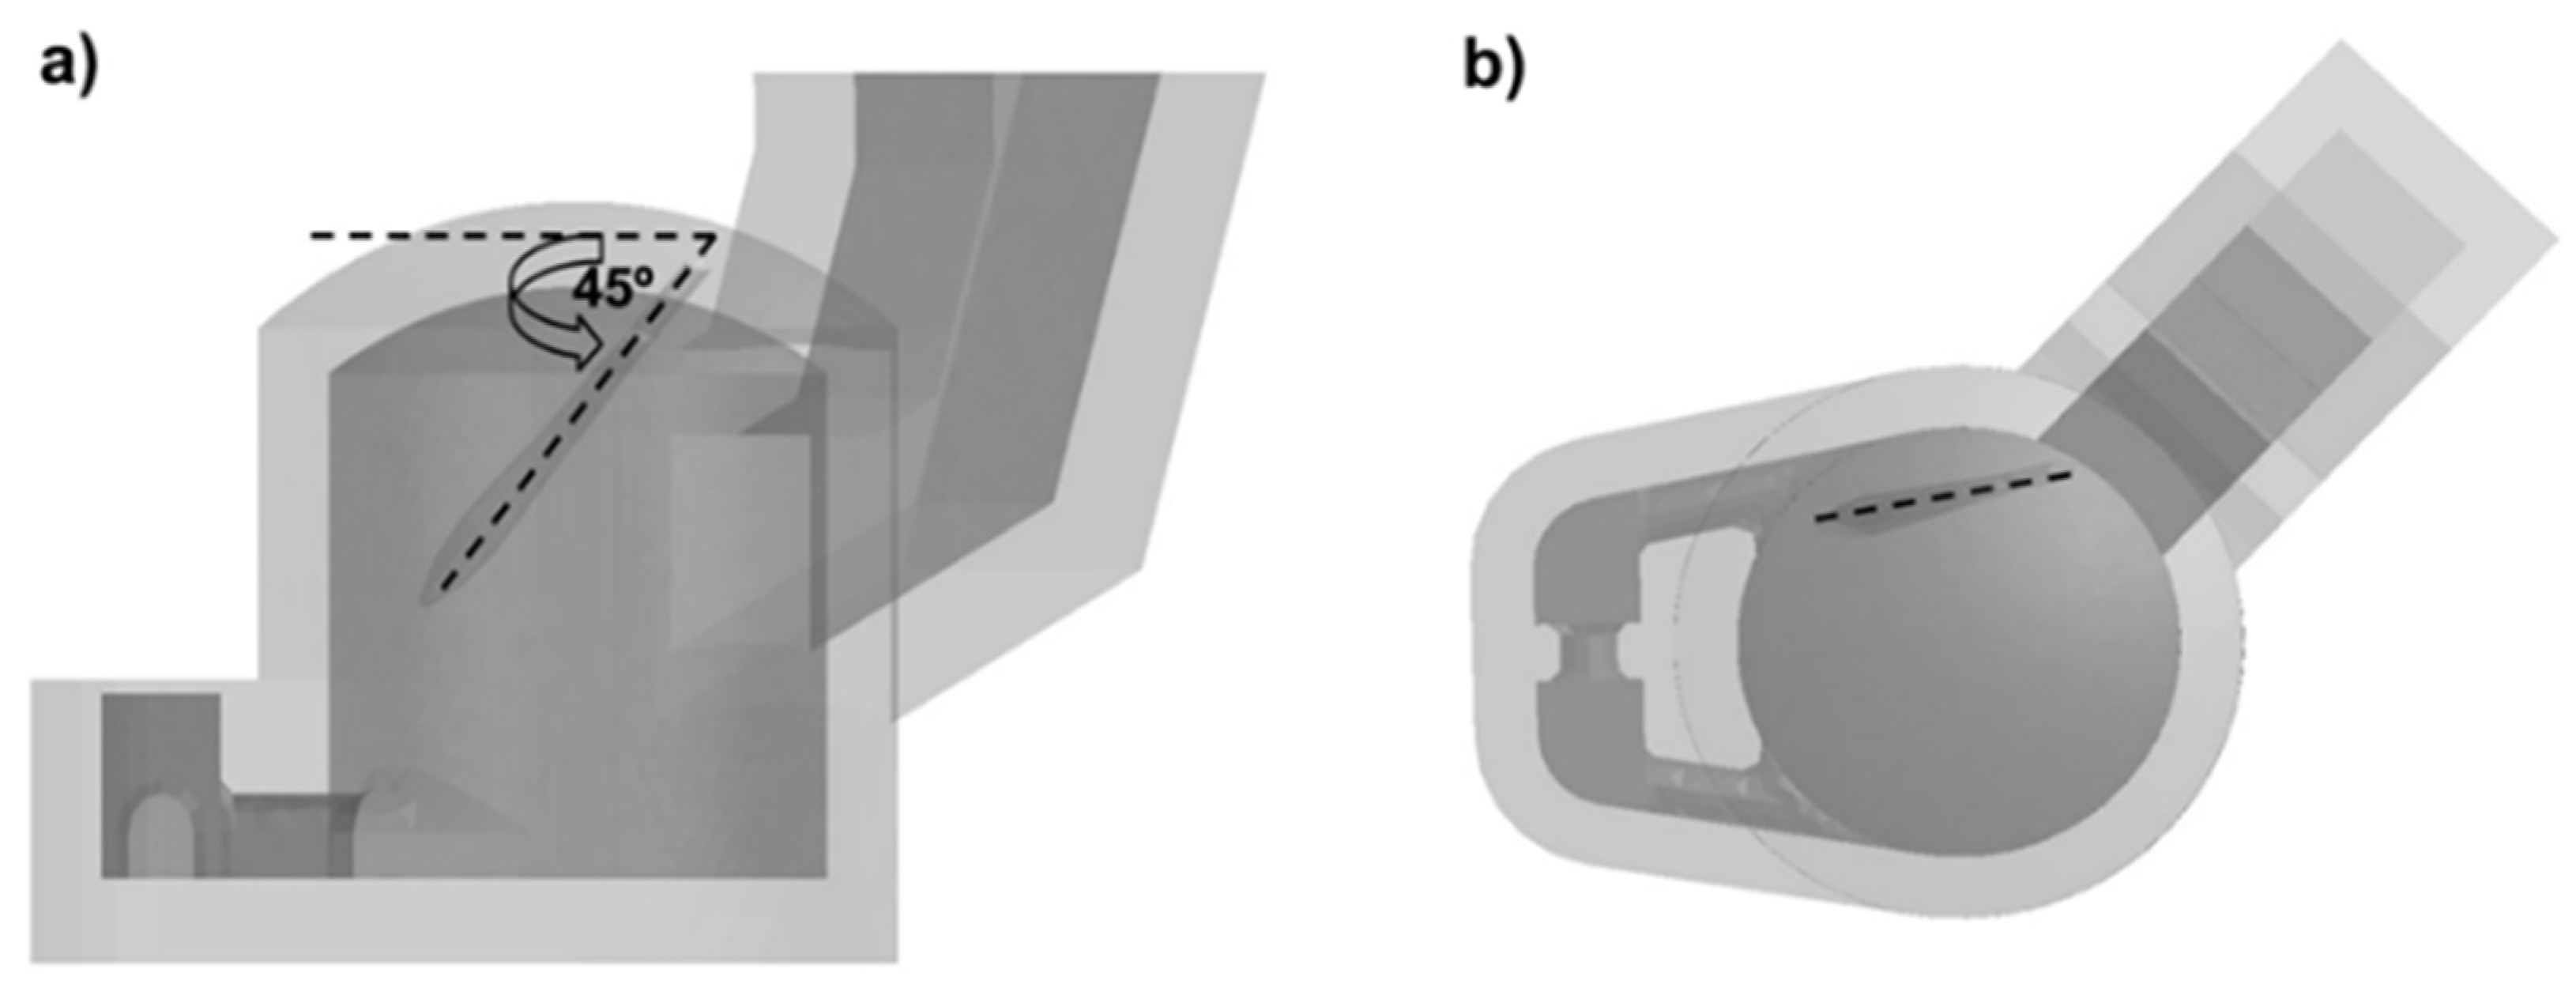
Figure 5.
Velocity vectors of the flue gases for a burner position of 45° related to the horizontal line, for a simulation time of 5200 s.
Figure 5.
Velocity vectors of the flue gases for a burner position of 45° related to the horizontal line, for a simulation time of 5200 s.

Figure 6.
(a) Velocity vectors in the main chamber just initiating the melting cycle; (b) velocity vectors acquired for a simulation time of 4800 s.
Figure 6.
(a) Velocity vectors in the main chamber just initiating the melting cycle; (b) velocity vectors acquired for a simulation time of 4800 s.
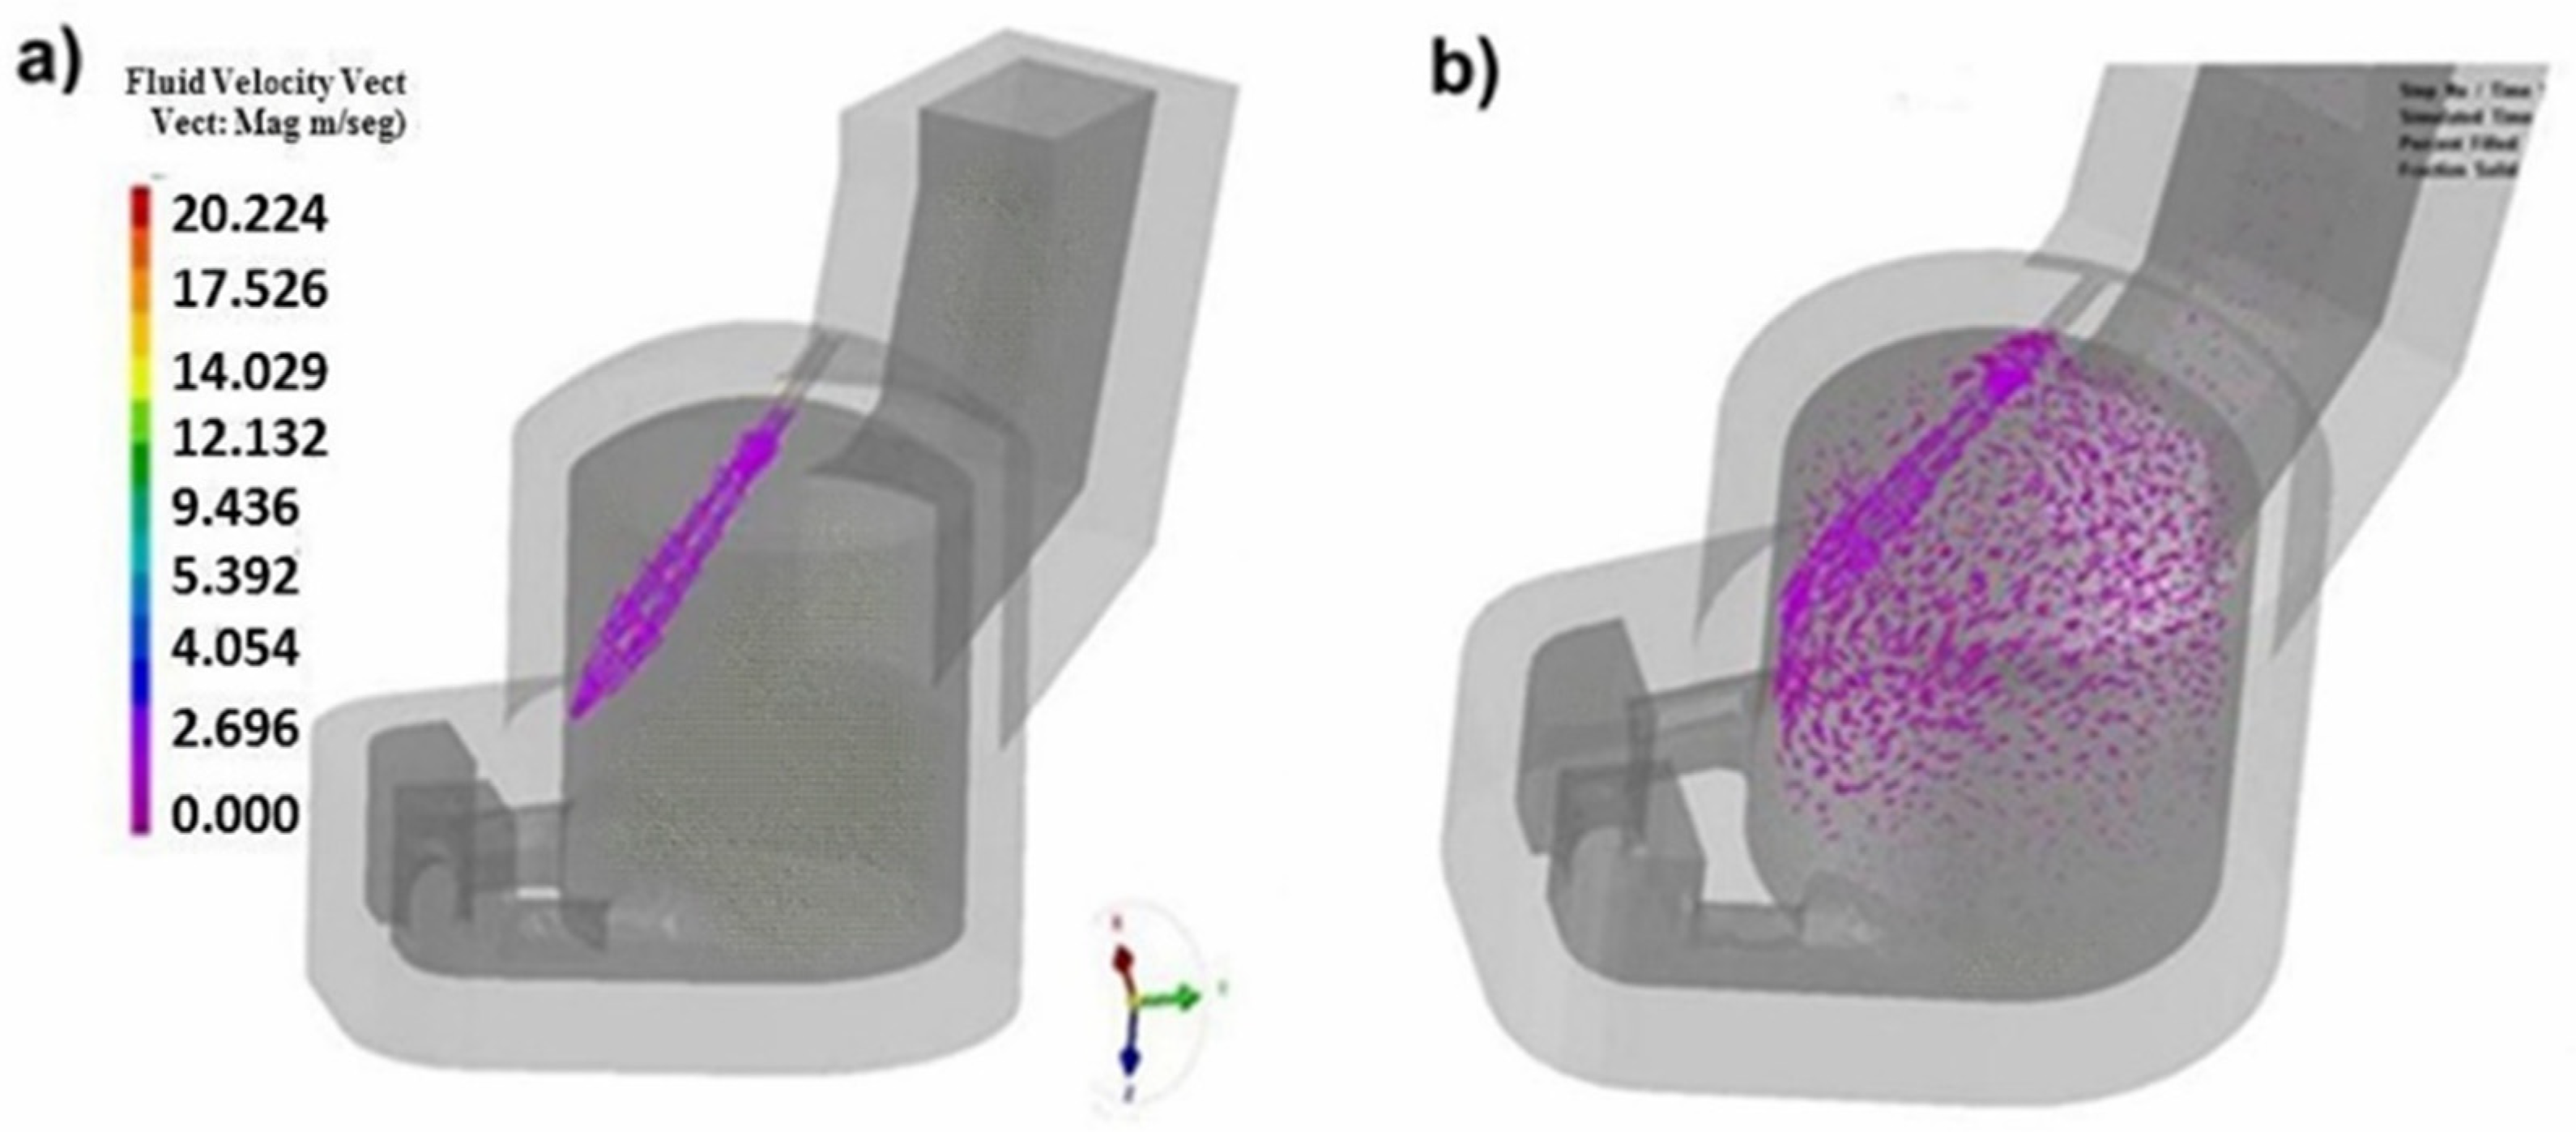
Figure 7.
(a) Velocity vectors from inside the furnace; (b) temperature profiles along the melting tower after 3600 of simulating time.
Figure 7.
(a) Velocity vectors from inside the furnace; (b) temperature profiles along the melting tower after 3600 of simulating time.
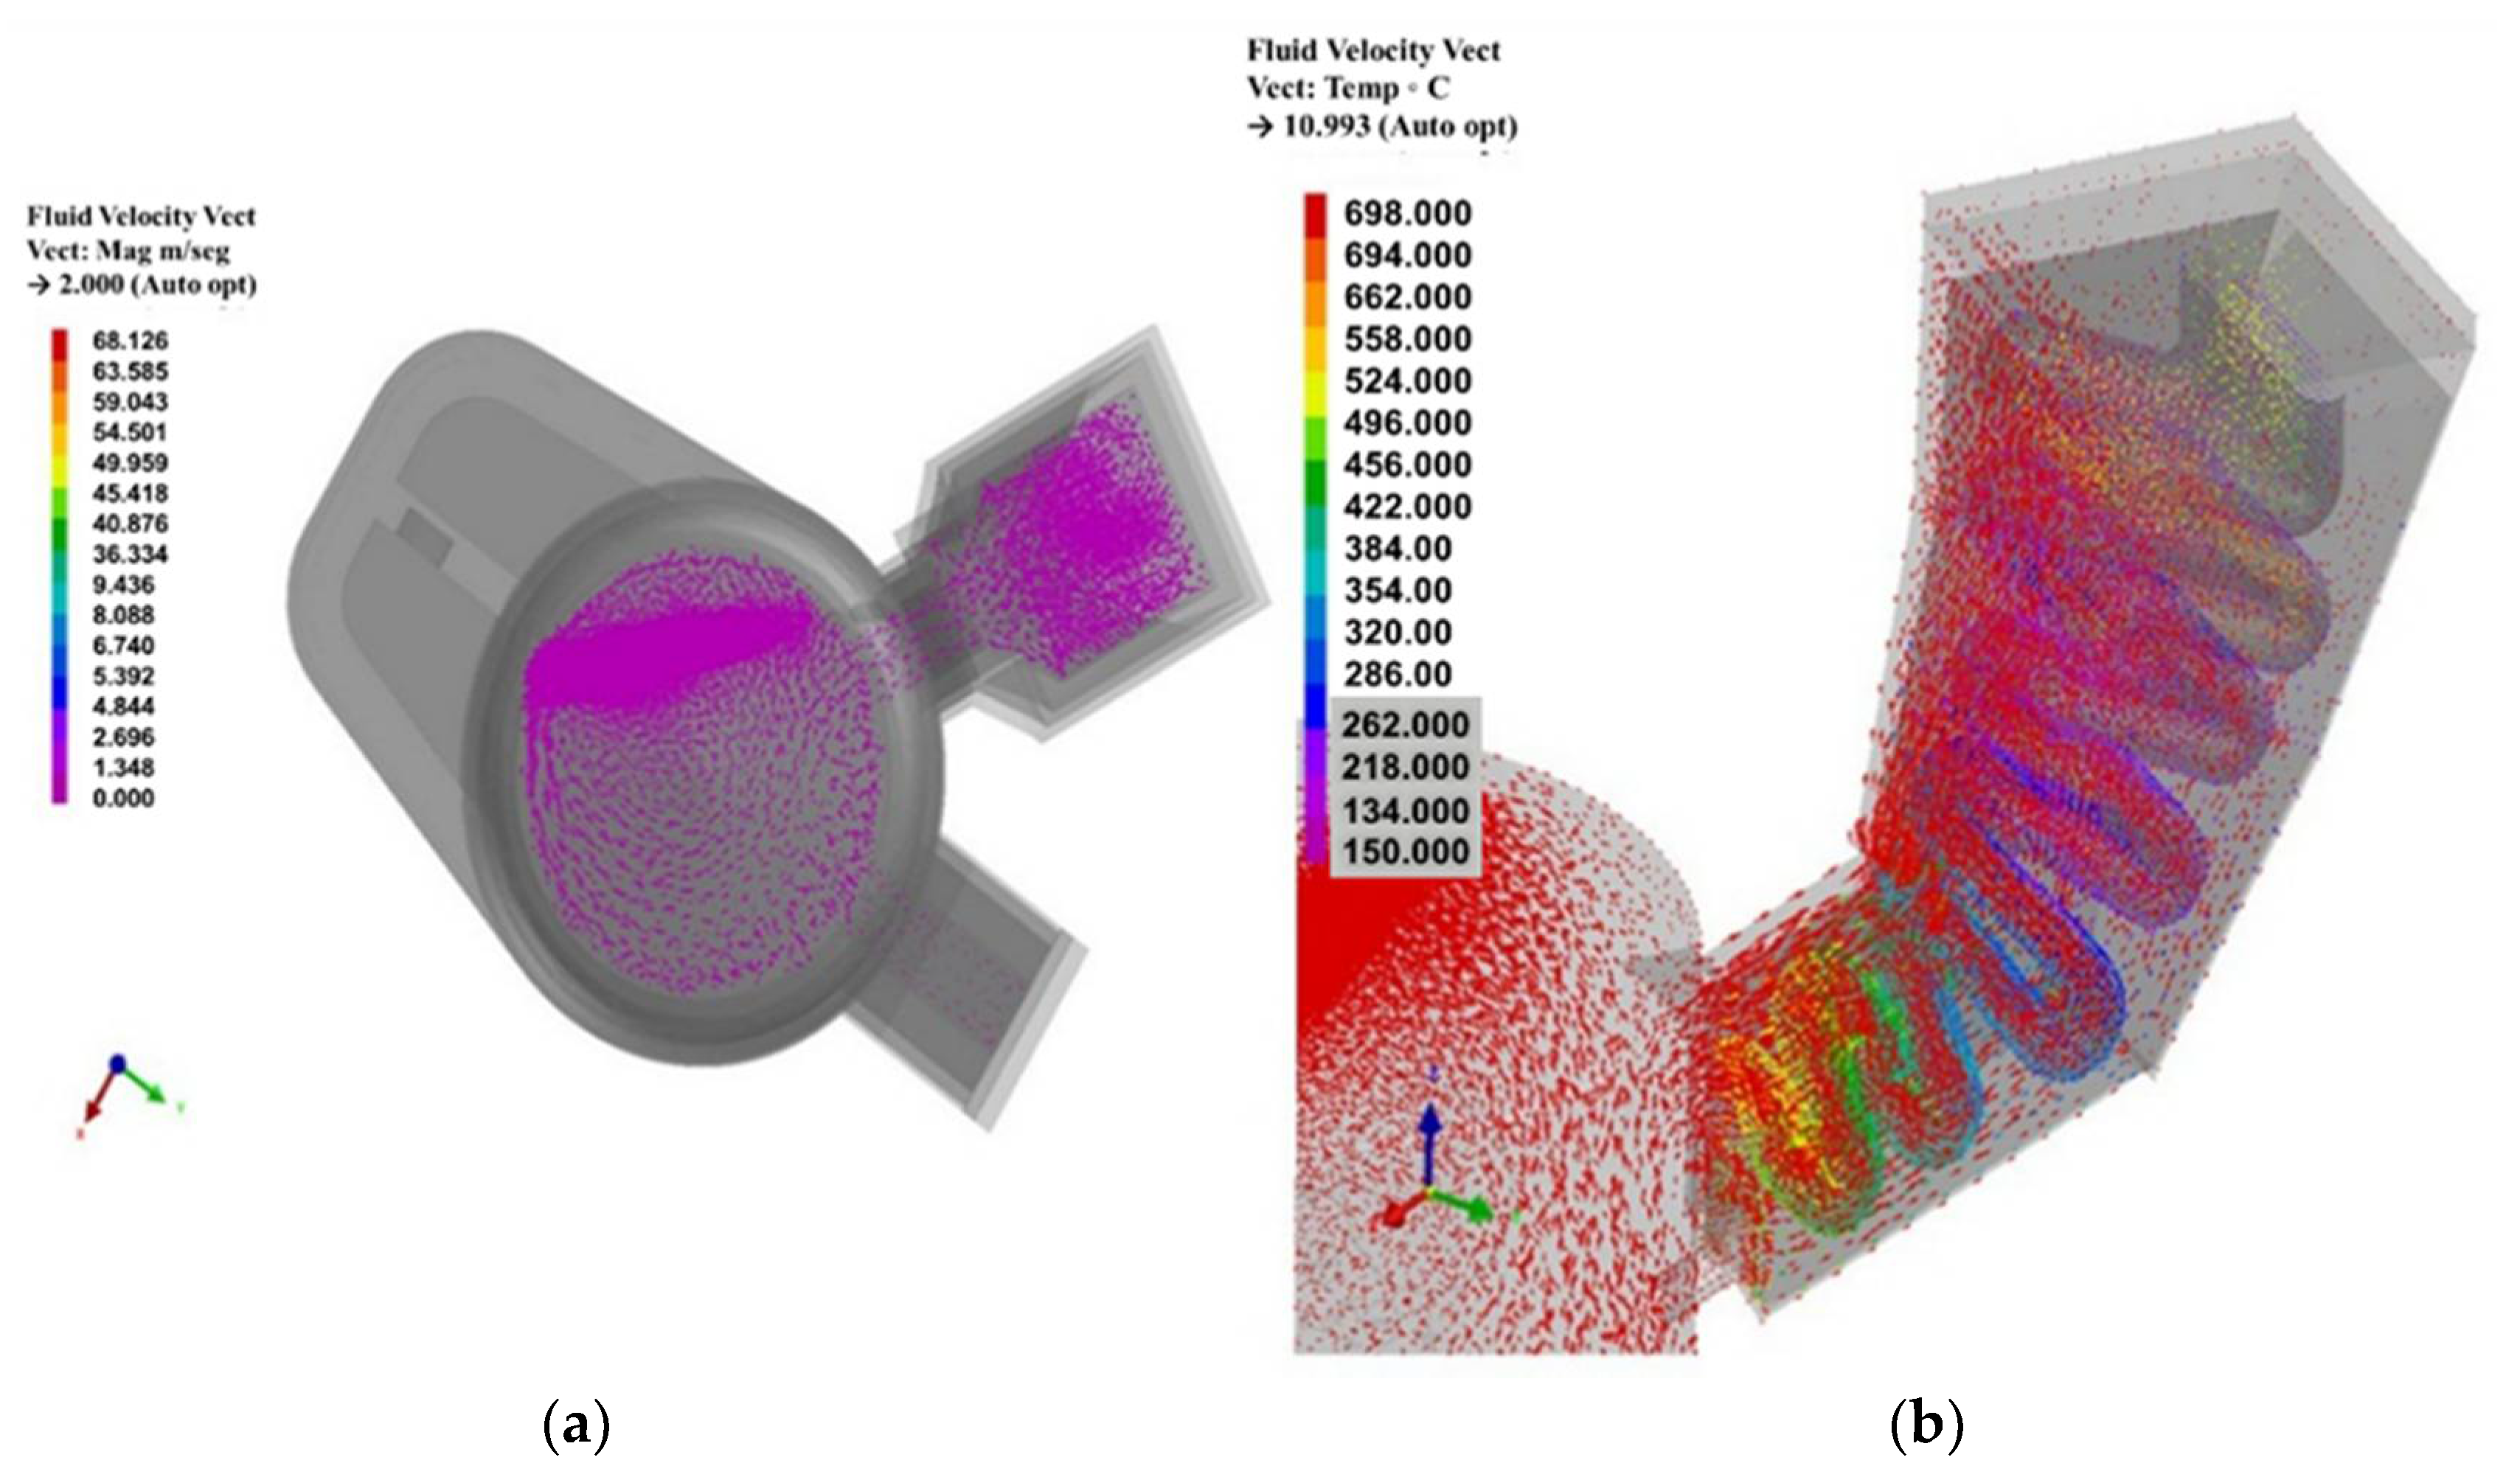
Figure 8.
Meshing for analysing the temperature profiles and temperature time curve of the furnace.
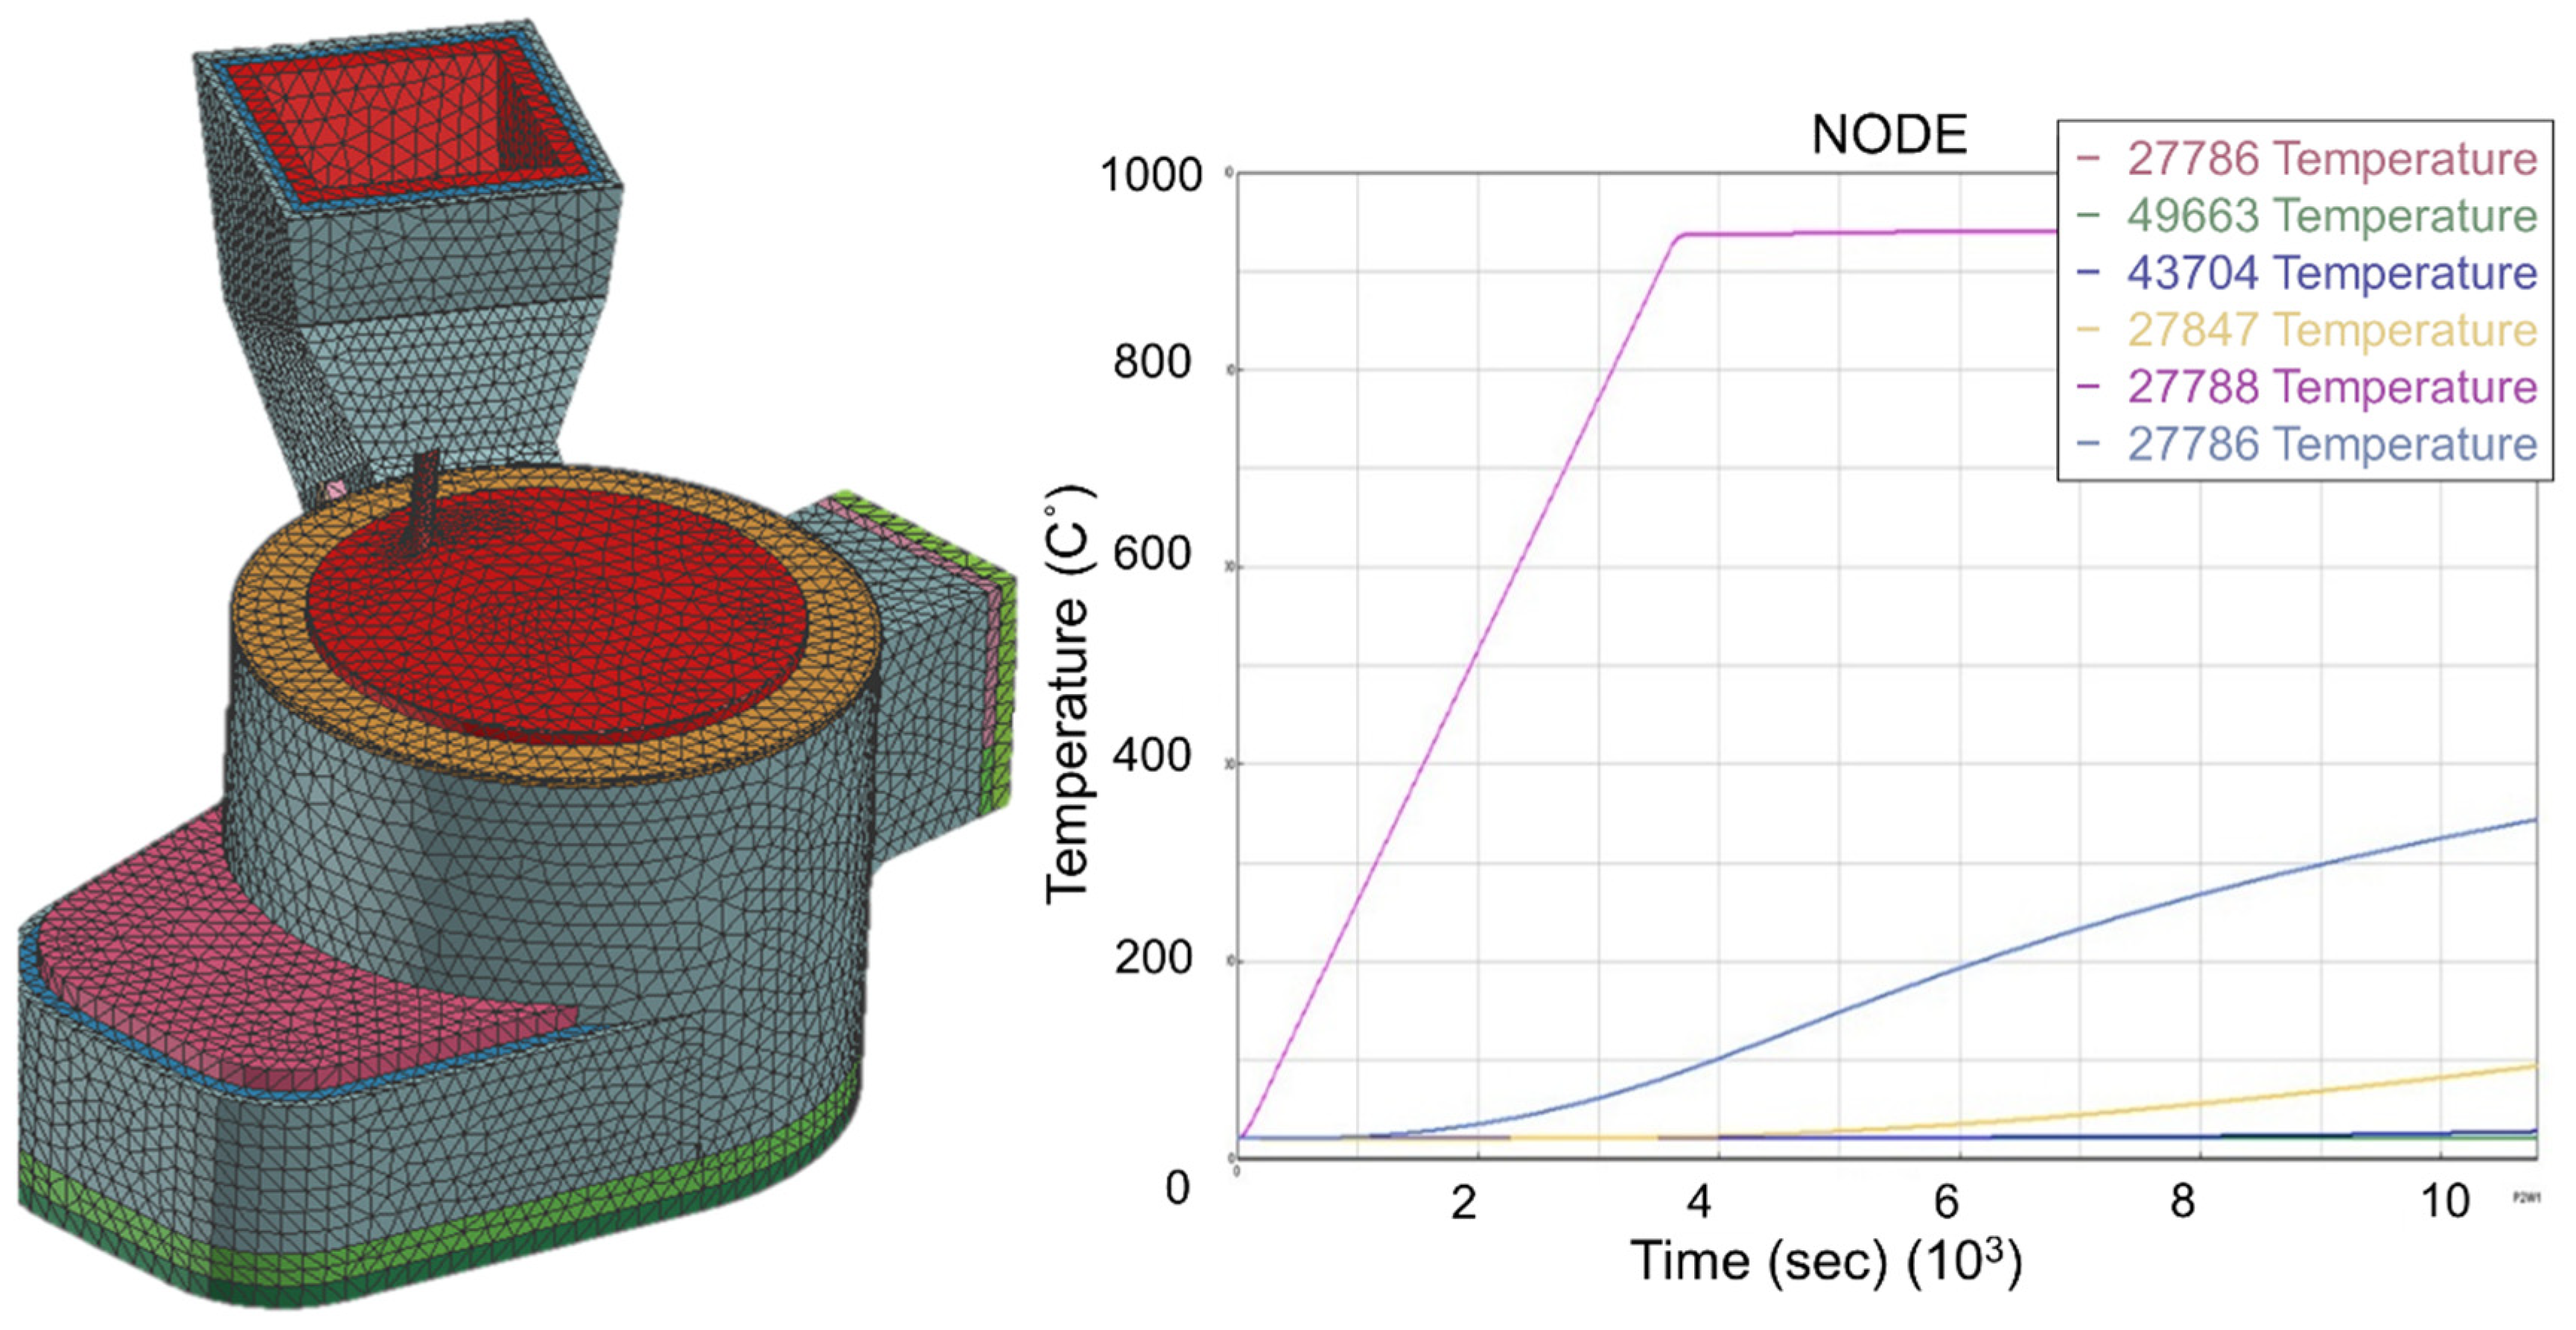
Figure 9.
Temperature profiles at (a) the outside of the furnace, and (b) the inside of the furnace, after 3671 s of simulation.
Figure 9.
Temperature profiles at (a) the outside of the furnace, and (b) the inside of the furnace, after 3671 s of simulation.
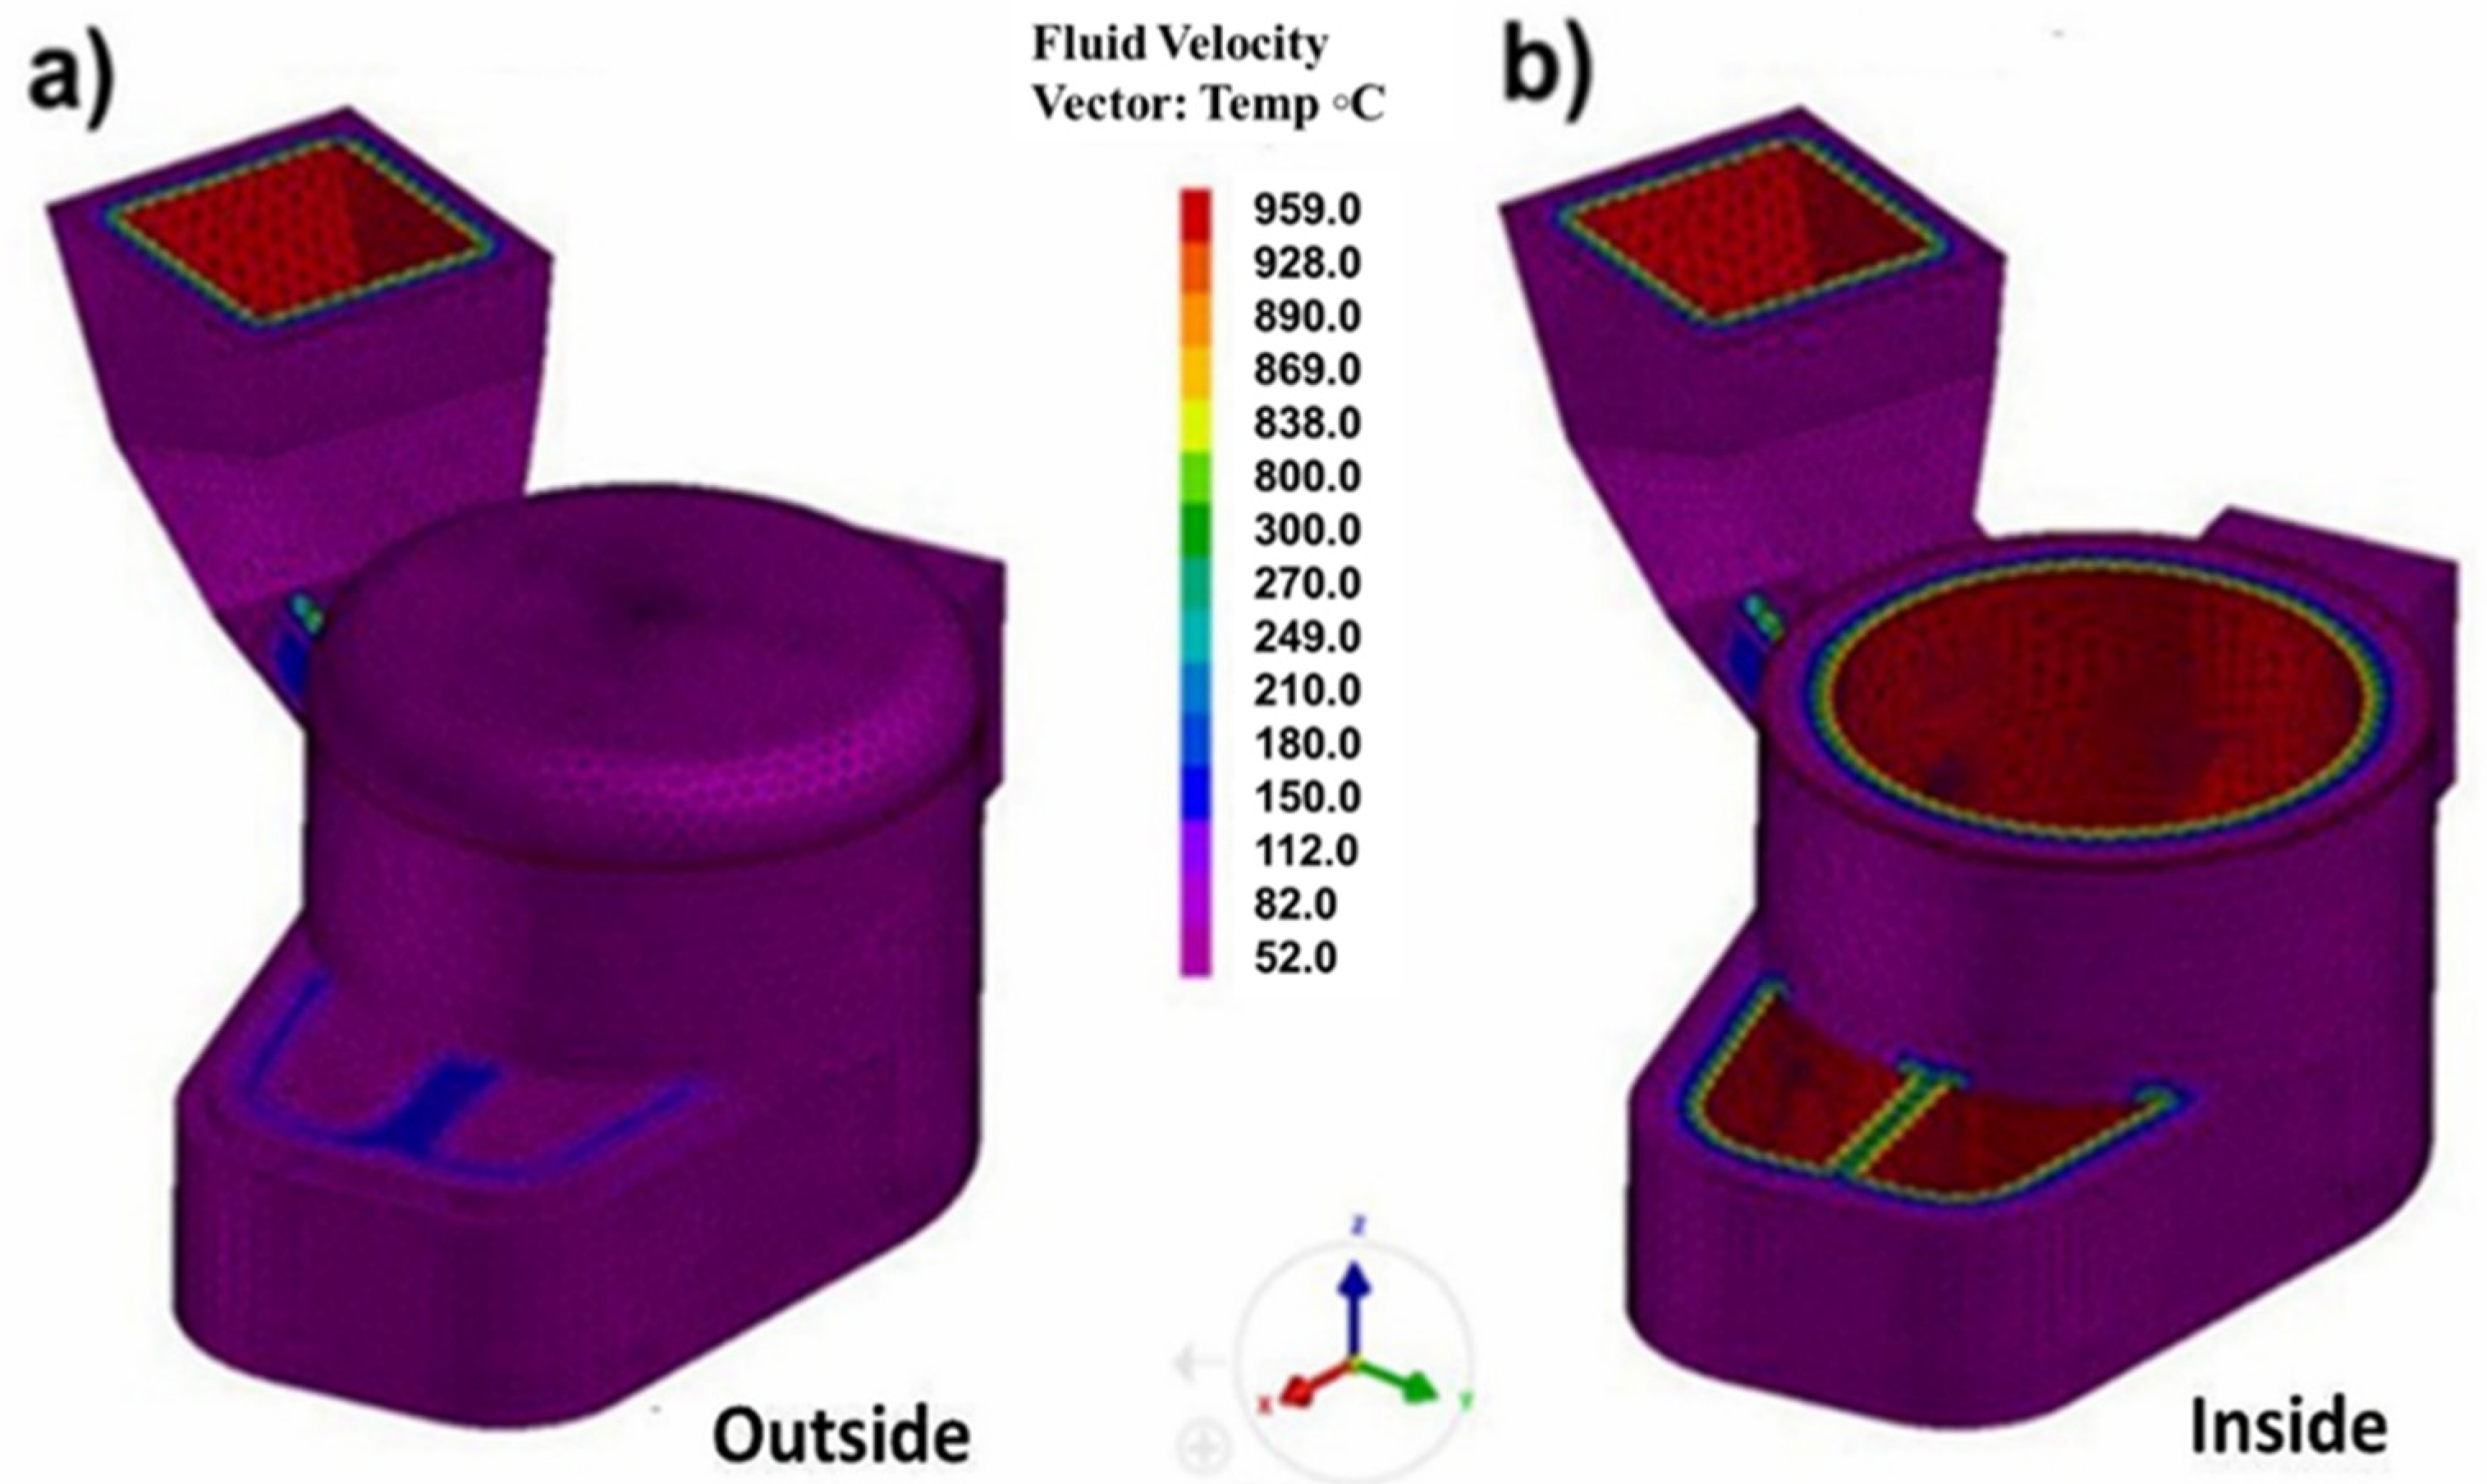
Figure 10.
Temperature profiles inside the melting chamber and the melting tower, once three layers of insulating materials were built-up, after a simulation time of 5400 s.
Figure 10.
Temperature profiles inside the melting chamber and the melting tower, once three layers of insulating materials were built-up, after a simulation time of 5400 s.
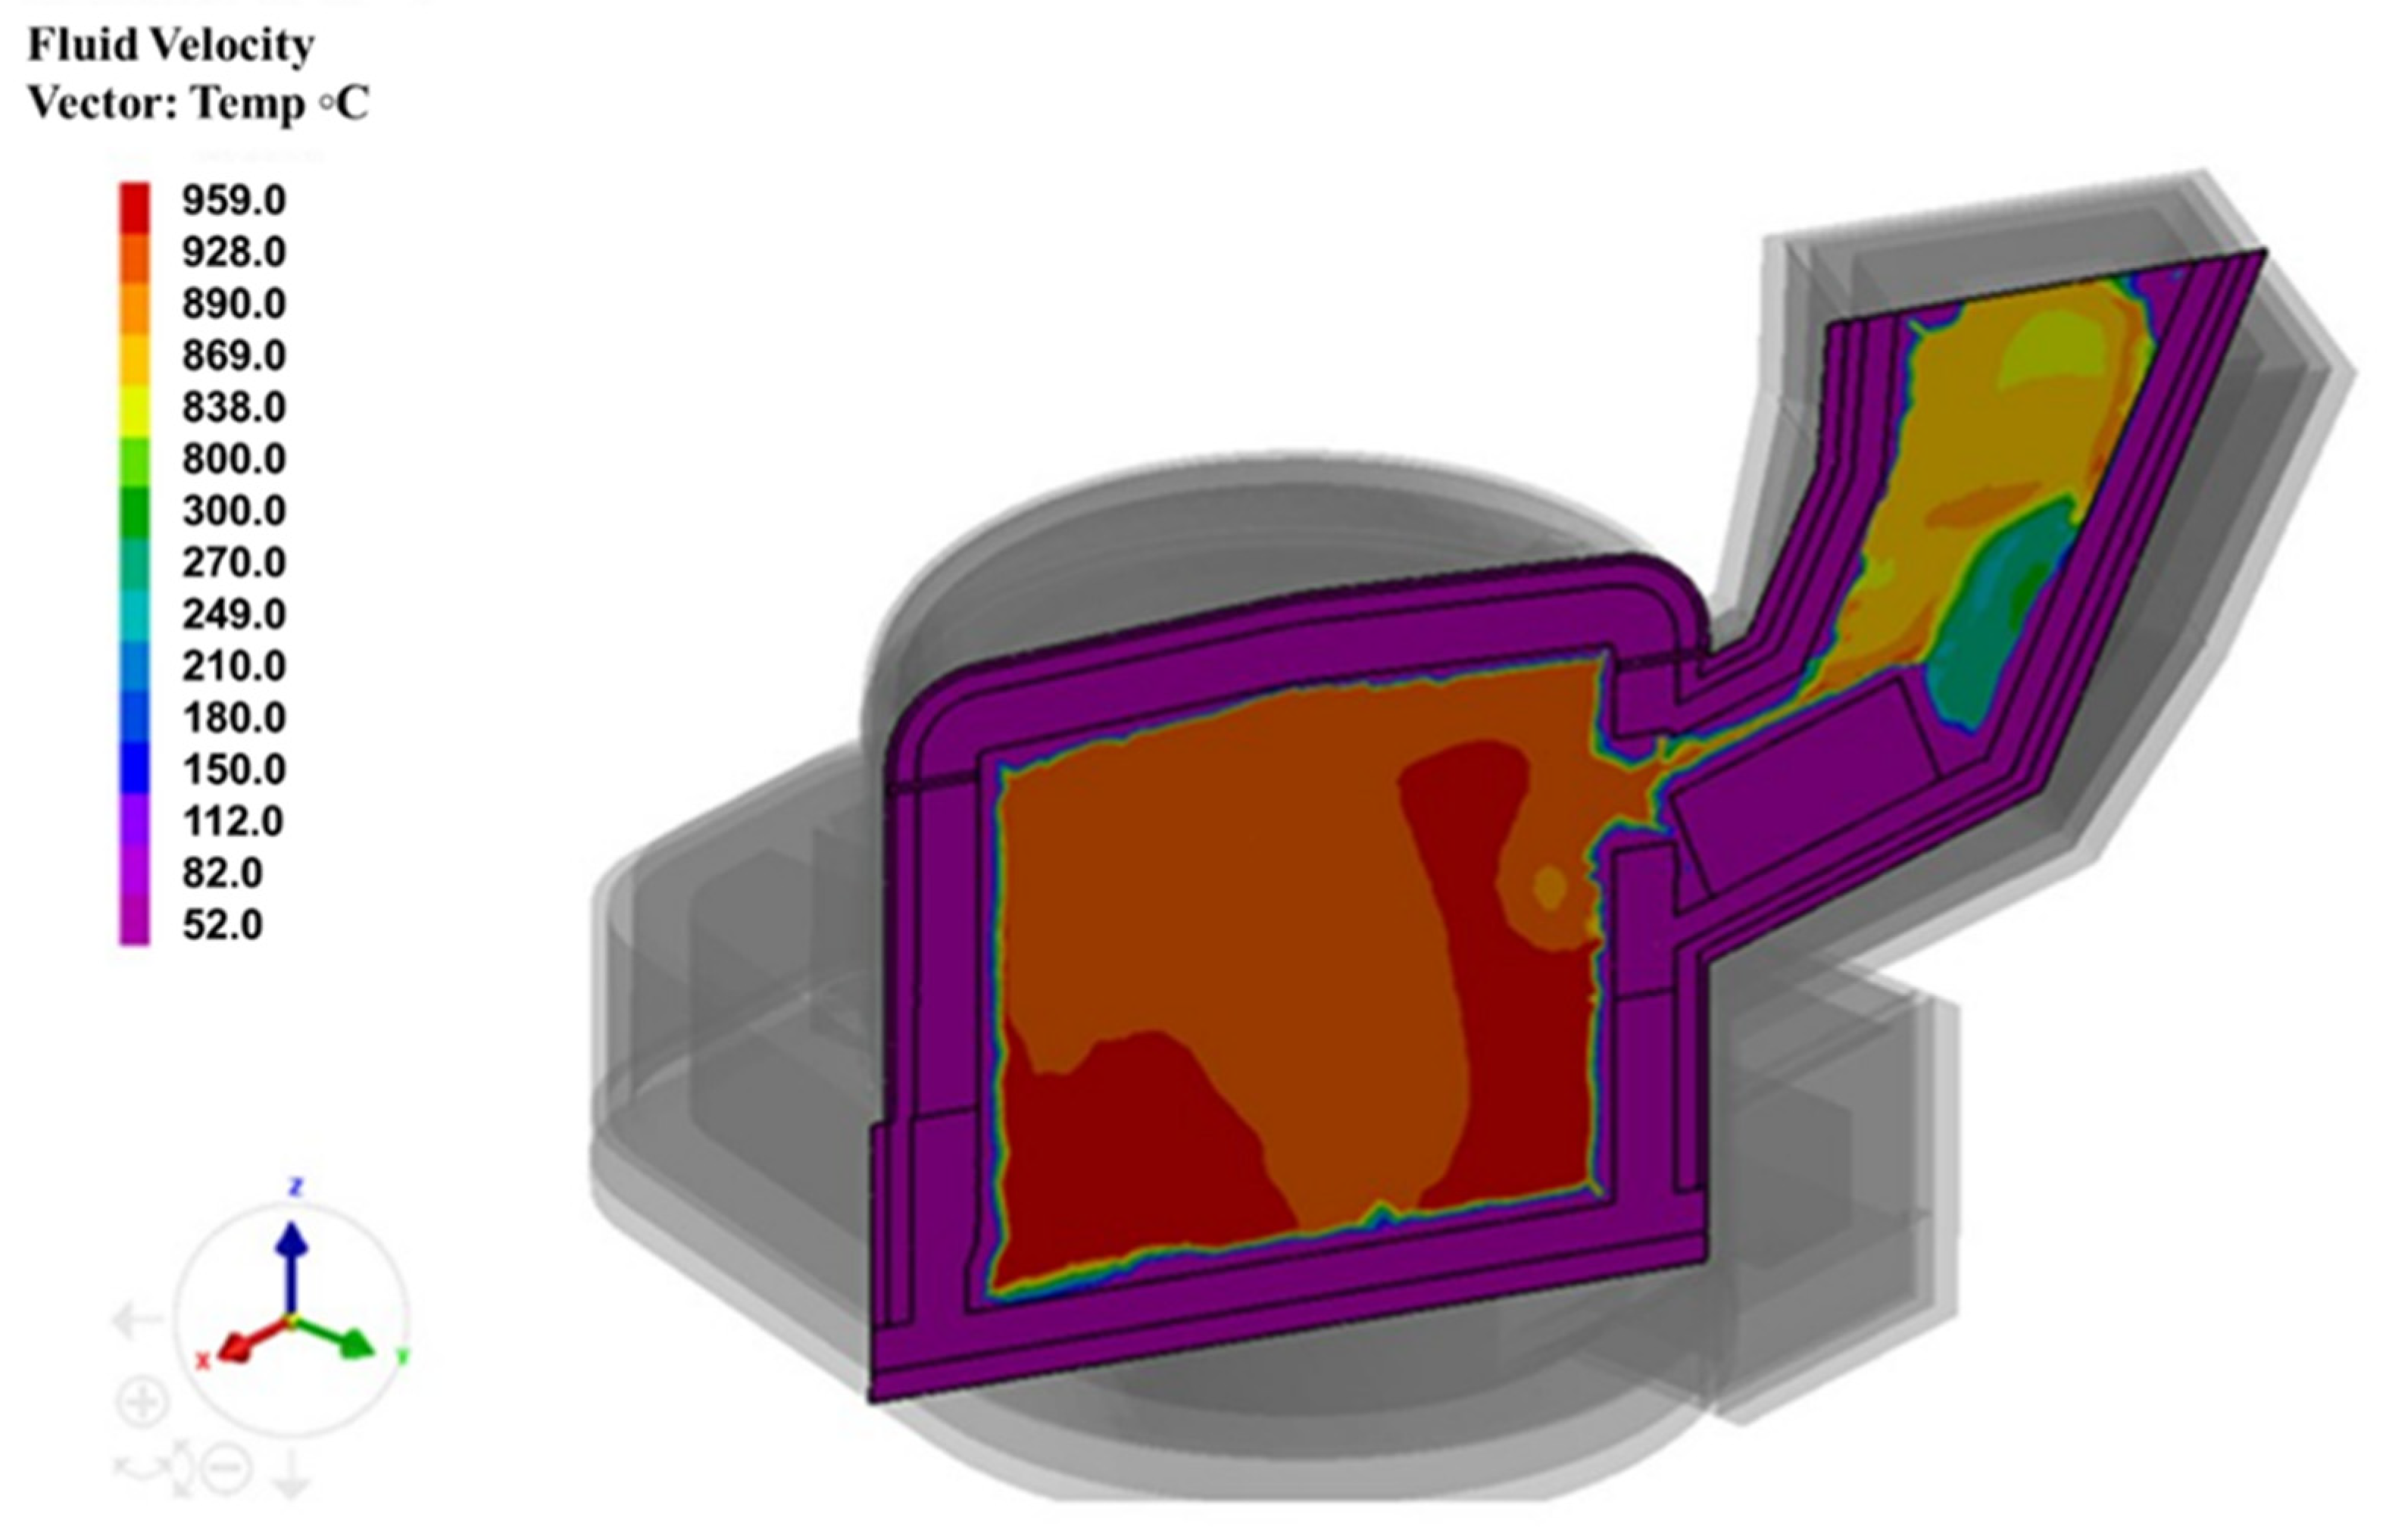
Figure 11.
(a) Rounded-shape reverberatory furnace 5 ton molten aluminium capacity; (b) the high-efficiency burner positioned at 45° from the horizontal.
Figure 11.
(a) Rounded-shape reverberatory furnace 5 ton molten aluminium capacity; (b) the high-efficiency burner positioned at 45° from the horizontal.

Table 1.
Properties of castable materials considered in the numerical simulation.
| Castable Materials | Thermal Conductivity (W/m K) | Specific Heat (KJ/kg K) | Density (kg/m3) |
|---|---|---|---|
| Refractory concrete | 1.3–1.5 | 0.96 | 2250–2270 |
| Insulating concrete | 0.22–0.22 | 1.22 | 900–1000 |
| Refractory blanket | 0.06–1.19 | 1.22 | 128 |
Table 2.
Parameter values for the simulation runs.
| Simulation Setting | Parameter Values |
|---|---|
| Timing for iteration | 0.1 s |
| Iteration Limit solver | 50 |
| Linear Convergence limit solver | 10−6 |
| Iteration limit for pressure equations solvers | 250 |
| Solver for linear convergence limit | 10−6 |
| Solver type | Conjugate gradient |
Table 3.
Values of the energy absorbed by the refractory concrete.
| Energy absorbed by the refractory | QCR = 252,212 kcal/h |
| Energy required for melting 1000 kg | Q1 = 5,520,945 kcal/h |
| Energy required to produce a phase change | Q2 = 95,600 kcal/h |
Table 4.
Production results of the furnace before and after modifications.
| Furnace Processing Features | Furnace without Modifications | Furnace with Modifications |
|---|---|---|
| Aluminium chip 0.5 cm2 (ton/h) | 0.3–0.5 | 0.8–1.2 |
| Aluminium chip thick 10–30 cross section (ton/h) | 0.3–0.5 | 0.4–0.6 |
| Average production (ton/day) | 6.5–7.5 | 12–16 |
| Weight Mg percentage after 100 min of treatment | 0.26 | 0.15 |
Publisher’s Note: MDPI stays neutral with regard to jurisdictional claims in published maps and institutional affiliations. |
© 2021 by the authors. Licensee MDPI, Basel, Switzerland. This article is an open access article distributed under the terms and conditions of the Creative Commons Attribution (CC BY) license (https://creativecommons.org/licenses/by/4.0/).
Share and Cite
MDPI and ACS Style
Flores Saldívar, A.A.; Juárez Martínez, R.; Flores Valdés, A.; Torres, J.T.; Ochoa Palacios, R.M.; Li, Y. Mathematical Modelling for Furnace Design Refining Molten Aluminum. Metals 2021, 11, 1798. https://doi.org/10.3390/met11111798
AMA Style
Flores Saldívar AA, Juárez Martínez R, Flores Valdés A, Torres JT, Ochoa Palacios RM, Li Y. Mathematical Modelling for Furnace Design Refining Molten Aluminum. Metals. 2021; 11(11):1798. https://doi.org/10.3390/met11111798
Chicago/Turabian StyleFlores Saldívar, Alfredo Alan, Rodrigo Juárez Martínez, Alfredo Flores Valdés, Jesús Torres Torres, Rocío Maricela Ochoa Palacios, and Yun Li. 2021. "Mathematical Modelling for Furnace Design Refining Molten Aluminum" Metals 11, no. 11: 1798. https://doi.org/10.3390/met11111798
Note that from the first issue of 2016, this journal uses article numbers instead of page numbers. See further details here.