Article

Deformation Characteristics in a Stretch-Based Dimensional Correction Method for Open, Thin-Walled Extrusions

Department of Mechanical and Industrial Engineering, Norwegian University of Science and Technology, 7491 Trondheim, Norway
*
Authors to whom correspondence should be addressed.
Metals 2021, 11(11), 1786; https://doi.org/10.3390/met11111786
Submission received: 7 October 2021 / Revised: 27 October 2021 / Accepted: 2 November 2021 / Published: 5 November 2021
(This article belongs to the Special Issue Forming of Aluminium Alloys)

Abstract

:
Dimensional accuracy of incoming components is crucial for automated welding and assembly in mass volume production. However, thin-walled extrusions made to industrial standards show severe dimensional variations, including gap opening, sidewall inclination, local convexity, and so on. Thus, one major challenge is to provide a low-cost correction method to improve the dimensional accuracy at a level demanded by automated assembly and/or product fit-up. A novel correction method called transverse stretch and local bending (TSLB) has recently been developed, enabling one to efficiently correct the dimensional deviations in thin-walled, U-channel profiles at a low cost. However, the lack of in-depth understanding of the underlying mechanism makes it challenging to efficiently optimise and control the process. In this study, the feasibility of this new technique was experimentally validated by four groups of TSLB tests with different profile dimensions, showing a dimensional accuracy improvement of about 92% compared with the as-received parts. The evolution of the critical dimensional characteristics, including gap opening and bottom convexity, is analysed numerically throughout four stages consisting of inserting, releasing, calibration, and springback. It is found that the inserting stage greatly reduces the dimensional deviations in a pure bending state, while the calibration stages further minimise the deviations in the bending and transverse stretching combined state. In addition, the wedge angle of the tool is found to be critical to the dimensional accuracy improvement. The low wedge angle facilitates the correction of sidewall inclination and gap opening, while the high wedge angle contributes to mitigating bottom convexity. The overall outcome of this study enhances the fundamental understanding of the effects of in-process stretching and local-bending on the dimensional capabilities of U-channel extrusions. This can ultimately generate guidelines that will lead to new application areas of aluminium extrusions in highly competitive marketplaces.

1. Introduction

The automotive market is screaming for lightweight solutions to meet new legislation and standards for CO2 reduction, energy efficiency, and sustainability [1,2]. In particular, the rapid increase in electric and hybrid-powered vehicles urgently needs new concepts and the development of lightweight materials and technologies for highly efficient automotive components [3,4]. Aluminium alloys are ideal alternatives to traditional steel owing to their lightweight nature and low-cost features [5,6,7,8]. Sheets and extrusions have been widely used to reduce curb weight and provide considerable convenience and safety in service [9,10,11]. Especially, aluminium extrusions are nowadays extensively used in automobiles thanks to their gradually enhanced capabilities [12]. New emerging design strategies such as the ongoing shift to electric cars also drive huge market demands, e.g., manufacturing battery housing cases.
Extrusion is an effective method for producing long 2D profiles that can be cut, shaped, and joined with other parts to generate advanced 3D configurations. However, it is challenging to achieve high dimensional accuracy for aluminium profiles owing to the severe plastic deformation and even complex microstructure evolution during the extrusion processes [12,13,14,15]. The typical dimensional defects of extruded U-channel profiles include open-gap, sidewall inclination, and bottom convexity, which could directly affect the subsequent manufacturing operations such as precision forming/bending, robotic welding, and automatic assembly [13,16,17,18]. To ensure sufficient assembly fit-up or use as bracket locators, this desperately calls for new manufacturing methods to effectively correct the dimensional deviations, thus improving the dimensional accuracy of aluminium extrusion. Such a correction method should ensure the proper location of surfaces, locally or along the entire length of the profile, and exclude process-inherent thickness variations.
During the past decades, many methods have been developed to correct the geometric dimensions of extrusions. The first one commonly used in industries is the standard post-stretching process [19]. The stretching method is normally performed immediately and automatically after extrusion in order to meet extrusion tolerance standards, while minimising conversion cost and maximising recovery. The process could improve the out-of-straightness and, to some extent, twist, but is still incomplete to provide finished products that fully comply with some high dimensional requirements. Another method is continuous rotary straightening, mainly for correcting the dimensional accuracy of tubes [20,21]. In this method, multiple cross rollers are used to create repeated elastoplastic bending on the workpiece to reduce the deviation in cross section and straightness when the tube is moved through the machine as it is rotated around its longitudinal axis in a spiral direction [21,22]. However, this method would hardly work to correct the dimensional deviations when it comes to complex profiles, especially open profiles. Additionally, hydroforming is also widely used for correction purposes. In this method, the extruded profile is formed or corrected under high water pressure towards rigid tool surfaces, making up the exterior of the final product [23,24,25]. The advantage of this process is that the (internal) pressure sets up the stresses in the section so that, once forced up against the die surfaces, the springback amount is small. This means that the exterior of the section remains very close to the machined tool surfaces in terms of accuracy. However, hydroforming is normally slow and has a high requirement of machines and tools, leading to large investments and a certain plant infrastructure [26]. Baringbing et al. also presented a method for the calibration of crush cans for welded bumper beam assemblies [27]. The method proved to be fast, inexpensive, and accurate, but with the drawback that the part is only calibrated locally; that is, in the region of the location of the weld, where tight dimensional control is needed. In addition to the strategies mentioned above, some other processes could be used for improving the dimensional accuracy of metal-formed products, for example, stretch bending [28,29], sheet stamping with stiffening ribs [30,31], the hot form quench (HFQ) process [32,33], heat treatment before/after forming [34,35,36], and so on. However, in these processes, the dimensional accuracy of the formed products could be assured in the condition that the input blank, e.g., extruded profiles, could well meet the standard extrusion tolerances.
Based on the above perspectives, there is an urgent industrial demand to develop a correction method capable of cost-effectively improving the dimensional accuracy of aluminium extrusions without demanding additional and expensive forming operations. Recently, a novel mechanical calibration method was developed specifically to correct the dimensional defects in complex open-type profiles, for instance, U-channels [37]. In this method, stretching is applied in the transverse direction of the profile to achieve high dimensional accuracy, as stretching associated with bending generates less springback than that in pure bending states [29]. Less springback leads to less dimensional variability, and thus ensures better process capability. Although validated theoretically and experimentally [21], this technique has, to the best of our knowledge, not yet been applied in the industry. The main reason lies in the complex deformation processes, including inserting, releasing, calibration, and springback. Thus, it is challenging to achieve the desired dimensions by controlling the die geometry and process parameter.
This study aims to provide new, in-depth insights into the deformation behaviours of open thin-walled extrusions during the TSLB process and to clarify the effects of stretching and bending components on improving dimensional accuracy. TSLB experiments with different initial geometries are conducted to verify the feasibility of this technique. Then, the finite element model (FEM) was established to reveal the underlying stress/strain and dimensional evolution during the process. In the end, the critical geometric parameter, the wedge angle, is investigated, which contributes to the tool design in industrial practice.
The remainder of the paper is organised as follows. Section 2 presents the profile material, experimental details, and finite element modelling. Section 3 introduces the results and discussion, including the experimental results, FE validation, and comprehensive analysis of the deformation mechanisms. Finally, Section 4 summarises the conclusions and provides an outlook for future research.

2. Materials and Methods

In this study, experiments and numerical simulations were conducted to understand the deformation mechanics in the TSLB process. TSLB experiments using profiles with different initial geometries were conducted to verify the feasibility of this technique. Uniaxial tensile tests were performed to characterise the mechanical properties of the as-received materials. The achieved stress–strain data were then input into the FE model to describe the material behaviours during TSLB. 3D dimensions of the samples before and after the correction were measured to examine the improvement in the dimensional accuracy. The measured geometries before the correction were used in the FE model to describe the initial geometries of the profiles. Tools with different shapes were designed.

2.1. Experiments

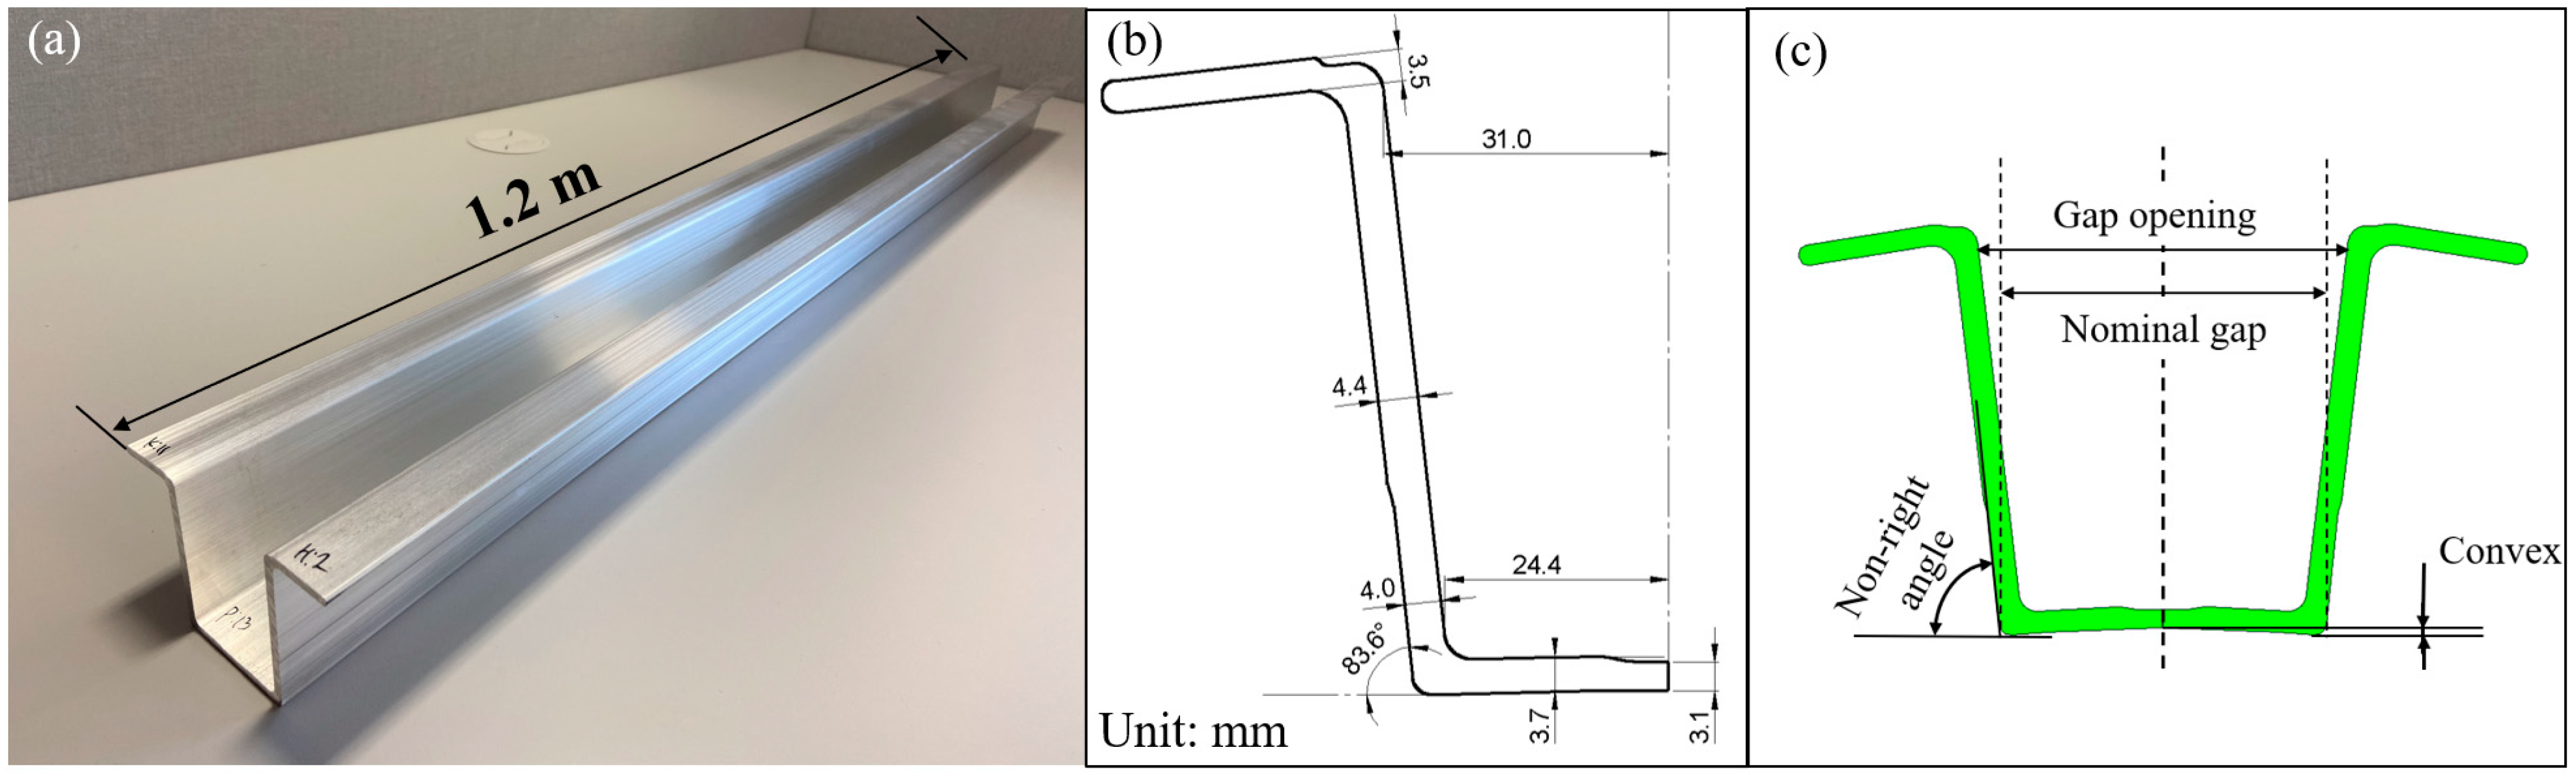
2.1.1. Sample Description

Commercial aluminium extrusions AA6082 T4 were received from Benteler Automotive Raufoss (Benteler Aluminum Systems Norway AS, Raufoss, Norway). The typical structure is shown in Figure 1a. It consists of a long U channel with a complex open thin-walled cross section, including two top and one bottom flange and two sidewalls. The dimensions of the transverse cross section are shown in Figure 1b. The thicknesses of the sidewalls and the bottom flange are distributed unevenly. The typical dimensional deviations are illustrated in Figure 1c, including the large gap opening, sidewall inclination, and bottom convex. These dimensional problems are caused by complex reasons such as cooling, tool wearing, and distortion during transportation or storage [38].
Four samples with different initial geometric dimensions, labelled as P1–P4, were used to study the dimensional correction capability of this technique. Uniaxial tensile tests were conducted with the samples cut from the bottom corner along the extrusion direction. The strain rate was controlled to be 0.02 mm/min. More details such as the sample geometry and stress–strain response are referred to in previous work [37]. The anisotropy effects were found to be insignificant by comparing the stress–strain curves of the samples cut along different directions (0°, 45°, and 90° related to the extrusion direction).

2.1.2. Experimental Setup

The TSLB experimental setup is presented in Figure 2. The bottom die consisting of the die blocks and the profile-specific inserts is fixed on the base plate. The wedge is connected with the hydraulic actuator, enabling its movement forward and downward. The guide system was designed to ensure the vertical movement of the wedge without being affected by the uneven deformation during the TSLB process. Two shim blocks are freely placed between the profile and the wedge. They are driven towards the profile by the wedge and deform the profile to the inner shape of the bottom die.

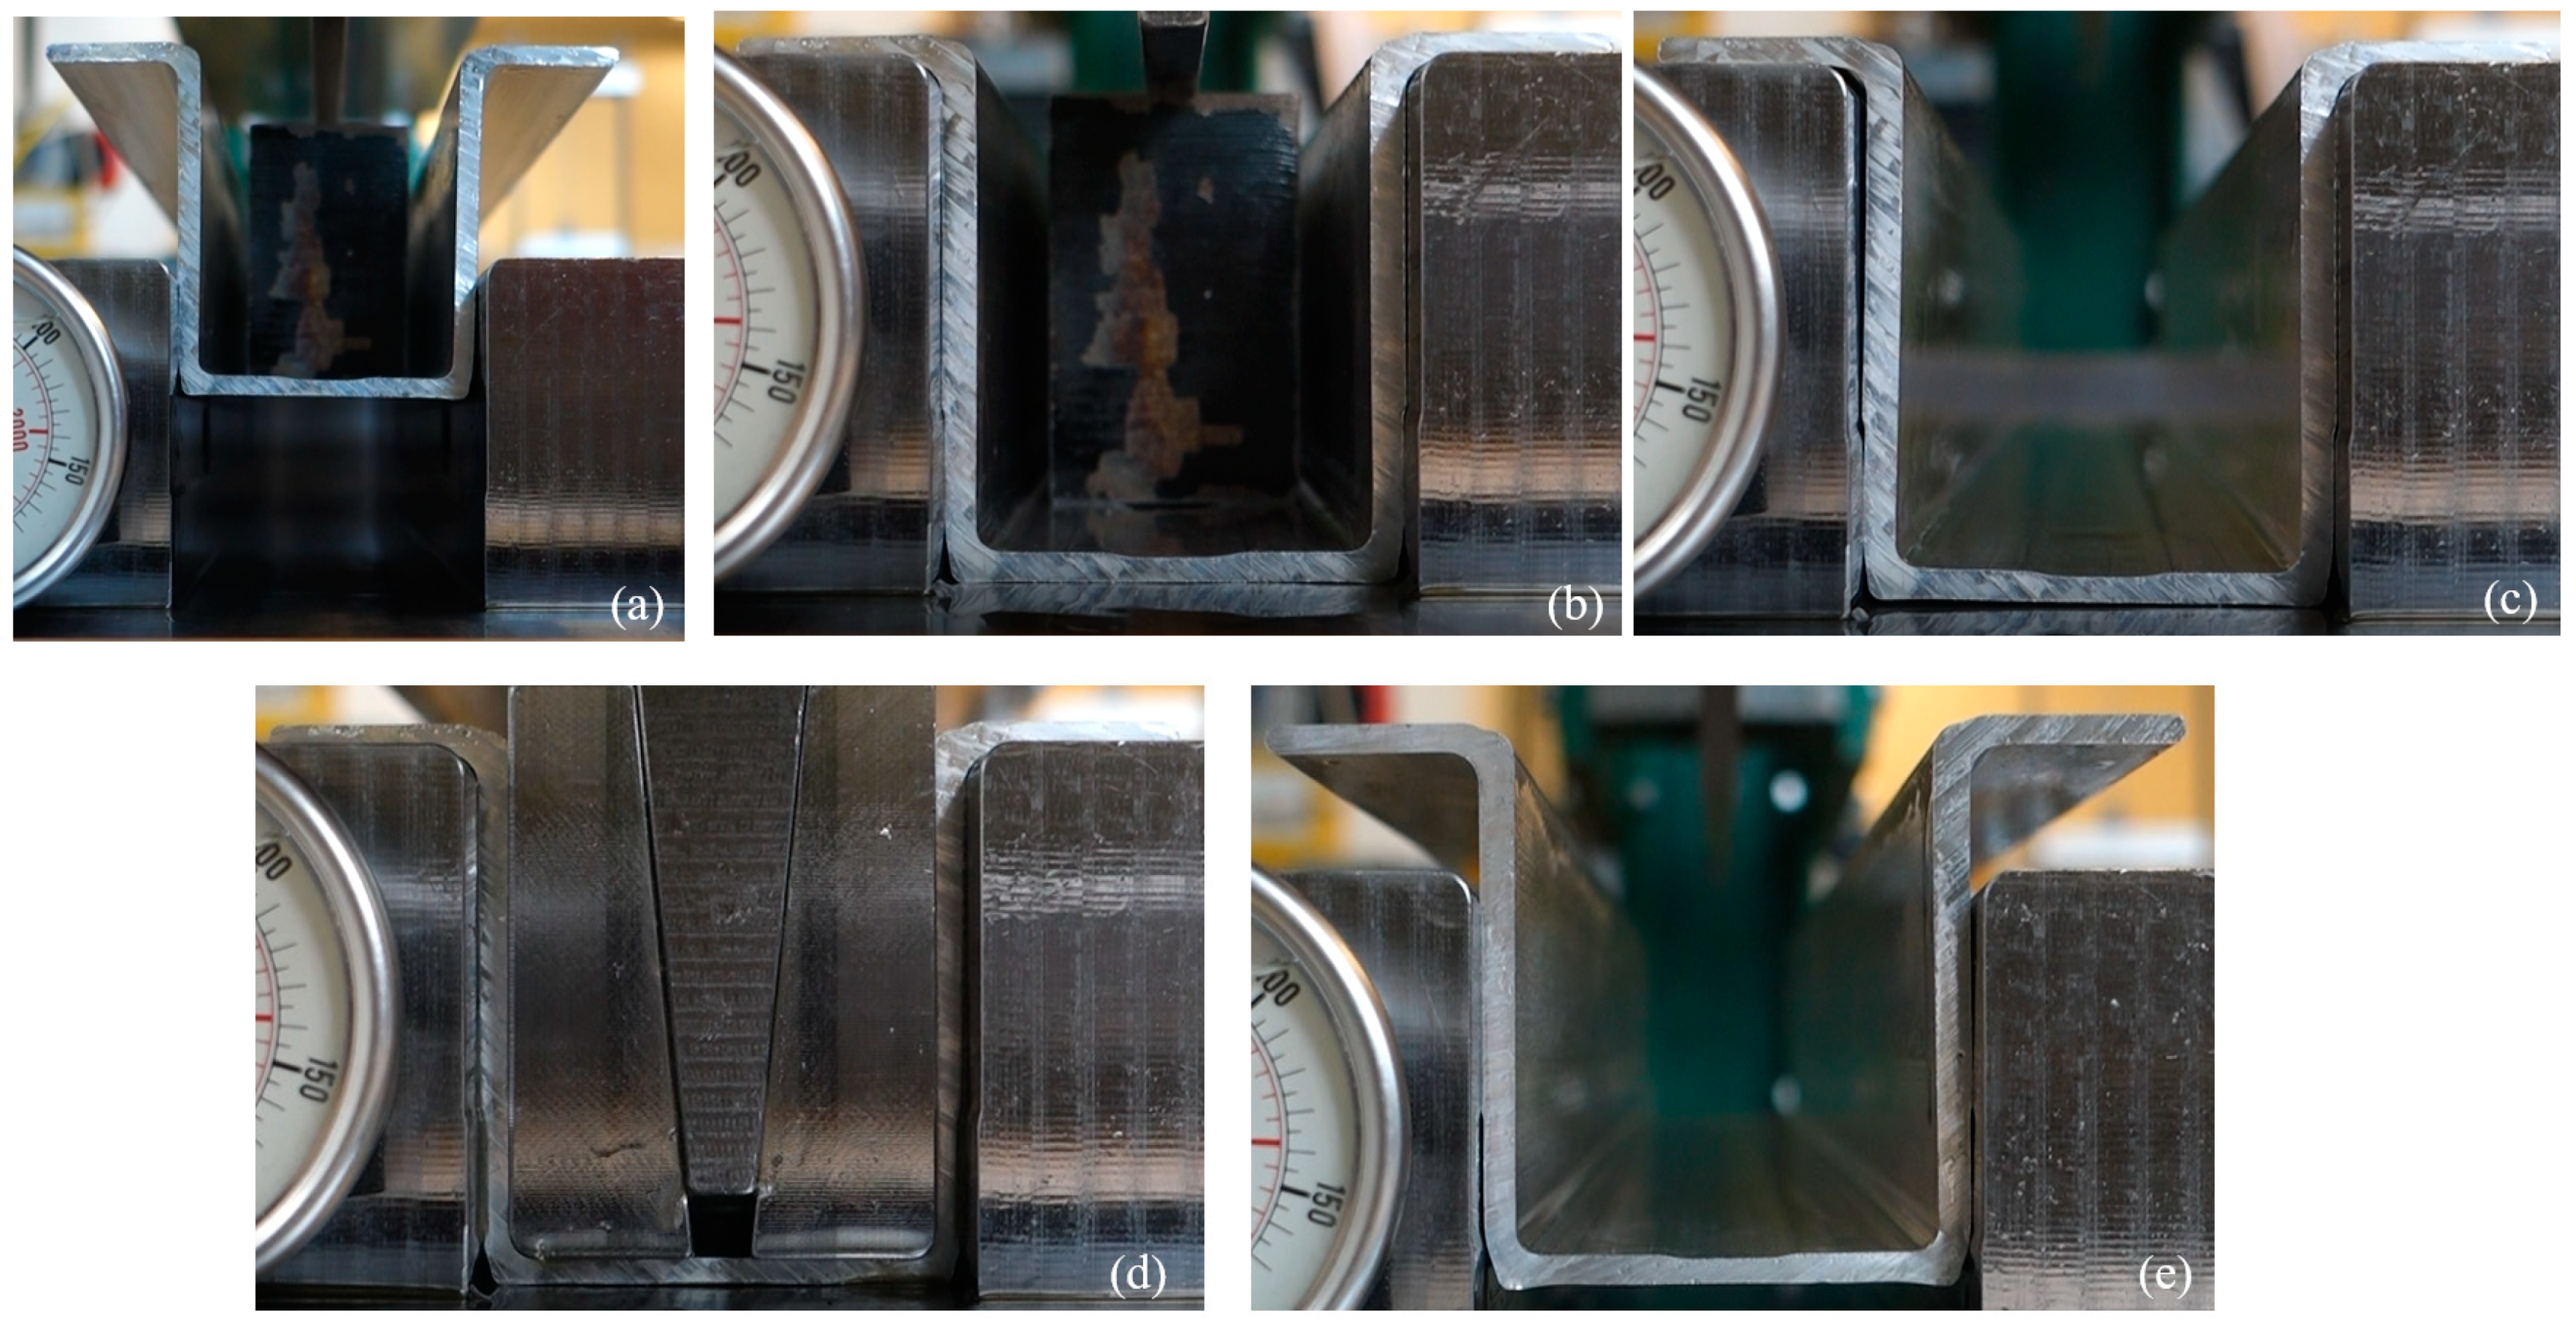
2.1.3. Experimental Procedures

The TSLB tests include dimension measurement and geometric correction process. Before and after the correction tests, the sample dimensions were measured in the Leitz PMM-C 600 coordinate measuring machine (CMM). In this study, the dimensional data on the middle section of the profile were recorded and used. More details about the measurement strategy can be found in [37].
After the measurement, the profiles were then deformed in the experimental setup. Lubricant Mobil Vactra oil No. 2 was applied on the surfaces of the profile and shim blocks to reduce friction and wear. The entire dimensional correction procedures are illustrated in Figure 3, including four stages. Firstly, the as-received profile is placed on the edges of the bottom die. A large block is on top of it and just under the wedge, as shown in Figure 3a. Then, the wedge drives the block and the profile downward (in Figure 3b). The wedge stops when the detected force sharply increases, implying that the profile comes into contact with the bottom die. It can protect the machine and the profile bottom from a reduction in thickness. During this process, the gap opening is greatly reduced, as well as the sidewall inclination and convex. However, strong springback occurs after the block releases from the profile owing to the pure bending state (in Figure 3c), causing the profile geometry to deviate from the nominal geometry. Thus, the subsequent process is required to refine the geometry. The stretch-based correction process introduces the stretching component, reducing the springback level and improving geometry accuracy [29]. As shown in Figure 3d, two shim blocks are placed freely on the profile bottom just below the wedge. The wedge moves downward and pushes the blocks to the profile till the profile comes fully into contact with the die block, which can be indicated by the sharp increase in the force on the wedge. After that, the wedge and blocks were extracted (in Figure 3e), followed by the profile. In the end, the corrected profile was measured in the CMM.
Although the springback still occurs during unloading, it is not significant owing to the specific loading conditions, i.e., stretching dominant stress state. Thus, the final geometry is much closer to the designed one, satisfying industrial requirements. In total, four groups of TSLB tests were conducted with the profile dimensions before and after each test.

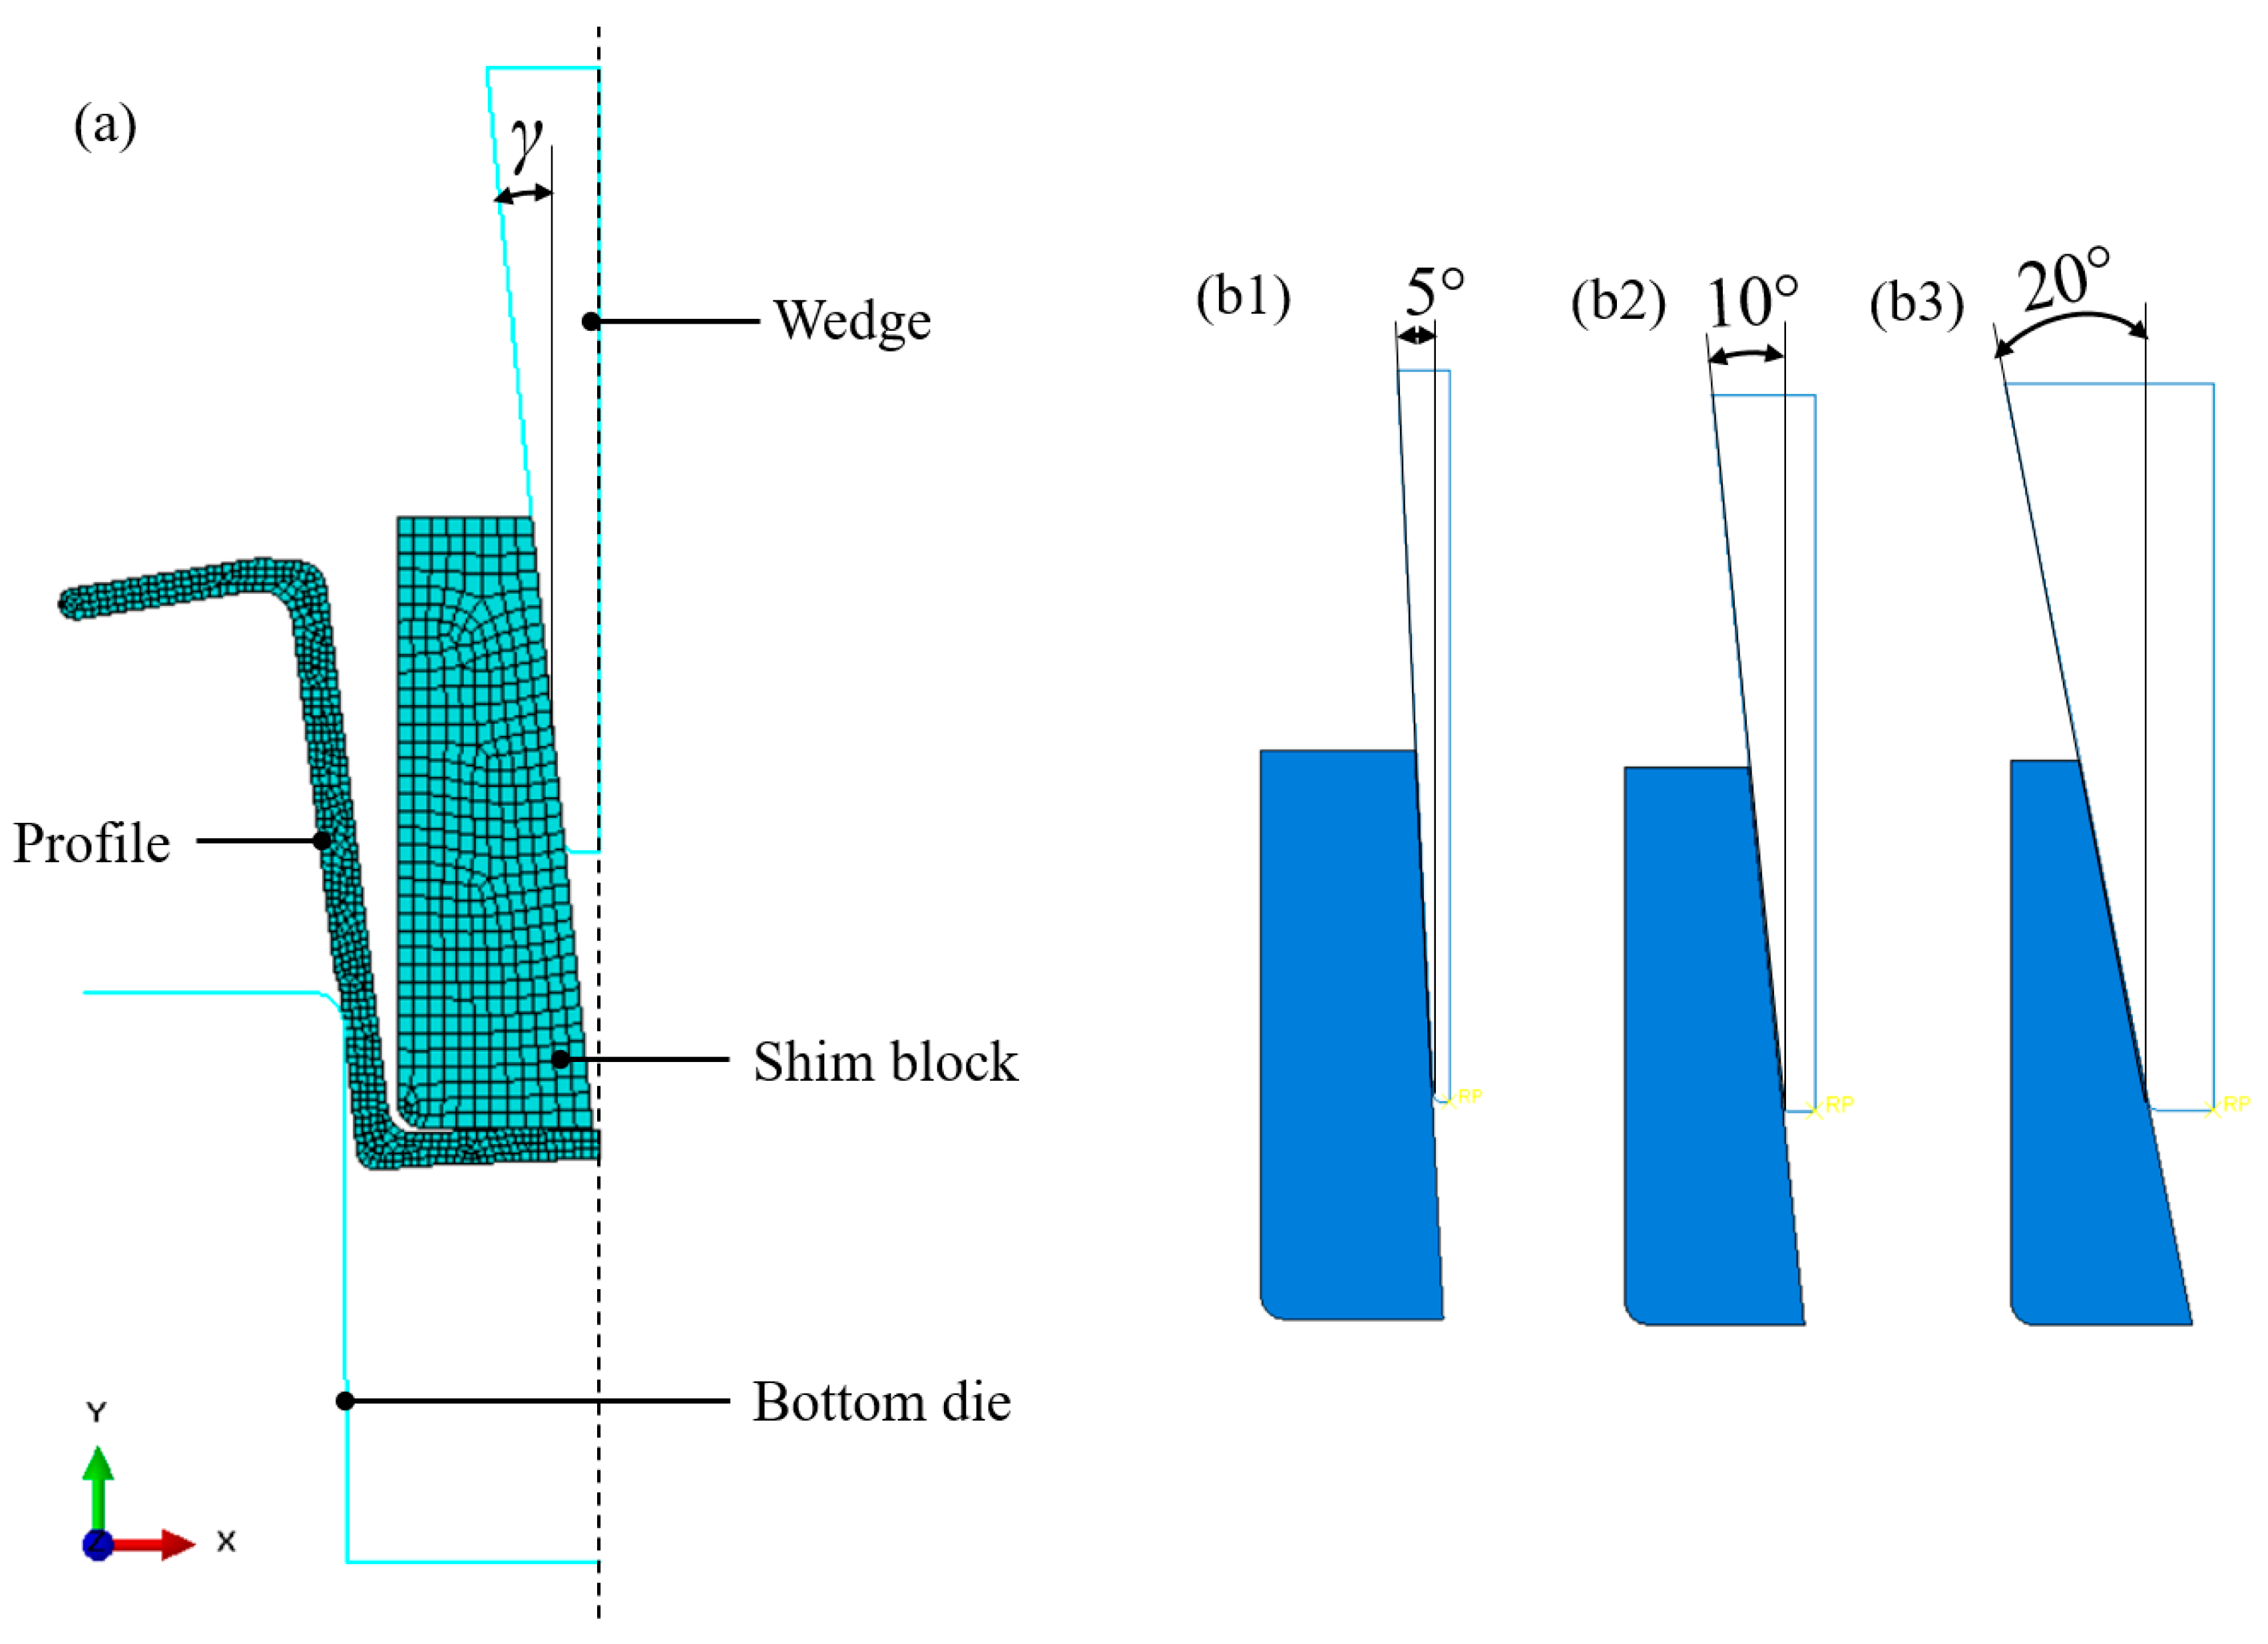
2.2. Finite Element Modelling

A robust FE model was established to study the process behaviour as well as the deformation mechanics in the TSLB process. The experimental calibration process with the profile geometry in Case P1 was simulated to investigate the deformation mechanism. Based on this case, the other two cases with different wedge angles were compared and analysed to uncover the effect of tool shape.
The configuration of the FE model is shown in Figure 4a. A 2D model was built in Abaqus 2017, under the assumption that the profile is so long that the axial deformation around the middle section is quite slight and can be ignored. A half CAD model was used owing to symmetry. The initial geometry of the profile was achieved by experimental measurements.
The profile and shim block were defined as deformable parts, and the other parts were set as rigid parts. The elastic-plastic data of the profile were obtained from the uniaxial tensile test described previously. The mechanical properties of carbon steel were applied to the shim block for high simulation accuracy, given the high stress concentration during calibration. Surface to surface contact with a friction coefficient of 0.2 was used to define the interfaces between the four parts.
Four steps were defined in explicit and standard solvers to simulate the entire process in Figure 3. The insertion, release, and calibration stages were calculated by an explicit solver owing to the complex contact problem, while the final springback was simulated in the implicit solver for high computational accuracy. In terms of the boundary condition, a global symmetry constraint was applied on the middle section of the profile, while the bottom die was fully fixed. In the inserting stage, a vertical displacement was applied on the shim block, keeping the wedge still. The displacement value was obtained from the experiments. Then, the block moved slowly upward, and the formed profile was released at the same time. During the calibration stage, the block was initially put close to the top surface of the bottom flange, and the wedge remained close to the block surface. A vertical displacement was applied on the wedge without any constraints applied on the block. The displacement of the wedge was obtained from the experiments. In the last springback stage, the last state of the profile was predefined as the initial state in this process. Only the profile was kept in this step, with all other parts deleted. One vertical velocity constraint was applied on the lowest node of the bottom flange.
Three cases with different wedge angles γ, varying from 5° to 20°, are simulated and analysed to investigate the effect of tool shapes on the dimensional evolution. The tool designs are shown in Figure 4(b1–b3). To achieve the full contact of the shim block side with the profile sidewall, the horizontal displacement driven by the wedge is kept constant in these three cases. Accordingly, different vertical displacements were calculated and applied on the wedge.

3. Results and Discussion

3.1. Experimental Results

Figure 5 compares the sidewall dimensions of the profiles before and after the TSLB process in four cases, P1–P4. Six points along the inner wall of the sidewall, N1 to N6, were characterised. The vertical interval between them remains at 10 mm. The x-axis in Figure 5 represents the horizontal distance to the middle line of the profile, i.e., half of the opening gap. The vertical axis means their vertical position related to the bottom.
Before the TSLB process, the gap opening on N6 in Case P4 was as large as 33.1 mm, which is reduced to 25.8 mm after the process, with the nominal size being 25.1 mm. Hence, the dimensional accuracy at this point is improved by about 90%, according to the following equation of dimensional accuracy improvement percentage:
η = | D f D n D i D n |
where D i , D f , and D n represent the initial/as-received dimension, final dimension, and nominal dimension, respectively.
Furthermore, the average improvement ( η ¯ ) in opening gap dimensional accuracy for all four cases is evaluated, and the value is as high as 92%. Meanwhile, the average dimensional deviation after calibration on N1 of the four cases is within 1%, with the lowest being 0.4%. This group of experimental data confirms the reliable capability of this technique in improving dimensional accuracy.

3.2. Verification of FE Model

Figure 6 compares the sidewall dimensions of profiles achieved by experiment and simulation before and after the calibration in Case P1. The experimental and simulated results nearly coincide, with the maximum deviation on the six points being 0.74 mm, only 2.9% of the nominal dimension. This indicates that the 2D FE model could accurately predict the deformation behaviours of the TSLB process.

3.3. Deformation Evolution

The deformation evolution during the TSLB process is studied using the case P1 by FEM, in terms of the stress, strain, and dimensional evolution throughout the process.

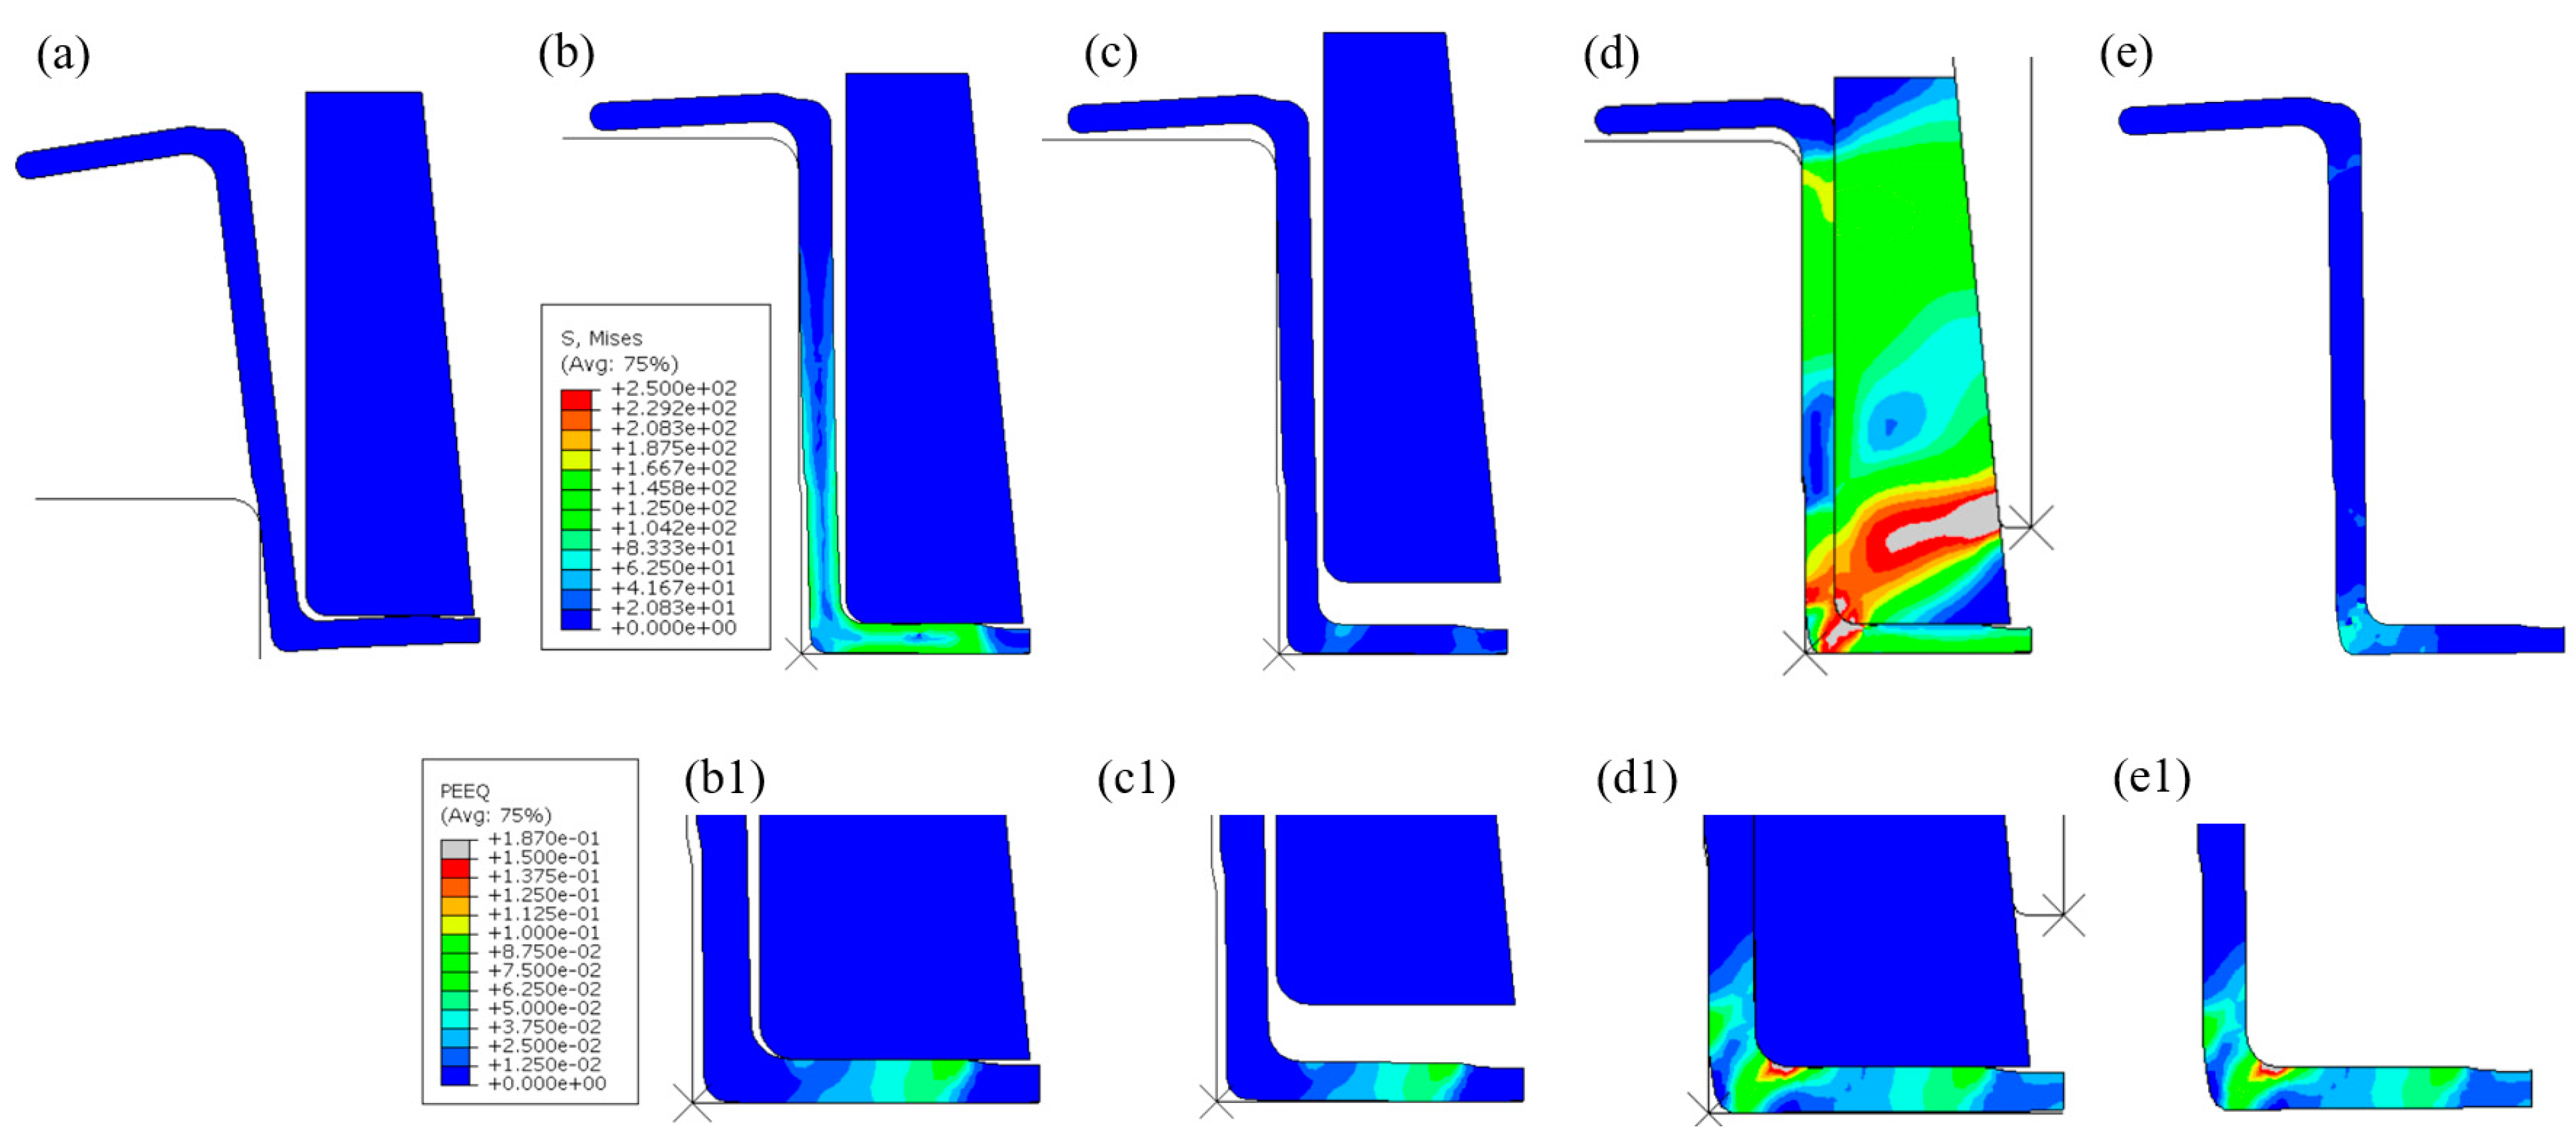
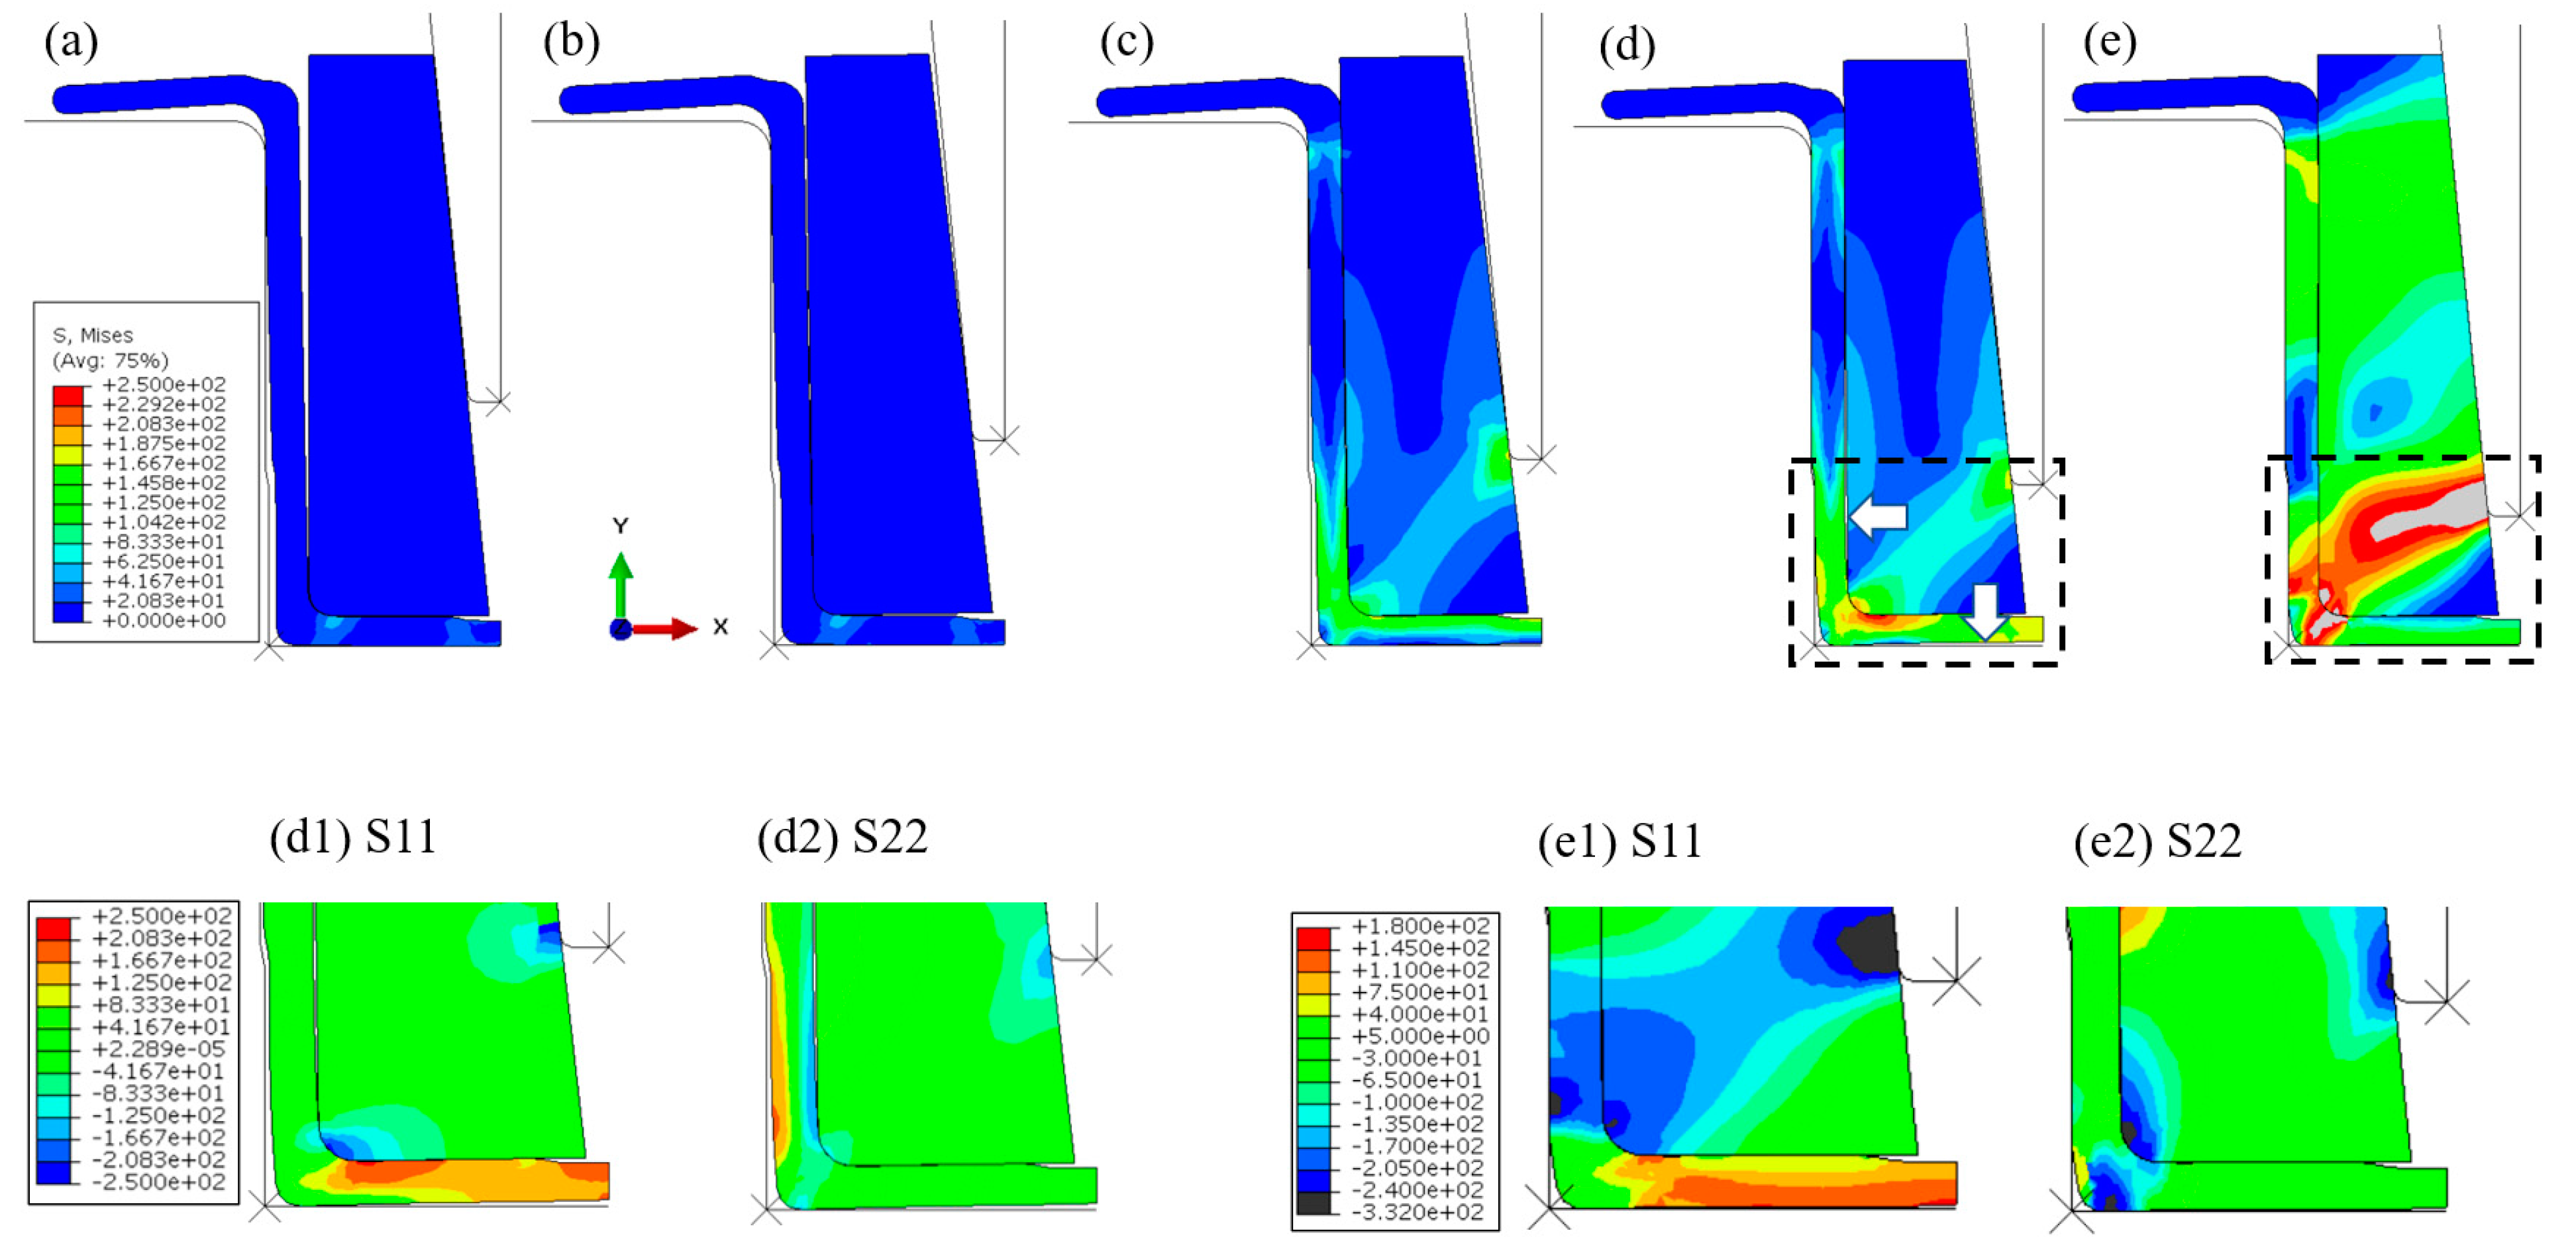
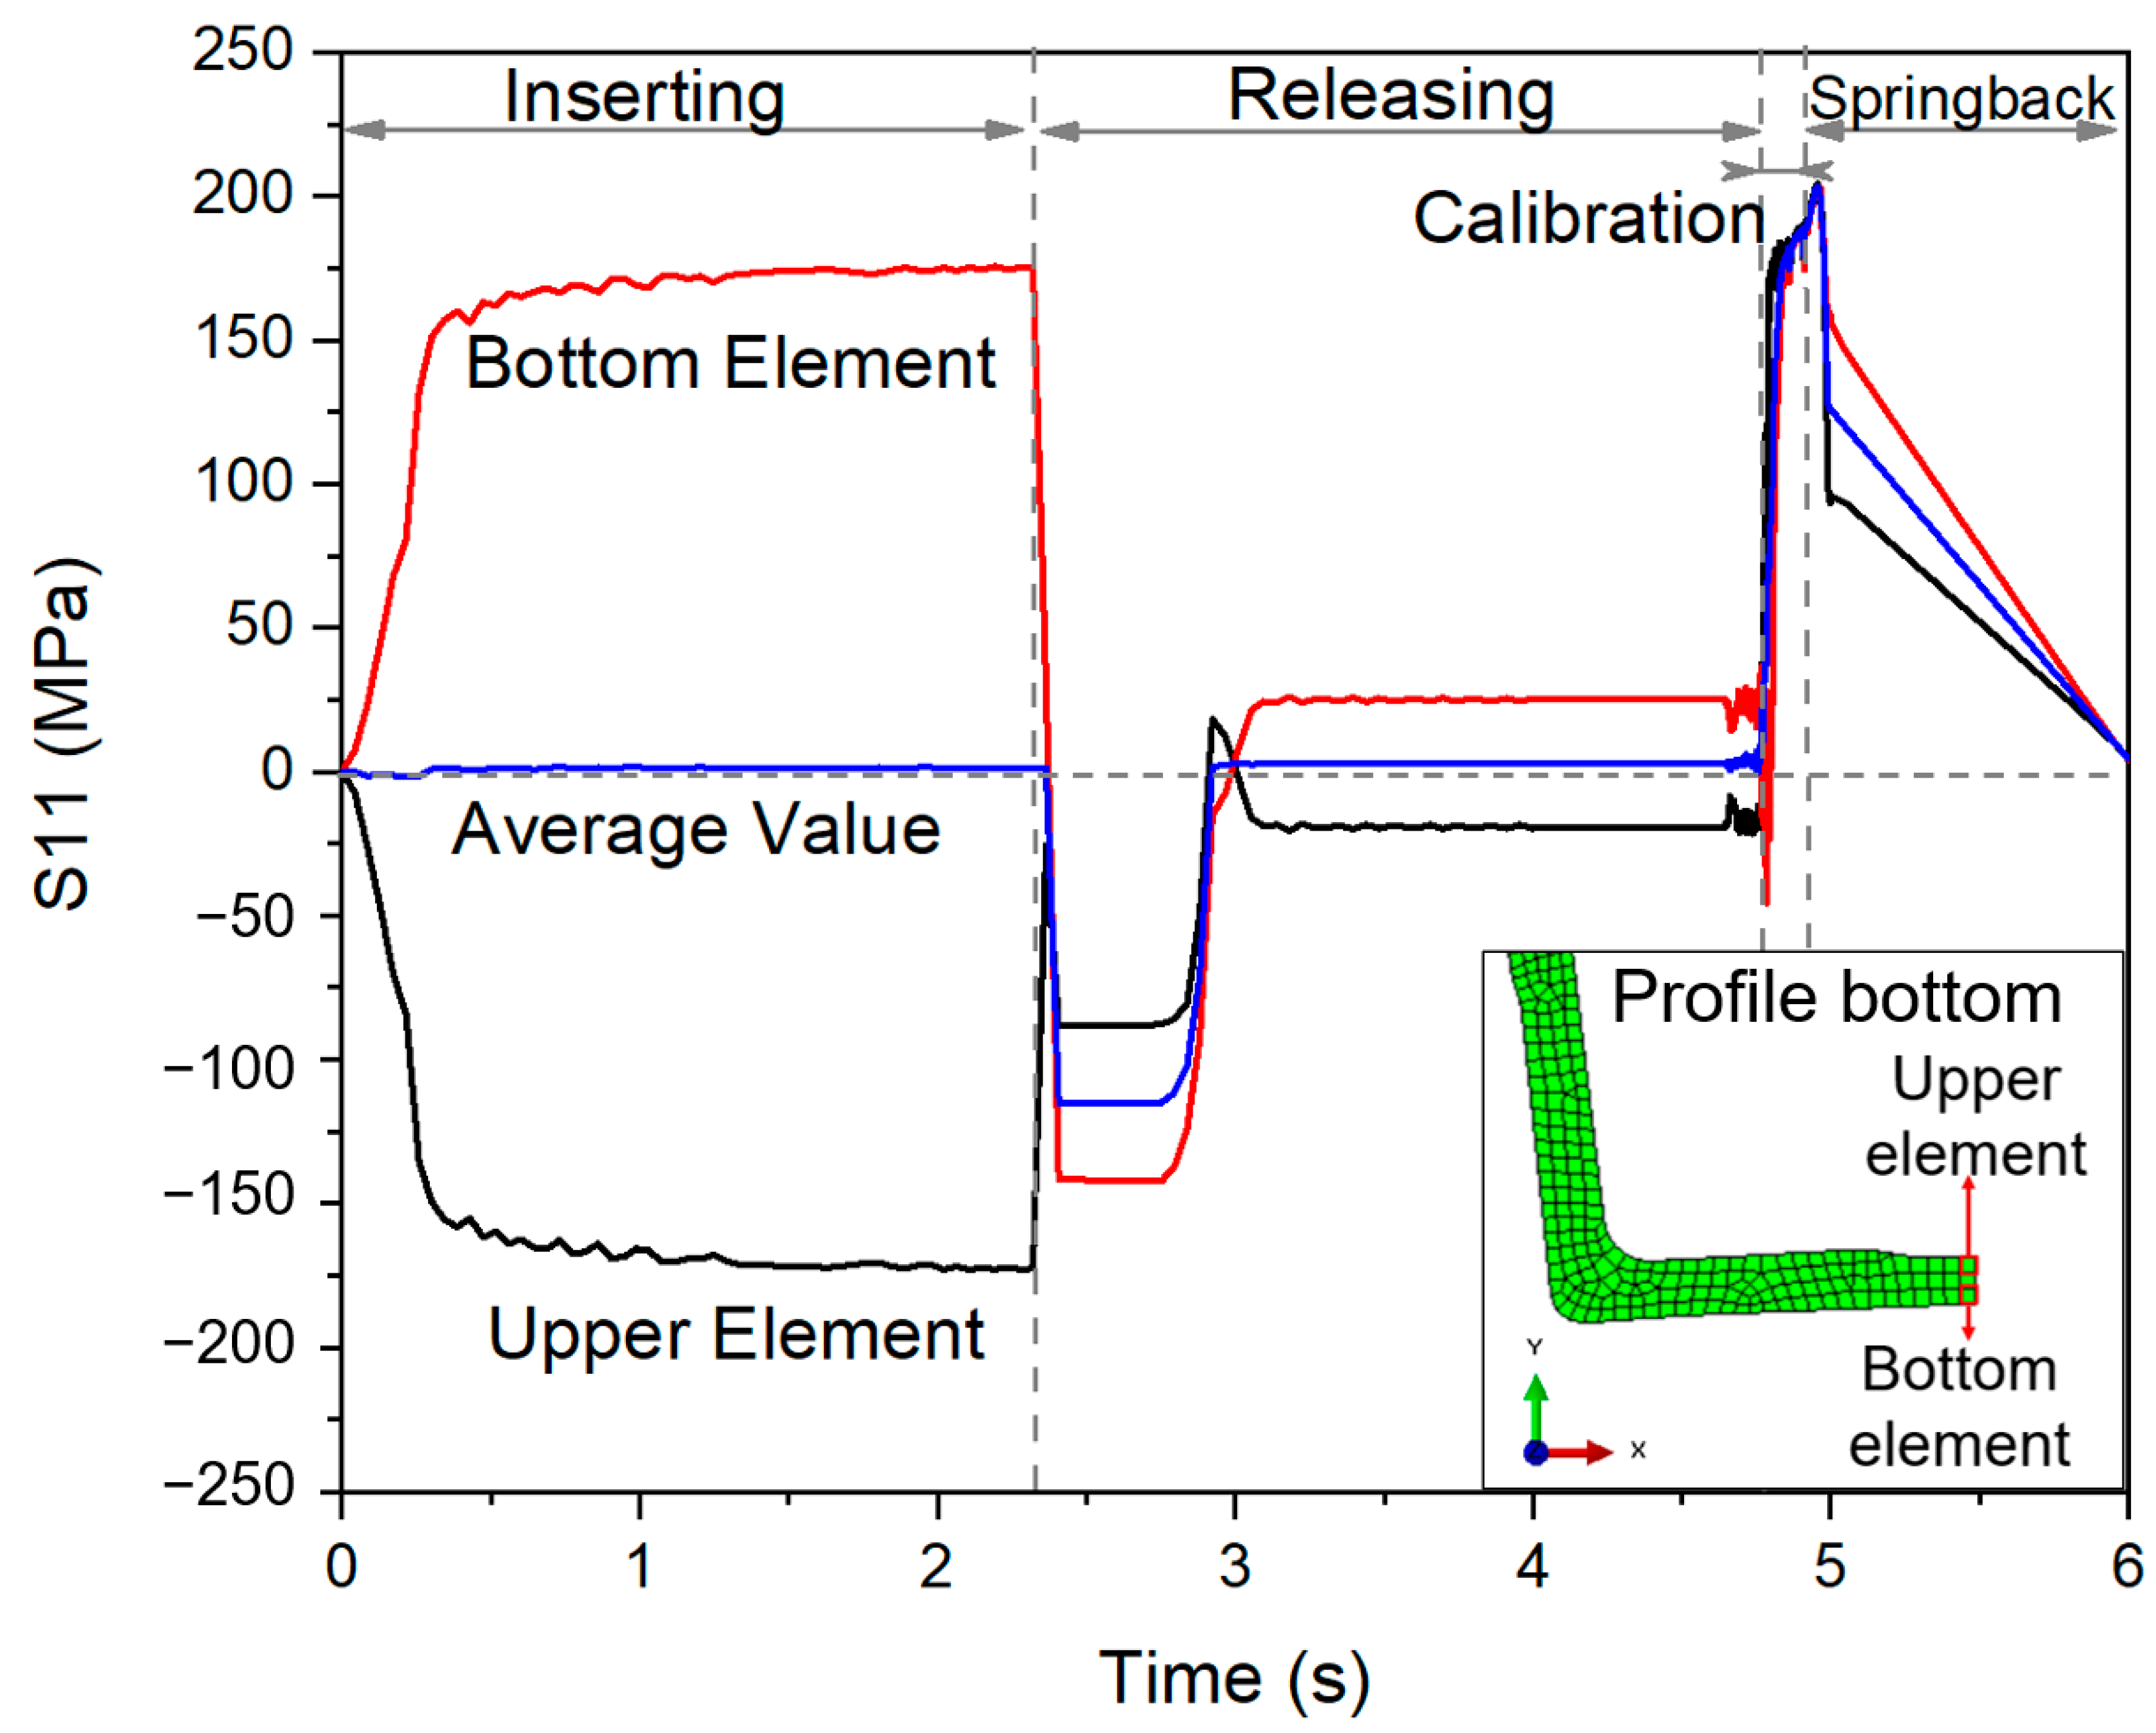
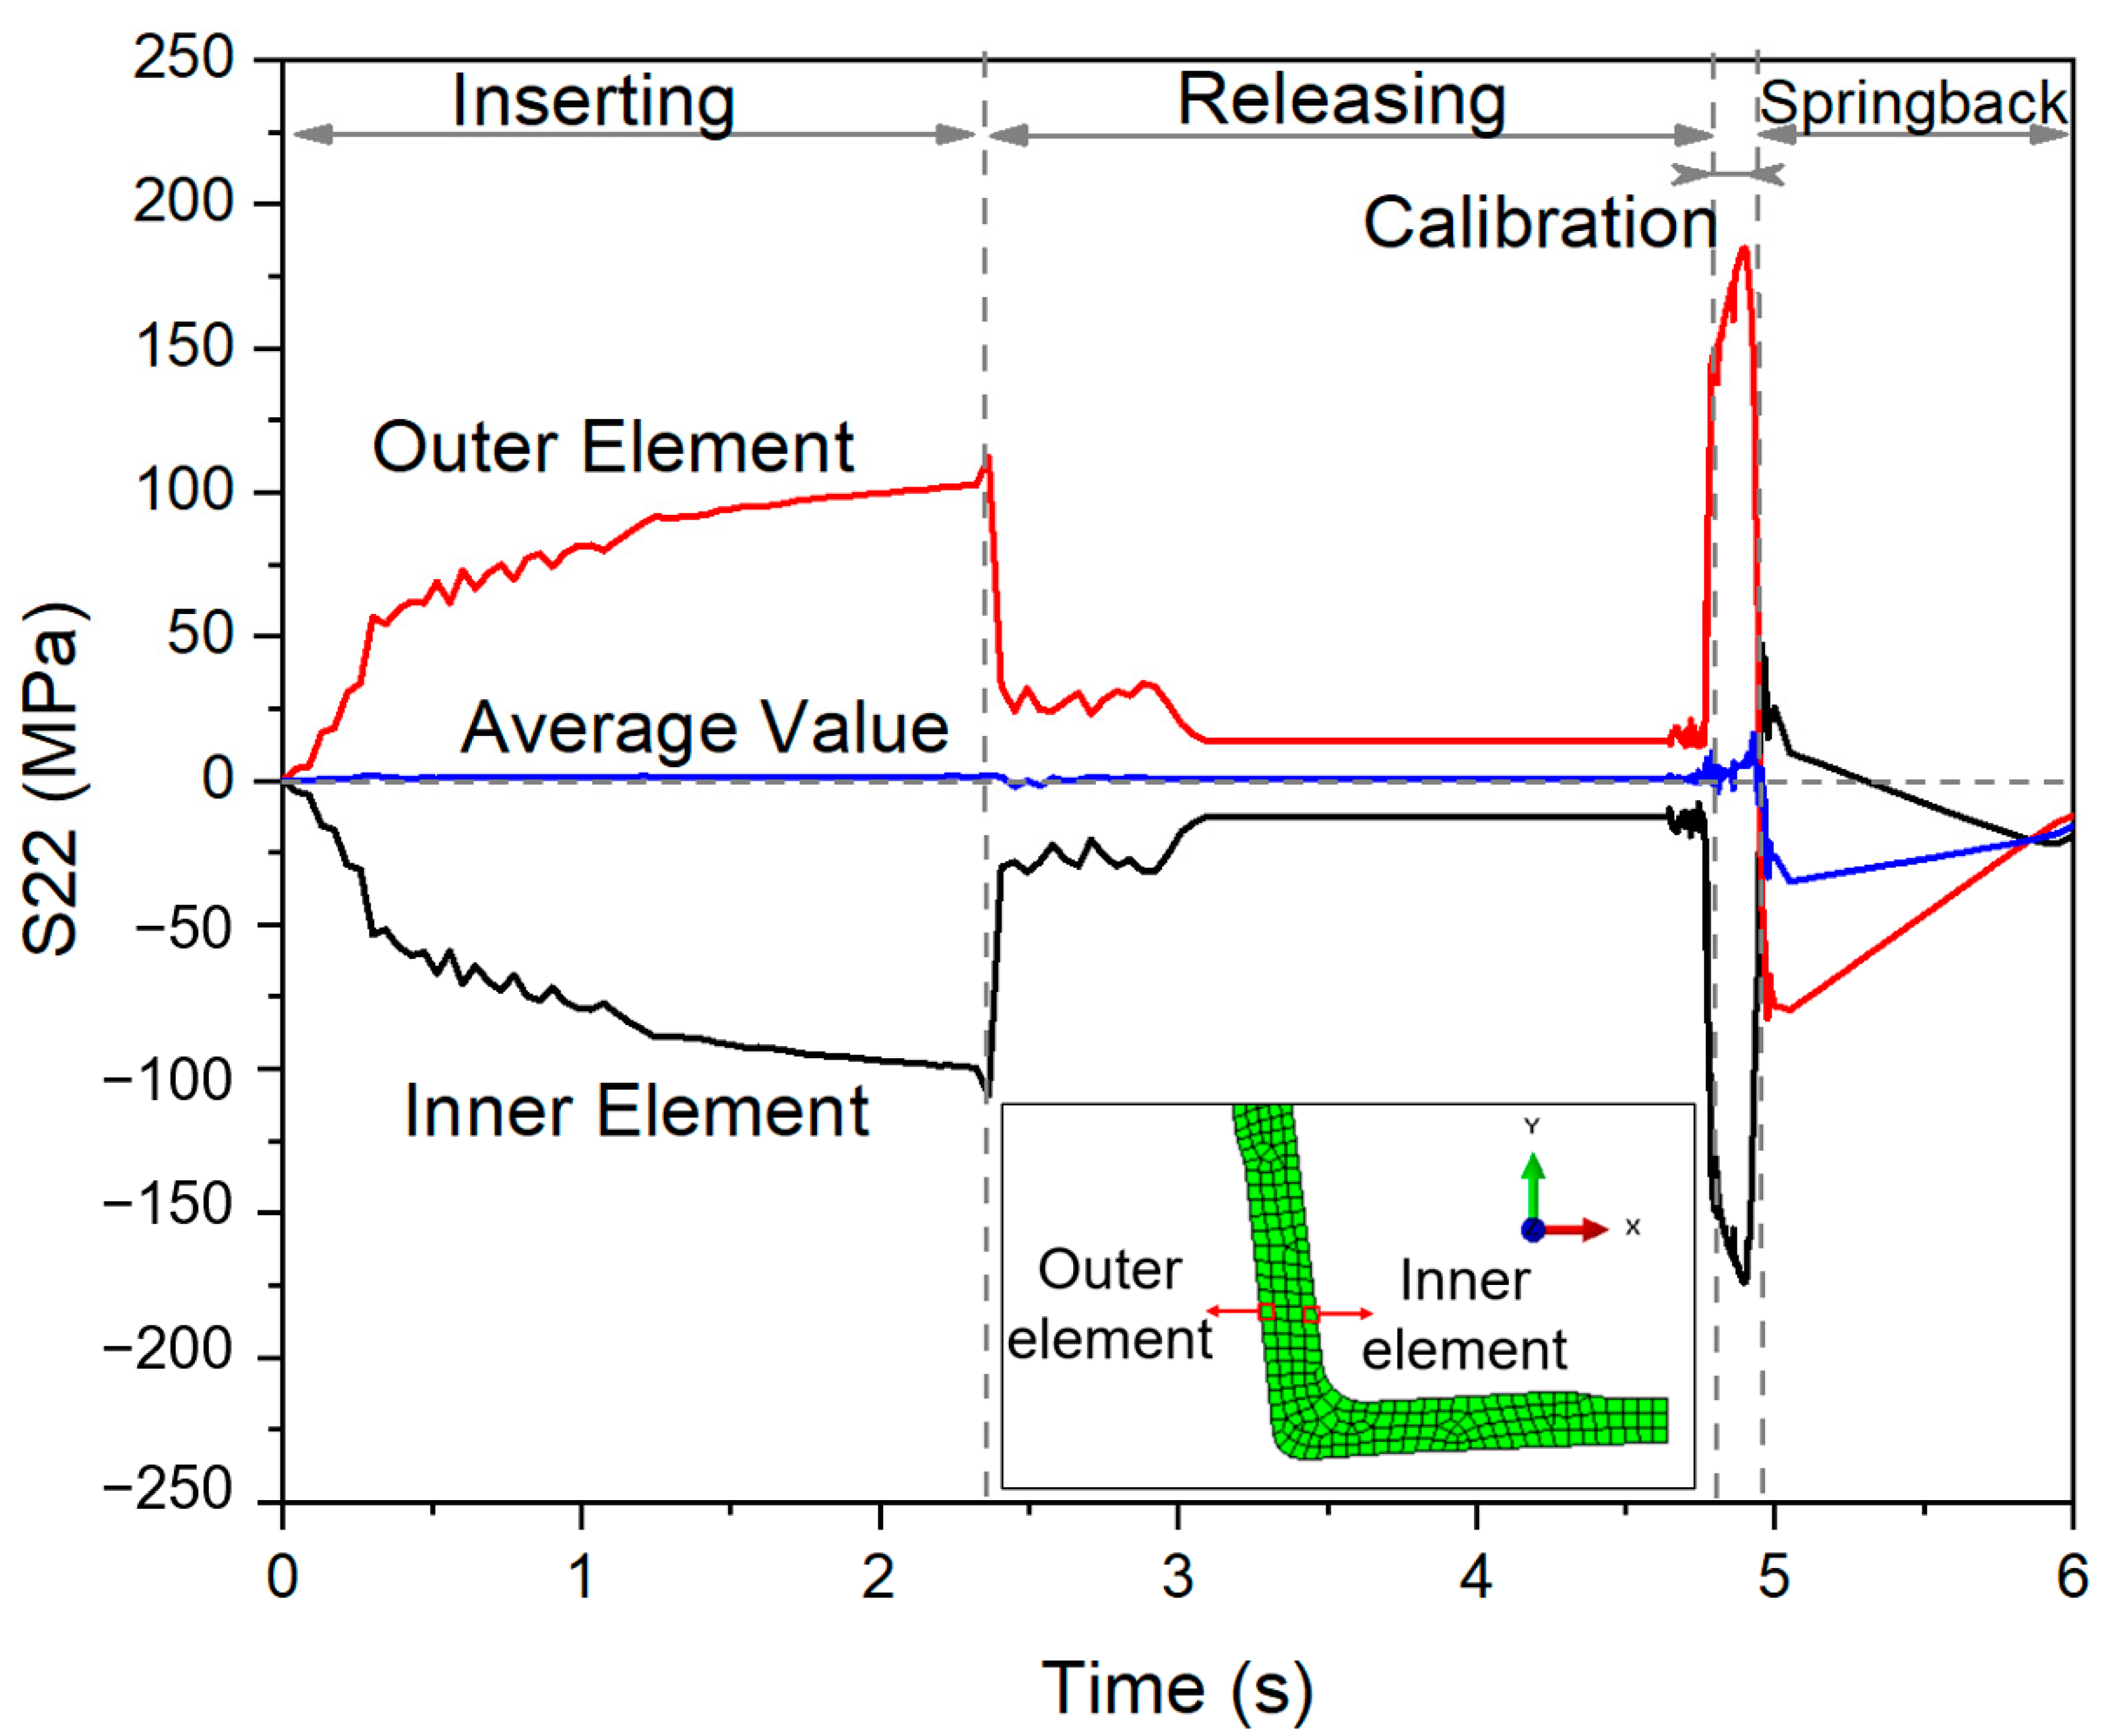
3.3.1. Analysis of Stress and Strain Evolution

Figure 7 illustrates the stress and strain evolution of the profile during the entire TSLB process, including the initial state, inserting, releasing, calibration, and springback stages.
Initially, the profile is placed freely on the bottom die, as shown in Figure 7a. Then, the block pushes it down to the die bottom, while the sidewall is bent locally, especially at the thinnest location, and the bottom flange is compressed owing to the convex there, as shown in Figure 7b. The deformation on the sidewall is within the elastic state (in Figure 7(b1)); however, the bottom has suffered plastic deformation (in Figure 7(c1)). During the calibration stage (in Figure 7d), the block driven by the wedge pushes the profile to the die bottom as well as the die sidewall. The highest stress and plastic strain occur at the corner, as shown in Figure 7d and d1. In Figure 7e, the higher stress disappears after releasing from the tools, but the plastic strain is preserved and contributes to the dimensional correction of the profile.
The calibration process is studied in more detail to evaluate the individual effects of the bending and stretching components on the deformation behaviours, consisting of five stages, as shown in Figure 8. The initial stage is presented in Figure 8a. Then, the wedge begins to move downward. The block does not compress the profile yet, but rotates around the corner owing to the gap between the profile sidewall and the block, as seen in Figure 8b. After coming fully into contact with the profile sidewall, the block begins to compress the profile, especially at the profile’s corner, leading to the bending of the sidewall of the profile and the stretching of the bottom flange, as shown in Figure 8c. Meanwhile, owing to the compression at the bottom corner, gaps were formed between the profile bottom and the bottom die, as well as between the profile sidewall and the block, as seen in Figure 8d. It can be seen from Figure 8(d1,d2) that the profile bottom undergoes stretching owing to the positive stress along the x-direction, while the sidewall undergoes bending owing to positive and negative stresses on two sides along the y-direction. The bending of the bottom flange is not evident. At the end of the calibration process (in Figure 8e), the block further pushes the corner of the profile to the die corner, generating a high stress concentration, and filling the gaps between the block and profile sidewall and the profile bottom with the die. Based on Figure 8(e1,e2), it can be seen that the bottom flange is stretched and bent based on the stress gradient along the thickness direction, while the sidewall is under strong normal compression owing to the contact force applied by the block.
The stress component along the horizontal direction on the profile bottom and that along the vertical direction on the profile sidewall are further investigated to clarify the stretching and bending behaviors on the whole process, as shown in Figure 9 and Figure 10.
As seen in Figure 9, two elements on the middle line are selected to investigate the stress evolution on the bottom profile. The S11 (stress component along the x-direction) values on these two elements vary significantly during this whole process. Mostly, the bottom is under tension because the S11 value is mostly positive, while the upper side is firstly under compression and then changes to tension during the calibration stage. During the insertion stage, the bottom is in a pure bending state without stretching as its average value is nearly zero. After releasing, compression occurs along the horizontal direction on the profile bottom due to the springback, followed by a stable stress state. During the calibration stage, the whole bottom is stretched to the highest stretching level as the block pushes the profile corner to the die corner. In the end, the stress values of both elements return to about zero, with a small amount of positive residual stress.
Similar to the profile bottom, the profile sidewall is also in a pure bending state, with the inside under compression and the outside under tension. The stresses reduce to low levels after releasing, with the average value remaining zero. The calibration increases the S22 (stress component along y direction) values on both inner and outer elements to a new high level of about 200 MPa. The average value increases, but remains at a low level. After unloading, the stresses reduce sharply, and the negative residual stress remains in the profile sidewall in the end.
Therefore, the profile bottom is in a pure bending state during the insertion stage and changes to the stretching state in the calibration stage. However, the sidewall remains in a pure bending state in both the insertion and calibration stages. In the end, the positive residual stress exists in the bottom with the negative residual stress in the sidewall.

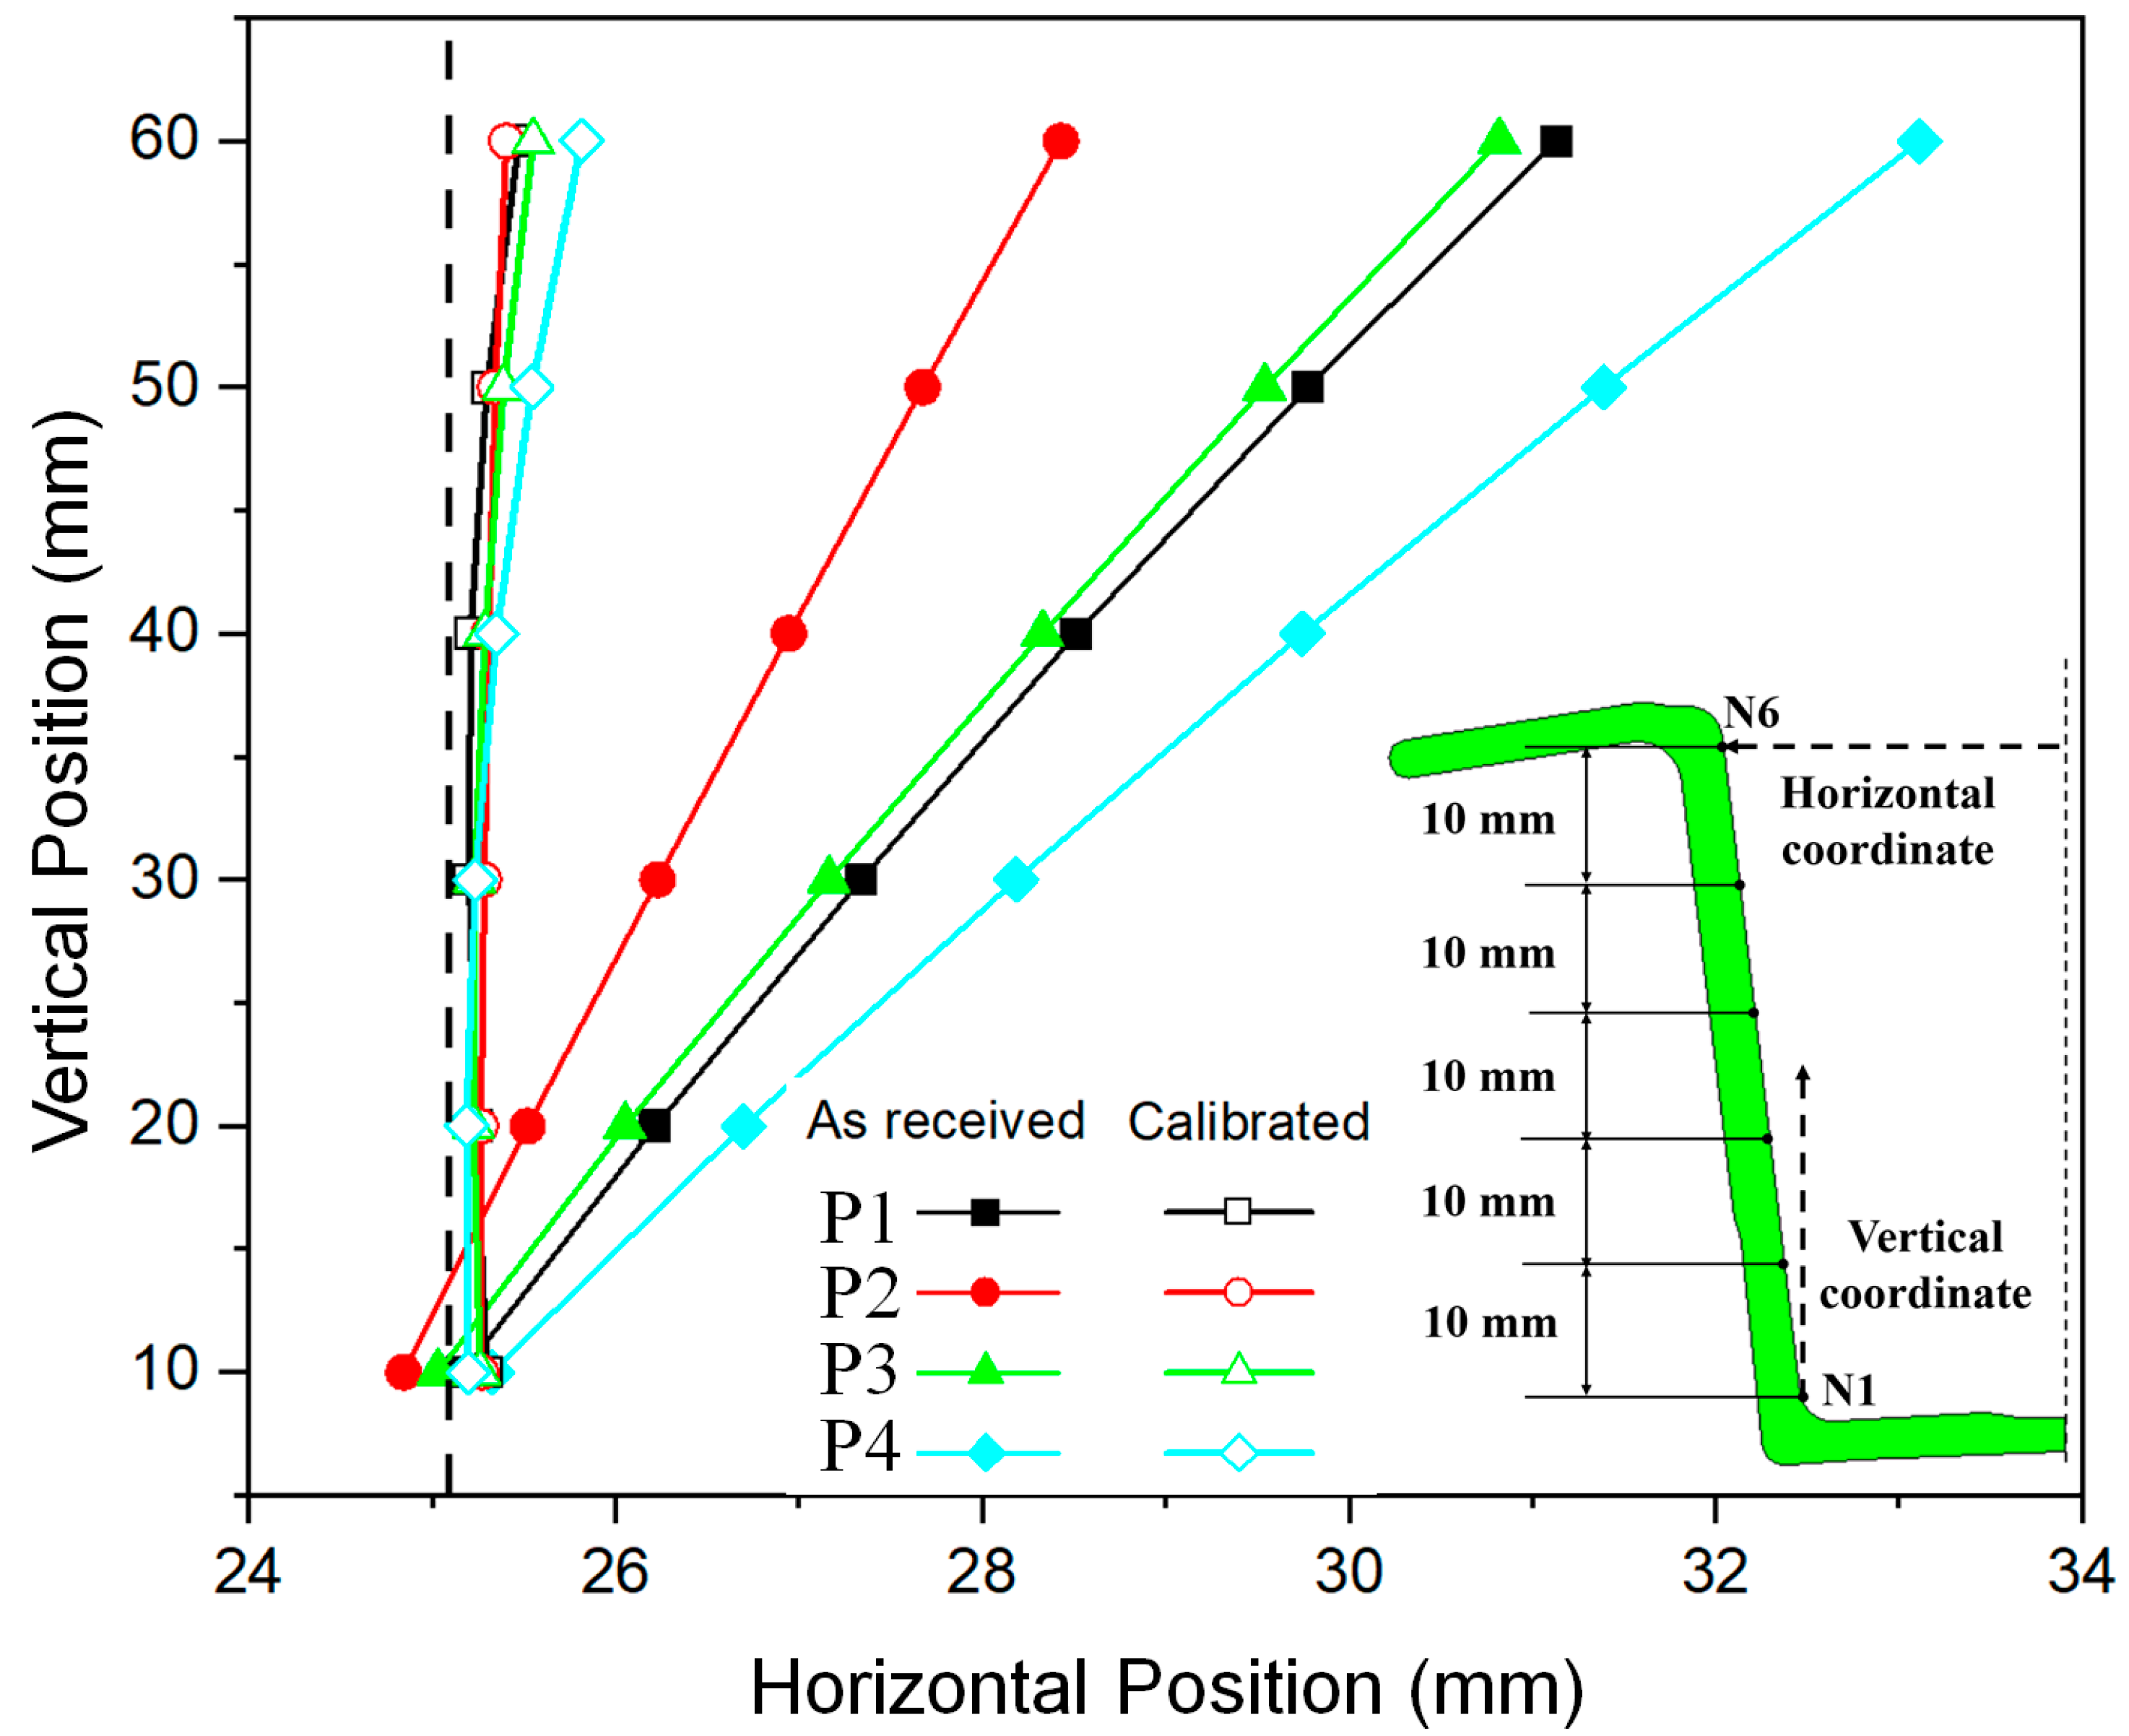
3.3.2. Analysis of Dimensional Evolution

Three dimensional parameters during the TSLB process are investigated, gaps A and B and convex distance, as shown in Figure 11. Initially, there is a large dimensional variation between gaps A and B owing to the severe sidewall inclination. In the end, the variation is reduced from 7.1 mm to 0.4 mm and their dimensions move closer to the desired dimension of 25.1 mm. The convex distance, which is not expected in the design, is also reduced from 1.25 to a very low level of 0.35 mm. This demonstrates the strong capability of this technique in correcting variable dimensional defects in open thin-walled extrusions.
During the inserting stage, gap A is significantly reduced owing to the reduction in the sidewall inclination, which causes the reduction of gap B as well. The convex distance is reduced significantly because of the compression from the block. However, a certain amount of springback occurs on the convex distance after releasing, while gap A and B remain stable during this stage owing to the constraint of the bottom die.
During the calibration stage, the variation between gap A and B nearly disappears and their values become very close to the desired value owing to the complete contact with the block and the bottom die. The convex distance varies greatly during this stage, increasing to a high level because of the initial compression of the block on the profile corner and then reducing to a new level owing to the compression from the block to the profile bottom. However, the compression is not quite high enough to fill the gap, leaving a slight deviation of 0.22 mm.
In the springback stage, the sidewalls open slightly owing to the elastic recovery, generating a slight increase in the value of gap A by 0.7 mm. Because gap B is closed to the bottom, its variation is not evident. The convex distance is also increased by a slight value of 0.1 mm. Thus, to achieve high dimensional accuracy, it is of great importance to take the spingback into account.
In summary, the gap opening, sidewall inclination, and bottom convex are generally corrected in the insertion stage, but in the calibration stage, the dimensional deviation is further corrected and becomes much closer to the nominal geometry.

3.3.3. Effect of Wedge Slope on Dimensional Accuracy Improvement

Profiles with three different wedge angles are used to study the capability of the calibration process. The three wedge angles are set as 5°, 10°, and 20°, as shown in Figure 4b. Figure 12 compares the simulated final dimensions of the profiles with three different wedge angles. The standard angle 10° refers to the angle the same as that in the experimental case P1. It can be found that the dimensional accuracies in gap A, gap B, and convex distance are all improved significantly for 5°, 10°, and 20° wedge angles, with the highest improvement percentage of 94.6%, 97.3%, and 79.0%, respectively. It is interesting to notice that the highest relative accuracy improvement in the three items does not occur in the same case. Moreover, in the low-angle case, the value of gap A is less than that of gap B, implying that the sidewall inclines toward the middle line.
Further investigations were conducted to analyse the underlying reasons. Figure 13 compares the Von Mises stress at the end of the calibration stage and the plastic strain distribution after springback in the three cases. For all cases, the block creates compressive deformation of the profile corners, but at different levels. Gaps between the profile bottom and bottom die and between the profile sidewall and block are shown in Figure 13(a1,c1), respectively. It indicates that the horizontal displacement of the block to the profile sidewall is relatively larger in the low angle case, while the vertical displacement to the profile bottom is larger in the high angle case. This results from the different movement behaviours of the block under different wedge angles caused by different force distribution. This also causes the highest stress in low angle cases to occur on the sidewall, while in the other two cases, it occurs at the corner. The high stress concentration generates plastic deformation, which contributes to the dimensional correction, but results in the high springback after unloading simultaneously. By comparing the simulation results of the three cases after springback (Figure 13 (a2,b2,c2)), it can be found that the plastic deformation in the low angle case is much lower than that in the other cases. For the other two cases, the profile sidewall inclines to the die wall, while in the low angle case, it inclines to the middle section and becomes closest to the desired location.
In summary, the high angle provides a benefit in terms of correcting the bottom convexity, but the associated high level stress concentration would cause significant springback and deteriorate the gap opening. However, the low angle facilitates the correction of the sidewall inclination, while its ability to fix the bottom convexity is constrained. Thus, a compromised solution should be taken to arrive at an optimal result.

4. Conclusions

Achieving high dimensional accuracy of extrusions is of crucial importance and remains a challenging issue in mass production. This study comprehensively investigated the feasibility and deformation mechanisms of a newly developed TSLB dimension correction technique for U-channel aluminum alloy profiles by experimental and FE numerical approaches. The main dimensional problems in open extrusions, including gap opening, sidewall inclination, and bottom convex, were investigated, with their evolution during the calibration process being analysed. The stretching and bending effects on dimensional correction were identified and, further, the effects of wedge angle on the dimensional accuracy improvement are discussed. The main findings can be drawn as follows:
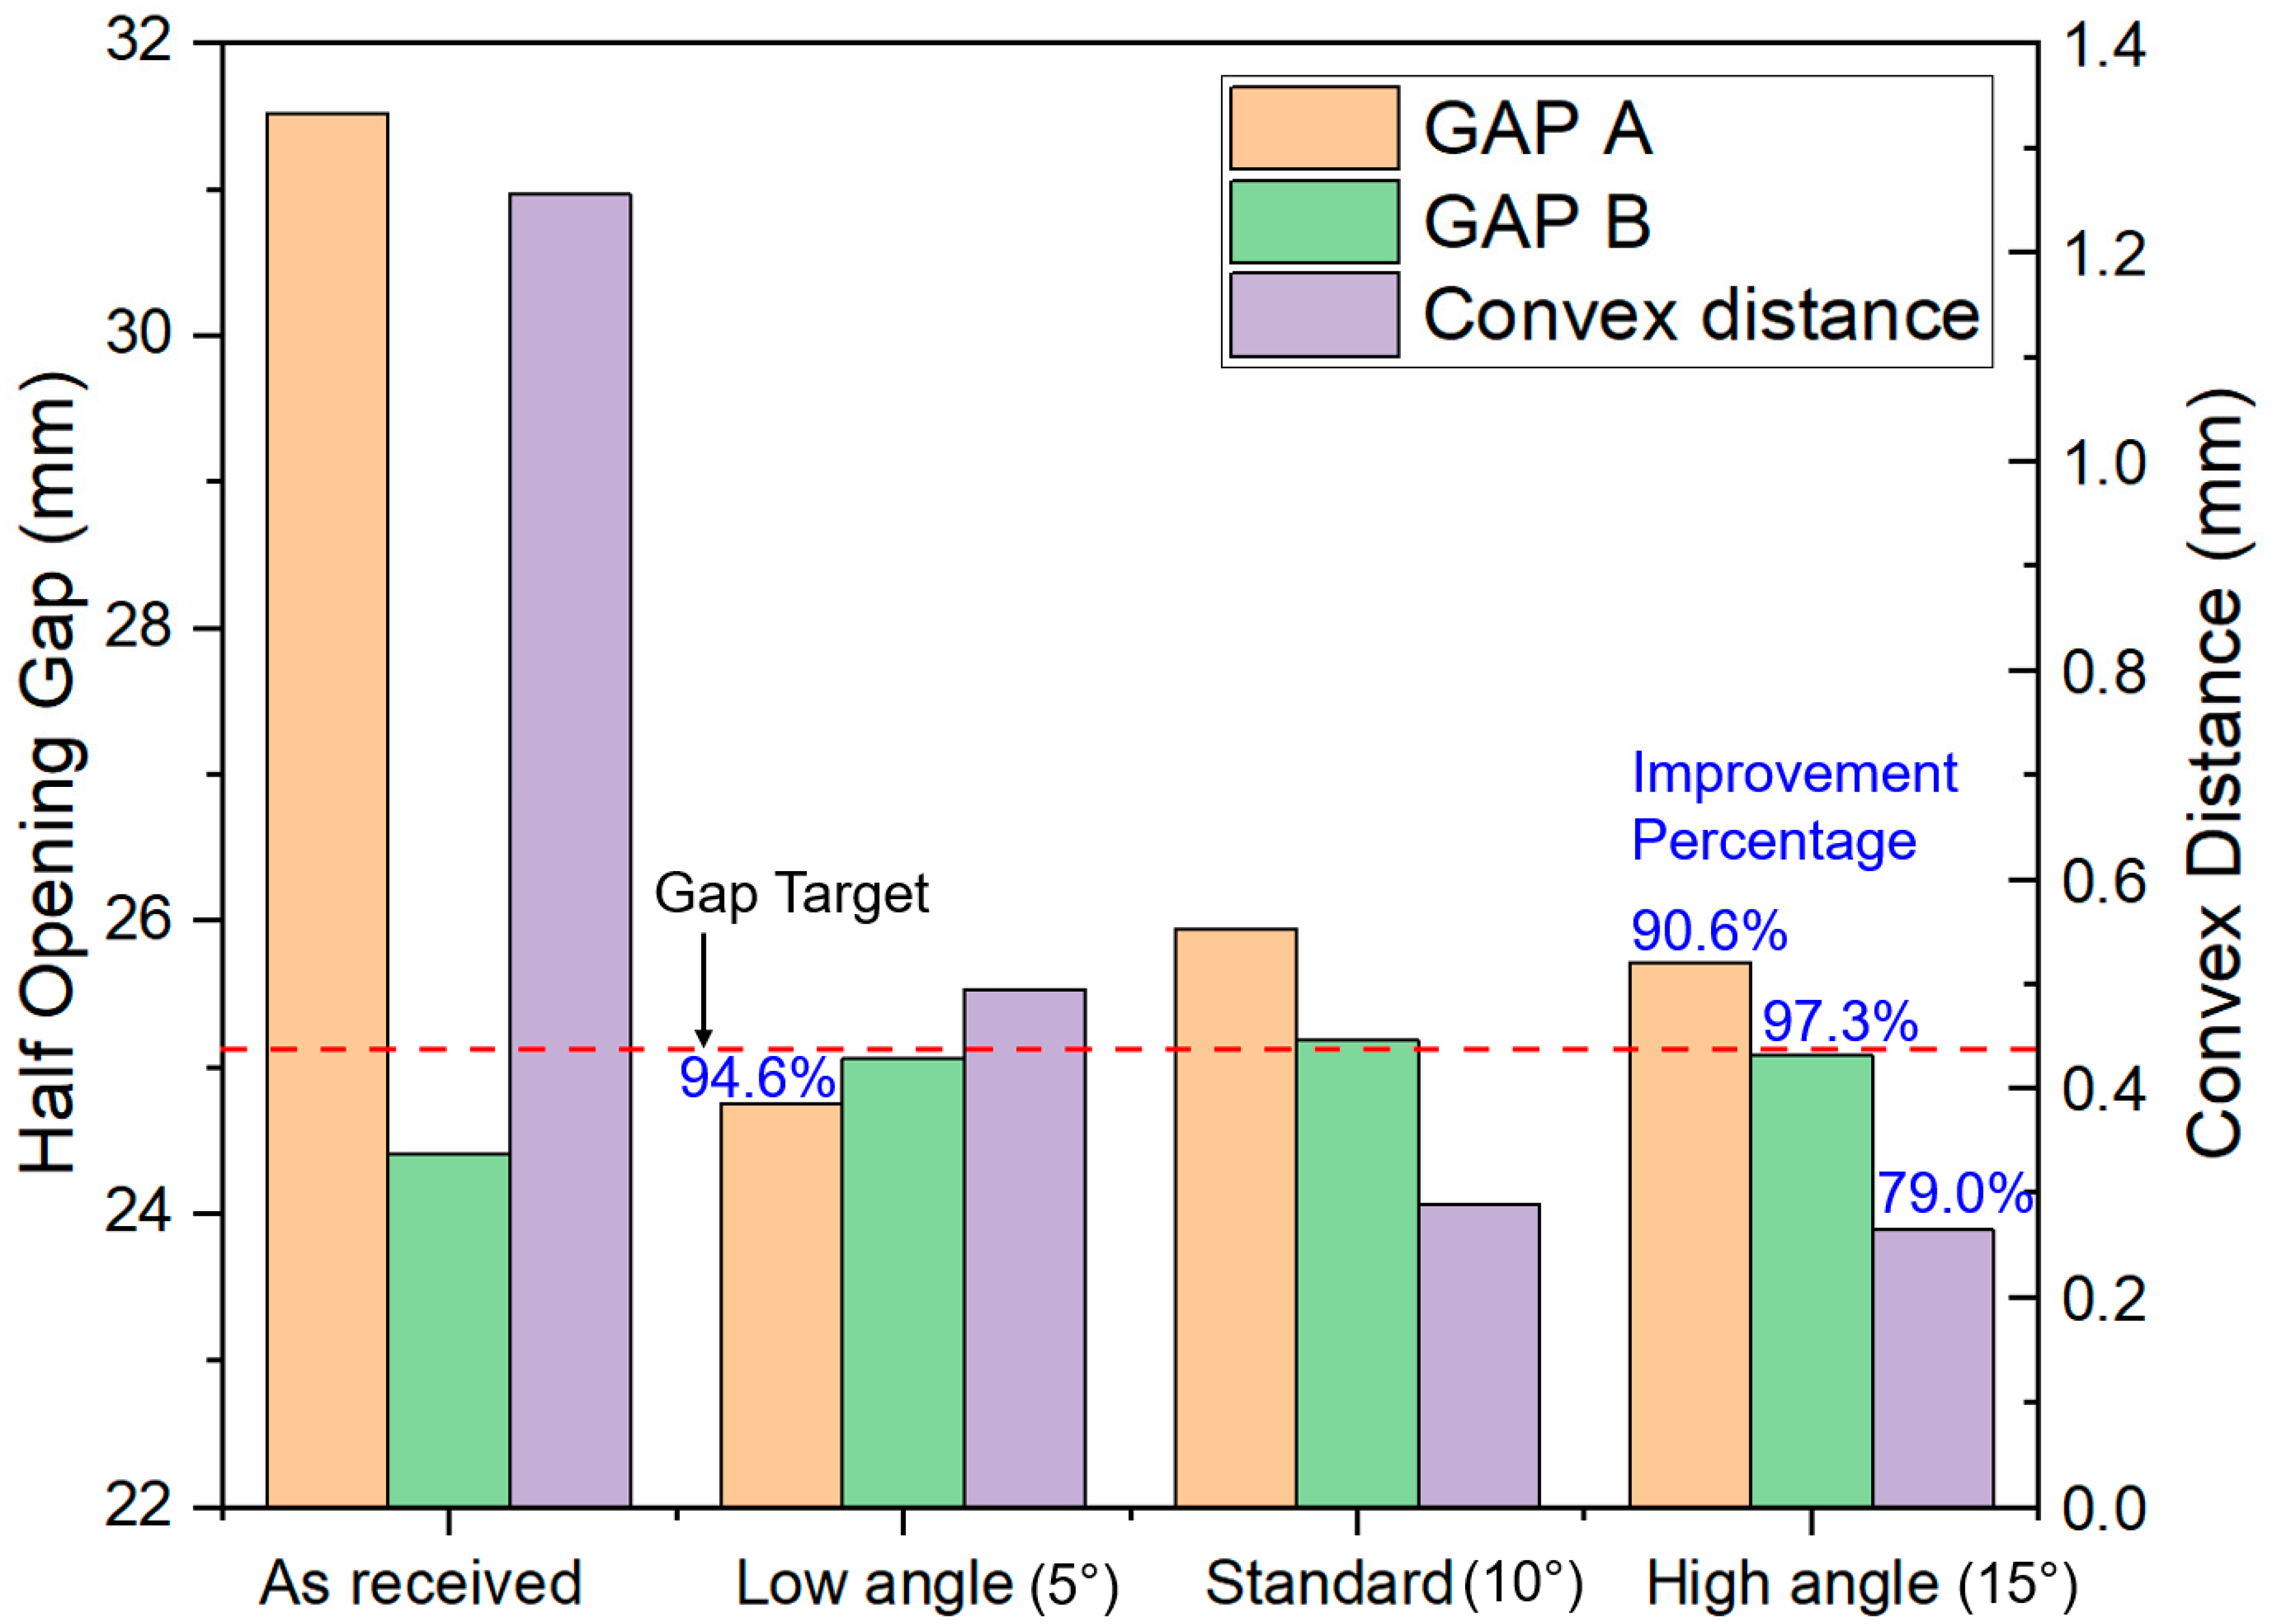
  • It is experimentally validated that the novel TSLB technique is capable of improving the dimensional accuracy for the thin-walled extrusions, with an average dimensional improvement of 92% for the four selected cases.
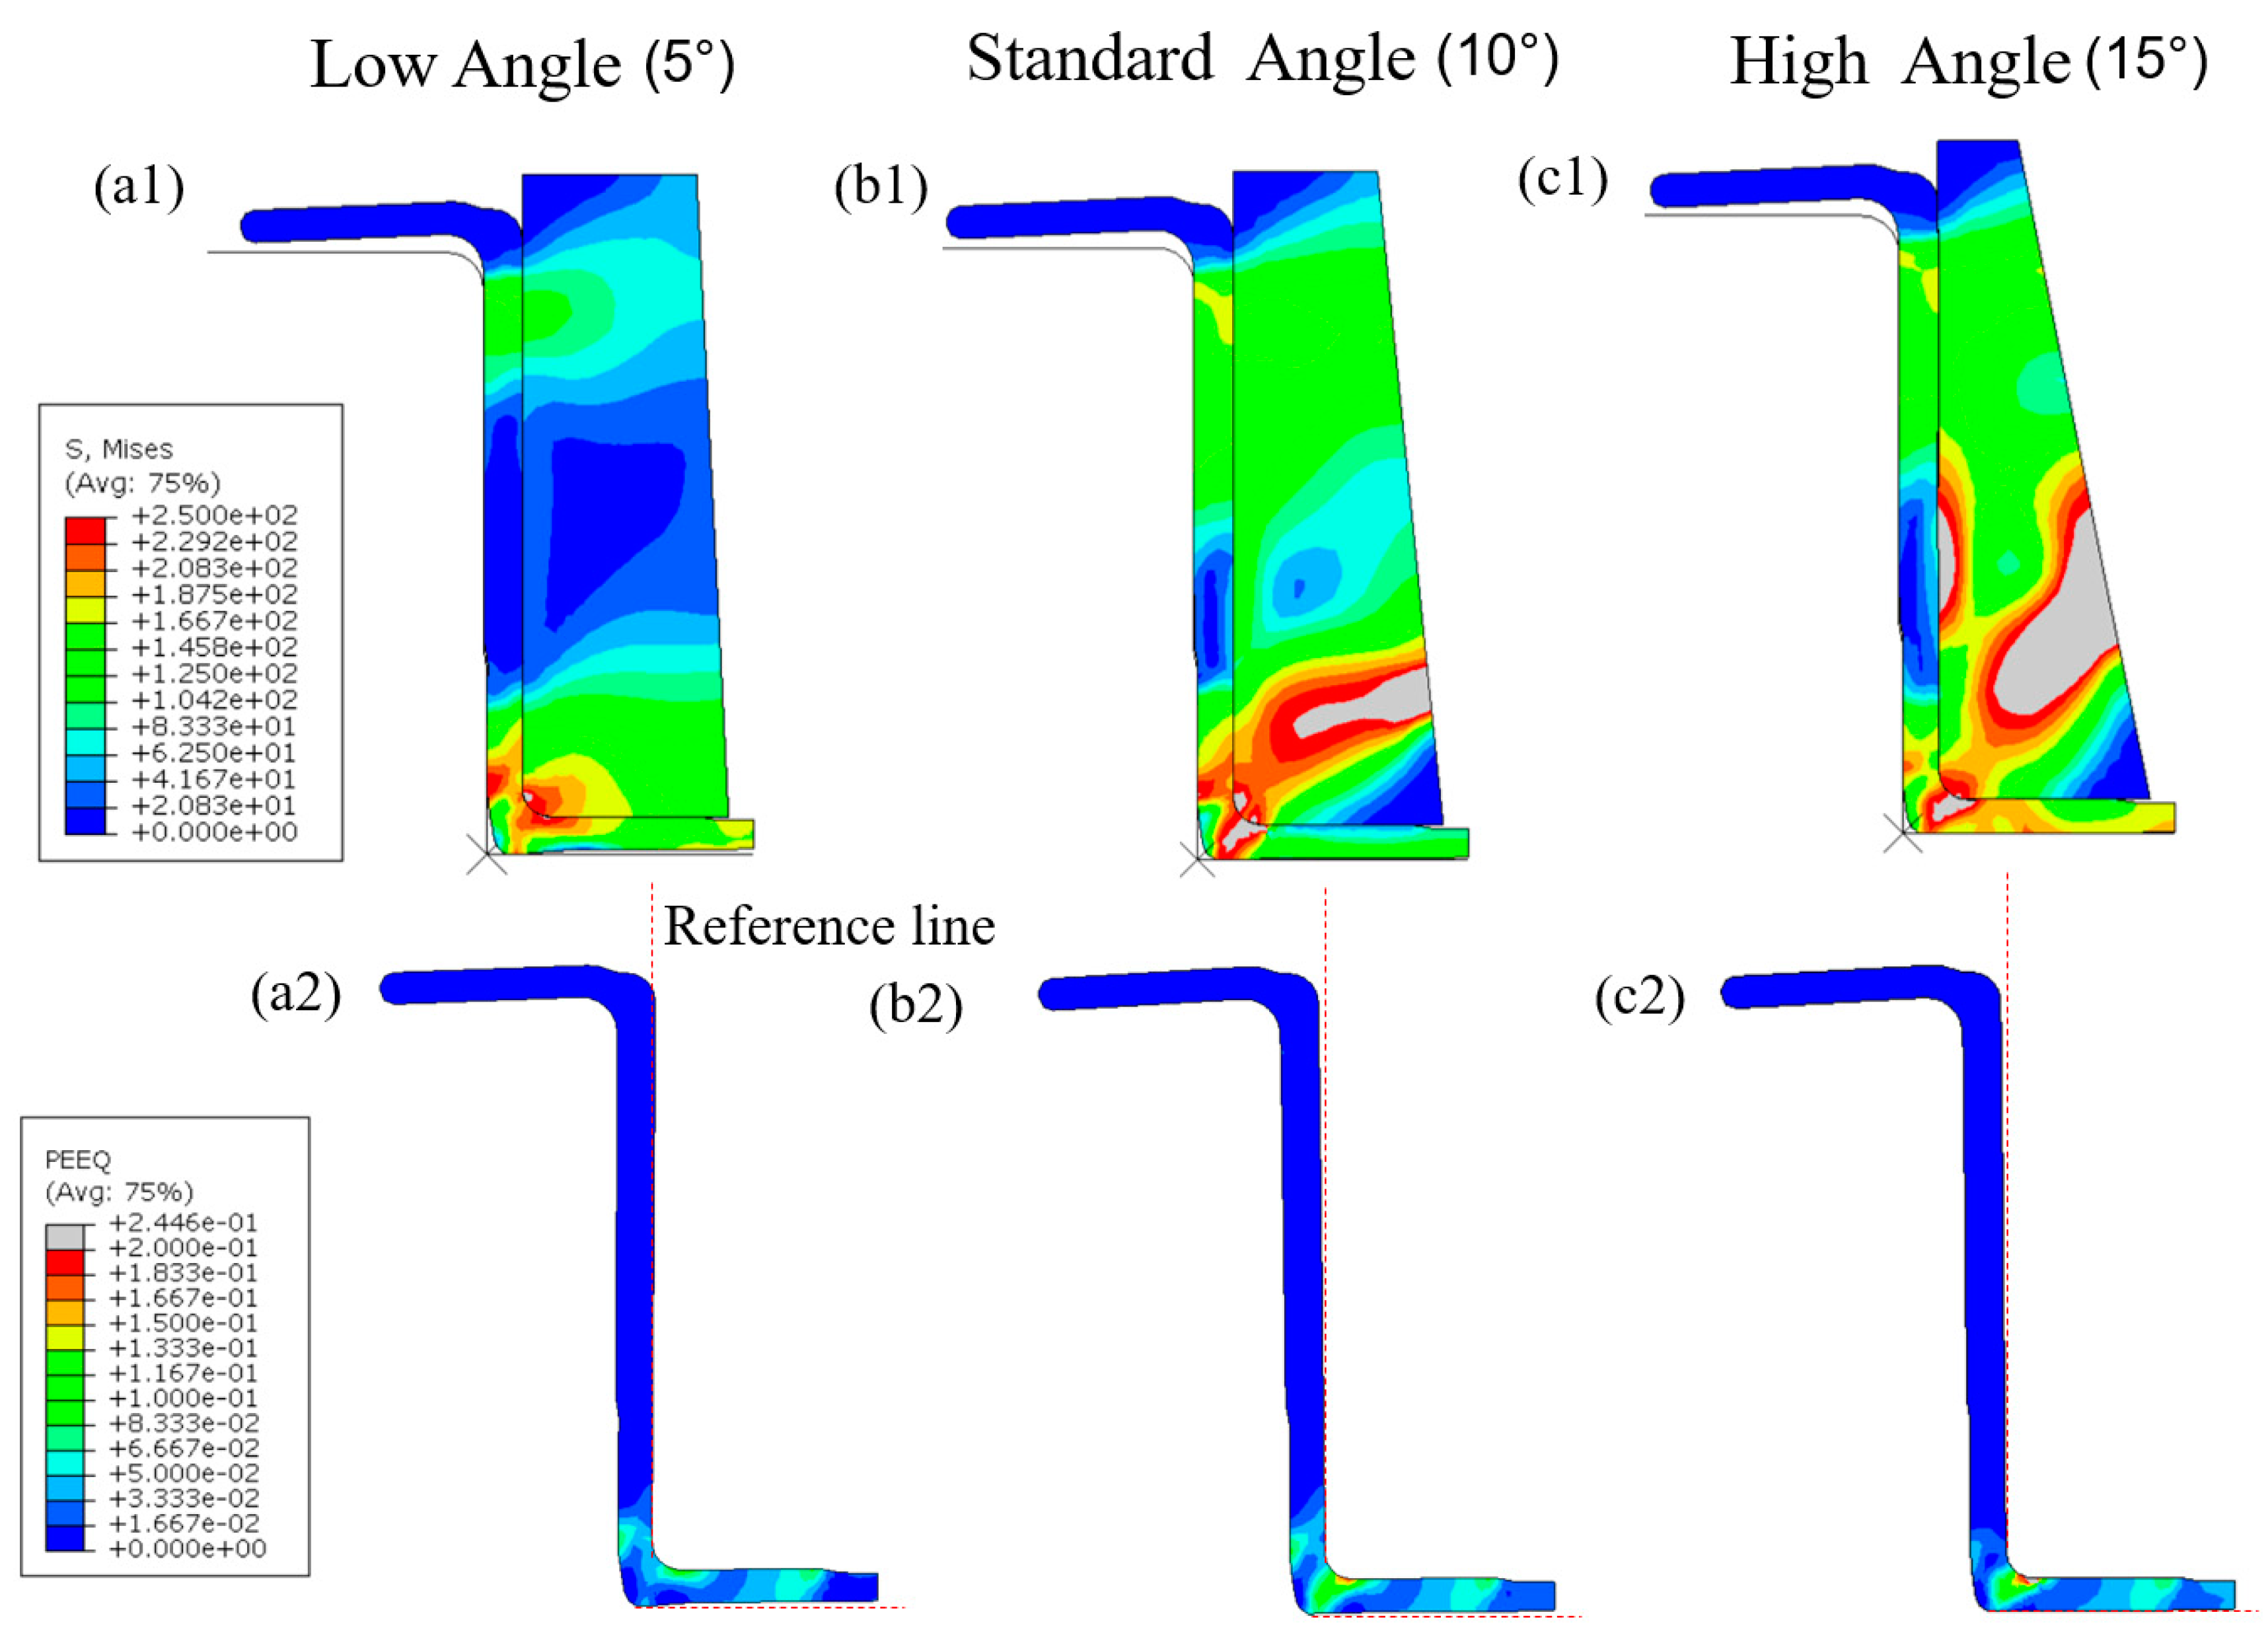
  • During the TSLB process, the profile sidewall is mainly subject to a pure bending state, while the profile bottom is under pure bending in the inserting stage and changes to the stretching stress state in the calibration stage. The bending of the sidewall provides a benefit in terms of correcting the sidewall inclination and the top gap opening. The bending of the bottom contributes to correcting the sidewall inclination and narrowing the top gap opening, while the stretching facilitates the straightening of the bottom convex.
  • The wedge angle affects the stress distribution on the profile. The high angle facilitates the reduction in bottom convex owing to the strong compression on the bottom surface, but it leads to severe plastic deformation and high springback after unloading. The low angle would be good for correcting the sidewall inclination and gap opening, but its capability for reducing the convex is limited. It is important to optimise the wedge angle during the tool design stage.

Author Contributions

Conceptualisation, X.Z. and J.M.; methodology, X.Z. and S.A.T.; software, X.Z. and S.A.T.; validation, X.Z.; formal analysis, X.Z.; investigation, X.Z. and J.M.; resources, J.M.; data curation, J.M.; writing—original draft preparation, X.Z. and J.M.; writing—review and editing, J.M.; visualisation, X.Z.; supervision, T.W.; project administration, T.W.; funding acquisition, T.W.; paper conceptualization and structure, T.W. All authors have read and agreed to the published version of the manuscript.

Funding

This research was funded by the Norwegian University of Science and Technology (NTNU), NTNU Aluminium Product Innovation Centre (NAPIC), Research Council Norway, Hydro and Alcoa via the Value project (grant no. 267768), and the EXPECT project (grant no. 321571).

Institutional Review Board Statement

Not applicable

Informed Consent Statement

Not applicable

Acknowledgments

Thanks to Hydro and Benteler and RCN under the grant of Expect (grant no. 321571) for the financial support. Sincere gratitude is given to Christian Arne Raknes for TSLB tests and Professor Knut Sørby for dimensional measurements.

Conflicts of Interest

The authors declare no conflict of interest.

References

  1. Mallick, P.K. Materials, Design and Manufacturing for Lightweight Vehicles; Elsevier: Amsterdam, The Netherlands, 2020. [Google Scholar]
  2. Cao, J.; Banu, M. Opportunities and Challenges in Metal Forming for Lightweighting: Review and Future Work. J. Manuf. Sci. Eng. 2020, 142, 1–24. [Google Scholar] [CrossRef]
  3. Rosenthal, S.; Maaß, F.; Kamaliev, M.; Hahn, M.; Gies, S.; Tekkaya, A.E. Lightweight in Automotive Components by Forming Technology. Automot. Innov. 2020, 3, 195–209. [Google Scholar] [CrossRef]
  4. Zheng, J.H.; Lin, J.; Allwood, J.M.; Dean, T. A universal mass-based index defining energy efficiency of different modes of passenger transport. Int. J. Light. Mater. Manuf. 2021, 4, 423–433. [Google Scholar] [CrossRef]
  5. Welo, T.; Ringen, G.; Ma, J. An overview and evaluation of alternative forming processes for complex aluminium products. Procedia Manuf. 2020, 48, 82–89. [Google Scholar] [CrossRef]
  6. Hirsch, J. Aluminium in innovative light-weight car design. Mater. Trans. 2011, 52, 818–824. [Google Scholar] [CrossRef] [Green Version]
  7. Zhu, L.; Li, N.; Childs, P.R.N. Light-weighting in aerospace component and system design. Propuls. Power Res. 2018, 7, 103–119. [Google Scholar] [CrossRef]
  8. Rong, Q.; Shi, Z.; Li, Y.; Lin, J. Constitutive modelling and its application to stress-relaxation age forming of AA6082 with elastic and plastic loadings. J. Mater. Process. Technol. 2021, 295, 117168. [Google Scholar] [CrossRef]
  9. Zheng, K.; Politis, D.J.; Wang, L.; Lin, J. A review on forming techniques for manufacturing lightweight complex d shaped aluminium panel components. Int. J. Light. Mater. Manuf. 2018, 1, 55–80. [Google Scholar] [CrossRef]
  10. Zhou, W.; Lin, J.; Dean, T.A.; Wang, L. Analysis and modelling of a novel process for extruding curved metal alloy profiles. Int. J. Mech. Sci. 2018, 138, 524–536. [Google Scholar] [CrossRef]
  11. Zheng, K.; Zhu, L.; Lin, J.; Dean, T.A.; Li, N. An experimental investigation of the drawability of AA6082 sheet under different elevated temperature forming processes. J. Mater. Process. Technol. 2019, 273, 116225. [Google Scholar] [CrossRef]
  12. Zhou, W.; Shao, Z.; Yu, J.; Lin, J. Advances and trends in forming curved extrusion profiles. Materials 2021, 14, 1603. [Google Scholar] [CrossRef]
  13. Allwood, J.M.; Duncan, S.R.; Cao, J.; Groche, P.; Hirt, G.; Kinsey, B.; Kuboki, T.; Liewald, M.; Sterzing, A.; Tekkaya, A.E. Closed-loop control of product properties in metal forming. CIRP Ann. Manuf. Technol. 2016, 65, 573–596. [Google Scholar] [CrossRef] [Green Version]
  14. Zhou, W.; Yu, J.; Lin, J.; Dean, T.A. Effects of die land length and geometry on curvature and effective strain of profiles produced by a novel sideways extrusion process. J. Mater. Process. Technol. 2020, 282, 116682. [Google Scholar] [CrossRef]
  15. Li, Y.; Rong, Q.; Shi, Z.; Sun, X.; Meng, L.; Lin, J. An accelerated springback compensation method for creep age forming. Int. J. Adv. Manuf. Technol. 2019, 102, 121–134. [Google Scholar] [CrossRef] [Green Version]
  16. Vollertsen, F.; Sprenger, A.; Kraus, J.; Arnet, H. Extrusion, channel, and profile bending: A review. J. Mater. Process. Technol. 1999, 87, 1–27. [Google Scholar] [CrossRef]
  17. Li, P.; Wang, L.; Li, M. Flexible-bending of profiles with asymmetric cross-section and elimination of side bending defect. Int. J. Adv. Manuf. Technol. 2016, 87, 2853–2859. [Google Scholar] [CrossRef]
  18. Zhou, Y.; Li, P.; Li, M.; Wang, L. Application and correction of L-shaped thin-wall aluminum in flexible-bending processing. Int. J. Adv. Manuf. Technol. 2017, 92, 981–988. [Google Scholar] [CrossRef]
  19. Allwood, J.M.; Cleaver, C.J.; Loukaides, E.G.; Music, O.; Nagy-Sochacki, A. Folding-shearing: Shrinking and stretching sheet metal with no thickness change. CIRP Ann. 2019, 68, 285–288. [Google Scholar] [CrossRef]
  20. Zhang, Z.Q.; Yan, Y.H.; Yang, H.L. A simplified model of maximum cross-section flattening in continuous rotary straightening process of thin-walled circular steel tubes. J. Mater. Process. Technol. 2016, 238, 305–314. [Google Scholar] [CrossRef]
  21. Zhang, Z. Modeling and simulation for cross-sectional ovalization of thin-walled tubes in continuous rotary straightening process. Int. J. Mech. Sci 2019, 153–154, 83–102. [Google Scholar] [CrossRef]
  22. Li, K.Y.; Chen, C.K.; Yang, S.C. Profile determination of a tube-straightening roller by envelope theory. J. Mater. Process. Technol. 1999, 94, 157–166. [Google Scholar] [CrossRef]
  23. Bell, C.; Corney, J.; Zuelli, N.; Savings, D. A state of the art review of hydroforming technology: Its applications, research areas, history, and future in manufacturing. Int. J. Mater. Form. 2020, 13, 789–828. [Google Scholar] [CrossRef] [Green Version]
  24. Abrantes, J.P.; Szabo-Ponce, A.; Batalha, G.F. Experimental and numerical simulation of tube hydroforming (THF). J. Mater. Process. Technol. 2005, 164–165, 1140–1147. [Google Scholar] [CrossRef]
  25. Lang, L.; Gu, G.; Li, T.; Zhou, X. Numerical and experimental confirmation of the calibration stage’s effect in multi-operation sheet hydroforming using poor-formability materials. J. Mater. Process. Technol. 2008, 201, 97–100. [Google Scholar] [CrossRef]
  26. Wolfgang, K.; Andreas, S. 6xxx-crash alloys from HAI: An example of the success storey of the complete value chain under one roof. In Proceedings of the Aluminium 2000 Conference, Florence, Italy, 12–16 May 2015. [Google Scholar]
  27. Baringbing, H.A.; Welo, T.; Søvik, O.P. A new method for reducing dimensional variability of extruded hollow sections. AIP Conf. Proc. 2007, 908, 975–980. [Google Scholar] [CrossRef]
  28. Ma, J.; Welo, T. Analytical springback assessment in flexible stretch bending of complex shapes. Int. J. Mach. Tools Manuf. 2021, 160, 103653. [Google Scholar] [CrossRef]
  29. Ma, J.; Welo, T.; Blindheim, J.; Ha, T. Effect of Stretching on Springback in Rotary Stretch Bending of Aluminium Alloy Profiles. Key Eng. Mater. 2021, 883, 175–180. [Google Scholar] [CrossRef]
  30. Cao, J. Springback. In CIRP Encyclopedia of Production Engineering; Springer: Berlin/Heidelberg, Germany, 2019; p. 1592. [Google Scholar] [CrossRef]
  31. Tian, F.; Li, N. Investigation of the feasibility of a novel heat stamping process for producing complex-shaped Ti-6Al-4V panel components. Procedia Manuf. 2020, 47, 1374–1380. [Google Scholar] [CrossRef]
  32. Lin, J.; Dean, T.A.; Garrett, R.P.; Foster, A.D. Process for Forming Metal Alloy Sheet Components. British Patent WO2008/059242A2, 2008. [Google Scholar]
  33. Li, N.; Zheng, J.; Zhang, C.; Zheng, K.; Lin, J.; Dean, T.A. Investigation on fast and energy-efficient heat treatments of AA6082 in HFQ processes for automotive applications. MATEC Web Conf. 2015, 21, 05015. [Google Scholar] [CrossRef] [Green Version]
  34. Ma, J.; Welo, T.; Wan, D. The impact of thermo-mechanical processing routes on product quality in integrated aluminium tube bending process. J. Manuf. Process. 2021, 67, 503–512. [Google Scholar] [CrossRef]
  35. Li, Y.; Yu, L.; Zheng, J.H.; Guan, B.; Zheng, K. A physical-based unified constitutive model of AA7075 for a novel hot forming condition with pre-cooling. J. Alloys Compd. 2021, 876, 160142. [Google Scholar] [CrossRef]
  36. Zheng, K.; Li, Y.; Yang, S.; Fu, K.; Zheng, J.; He, Z.; Yuan, S. Investigation and modeling of the preheating effects on precipitation and hot flow behavior for forming high strength AA7075 at elevated temperatures. J. Manuf. Mater. Process. 2020, 4, 76. [Google Scholar] [CrossRef]
  37. Raknes, C.A.; Ma, J.; Welo, T.; Paulsen, F. A new mechanical calibration strategy for U-channel extrusions. Int. J. Adv. Manuf. Technol. 2020, 110, 241–253. [Google Scholar] [CrossRef]
  38. Qamar, S.Z.; Pervez, T.; Chekotu, J.C. Die defects and die corrections in metal extrusion. Metals 2018, 8, 380. [Google Scholar] [CrossRef] [Green Version]
Figure 1. Description of (a) as-received sample; (b) dimensions on half of the transverse cross section; and (c) dimensional defects including gap opening, non-right angle, and unexpected convex.
Metals 11 01786 g001
Figure 2. Stretch bending and local calibration experimental setup (redrawn from [37]).
Metals 11 01786 g002
Figure 3. Dimension correction process: (a) initial geometry; (b) profile placement in die; (c) releasing; (d) calibration; and (e) final part geometry.
Metals 11 01786 g003
Figure 4. Description of (a) the finite element model for the TSLB process with (b1b3) three different tool designs.
Metals 11 01786 g004
Figure 5. Comparison of profile sidewall dimensions before and after calibration processes in four samples, P1–P4.
Metals 11 01786 g005
Figure 6. Comparison of the experimental and simulated results of the profile sidewall in Case P1.
Metals 11 01786 g006
Figure 7. Stress and strain evolution during the TSLB process: Von Mises stress in (a) initial state; (b) inserting stage; (c) releasing stage; (d) calibration stage; and (e) springback stage and (b1,c1,d1,e1) the corresponding equivalent plastic strain distribution in the last four stages.
Metals 11 01786 g007
Figure 8. Von Mises stress evolution of the profile in the TSLB process: (a) initial state; (b) block rotating; (c) full contact stage of the block side to the profile side; (d) full contact on the bottom; and (e) final state and (d1,d2,e1,e2) stress components S11 and S22 during the last two stages.
Metals 11 01786 g008
Figure 9. S11 evolution of two elements on the profile bottom during the whole TSLB process.
Metals 11 01786 g009
Figure 10. S22 evolution of two elements on the profile sidewall during the whole TSLB process.
Metals 11 01786 g010
Figure 11. Dimensional evolution during the TSLB process in terms of gap A and B and convex distance.
Metals 11 01786 g011
Figure 12. Comparison of the final dimensions of the profiles under different wedge angles.
Metals 11 01786 g012
Figure 13. Stress–strain evolution on the profile under three different wedge angles: (a1,b1,c1) von Mises stress on the profiles after the calibration and (a2,b2,c2) equivalent plastic strain after springback.
Metals 11 01786 g013
Publisher’s Note: MDPI stays neutral with regard to jurisdictional claims in published maps and institutional affiliations.

