Article

Estimation of Fatigue Crack Growth Rate in Heat-Resistant Steel by Processing of Digital Images of Fracture Surfaces

1
Department of Industrial Automation, Ternopil National Ivan Puluj Technical University, 46001 Ternopil, Ukraine
2
Karpenko Physico-Mechanical Institute, The National Academy of Science of Ukraine, 79060 Lviv, Ukraine
3
Department of Materials Science and Engineering, Lviv Polytechnic National University, 79013 Lviv, Ukraine
4
Department of Mobile Machinery and Railway Transport, Vilnius Gediminas Technical University, 10105 Vilnius, Lithuania
*
Author to whom correspondence should be addressed.
Metals 2021, 11(11), 1776; https://doi.org/10.3390/met11111776
Submission received: 4 October 2021 / Revised: 28 October 2021 / Accepted: 31 October 2021 / Published: 4 November 2021

Abstract

:
The micro- and macroscopic fatigue crack growth (FCG) rates of a wide class of structural materials were analyzed and it was concluded that both rates coincide either during high-temperature tests or at high stress intensity factor (SIF) values. Their coincidence requires a high level of cyclic deformation of the metal along the entire crack front as a necessary condition for the formation of fatigue striations (FS). Based on the analysis of digital fractographic images of the fatigue fracture surfaces, a method for the quantitative assessment of the spacing of FS has been developed. The method includes the detection of FS by binarization of the image based on the principle of local minima, rotation of the highlighted fragments of the image using the Hough transform, and the calculation of the distances between continuous lines. The method was tested on 34KhN3M steel in the initial state and after long-term operation (~3 × 10⁵ h) in the rotor disk of a steam turbine at a thermal power plant (TPP). Good agreement was confirmed between FCG rates (both macro and microscopic, determined manually or using digital imaging techniques) at high SIF ranges and their noticeable discrepancy at low SIF ranges. Possible reasons for the discrepancy between the micro- and macroscopic FCG rates at low values of the SIF are analyzed. It has also been noted that FS is easier to detect on the fracture surface of degraded steel. Hydrogen embrittlement of steel during operation promotes secondary cracking along the FS, making them easier to detect and quantify. It is shown that the invariable value of the microscopic FCG rate at a low SIF range in the operated steel is lower than observable for the steel in the initial state. Secondary cracking of the operated steel may have contributed to the formation of a typical FS pattern along the entire crack front at a lower FCG rate than in unoperated steel.

1. Introduction

The rapid development of computer and information technologies, as well as information processing systems and artificial intelligence, leads to their increasing involvement in various fields of science and technology. In particular, image processing and pattern recognition methods are widely used in non-destructive testing and technical diagnostics [1,2,3]. They are especially used in radiography, for coating condition monitoring on structural elements of important structures and for rust detection [4,5,6], for condition monitoring and the diagnostics of complex mechanisms [7], followed by quantitative fractography and metallography and so forth [8].
Such approaches are based on the development of modern algebraic theories [9], fuzzy logic and optimization methods [10]. Fourier transform is widely used for studies of fatigue crack growth (FCG) in materials with interactive analysis of fatigue striation (FS) images [11]. For a quantitative assessment of the characteristic elements of fracture surfaces, fractographic images are analyzed using convolutional neural networks [12] and unsupervised machine learning [13]. At the same time, pattern recognition methods based on a modified support vector machine are being applied to fracture surface analysis [14]. The quantitative value of FCG rate is determined by estimating the dimensional characteristics of the fractographic features of the fracture surface [15]. The method of phase-modulated correlation is also used for the analysis of FS [16]. Correlative light-electron fractography technology is used to increase the accuracy of FS analysis in metal alloys [17]. These publications indicate the need to develop and improve methods for the processing of fractographic images of fracture surfaces, which would contribute to a more accurate assessment of the FCG rate at the microscopic level by assessing the quantitative characteristics of typical fracture surface elements.
Fracture mechanics approaches have long been used to characterize the resistance to FCG of various structural materials [18,19,20,21,22,23]. In this case, the dependence of the macroscopic rate of the FCG on the range of the stress intensity factor (SIF) is used. Based on a comparison of various fracture mechanisms of materials, steels and their welded joints after long-term exploitation in critical structures, fatigue fractures are recognized as one of the most dangerous [24,25]. In general, FS form a repeating pattern of practically parallel but intermittent lines curved in the direction of FCG [26]. Approaches to the quantitative analysis of FS are described in a series of monographs [27,28,29]. According to established notions, the FS pattern on the fracture surfaces is associated with crack increments in each of the load cycles of the element [30,31,32]. Fractographic approaches are most often used to estimate the FCG rate in aluminum and titanium alloys, which are important for aircraft construction. The FS are distinguished most clearly on these alloys. Based on their analysis, an almost direct relationship is shown between the FCG rates determined at the microscopic level (estimated by the FS spacing) and the macroscopic one (according to the results of mechanical tests of laboratory specimens). In particular, this tendency has been repeatedly confirmed on aluminum alloys [33,34,35]. For example, according to the results of laboratory tests of the Al-Cu-Mg alloy for FCG resistance at room temperature and constant SIF range, it was found that, with an increase in the stress ratio R from 0.1 to 0.5, the distance between FS clearly increased from 1.3 to 2.2 µm as the FCG rate increases [36].
It was also shown that the FCG rate in the 7075-T6 aluminum alloy, determined on the basis of three-dimensional (3-D) X-ray synchrotron tomography of the fatigue fracture surface, corresponds to the rate estimated from the distance between the FSs seen with a scanning electron microscope [37]. The correspondence between the FCG rates at the microscopic and macroscopic levels was also confirmed by the results of fractographic analysis of specimens from nickel-chromium alloy 718. Moreover, this correspondence was better manifested at higher (up to 650 °C) test temperatures during the determination of the FCG resistance [38]. It was also confirmed for low-alloy ferritic steel and recommendations were formulated for the residual lifetime assessment of steam generator elements [39].
At the same time, the problems associated with the use of fractographic estimates of the FS spacing to identify the causes of the destruction of structural elements of aviation technology are also reported (in particular, associated with their overloads during operation). The effect of randomly repeated changes in the loading cycle of 2024-T3 aluminum alloy on the FCG rate (including that determined from the distance between FS in images obtained with a transmission electron microscope) is analyzed. Microfractographic assessments have shown that overload (or underload) cycles, which are briefly repeated immediately after the peak overload, distort the true picture of the element loading [40].
Problems with determining the maximum and minimum service loadings of the elements were also confirmed by the measurements of the FS spacings on fatigue fracture surfaces of 2017-T4 aluminum alloy and stainless steel of the 304 type. However, measurements of striation height H on fracture surfaces using a laser micro-scope showed a good relationship between the stress ratio R in the loading cycle and striation morphology expressed by the H/s ratio (where s is the spacing striation) for both materials [41]. Using the obtained correlation dependence H/s − (1 − R), it is proposed to evaluate the operational loads based on fractographically determined characteristics of the FS on the fracture surface of damaged elements [42]. At the same time, analysis of the fracture surfaces of steel 316 tested for low-cycle fatigue at a frequency of 1 cycle/min in air at a temperature of 625 °C on specimens with stress concentrators showed that, at plastic deformations exceeding the fatigue limit for smooth specimens, the microscopic FCG rates, estimated from the distance between the striation (as crack increments during each loading cycle) are in good agreement with the values of the macroscopic FCG rates. However, in this case, it was also noted that, at a low level of specimen deformation, the FCG rates estimated on the microscopic level exceeds the values obtained on the macroscopic level [43].
The lack of an unambiguous correlation between the experimentally determined FCG rate for a macrocrack and one more, obtained under the assumption of the formation of a separate FS in each loading cycle, was also demonstrated by the example of technically pure iron (ARMCO-Fe) [44], low carbon steel [45], alloy of iron with 3.7% Si [46], magnesium alloy IMB6 [47] and coarse-grained nickel of high purity [48].
The use of synchrotron X-ray tomography makes it possible to estimate the FS spacing in the early stages of fracture process. In particular, the importance of such studies is shown on the Ti-6Al-4V titanium alloy, when the FS spacing does not accurately characterize the rate of FCG [49].
From the above analysis, it follows that mainly fractographic studies of the fatigue fracture surfaces were aimed at proving or disproving the existence of a direct relationship between the macroscopic and microscopic FCG rates in different structural materials. And as the experimental methods of fracture surfaces research expanded (using a laser microscope, TEM, and three-dimensional (3-D) X-ray synchrotron tomography), additional evidence or grounds for denial of the correlation between these rates were revealed. Moreover, the clearest correlation between the micro- and macroscopic FCG rates was found when the deforming processes at the crack tip began to play a decisive role, that is, at a high FCG rate. This is typical for almost all analyzed materials at a relatively high FCG rate. The fact that the correlation between these rates was more pronounced at high test temperatures when the deformation at the crack tip at the same SIF range is significantly larger than at the lower temperature, also confirms this assumption [38,50].
Based on the analysis of the status quo of problems associated with the quantitative assessment of the characteristics of the detected fractographic elements, it should be noted that the intensive development of computer hardware and software for digital image processing should significantly simplify the assessment of the FS spacing on the fracture surfaces. This is especially important for substantiating the possibility of determining the loading parameters of real structural elements when establishing the causes of their destruction on the basis of fractographic analysis of their fracture surfaces.
The principles of the detection of fatigue fracture initiation centers and transition to spontaneous (usually dimple-like type of fracture) destruction are schematically demonstrated on the example of real fatigue fracture surfaces of various structural elements damaged during operation. The specifics of FS formed at constant or variable loading amplitudes are described. The importance of eliminating the striation-like artefacts in the analysis of fatigue fracture surfaces is underlined, and the specific numerical algorithms are proposed. The subtleties and complexities of FS detection at fracture surfaces and important aspects of ensuring the accuracy of these calculations are systematized and discussed in detail [51].
Analysis of FS in images of fracture surfaces of natural rubber by means of image processing shows their morphological similarity with periodic patterns of interferograms [52]. Therefore, it was considered reasonable to apply polynomial modulated phase correlation to the analysis of fatigue striations. They were preprocessed using mathematical morphology and median filtering to take into account the dynamics of intensity changes of the analyzed objects and reduce the negative influence of noise on the striation image. Due to the distortion of the perspective on the SEM images, the obtained results only approximately can be considered quantitative. This is one of the limitations of processing the whole image. To eliminate this drawback, it is proposed in further studies to take into account the topology of the striations.
It is shown that the spacing of FS, determined using the SEM, depends on the residual stresses arising during cold deformation, which was used to determine the distribution of residual stresses and to assess the fatigue life, respectively [53].
Based on fractographic analysis of the fracture relief of aluminum alloy AA-2024-T3 and low-alloy steel AISI-4130-O, recommendations are formulated to improve the accuracy of determining the number of striations using high-resolution SEM [54]. The possibility of using the fractographic measurements of FS spacing to predict the fatigue life at high cycle fatigue of a smooth plate specimens made of Ti-6Al-4V alloy in the laboratory air is shown [55].
The high number of striations on the fatigue fracture surfaces makes it impossible and impractical to take into account each of them. In particular, during the detection of individual striations, some of them look like practically destroyed by the friction of conjugate fracture surfaces against each other in the loading cycle (due to the crack closure effect), or located so close to each other that they are difficult to distinguish [56]. It is shown that the distance between the FS depends on their location relative to the fatigue crack origin point, and, as a consequence, on the macroscopic rate of FCG. In practice, the distance between the striations was measured in several randomly selected areas, and their total number was estimated using statistical methods. It is very important to improve the methods of image analysis and their automation for the development of quantitative fractography. This will make it possible to create databases of fractographic images, which are especially important for analyzing the causes of destruction of real structural elements during their operation. In general, there are few publications focused on the development of methodological aspects of automated measurement of FS spacing. As a rule, they analyze the images of fractures of aluminum alloys with clearly distinguishable striations.
Thus, by defining ideal fatigue striations as a system of similar spatial and equidistant arcs that are displaced relative to each other in one direction, and applying a two-dimensional Fourier transform, the vector of their displacement (regardless of the direction of observation) is estimated [57,58]. The critical parameters of the striations, which were clearly distinguished on the fracture surface, were determined. Texture fractography was applied to those fragments of fractures where it was difficult to isolate them. For AISI 304L stainless steel, the relationship between macroscopic FCG rate and striation parameters in images in the form of multilinear regression was established.
Another study proposed a method for quantitative assessment of the percentage of the surface with FS from the total surface of the fatigue fracture [59]. Using a wavelet transform based on the use of the Gabor function, any restrictions for the use of this method have been removed, in particular for determining the surface area of the covered with FS, their length and profile.
The aim of this study is to develop a method for the quantitative assessment of fatigue striations spacing based on computer processing of fractographic digital SEM images of fracture surfaces obtained after FCG tests of laboratory specimens of 34KhN3M steel in the initial state and after long-term operation in the rotor disk of a steam turbine at a TPP and comparing the values of the FCG rates determined by the distance between the fatigue striations, measured manually directly on microfractograms or using the proposed method of computer processing, with their subsequent comparison with the macroscopic FCG rates

2. Materials and Methods

To verify the proposed approaches to quantitative computer processing of fractographic images, the fracture surfaces of the specimens after FCG tests were used. Two variants of 34KhN3M steel were considered (in the initial state and cut from the damaged disc of the steam turbine rotor after ~3 × 10⁵ h of operation). The reasons for the damage of this disk were analyzed earlier [60]. This steel is a typical medium-carbon and medium-alloy heat-resistant steel, used for a long time in the production of critical components of steam turbine rotors, in particular rotor discs. This steel has sufficiently high values of mechanical properties (such as strength and ductility, static and cyclic crack resistance), which are necessary to ensure its operability under service conditions.
The chemical composition of both variants of investigated steel is given in Table 1, and their tensile mechanical properties are given in Table 2. The difference in the chemical composition of both steel options is practically insignificant. At the same time, the difference in their mechanical properties is obvious. The steel in the initial state was subjected to the recommended heat treatment regime for this steel. Therefore, it was believed that the difference in their properties is associated with the degradation of the exploited steel due to long-term high-temperature operation in the steam turbine rotor.
Beam specimens of 10 mm × 18 mm in cross section with a single edge notch were tested on FCG resistance at cyclic loading by cantilever bending in the air with a frequency of 10 Hz and the stress ratio of 0.05. The crack length was monitored on both lateral surfaces of the specimen using an optical microscope with an accuracy of 0.05 mm. Strain gauge transducers were used for monitoring the load ranges applied to the specimen during the FCG test. The maximum and minimum load values were kept constant throughout the load cycle. Consequently, the range of ΔK rose due to an increase in the crack length a with an increase in the number of loading cycles N. Based on the obtained data, the dependences of the macroscopic FCG rates da/dN on the SIF ranges ΔK were built for both variants of steel.
For all fractographic images selected for analysis, the corresponding macroscopic FCG rates were determined, taking into account the macrocrack length, which was determined by the coordinates of the analyzed image on the fracture surface. In addition, the direct measurements (made manually) of the FS spacing in micro-fractograms obtained during the study of fracture surface by the SEM method were used. These assessments were carried out at five levels of the SIF range, by analyzing five to seven sites at the same level of SIF range located at a distance of up to 0.5 mm from each other. For further analysis, the average values of the spacing of FS were used.
To evaluate the FS spacing, the image processing method was also developed. It was used to analyze a set of micro-fractographic digital images obtained during examination of the fracture surfaces of damaged specimens using EVO-40XVP SEM (Carl Zeiss AG, Oberkochen, Germany).

3. Method of Quantitative Analysis of Digital Fractographic Images

To demonstrate the possibilities of the developed approach, a digital fractographic image of a typical fracture fragment of 34KhN3M steel in the initial state was used (Figure 1). This image corresponded to the macroscopic FCG rate of 3 × 10⁻⁷ m/cycle. Analyzing fracture surfaces using SEM, we obtained digital images that contain a fixed number of rows and columns of pixels. Images are stored as a two-dimensional array of integers ranging from 0 to 255.
For the quantitative analysis of selected images, we developed a new method based on some known image processing techniques. This made it possible to implement automated FS spacing evaluation on the fractographic image of 34KhN3M steel.
The following algorithm is proposed to estimate the FS spacing:
-
Image binarization by selection of local minima along all columns of the input image with further morphological processing;
-
Selection of binary image fragments with clear lines corresponding to the striations;
-
Rotation of each of the fragments to achieve the horizontal orientation of the lines corresponding to the striations;
-
Estimation of a FS spacing by one of two methods: average estimate or by calculation of a mode of vertical distances between lines corresponding to striations along all columns of binary image fragments.
The flowchart of the proposed method is presented in Figure 2.
The changes in the grey levels of the fractographic image along its columns were examined pixel by pixel. Local minima were selected on the obtained image intensity curve along the column and marked with red labels (Figure 3a). By definition, the point is called the local minimum if the points on each side have a greater value of the function. It means that the pixel with the lowest grey level value in comparison with the previous ones and the next one in the column is chosen as the local minimum. Three neighbor pixels in the column were compared. When comparing more neighboring pixels than fatigue striation spacing (which is unknown before processing), there is a risk of missing some of the striations. Since the intensity function of the fractographic images is not smooth, the local minima can be both in the area of the depressions and the protrusions. To eliminate local minima in the area of protrusions, the step of finding local minima was repeated only for the local minima points obtained in the previous step (Figure 3b).
A binary image B was obtained (Figure 4a) after applying the operation of locating the local minima to all columns of the image. The gaps in the lines corresponding to the striations were eliminated by applying the morphological dilation operation to binary image B with a structural element S in the form of a square with a size of 3 × 3 pixels [61]. As a result, B S is defined as:
B S = b B S b .  
In this case, B S is the set of all displacements b of the structural element S in image B , at which S and B are overlaped by at least one element. The visual effect of dilation is the thickening of lines. Then the thinning operation to the obtained binary image was applied (Figure 4b), from which it is already possible to determine the fatigue striation spacing. Consecutive application of morphological dilation and thinning operations allows us to remove gaps in lines. An average estimation D a v and a mode estimation D m of the fatigue striation spacing were proposed. The average estimation is calculated as the area of the image S i m   divided by the length of all these lines corresponding to the striations. The total length of the lines is calculated as the number of non-zero pixels N p . Thus, the average estimation was calculated as:
D a v = S i m   / N p .
This approach can be applied to images or fragments with continuous lines corresponding to the striations. If the lines of the striations on the transformed image are discontinuous, then it is clear that the estimation will be inflated. To avoid this and minimize the discrepancy between the actual values of the striation spacing and the result of the average estimate D a v , it is proposed to use the estimation by mode D m , that is, the value of the fatigue striation spacing, which occurs most often:
D m = mode ( d i   , i = 1 N p ) ,
where d i   represents the distances between the horizontal lines, calculated step by step in every column as the distance between the neighboring fatigue striations in pixels.
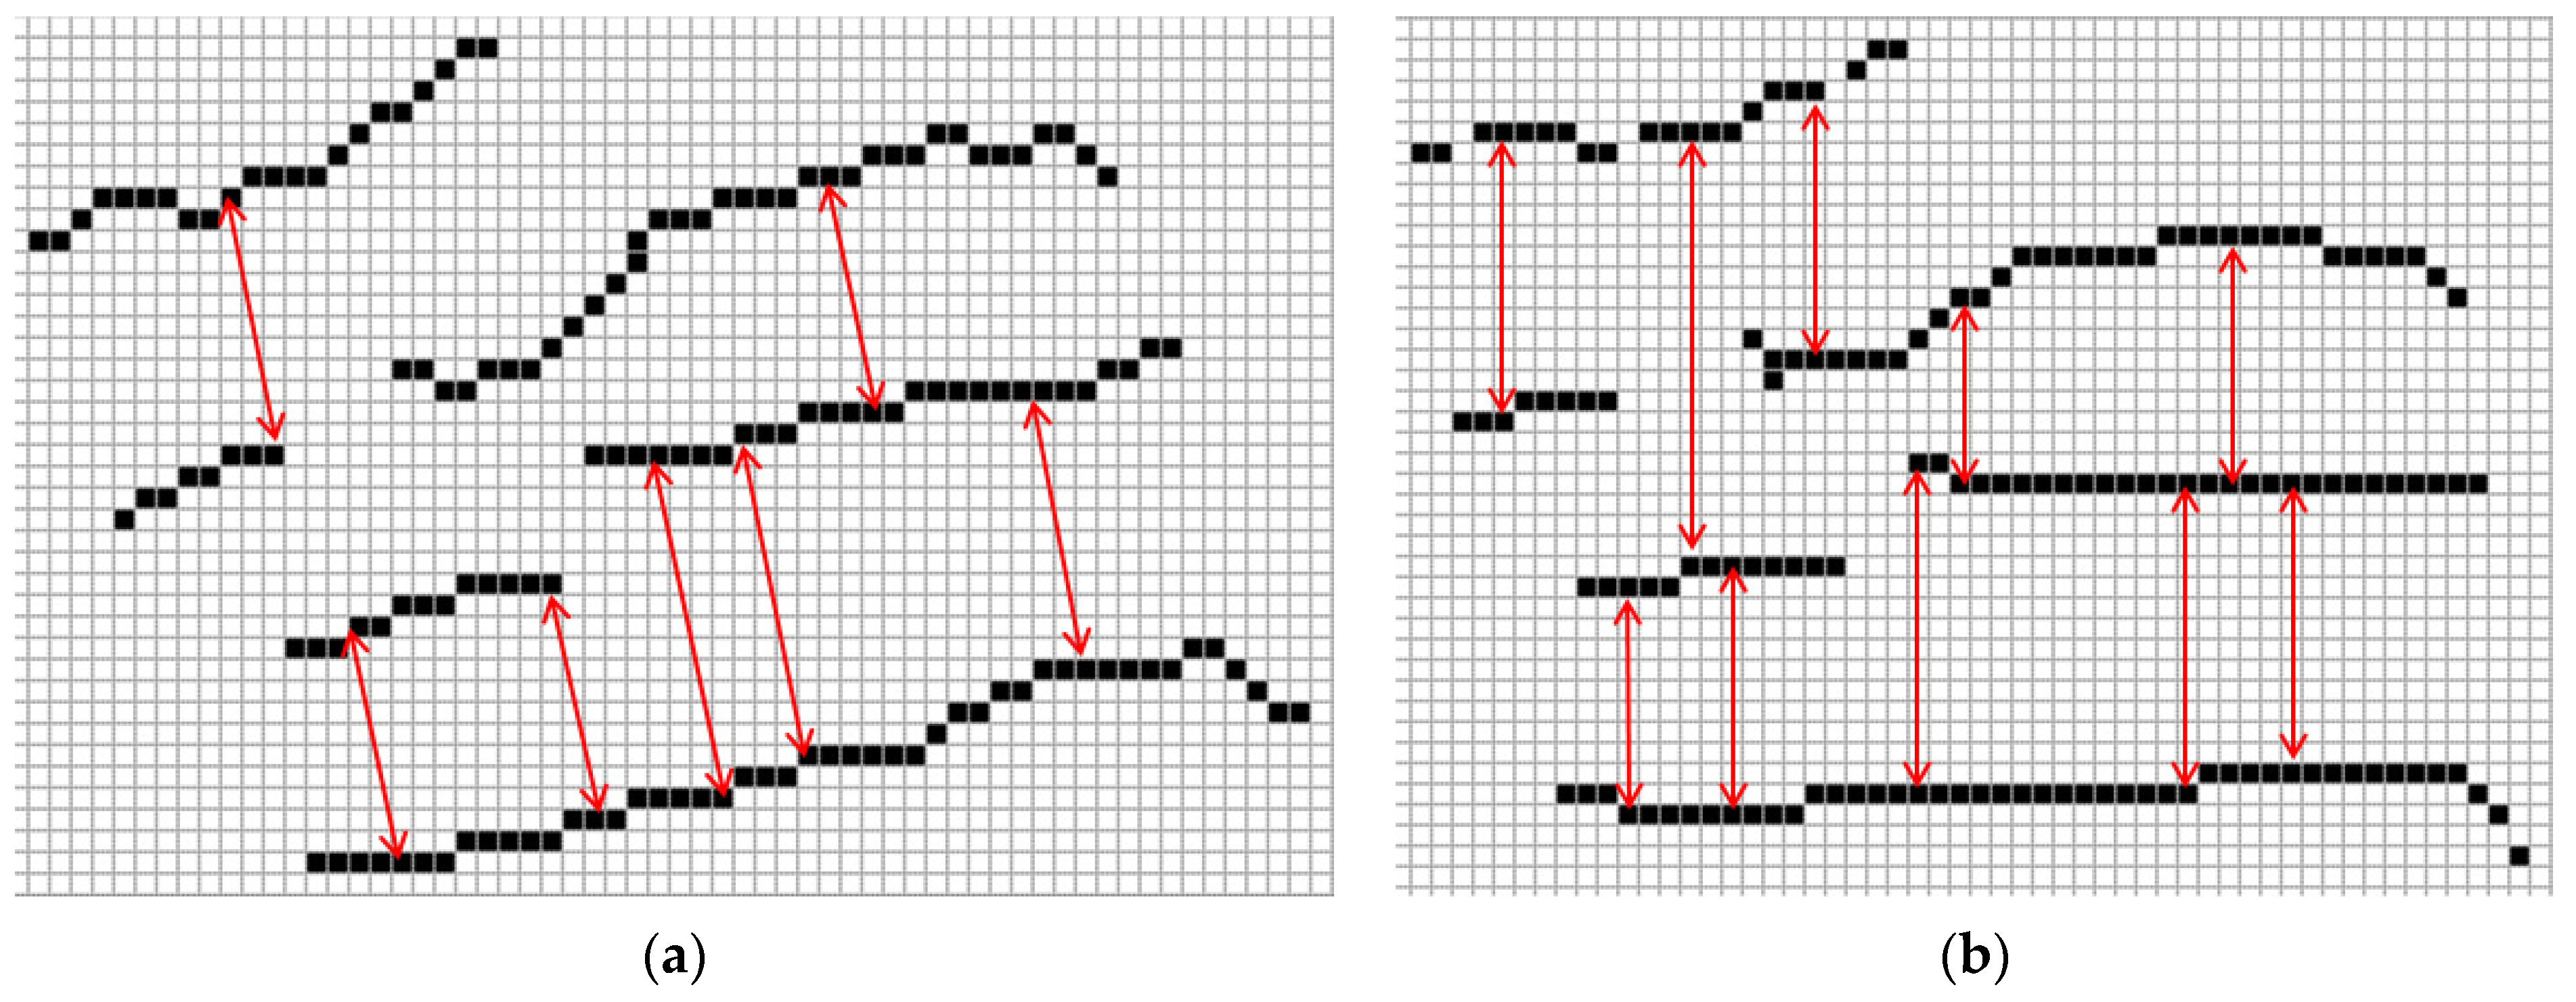
It was proposed to rotate image fragments with the lines of the striations deviated from the horizontal orientation and inclined at a certain angle to the main direction of the FCG, maintaining a constant distance between the striations. This made it possible to calculate the fatigue striation spacing without complicated calculation and the constructing of normals to the lines corresponding to the striations. The fragment of the binary image of the striations and the result of its rotation with selectively applied normals to the lines obtained after the rotation, which was used for the estimation of the distance between the striations, are shown in Figure 5.
The classical Hough transform was used to calculate the required angle of rotation of the image fragments [62]. It was initially developed for the identification of lines in the image. The transform is based on the use of the Hough parameter space, in which the search for lines is performed. To construct the Hough space, through each non-zero point of the image all possible straight lines were drawn. The line parameters in the polar coordinate system were accumulated in matrix.
The required angle of the rotation of the image fragment was determined from the principle of maximum by the accumulator matrix.
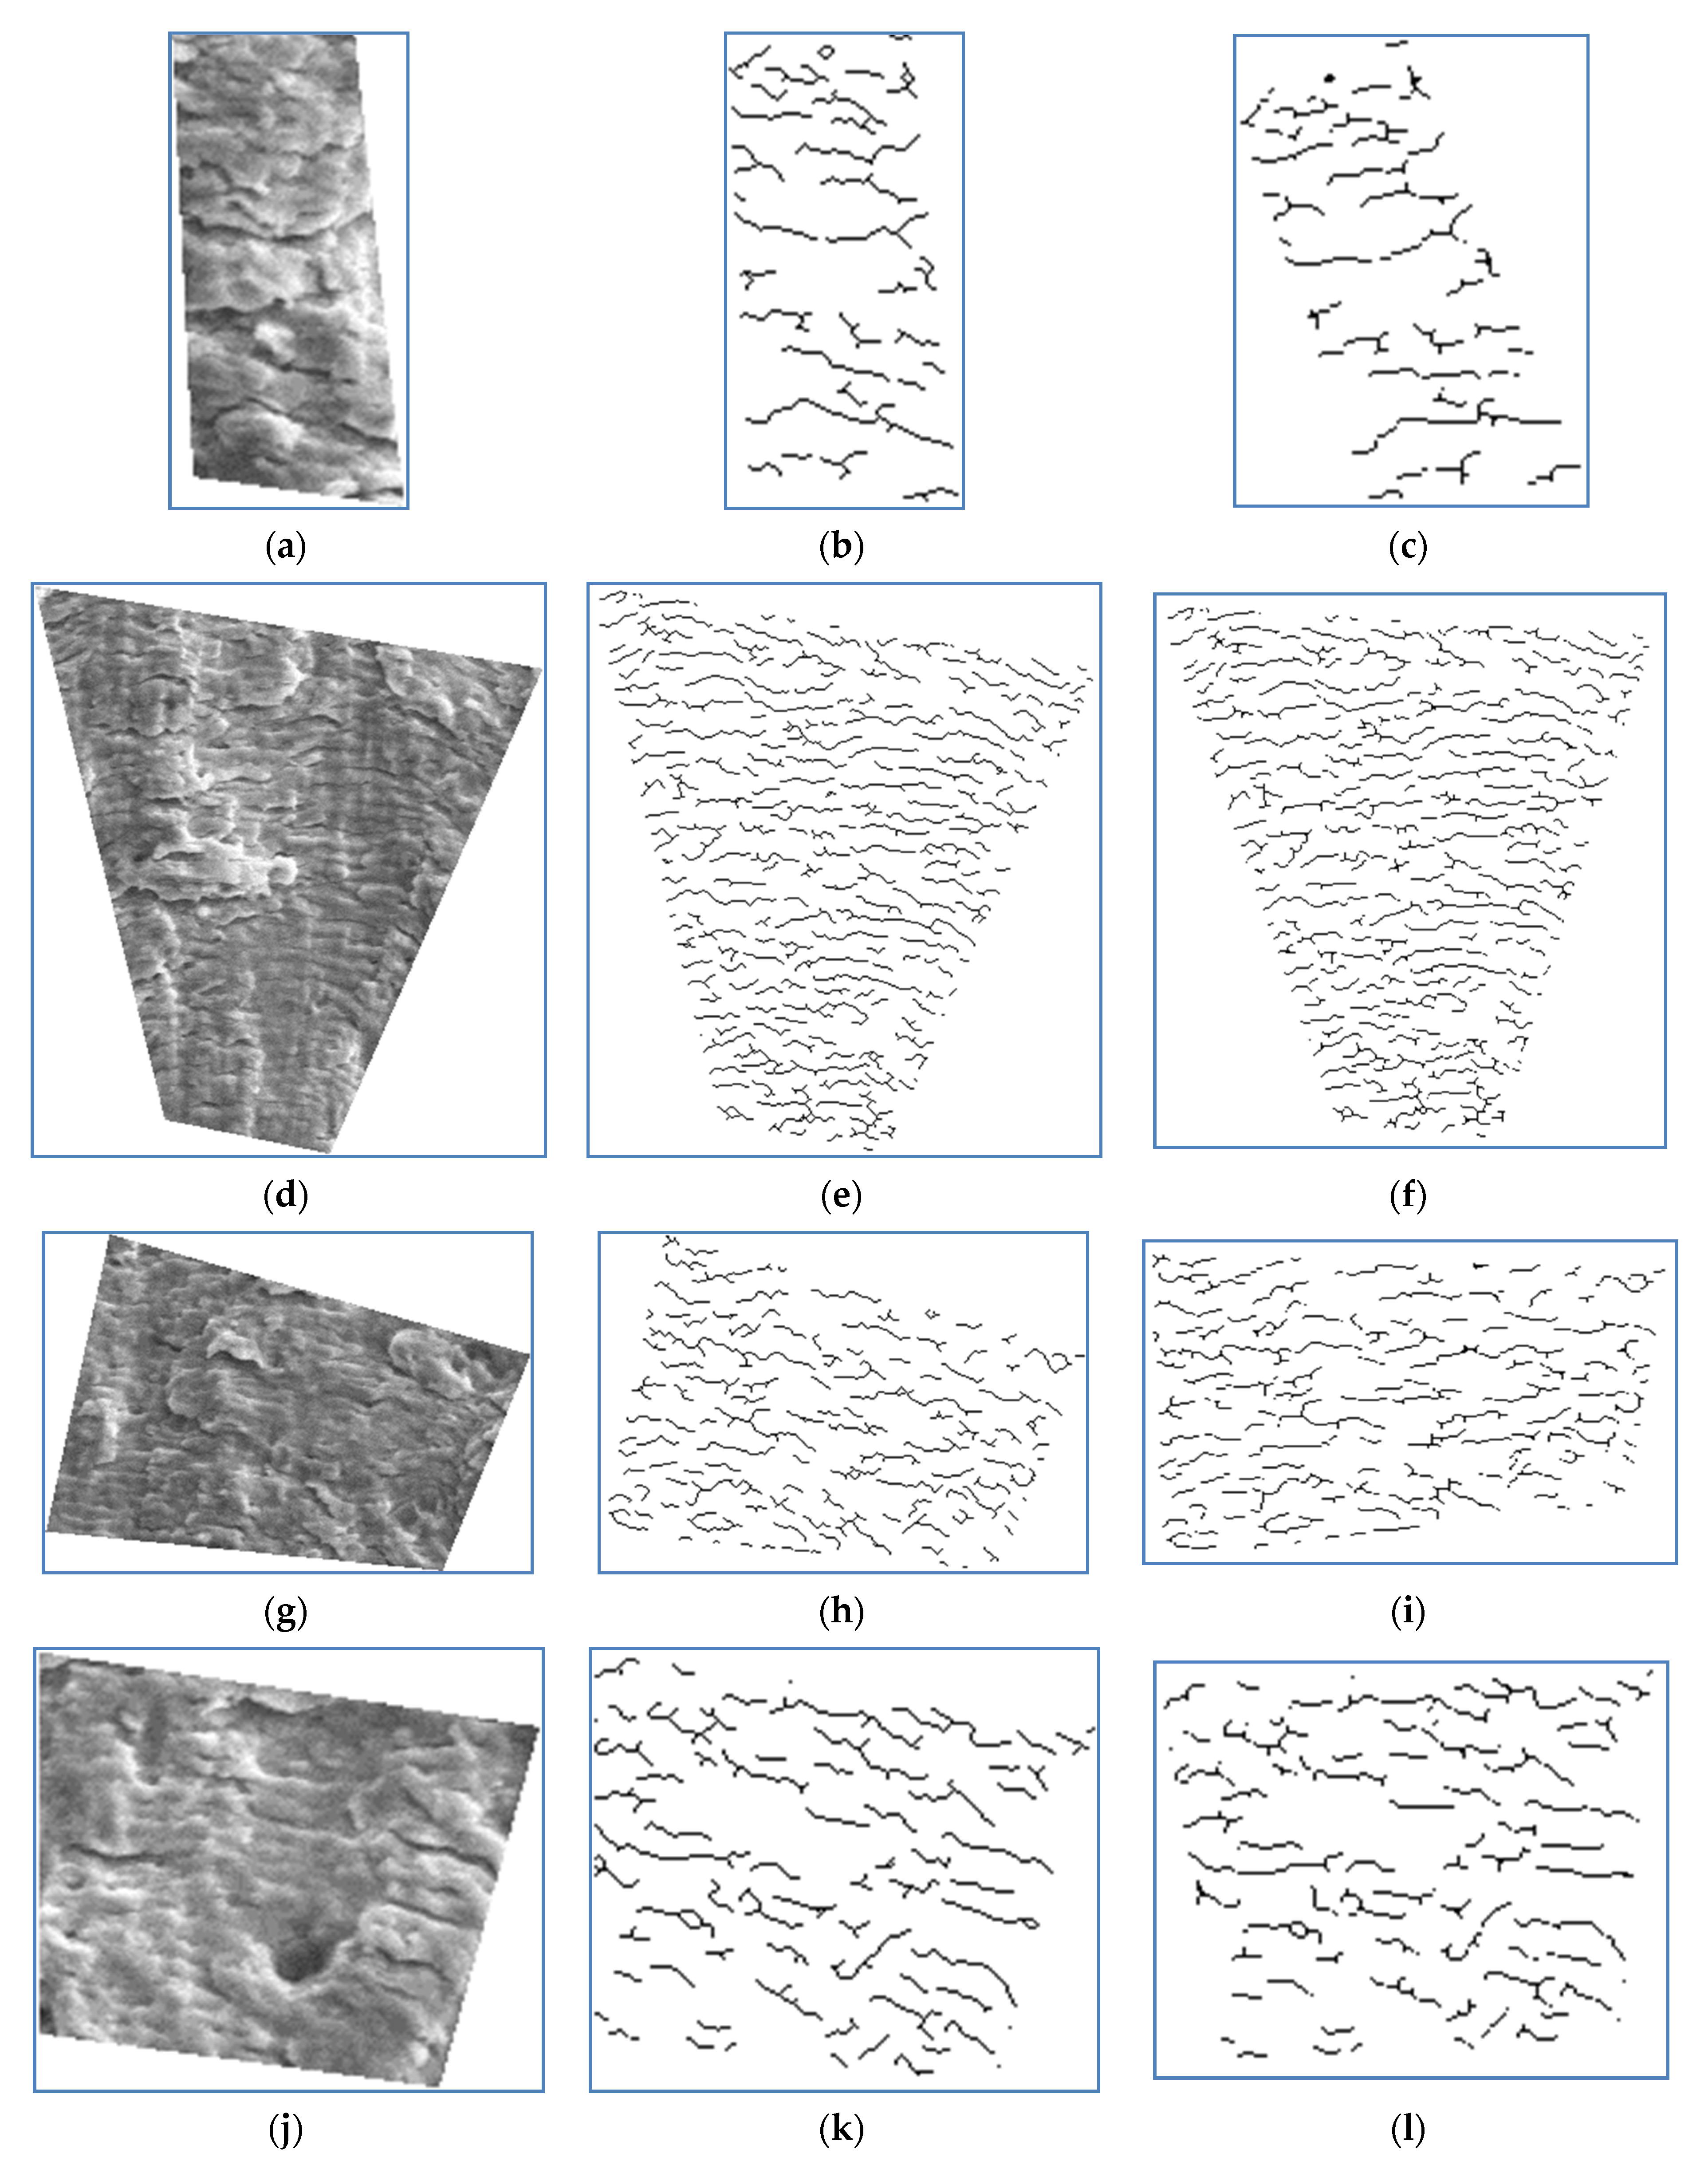
To verify this approach, the fatigue striation spacing was determined on the example of a typical fractographic image of 34KhN3M steel, on which four fragments of fracture with clearly delineated fatigue striations were identified for further analysis (Figure 1). Fragments of the image, the lines corresponding to the striations detected on fragments by the proposed method and the results of rotation are shown in Figure 6.
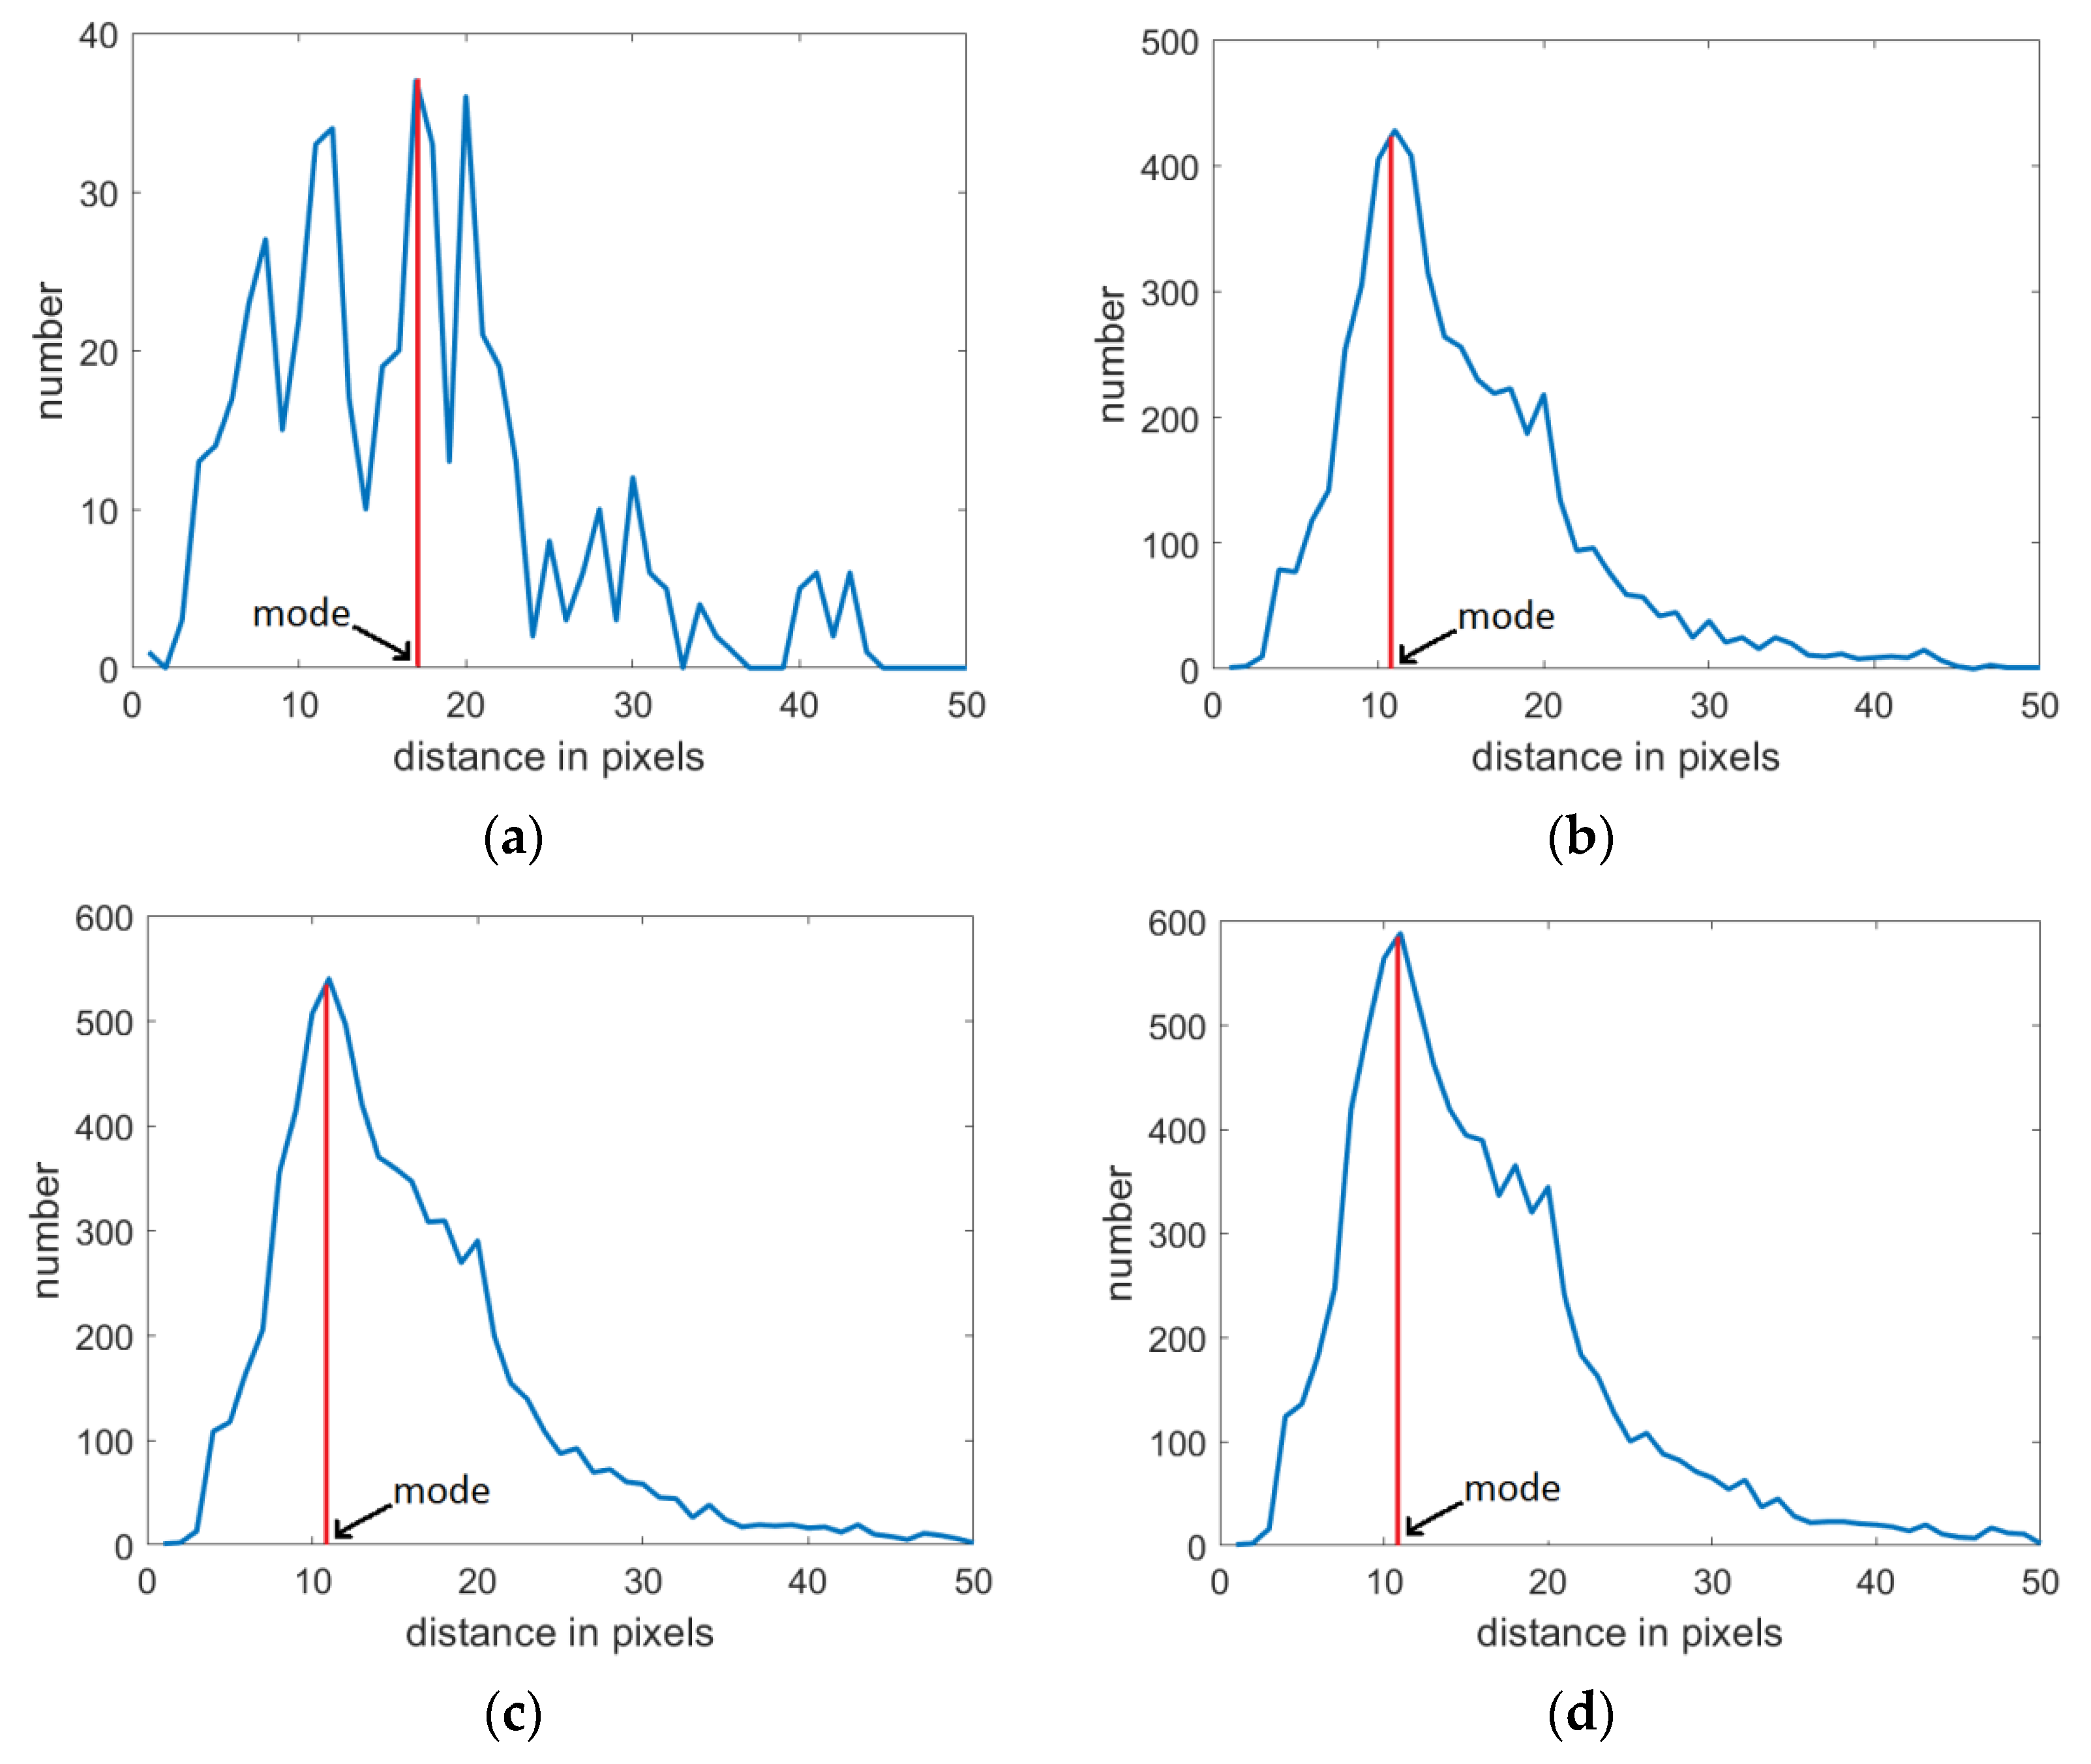
The histograms in Figure 7 illustrate the distribution of distance values between the lines corresponding to the striations within the highlighted fragments of images in Figure 1, defined by the proposed approach. One can see that, in Figure 7a, the histogram has three peaks for distances 11, 17 and 20 pixels and mode value Dm equal to 17 pixels (2.23 μm). This is because the corresponding image fragment (Figure 6a) has no distinguished striation lines. Histograms in Figure 7b–d, on the contrary, have single peaks and mode value D m equal to 11 pixels (1.45 μm).
Table 3 shows the most often fixed values of the striation spacing and their average estimate. Their analysis showed that the most often fixed striation spacing does not depend on the fragment of the analyzed image. This directly proves that, to determine the most common striation spacing, there is no need to analyze large regions of images, because their area has little effect on the estimated value.
Estimation of the average distance between fatigue striations D a v is most applicable to the images with clearly visible striations (in particular, for light alloys), which can be binarized with continuous lines.

4. Approbation of the Developed Method for Quantitative Assessment of the Fatigue Crack Growth Rates

The developed approach was used to estimate the microscopic FCG rate in 34KhN3M steel in the initial state and after long-term operation in the rotor disk. The obtained results were compared with the macroscopic FCG rate for both investigated steel variants (the corresponding kinetic diagrams of FCG in nominal coordinates are shown in Figure 8).
Analysis of the effect of long-term high-temperature operation of steel in the rotor of the steam turbine shows that its degradation affected its mechanical characteristics (Table 1). In particular, the strength characteristics have increased (σUTS by 18%, σYS by 35%) and plasticity characteristics have decreased (Elongation by 28%, Reduction of Area by 16%) [63]. Threshold characteristics of FCG, which characterize the stress–strain state at the fatigue crack tip at the local microstructural level (commensurate with the size of the pre-fracture zone at the crack tip), are considered one of the most sensitive to the high-temperature degradation of heat-resistant steels [64].
After ~3 × 10⁵ h of operation, the threshold level of the FCG for analyzed steel has significantly decreased (by more than ~30%) due to the change in its state compared to the initial one (Figure 8). Moreover, even on the linear part of relationship between log ΔK and log (da/dN) (the so-called part of the FCG diagram described by the Paris law), the effect of steel degradation on the macroscopic FCG rate remained quite noticeable even at the end of this section.
Measurements of the FS spacing were carried out manually using fractograms obtained during SEM studies of fracture surfaces of both steel variants. These fractograms were recorded at five levels of the SIF range and in five to seven areas located at a distance of up to 0.5 mm from each other. Taking into account the average values of the FS at each SIF level, the corresponding values of the microscopic FCG rates were plotted on the macroscopic FCG diagrams (Figure 8, black inverted triangles and rhombuses points).
In addition, using the developed approach for quantifying the FS spacing as a result of processing digital fractographic images of fracture surfaces of both steel variants, the values of microscopic FCG rates were also obtained for five SIF levels. In this case, it was also assumed that each distance between the nearest striations characterizes the crack increment in a separate loading cycle. The results of such estimates in the form of scattering bands of the obtained data were plotted on the diagrams of the macroscopic FCG rate obtained from the results of mechanical tests for the FCG resistance (Figure 8).
The evaluation of the microscopic FCG rate using both methods (manual measurement and using computer processing of digital fractographic images) showed their good correspondence. Their good agreement testifies to the legitimacy of the application of the developed method of the computer processing of digital fractographic images to assess their important characteristics. This opens up the prospect of using the proposed approach for the quantitative assessment of digital images from other research fields, in particular, for the analysis of space objects.
Obviously, the determination of the microscopic FCG rate by both methods confirmed the conclusion of many researchers about its insensitivity to the stress–strain state at the crack tip near the threshold SIF range. However, an important feature was revealed. The steady-state level of microscopic rate in the operated steel turned out to be somewhat lower than in the unexploited one. This means that, at the same level of the SIF range during testing on the FCG resistance of both steel variants, the critical stress–strain state at the crack tip in exploited steel is achieved in a pre-fracture zone that is somewhat smaller in size than in non-exploited steel. This is due to the embrittlement of the steel during operation. Consequently, a crack increment in each loading cycle and the appearance of fatigue striations becomes possible in the exploited steel at a lower FCG rate due to its degradation during the long-term operation.
However, it remains unclear why the FS spacing at low near-threshold SIF range remains practically unchanged, and only after reaching a certain SIF level did the microscopic FCG rate achieve a fairly good agreement with the macroscopic FCG rates for many materials. This may be due to the non-simultaneous growth of a fatigue macrocrack along its entire front. Indeed, in the near-threshold region of the FCG diagram, favorable conditions for local plastic deformation due to the sliding of dislocations in a direction favorable for the formation of fatigue stripes arise only in some grains along the crack front. In less favorably oriented grains, the crack growth mechanism could be different, in particular, with the forming of false striations with a characteristic change in their orientation from grain to grain, which is not typical for classic FS [65]. It is clear that the detection of such rather small classic fatigue striations in single grains along the crack front, favorably oriented for the sliding of dislocations, is not an easy task for fractographic studies with high resolution. Consequently, as the stress–strain state in the fatigue macrocrack tip increases, (due to its growth) more and more fragments with FS will appear in favorably oriented grains along its front and it will become easier to identify and analyze them. The analysis of stereo images of fatigue fractures of aluminum alloy 2024-T3 confirmed that the fraction of the FS area on the fracture surface rises with an increase of SIF range in the fatigue crack tip [66]. This trend will continue as long as FS becomes the dominant fracture surface feature along the entire fatigue crack front. Until then, the distance between FS will not practically change. The macroscopic FCG rate will increase due to an increase in the number of grains along the front of the macrocrack, in which favorable conditions will arise for the implementation of other fracture mechanisms.
In addition, the fatigue crack closure effect cannot be neglected. Microdetails of fatigue fracture surfaces, such as FS, are largely distorted due to the premature contact of the conjugate fracture surfaces behind the crack tip, even before the specimen with a crack is completely unloaded in the loading cycle [67]. It is clear that traces of such small elements of the fracture surface as FS are easily eliminated with such a contact, since the opening value of the crack tip propagating at about the threshold FCG rate is commensurate with the height of the fatigue relief. In particular, based on the analysis of stereo images of fractures in the 2024-T3 aluminum alloy, it was shown that the height of the FS starts from 0.09 μm and rises with an increase in the SIF range [66]. Consequently, this fractographic feature can also cause the FS spacing to remain constant at low stress levels, as traces of fine FS can simply disappear due to the crack closure effect. Thus, on fatigue fracture surfaces, it is possible to identify only those FS, the height of which would be sufficient so that their traces do not disappear when the crack edges contact in the loading cycle. This is consistent with the known results about a significant levelling of the role of the crack closure effect on the linear section of the FCG diagram described by the Paris law. Another important aspect of the fatigue fracture’s surface formation is associated with the fractographic feature of heat-resistant steels after their long-term operation at a high temperature in a real technological process. One of the defining features of the degradation of such steels (in particular, those operated on the main steam pipelines of thermal power plants) is the identification of FS, practically starting from the near-threshold section of the FCG kinetic diagram [68]. Moreover, they were clearly identified only in steel that had been in operation for a long time, while in steel that had not been in operation, such a feature was not observed. It was believed that, during the long-term high-temperature operation of steel in a high-gradient temperature-force field, hydrogen is absorbed and accumulated inside the pipe wall [69,70], which manifests itself even near the threshold level of SIF [71]. This hydrogenation of the metal contributed to its embrittlement and, as a consequence, contributed to the formation of secondary microcracks at the bottom of the fatigue striations. These secondary cracks decorated the FS and thus sharply distinguished them on the fracture surface. Such secondary cracking at the substructural level has greatly simplified the identification and selection of FS for analysis even in the near-threshold section of the fatigue crack growth diagram.
The performed analysis makes it possible to conclude that the hydrogen embrittlement of long-term operated heat-resistant steels increases the number of sections along the front of a macroscopic crack with favorable conditions for the formation of fatigue striations, which facilitates their detection on fracture surfaces. The acceleration of FCG in technically pure iron, tested in hydrogen, is also explained not by the localization of plastic deformation under an action of hydrogen, but by the appearance of the brittle-type cracks [72]. In addition, it is shown that the height of FS on the fracture surface of hydrogenated austenitic 304 stainless steel is half the size (~100 nm) of that of unhydrogenated steel (200 nm) [73]. Both brittle-type cracks and a decrease in the height of FS on the fracture surfaces of structural materials are generally considered as the manifestation of hydrogen brittleness. However, in the case of unexploited steels, their presence on the fracture surfaces does not simplify, but, on the contrary, complicates the assessment of the quantitative parameters of the fatigue striations, since it involves the use of a high-resolution microscope. Consequently, the visualization of FS was much easier in the steel after long-term operation in the steam turbine rotor of a TPP under the influence of high temperatures, stresses and a hydrogenative environment. Secondary cracking accompanying the formation of FS in exploited steel is a key fractographic sign that is important for the development of quantitative fractography approaches. Indeed, the high contrast of fatigue striations clearly delineated by secondary cracks is very important for automating the estimation of the FS spacing and hence the microscopic FCG rate [74]. This is especially important when it is not possible to use a high resolution microscope to visualize fatigue striations.

5. Conclusions

Based on the analysis of both types of FCG rates (microscopic, estimated on the spacing between the fatigue striations and macroscopic, determined during mechanical tests of laboratory specimens with the definition of the characteristics of FCG resistance) for a wide range of structural materials, it was concluded that basically both rates begin to coincide either during high-temperature tests or in areas with high SIF in the kinetic diagrams of FCG, when high levels of metal deformation in the pre-fracture zone (necessary for the formation of fatigue striations) are achieved in almost all grains along the crack front.
A method for quantitative estimation of fatigue striations’ spacing on digital fractographic images of fatigue fracture surfaces has been developed. The implementation of the method involves the following sequence of actions: the recognition and selection of fatigue striations by binarization of the image according to the principle of local minima; the rotation of the fragments highlighted in the image with the clearest lines corresponding to the striations until they reach a horizontal orientation using the Hough transform; the estimation of the spacing between the nearest fatigue striations by step-by-step calculation of the vertical distances between the lines corresponding to them or by estimating the average distance between them, taking into account only solid lines. The developed method was tested on fractographic images of 34KhN3M steel in the initial state and after long-term (~3 × 10⁵ h) operation in the rotor disk of the steam turbine of a TPP.
A good coherence of the results of assessing the macroscopic FCG rates and microscopic ones was confirmed, determined by two methods (direct measurement of the distance between fatigue striations manually using fractographic images obtained during SEM studies, and using the developed digital image processing technique) at high values of the SIF range and their tangible mismatch at low values.
Possible reasons for the discrepancy between the micro- and macroscopic FCG rates at low values of the SIF range were analyzed. The facilitation of the detection of fatigue striations on the fracture surface of heat-resistant steel degraded under the influence of operational factors and, first of all, a hydrogenating environment, was also noted. Hydrogen embrittlement of the exploited steel promoted the formation of secondary cracks at the bottom of the fatigue striations, which increased their clarity and made them easier to detect on a digital image for quantitative analysis.
It has been established that the plateau-like section on the dependence of the microscopic FCG rate on the SIF range in steel subjected to operational degradation is observed at a lower rate than for the steel in the initial state. Secondary cracking under the action of hydrogen absorbed by the metal during long-term operation could probably contribute to the prevalence of the typical mechanism of fatigue fractures along the entire crack front in the operated steel at a lower FCG rate than in the unused one.

Author Contributions

Conceptualization—P.M., O.S. and R.V.; methodology—R.V., O.S., I.I., H.K., O.B., T.M., L.S., P.M. and O.P.; formal analysis and validation—R.V., O.S., I.I., H.K., O.B., T.M. and L.S.; writing (original draft)—R.V., O.S., I.I., H.K., O.B., T.M., L.S., P.M. and O.P.; writing (review and editing)—O.S. and R.V.; supervision—O.P. All authors have read and agreed to the published version of the manuscript.

Funding

This research was partially supported by the National Academy of Sciences of Ukraine under grant number 0117U000523. The support is gratefully acknowledged.

Data Availability Statement

The data presented in this study are available on request from the corresponding author.

Conflicts of Interest

The authors declare no conflict of interest.

References

  1. Sakin, R. Investigation of bending fatigue-life of aluminum sheets based on rolling direction. Alexandria Eng. J. 2018, 57, 35–47. [Google Scholar] [CrossRef]
  2. Konovalenko, I.V.; Maruschak, P.O. New Optical-Digital Methods of Technical Diagnostics of Materials and Structures; Ternopil Ivan Puluj National Technical University: Ternopil, Ukraine, 2018; 201p. [Google Scholar]
  3. Maruschak, P.O.; Sorochak, A.P.; Menou, A.; Maruschak, O.V. Regularities in macro- and micromechanisms of fatigue crack growth in a bimetal of continuous caster rolls. Case Stud. Eng. Fail. Anal. 2013, 1, 165–170. [Google Scholar] [CrossRef] [Green Version]
  4. Vorobel, R.; Ivasenko, I.; Berehulyak, O.; Mandzii, T. Segmentation of rust defects on painted steel surfaces by intelligent image analysis. Autom. Construct. 2021, 123, 103515. [Google Scholar] [CrossRef]
  5. Ivasenko, I.; Chervatyuk, V. Detection of rust defects of protective coatings based on HSV color model. In Proceedings of the IEEE Ukraine Conference on Electrical and Computer Engineering, Lviv, Ukraine, 2–6 July 2019; pp. 1143–1146. [Google Scholar]
  6. Vorobel, R.; Ivasenko, I.; Berehulyak, O. Automatized computer system for evaluation of rust using modified single-scale retinex. In Proceedings of the 2017 IEEE 1st Ukraine Conference on Electrical and Computer Engineering UKRCON 2017, Kyiv, Ukraine, 29 May–2 June 2017; pp. 1002–1006. [Google Scholar] [CrossRef]
  7. Javorskyj, R.; Yuzefovych, I.; Matsko, I.; Kravets, I.B. The stochastic recurrence structure of geophysical phenomena. In Cyclostationarity: Theory and Methods II; Chaari, F., Leskow, J., Napolitano, A., Zimroz, R., Wylomanska, A., Dudek, A., Eds.; Springer International Publishing Switzerland, Applied Condition Monitoring: New York, NY, USA, 2015; Volume 3, pp. 55–88. [Google Scholar] [CrossRef]
  8. Vorobel, R.A.; Zhuravel, I.M.; Svirs’ka, L.M.; Student, O.Z. Automatic selection and quantitative analysis of carbides on grain boundaries of 12Kh1MF steel after operation at a steam pipeline of a thermal power plant. Mater. Sci. 2011, 47, 393–400. [Google Scholar] [CrossRef]
  9. Berehulyak, O.; Vorobel, R. The algebraic model with an asymmetric characteristic of logarithmic transformation. In Proceedings of the 15th International Scientific and Technical Conference on Computer Sciences and Information Technologies, Zbarazh, Ukraine, 23–26 September 2020; pp. 119–122. [Google Scholar] [CrossRef]
  10. Mandziy, T. Inhomogeneity inforced piecewise smooth Chan-Vese model for image segmetation. In Proceedings of the 2nd IEEE Ukraine Conference on Electrical and Computer Engineering, Lviv, Ukraine, 2–6 July 2019; pp. 1158–1161. [Google Scholar]
  11. Lauschmann, H. Computer aided fractography: The automatical evaluation of striation parameters. Eng. Mechan. 1998, 5, 377–380. [Google Scholar]
  12. Tsopanidis, S.; Moreno, R.H.; Osovski, S. Toward quantitative fractography using convolutional neural networks. Eng. Fract. Mechan. 2020, 23, 15. [Google Scholar] [CrossRef] [Green Version]
  13. Tsopanidis, S.; Osovski, S. Unsupervised Machine Learning in Fractography: Evaluation and Interpretation. Available online: https://engrxiv.org/wjtg2 (accessed on 2 November 2021).
  14. Sun, Y.; Li, Z.; Yan, J. Recognition method of metal fracture images based on Wavelet kurtosis and relevance vector machine. MATEC Web. Conf. 2016, 39, 02004. [Google Scholar] [CrossRef] [Green Version]
  15. Ranganathan, N.; Sedghi, N.; Joly, D.; Do, T.; Leroy, R.; Chalon, F.; Feraud, P. A method for quantitative fatigue fracture surface analysis. In Proceedings of the 4th International Conference on Crack Path, Gaeta, Italy, 19–21 September 2012; Available online: https://hal.archives-ouvertes.fr/hal-01689617 (accessed on 2 November 2021).
  16. Ruellan, B.; Robin, E.; Le Cam, J.-B.; Jeanneau, I.; Canévet, F.; Mauvoisin, G.; Loison, D. Contribution to fatigue striation phenomenon analysis by using image processing. In Advancement of Optical Methods & Digital Image Correlation in Experimental Mechanics, Proceedings of the 2018 SEM Annual Conference & Exposition on Experimental and Applied Mechanics, Greenville, SC, USA, 4–7 June 2018; Springer: Cham, Switzerland, 2018. [Google Scholar] [CrossRef]
  17. de Olivera Hein, L.R.; de Oliveira, J.A.; de Campos, K.A. Correlative light-electron fractography for fatigue striations characterization in metallic alloys. Microsc. Res. Technique. 2013, 76, 909–913. [Google Scholar] [CrossRef]
  18. Ritchie, R.O. Mechanisms of fatigue-crack propagation in ductile and brittle solids. Int. J. Fract. 1999, 100, 55–83. [Google Scholar] [CrossRef]
  19. Romaniv, O.M.; Yarema, S.Y.; Nykyforchyn, H.M.; Makhutov, N.A.; Stadnyk, M.M. Fatigue and cyclic crack resistance of structural materials. In Reference Guide: Fracture Mechanics and Strength of Materials in 4 Volumes; Panasyuk, V.V., Ed.; Naukova dumka: Kyiv, Ukraine, 1990; Volume 4, p. 680. (In Russian) [Google Scholar]
  20. Yarema, S.Y.; Panasiuk, V.V. General features of fatigue fracture diagrams of metals. Strength Probl. 1996, 1, 30–35. [Google Scholar]
  21. Kocanda, S. Fatigue Failure of Metals; Sijthoff & Noordhoff International Publishers: Alphen aan den Rijn, The Netherlands, 1978; p. 367. [Google Scholar]
  22. Tóth, L.; Yarema, S.Y. Formation of the science of fatigue of metals. Part 1. Mater. Sci. 2006, 42, 673–680. [Google Scholar] [CrossRef]
  23. Suresh, S. Fatigue of Materials, 2nd ed.; Cambridge University Press: Cambridge, UK, 1998; p. 704. [Google Scholar]
  24. Pantazopoulos, G.A. A short review on fracture mechanisms of mechanical components operated under industrial process conditions: Fractographic analysis and selected prevention strategies. Metals 2019, 9, 148. [Google Scholar] [CrossRef] [Green Version]
  25. Song, Y.; Chai, M.; Han, Z. Experimental investigation of fatigue crack growth behavior of the 2.25Cr1Mo0.25V steel welded joint used in hydrogenation reactors. Materials 2021, 14, 1159. [Google Scholar] [CrossRef]
  26. Von Bestenbostel, W.; Friedrich, K. The appearance of fatigue striations in the SEM. In Proceedings of the 17th International Conference on Composite Materials, Edinburgh, UK, 27–31 July 2009. [Google Scholar]
  27. Ivanova, V.S.; Shanyavsky, A.A. Quantitative Fractography: Fatigue Failure; Metallurgia: Chelyabinsk, Ukraine, 1988; p. 396. (In Russian) [Google Scholar]
  28. Shanyavsky, A.A. Safe Fatigue Failure of Aircraft Structural Elements. Synergetics in Engineering Applications; Ufa Printing Plant: Ufa, Russia, 2003; p. 803. (In Russian) [Google Scholar]
  29. Botvina, L.R. Fracture: Kinetics, Mechanisms, General Laws. In Monograph; Nauka: Moscow, Russia, 2008; p. 334. (In Russian) [Google Scholar]
  30. Forsyth, P.J.E.; Ryder, D.A. Fatigue fracture. Aircr. Eng. 1960, 32, 96–99. [Google Scholar] [CrossRef]
  31. Nedbal, I.; Siegl, J.; Kunz, J.; Lauschmann, H. Fractographic reconstitution of fatigue crack history–Part I. Fatig. Fract. Eng. Mater. Struct. 2008, 31, 164–176. [Google Scholar] [CrossRef]
  32. Nedbal, I.; Kunz, J.; Lauschmann, H. Fractographic reconstitution of fatigue crack history–Part II. Fatig. Fract. Eng. Mater. Struct. 2008, 31, 177–183. [Google Scholar] [CrossRef]
  33. Nedbal, I.; Siegl, J.; Kunz, J. Relation between striation spacing and fatigue crack growth rate in Al-alloy sheets. In Edvances in Fracture Research, ICF 7; Salama, K., Ed.; Pergamon Press: Houston, TX, USA, 1989; Volume 5, pp. 3484–3491. [Google Scholar]
  34. Kunz, J.; Nedbal, I.; Siegl, J. Application of fractography in full-scale tests of aircraft structure parts. In Fracture Behaviour and Design of Materials and Structures, ECF 8; Firrao, D., Ed.; Cradley Heath: EMAS: Torino, Italy, 1990; Volume III, pp. 1662–1669. [Google Scholar]
  35. Kunz, J.; Siegl, J.; Nedbal, I. Quantitative fractography–well spring of intimate knowledge in fatigue crack growth history. Communications 2006, 4, 10–14. [Google Scholar]
  36. Jun, H.; Yilun, L.; Chi, L.; Qing, W.; Liyong, M. A Fatigue Crack Growth Rate of an Al-Cu-Mg Alloy. IOP Conf. Ser. Earth Environ. Sci. 2019, 237, 032122. [Google Scholar] [CrossRef] [Green Version]
  37. Williams, J.J.; Yazzie, K.E.; Connor Phillips, N.; Chawla, N.; Xiao, X.; Carlo, F.; Iyyer, N.; Kittur, M. On the correlation between fatigue striation spacing and crack growth rate: A three-dimensional (3-D) X-ray synchrotron tomography study. Metallurg. Mater. Trans. A. 2011, 42, 3845–3848. [Google Scholar] [CrossRef]
  38. Mills, W.J.; James, L.A. Effect of heat-treatment on elevated temperature fatigue-crack growth behavior of two heats of alloy 718. In ASME Winter Annual Meeting; Westinghouse Hanford Company Richland: Washington, DC, USA, 1978; p. 35. [Google Scholar]
  39. Bulloch, J.H.; Callagy, A.G. A detailed study of the relationship between fatigue crack growth rate and striation spacing in a range of low alloy ferritic steels. Eng. Fail. Anal. 2010, 17, 168–178. [Google Scholar] [CrossRef]
  40. Bogdanowicz, Z.; Kocańda, D.; Torzewski, J. Applying fractographic analysis for the evaluation of the effects of variable-amplitude loads on fatigue crack growth rates for the 2024-T3 aluminium alloy. Arch. Mechan. Eng. 2009, 4, 383–404. [Google Scholar] [CrossRef]
  41. Furukawa, K. Method for estimating service load from striation width and height. Mater. Sci. Eng. A. 2000, 285, 80–84. [Google Scholar] [CrossRef] [Green Version]
  42. Ruckert, C.O.F.T.; Messias Filho, A.A.; Bose Filho, W.W.; Spinelli, D.; Tarpani, J.R. Load ratio estimation through striation height and spacing analysis of an aerospace al alloy 7475-T7351. J. Mater. Eng. Perf. 2011, 20, 382–389. [Google Scholar] [CrossRef]
  43. Wareing, J.; Vaughan, H.G. The relationship between striation spacing, macroscopic crack growth rate, and the low-cycle fatigue life of a Type 316 stainless steel at 625 oC. Met. Sci. 1977, 11, 439–446. [Google Scholar] [CrossRef]
  44. Romaniv, O.N.; Shur, E.A.; Tkach, A.N.; Simin’kovich, V.N.; Kiseleva, T.N. The kinetics and mechanism of fatigue crack growth in iron. Soviet Mater. Sci. 1981, 17, 158–166. [Google Scholar] [CrossRef]
  45. Krasovskii, A.Y.; Ostash, O.P.; Stepanenko, V.A.; Yarema, S.Y. The effect of low temperatures on the rate and microfractographic features of the development of a fatigue crack in low-carbon steel. Strength Mater. 1977, 9, 458–463. [Google Scholar] [CrossRef]
  46. Grinberg, N.M. Spacing of fatigue striations and crack growth rate. Soviet Mater. Sci. 1985, 21, 153–160. [Google Scholar] [CrossRef]
  47. Grinberg, N.M.; Kudryavtseva, E.E.; Serdyuk, V.A. Fatigue crack growth in IMV6 magnesium alloy at temperatures of 293 and 140°K. Soviet Mater. Sci. 1985, 21, 445–449. [Google Scholar] [CrossRef]
  48. Krasowsky, A. Edvanced SEM methods in fatigue and fracture research. Kov. Mater. 1998, 36, 193–199. [Google Scholar]
  49. Hayley, S. Micro-fatigue crack growth testing and 3d characterization of small cracks in Ti-6Al-4V made by additive manufacturing using synchrotron X-ray tomography. In A Thesis for the Degree of Master of Science in Materials Science and Engineering; Worcester Polytechnic Institute: Wuster, MA, USA, 2014. [Google Scholar]
  50. Yasniy, P.; Maruschak, P.; Lapusta, Y. Experimental study of crack growth in a bimetal under fatigue and fatigue-creep conditions. Int. J. Fract. 2006, 139, 545–552. [Google Scholar] [CrossRef]
  51. DeVries, P.H.; Ruth, K.T.; Dennies, D.P. Counting on fatigue: Striations and their measure. J. Fail. Anal. Preven. 2010, 10, 120–137. [Google Scholar] [CrossRef]
  52. Ruellan, B.; Robin, E.; Le Cam, J.-B.; Jeanneau, I.; Canévet, F.; Mauvoisin, G.; Loison, D. Contribution to fatigue striation phenomenon analysis by using image processing. In Advancement of Optical Methods & Digital Image Correlation in Experimental Mechanics, Conference Proceedings of the Society for Experimental Mechanics Series, Reno, NV, USA, 3–6 June 2019; Lamberti, L., Lin, M.T., Furlong, C., Sciammarella, C., Reu, P., Sutton, M., Eds.; Springer: Cham, Switzerland, 2019; Volume 3. [Google Scholar] [CrossRef]
  53. de Matos, P.F.P.; Moreira, P.M.G.P.; Pina, J.C.P.; Dias, A.M.; de Castro, P.M.S.T. Residual stress effect on fatigue striation spacing in a cold-worked rivet hole. Theor. Appl. Fract. Mechan. 2004, 42, 139–148. [Google Scholar] [CrossRef]
  54. Hershko, E.; Mandelker, N.; Gheorghiu, G.; Sheinkopf, H.; Cohen, I.; Levy, O. Assessment of fatigue striation counting accuracy using high resolution scanning electron microscope. Eng. Fail. Anal. 2008, 15, 20–27. [Google Scholar] [CrossRef]
  55. Lenets, Y.N.; Bellows, R.S. Crack propagation life prediction for Ti-6Al-4V based on striation spacing measurements. Int. J. Fatig. 2000, 22, 521–529. [Google Scholar] [CrossRef]
  56. Connors, W.C. Fatigue striation spacing analysis. Mater. Character. 1994, 33, 245–253. [Google Scholar] [CrossRef]
  57. Lauschmann, H.; Nedbal, I. Applications of Image Analysis in Fractography of Fatigue Failures. Procedia Struct. Integr. 2019, 23, 107–112. [Google Scholar] [CrossRef]
  58. Lauschmann, H. Textural fractography: Estimation of the mean striation spacing and direction. In International Conference on Stereology and Image Analysis in Materials Science; Polish Society for Stereology: Cracow, Poland, 2000; pp. 241–246. [Google Scholar]
  59. Yamagiwa, K.; Izumi, S.; Sakai, S. Detecting method of striation region of fatigue fracture surface using wavelet transform. J. Soc. Mater. Sci. Japan. 2004, 53, 306–312. (In Japanese) [Google Scholar] [CrossRef] [Green Version]
  60. Student, O.; Tkachuk, Y.; Sydor, P. Technical Expertise of Damaged Structural Elements of Power Plant Steam Turbine. In Proceedings of the 14th International Conference “Mechanika–2009”, Kaunas, Lithuania, 2–3 April 2009; pp. 396–400. [Google Scholar]
  61. Serra, J.; Soille, P. Mathematical Morphology and Its Applications to Image Processing; Springer: Amsterdam, The Netherlands, 1994; p. 385. [Google Scholar]
  62. Duda, R.O.; Hart, P.E. Use of the Hough transformation to detect lines and curves in pictures. Comm. ACM. 1972, 15, 11–15. [Google Scholar] [CrossRef]
  63. Tkachuk, Y.M.; Student, O.Z. Features of fracture and fatigue durability of the maintained steel of disks of the steam turbine of thermal power station. Metallof. Noveishie Tekhnol. 2011, 33, 449–460. [Google Scholar]
  64. Student, O.Z.; Krechkovska, H.V.; Svirska, L.M.; Kindratsky, B.I.; Shyrokov, V.V. Ranking of mechanical characteristics of steels of steam pipelines of TPPs according to their sensitivity to operational degradation. Phys. Chem. Mechan. Mater. 2021, 57, 110–117. (In Ukrainian) [Google Scholar]
  65. Nykyforchyn, H.M.; Student, O.Z.; Krechkovs’ka, H.V.; Markov, A.D. Evaluation of the influence of shutdowns of a technological process on changes in the in-service state of the metal of main steam pipelines of thermal power plants. Mater. Sci. 2010, 46, 177–189. [Google Scholar] [CrossRef]
  66. McEvily, A.J.; Matsunaga, H. On fatigue striations. Trans. B. Mechan. Eng. 2010, 17, 75–82. [Google Scholar]
  67. Student, O.Z.; Cichosz, P.; Szimkowski, J. Correlation between the fracture roughness and fatigue graded threshold high steel. Mater. Sci. 1999, 35, 796–801. [Google Scholar] [CrossRef]
  68. Student, O.Z.; Dudziński, W.; Nykyforchyn, H.M.; Kamińska, A. Effect of high-temperature degradation of heat-resistant steel on the mechanical and fractographic characteristics of fatigue crack growth. Mater. Sci. 1999, 35, 499–508. [Google Scholar] [CrossRef]
  69. Dmytrakh, I.M.; Syrotyuk, A.M.; Leshchak, R.L. Specific effects of hydrogen concentration on resistance to fracture of ferrite-pearlitic pipeline steels. Proc. Struct. Int. 2019, 16, 113–120. [Google Scholar] [CrossRef]
  70. Smiyan, O.D.; Student, O.Z. Fractographic signs of gigacyclic fatigue and hydrogenation during operation of heat-resistant steels. Mater. Sci. 2020, 56, 1–11. (In Ukrainian) [Google Scholar]
  71. Nykyforchyn, H.M.; Student, O.Z. Influence of hydrogen of the formation of fatigue thresholds in structural steels. Mater. Sci. 2001, 37, 252–263. [Google Scholar] [CrossRef]
  72. Birenis, D.; Ogawa, Y.; Matsunaga, H.; Takakuwae, O.; Yamabe, J.; Prytz, O.; Thøgersen, A. Interpretation of hydrogen-assisted fatigue crack propagation in BCC iron based on dislocation structure evolution around the crack wake. Acta Mater. 2018, 156, 245–253. [Google Scholar] [CrossRef]
  73. Matsunaga, H.; Noda, H. Visualization of hydrogen diffusion in a hydrogen-enhanced fatigue crack growth in type 304 stainless steel. Metall. Mater. Trans. A 2011, 42, 2696–2705. [Google Scholar] [CrossRef]
  74. Maruschak, P.O.; Panin, S.V.; Stachowicz, F.; Danyliuk, I.M.; Vlasov, I.V.; Bishchak, R.T. Structural levels of fatigue failure and damage estimation in 17Mn1Si steel on the basis of a multilevel approach of physical mesomechanics. Acta Mechan. 2016, 227, 151–157. [Google Scholar] [CrossRef]
Figure 1. Typical fractographic image of the fatigue fracture surface of 34KhN3M steel in the initial state with small fatigue striations located across narrow strips elongated in the FCG direction. Four fragments selected for further analysis and demonstration of the possibilities of proposed approach are highlighted in the fractogram.
Metals 11 01776 g001
Figure 2. The flowchart of proposed method for automated FS spacing evaluation.
Metals 11 01776 g002
Figure 3. The curve of the grey levels of the pixel column of fragment 2 (with obvious fatigue striations) in the image shown in Figure 1, with the local minima highlighted in red after the first (a) and second (b) iterations.
Metals 11 01776 g003
Figure 4. Binary image obtained after iterative selection of local minima (a), and the result of its morphological processing (b).
Metals 11 01776 g004
Figure 5. A fragment of a binary image with lines corresponding to the striations (a) and the result of their rotation (b).
Metals 11 01776 g005
Figure 6. Fragments 1–4 (a,d,g,j), highlighted on the fractographic image in Figure 1, binary image of striations on fragments (b,e,h,k) and lines corresponding to the striations from fragments after rotation without changing the distance between them (c,f,i,l).
Metals 11 01776 g006
Figure 7. Histograms of distribution of distance d i   ,   i = 1 N p between the lines corresponding to the striations (in pixels), detected in fragments 1–4 (ad), highlighted in the fractographic image in Figure 1.
Metals 11 01776 g007
Figure 8. Macroscopic FCG rate da/dN depending on the values of the SIF range ΔK for 34KhN3M steel in the initial state (black triangles) and after ~ 3 × 10⁵ h of operation in the rotor disk of a steam turbine (black circles). The scattering bands of the values of microscopic FCG rate and its average values (white triangles and circles correspond to the steel in the initial state and after long-term operation) were obtained using the proposed method of estimating the distance between fatigue striations on digital fractographic images. All values of the microscopic FCG velocity within each of the scatter bands were obtained at the same value of the SIF range. The values of the microscopic FCG velocity for steel in the initial state and after operation, determined from the manually measured spacing of the fatigue striations, are shown by black inverted triangles and rhombuses, respectively.
Metals 11 01776 g008
Table 1. Chemical composition of 34KhN3M steel for steam turbine rotor disk, wt. %.
Steel StateCNiCrMoSiMnSPFe
Initial state0.332.900.900.300.370.620.0350.030Rest
After operation0.322.800.910.290.410.590.0530.039Rest
Table 2. Tensile mechanical properties of 34Kh3M steel for a steam turbine rotor disk.
Steel StateσUTS, MPaσYS, MPaRA, %El, %
Initial state856.3690.561.318.4
After operation1002.5936.751.213.5
Table 3. Striation spacing, determined from the analysis of fragments of the fractographic image of the fatigue fracture of 34KhN3M steel in the initial state.
The Number of the Fragment Analyzed in Figure 1 The   Striation   Spacing   Most   Often   Recorded   ( Mode ) ,   D m The   Average   Striation   Spacing ,   D a v
PixelμmPixelμm
1172.23162.11
2111.45141.84
3111.45162.11
4111.45162.11
All images111.45162.11
Publisher’s Note: MDPI stays neutral with regard to jurisdictional claims in published maps and institutional affiliations.