
Extrusion-Based 3D Printing of CuSn10 Bronze Parts: Production and Characterization

Abstract
:1. Introduction
2. Materials and Methods
2.1. Materials
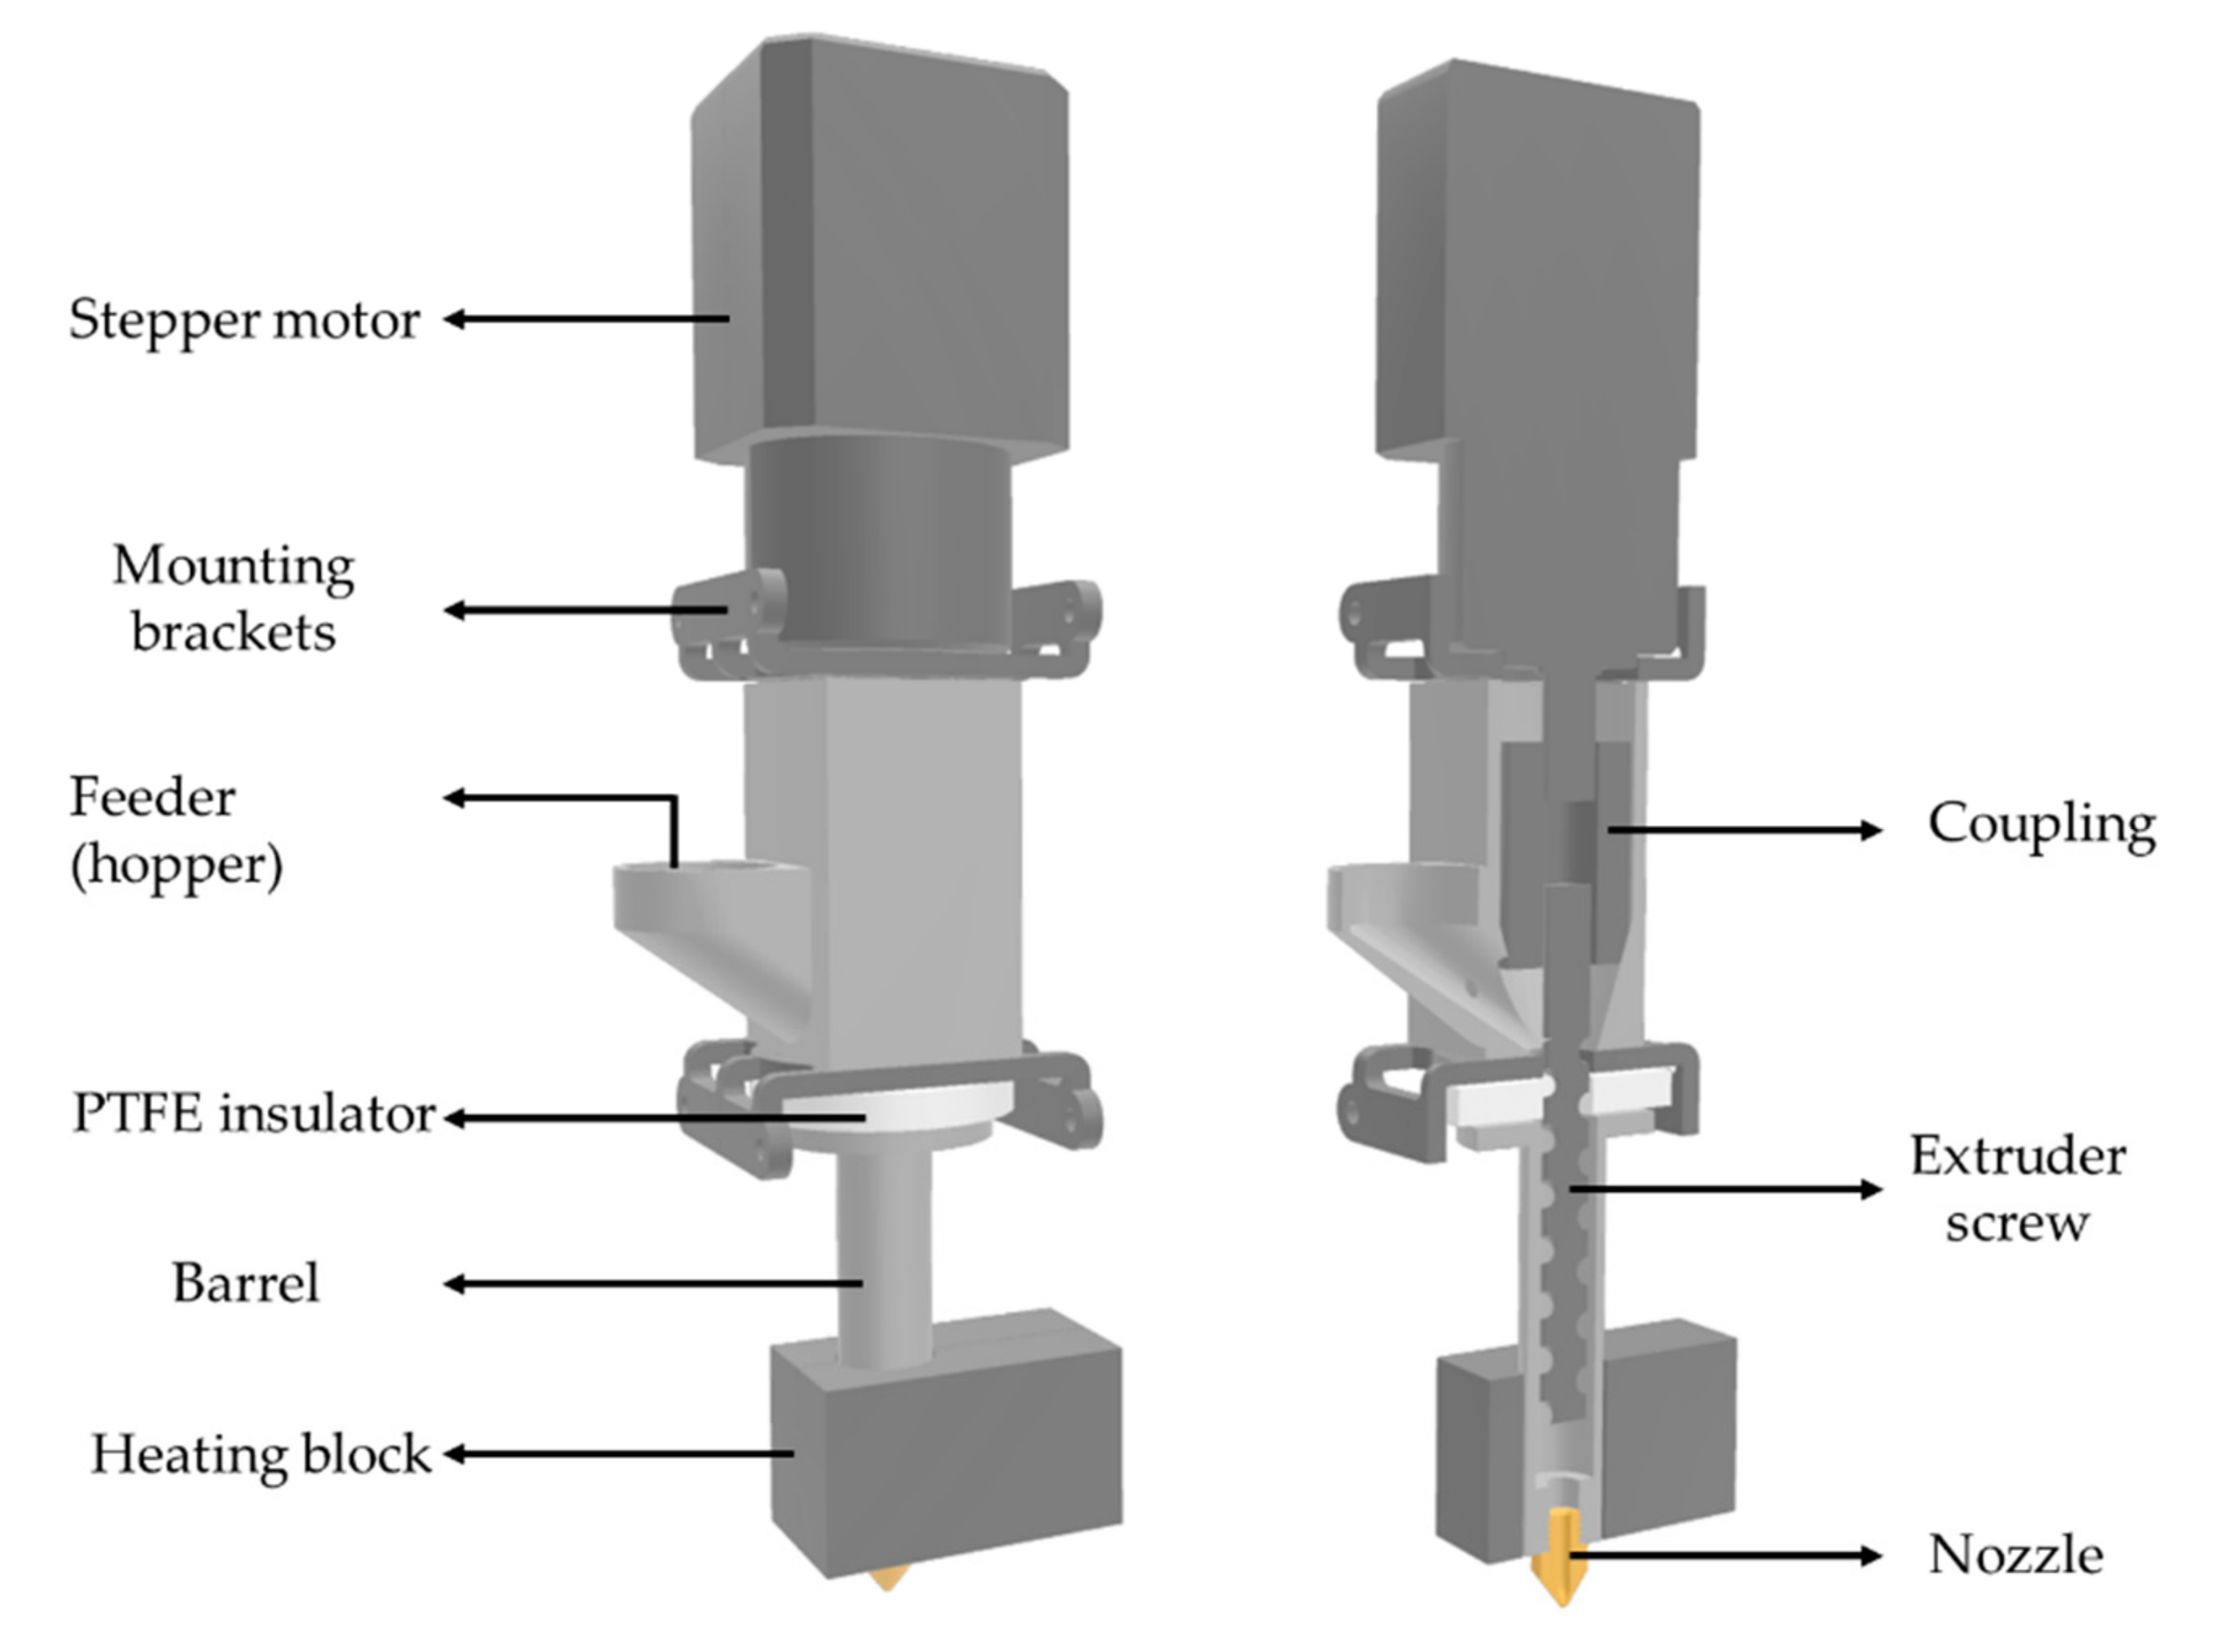
2.2. Production
2.3. Characterization
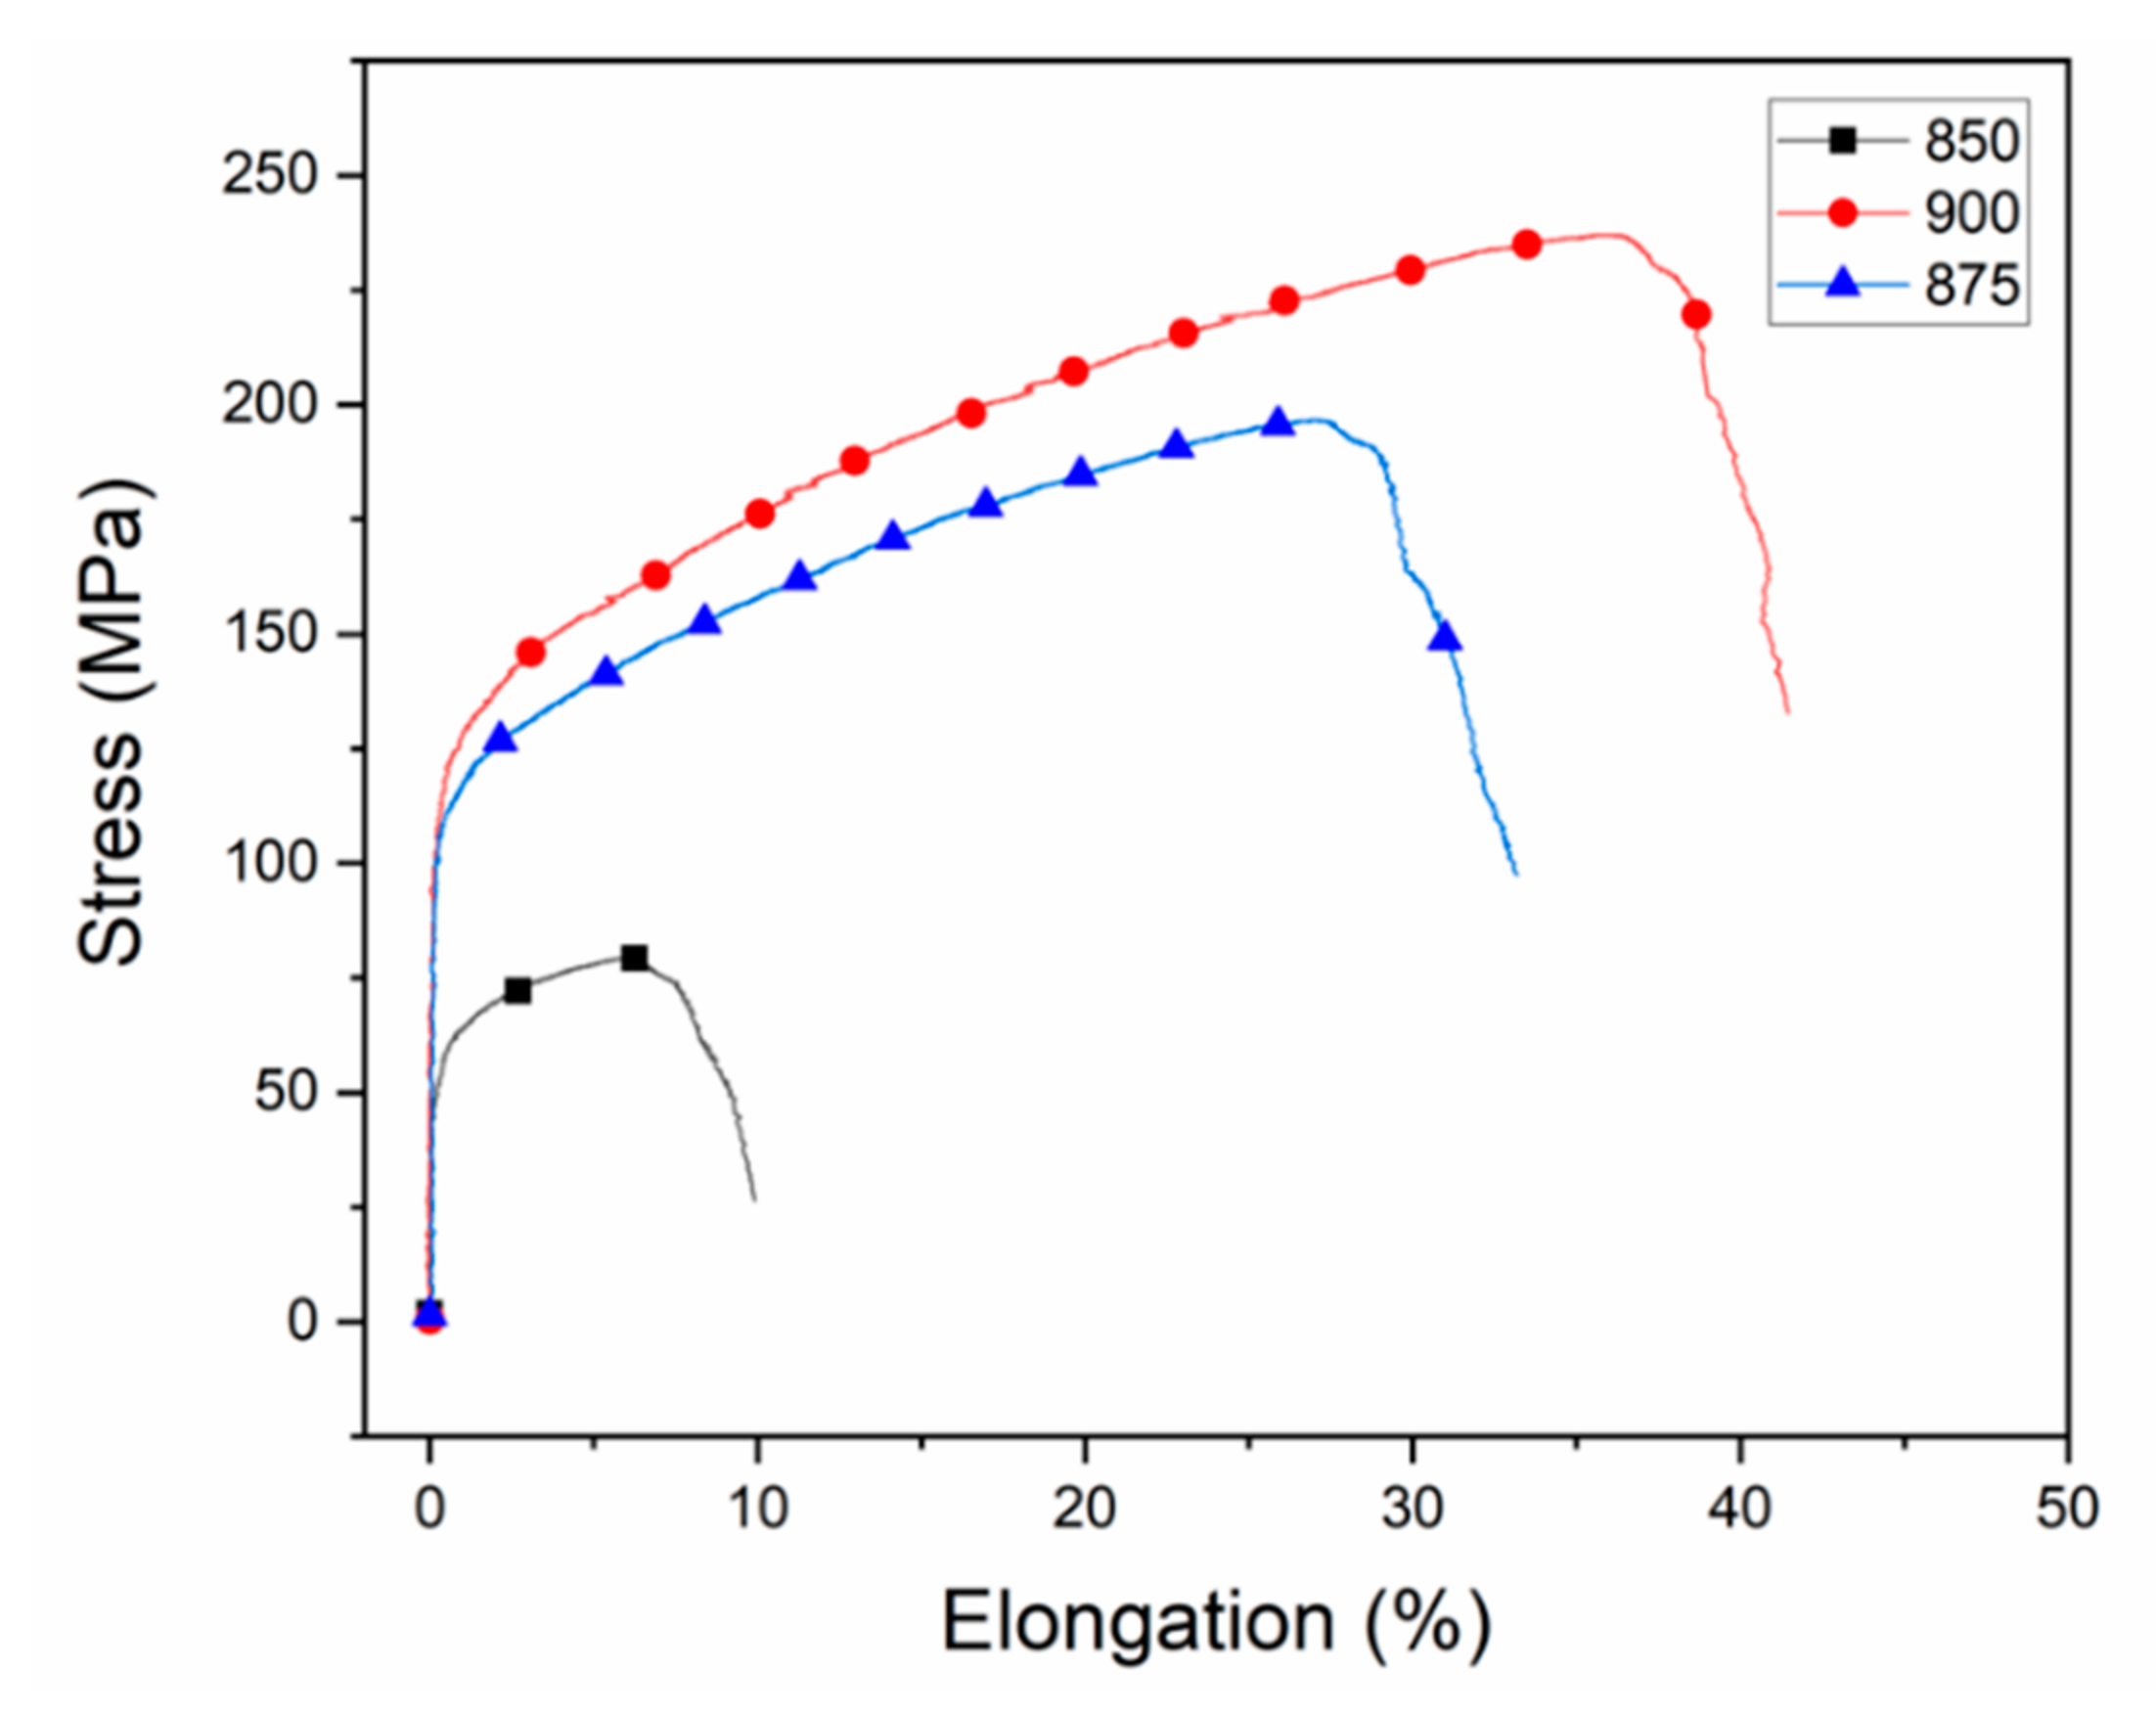
3. Results and Discussion
4. Conclusions
Author Contributions
Funding
Data Availability Statement
Acknowledgments
Conflicts of Interest
References
- Klocke, F.; Arntz, K.; Teli, M.; Winands, K.; Oliari, S. State-of-the-art Laser Additive Manufacturing for Hot-work Tool Steels. Procedia CIRP 2017, 63, 58–63. [Google Scholar] [CrossRef]
- Yan, X.; Hao, L.; Xiong, W.; Tang, D. Research on influencing factors and its optimization of metal powder injection molding without mold via an innovative 3D printing method. RSC Adv. 2017, 7, 55232–55239. [Google Scholar] [CrossRef] [Green Version]
- Oropallo, W.; Pielg, L. Ten challenges in 3D printing. Eng. Comput. 2016, 32, 135–148. [Google Scholar] [CrossRef]
- Ngo, T.D.; Kashani, A.; Imbalzano, G.; Nguyem, K.T.Q.; Hui, D. Additive manufacturing (3D printing): A review of materials, methods, applications and challenges. Compos. B Eng. 2018, 143, 172–196. [Google Scholar] [CrossRef]
- Chen, Z.; Li, Z.; Liu, C.; Lao, C.; Fu, Y.; Liu, C.; Li, Y.; Wang, P.; He, Y. 3D printing of ceramics: A review. J. Eur. Ceram. Soc. 2019, 39, 661–687. [Google Scholar] [CrossRef]
- Vishwanath, A.S.; Rane, K.; Schaper, J.; Strano, M.; Casati, R. Rapid production of AZ91 Mg alloy by extrusion based additive manufacturing process. Powder Metall. 2021, 1–8. [Google Scholar] [CrossRef]
- Singh, P.; Balla, V.K.; Gokce, A.; Atre, S.V.; Kate, K.H. Additive manufacturing of Ti-6Al-4V alloy by metal fused filament fabrication (MF3): Producing parts comparable to that of metal injection molding. Prog. Addit. Manuf. 2021, 1–14. [Google Scholar] [CrossRef]
- Yan, X.; Wang, C.; Xiong, W.; Hou, T.; Hao, L.; Tang, D. Thermal debinding mass transfer mechanism and dynamics of coppergreen parts fabricated by an innovative 3D printing method. RSC Adv. 2018, 8, 10355–10360. [Google Scholar] [CrossRef] [Green Version]
- Ren, L.; Zhou, X.; Song, Z.; Zhao, C.; Liu, Q.; Xue, J.; Li, X. Process Parameter Optimization of Extrusion-Based 3D Metal Printing Utilizing PW–LDPE–SA Binder System. Materials 2017, 10, 305. [Google Scholar] [CrossRef] [PubMed] [Green Version]
- Gonzalez-Gutierez, J.; Godec, D.; Guráň, R.; Spoerk, M.; Kukla, C.; Holzer, C. 3D printing conditions determination for feedstock used in fused filament fabrication (FFF) of 17-4PH stainless steel parts. Metalurgija 2018, 57, 117–120. [Google Scholar]
- Lieberwirth, C.; Harder, A.; Seitz, H. Extrusion Based Additive Manufacturing of Metal Parts. J. Mech. Eng. Autom. 2017, 7, 79–83. [Google Scholar] [CrossRef] [Green Version]
- Singh, G.; Missiaen, J.-M.; Bouvard, D.; Chaix, J.-M. Copper extrusion 3D printing using metal injection moulding feedstock: Analysis of process parameters for green density and surface roughness optimization. Addit. Manuf. 2021, 38, 101778. [Google Scholar] [CrossRef]
- Lu, Z.; Ayeni, O.I.; Yang, X.; Park, H.Y.; Jung, Y.G.; Zhang, J. Microstructure and Phase Analysis of 3D-Printed Components Using Bronze Metal Filament. J. Mater. Eng. Perform. 2020, 29, 1650–1656. [Google Scholar] [CrossRef]
- Sengupta, P.; Panigrahi, A.; Indoria, B.; Meher, P.; Acharya, T.S.; Basu, S.; Debata, M. Substitution of Ni with NiB prevents shape distortion of liquid phase sintered 90W–6Ni–2Fe–2Co heavy alloys. J. Alloys Compd. 2020, 840, 155785. [Google Scholar] [CrossRef]
- Upadhyaya, A.; German, R.M. Shape distortion in liquid-phase-sintered tungsten heavy alloys. Metall. Mater. Trans. A 1998, 29, 2631–2638. [Google Scholar] [CrossRef]
- Carneiro, O.S.; Silva, A.F.; Gomes, R. Fused deposition modeling with polypropylene. Mater. Des. 2015, 83, 768–776. [Google Scholar] [CrossRef]
- Yang, T.-C.; Yeh, C.-H. Morphology and Mechanical Properties of 3D Printed Wood Fiber/Polylactic Acid Composite Parts Using Fused Deposition Modeling (FDM): The Effects of Printing Speed. Polymers 2020, 12, 1334. [Google Scholar] [CrossRef] [PubMed]
- Amza, C.G.; Zapciu, A.; Popescu, D. Paste Extruder—Hardware Add-On for Desktop 3D Printers. Technologies 2017, 5, 50. [Google Scholar] [CrossRef] [Green Version]
- Kuznetsov, V.E.; Solonin, A.N.; Urzhumtsev, O.D.; Schilling, R.; Tavitov, A.G. Strength of PLA Components Fabricated with Fused Deposition Technology Using a Desktop 3D Printer as a Function of Geometrical Parameters of the Process. Polymers 2018, 10, 313. [Google Scholar] [CrossRef] [Green Version]
- Bin Suleiman Ahmad, M.J.; bin Abdullah, A.N.; bin Ibrahim, R.; Mohamad, M.; Abu Kasim, N.B.; bin Dato’Abdul Kadir, M.R.; Muhamad, S.; Itoh, Y.; Hanada, K.; Shimizu, T. Effect of Sintering Conditions on Mechanical Properties and Microstructure of Titanium Alloy Produced by Metal Injection Moulding (MIM). Adv. Mater. Res. 2013, 686, 164–169. [Google Scholar] [CrossRef]
- Singh, G.; Pandey, P.M. Ultrasonic Assisted Pressureless Sintering for rapid manufacturing of complex copper components. Mater. Lett. 2019, 236, 276–280. [Google Scholar] [CrossRef]
- Rane, K.; Strano, M. A comprehensive review of extrusion-based additive manufacturing processes for rapid production of metallic and ceramic parts. Adv. Manuf. 2019, 7, 155–173. [Google Scholar] [CrossRef]
- Mousapour, M.; Azadbeh, M.; Danninger, H. Effect of compacting pressure on shape retention during supersolidus liquid phase sintering of Cu base alloys. Powder Metall. 2017, 60, 393–403. [Google Scholar] [CrossRef]
- Wahi, A.; Muhamad, N.; Sulong, A.B.; Ahmad, R.N. Effect of sintering temperature on density, hardness and strength of MIM Co30Cr6Mo biomedical alloy. J. Jpn. Soc. Powder Powder Metall. 2016, 63, 434–437. [Google Scholar] [CrossRef] [Green Version]
- Scudino, S.; Unterdörfer, C.; Prashanth, K.G.; Attar, H.; Ellendt, N.; Uhlenwinkel, V.; Eckert, J. Additive manufacturing of Cu–10Sn bronze. Mater. Lett. 2015, 156, 202–204. [Google Scholar] [CrossRef]
- Larimian, T.; Kannan, M.; Grzesiak, D.; AlMangour, B.; Borkar, T. Effect of energy density and scanning strategy on densification, microstructure and mechanical properties of 316L stainless steel processed via selective laser melting. Mater. Sci. Eng. A 2020, 770, 138455. [Google Scholar] [CrossRef]
- Zeng, C.; Zhang, B.; Ettefagh, A.H.; Wen, H.; Yao, H.; Meng, W.J.; Guo, S. Mechanical, thermal, and corrosion properties of Cu-10Sn alloy prepared by laser-powder-bed-fusion additive manufacturing. Addit. Manuf. 2020, 35, 101411. [Google Scholar] [CrossRef]


| Number | Layer Thickness (mm) | Printing Speed (mm/s) | Nozzle Temperature (°C) | Sintering Temperature (°C) |
|---|---|---|---|---|
| 1 | 0.2 | 20 | 210 | 850 (*) |
| 2 | 0.2 | 20 | 210 | 875 (*) |
| 3 | 0.2 | 20 | 210 | 900 (*) |
| 3 | 0.2 | 40 | 210 | - |
| 4 | 0.2 | 40 | 210 | - |
| 5 | 0.2 | 40 | 210 | - |
| 6 | 0.2 | 60 | 210 | - |
| 7 | 0.2 | 60 | 210 | - |
| 8 | 0.2 | 60 | 210 | - |
| 9 | 0.4 | 20 | 210 | - |
| 10 | 0.4 | 20 | 210 | - |
| 11 | 0.4 | 20 | 210 | - |
| 12 | 0.6 | 20 | 210 | - |
| 13 | 0.6 | 20 | 210 | - |
| 14 | 0.6 | 20 | 210 | - |
| Sintering Temperature | Porosity (%) | Density (g/cm3) |
|---|---|---|
| 850 °C | 19.33 ± 3.91 | 7.11 ± 0.39 |
| 875 °C | 7.95 ± 1.62 | 7.92 ± 0.13 |
| 900 °C | 4.45 ± 2.89 | 8.27 ± 0.19 |
| Sintering Temperature (°C) | Yield Strength (MPa) | Ultimate Tensile Strength (MPa) | Elongation at Break (%) |
|---|---|---|---|
| 850 | 43.4 ± 11.48 | 77.3 ± 3.85 | 11.38 ± 1.53 |
| 875 | 103.6 ± 3.09 | 191 ± 5.35 | 33.78 ± 1.61 |
| 900 | 110.66 ± 2.62 | 212 ± 17.72 | 35.65 ± 4.3 |
Publisher’s Note: MDPI stays neutral with regard to jurisdictional claims in published maps and institutional affiliations. |
© 2021 by the authors. Licensee MDPI, Basel, Switzerland. This article is an open access article distributed under the terms and conditions of the Creative Commons Attribution (CC BY) license (https://creativecommons.org/licenses/by/4.0/).
Share and Cite
Kılınç, A.Ç.; Goktas, A.A.; Keskin, Ö.Y.; Köktaş, S. Extrusion-Based 3D Printing of CuSn10 Bronze Parts: Production and Characterization. Metals 2021, 11, 1774. https://doi.org/10.3390/met11111774
Kılınç AÇ, Goktas AA, Keskin ÖY, Köktaş S. Extrusion-Based 3D Printing of CuSn10 Bronze Parts: Production and Characterization. Metals. 2021; 11(11):1774. https://doi.org/10.3390/met11111774
Chicago/Turabian StyleKılınç, Ahmet Çağrı, Ali Aydın Goktas, Özgür Yasin Keskin, and Serhan Köktaş. 2021. "Extrusion-Based 3D Printing of CuSn10 Bronze Parts: Production and Characterization" Metals 11, no. 11: 1774. https://doi.org/10.3390/met11111774
APA StyleKılınç, A. Ç., Goktas, A. A., Keskin, Ö. Y., & Köktaş, S. (2021). Extrusion-Based 3D Printing of CuSn10 Bronze Parts: Production and Characterization. Metals, 11(11), 1774. https://doi.org/10.3390/met11111774