Article

XFEM Simulation of Tensile and Fracture Behavior of Ultrafine-Grained Al 6061 Alloy

by
Saurabh Gairola
and
Rengaswamy Jayaganthan
*
Department of Engineering Design and Correlative Microscopy Lab, Indian Institute of Technology Madras, Chennai 600036, India
*
Author to whom correspondence should be addressed.
Metals 2021, 11(11), 1761; https://doi.org/10.3390/met11111761
Submission received: 26 September 2021 / Revised: 24 October 2021 / Accepted: 27 October 2021 / Published: 2 November 2021
(This article belongs to the Section Metal Failure Analysis)

Abstract

:
In the present work, the tensile and fracture behavior of ultra-fine grained (UFG) Al 6061 alloy was simulated using extended finite element method (XFEM). UFG Al 6061 alloy processed by cryorolling (CR) and accumulative roll bonding (ARB) was investigated in this work. Numerical simulations of two-dimensional and three-dimensional models were performed in “Abaqus 6.14” software using an elastic-plastic approach, and the results obtained were validated with the experimental results. The specimens corresponding to the three-point bend test, compact tension test with center crack, and double edge cracks were analyzed using XFEM (eXtended Finite Element Method) approach. In XFEM, the partition of unity (PU) was used to model a crack in the standard finite element mesh. The tensile and fracture properties obtained from the simulation were in tandem with the experimental data. UFG Al alloy showed higher tensile strength and fracture toughness compared to their bulk solution treated counterparts. Fracture toughness was measured in terms of stress intensity factor and J integral. In CR Al alloys, with increasing thickness reduction, an increase in stress intensity factor and a decrease in the J integral was observed. This behavior is attributed to the increase in strength and decrease in ductility of CR samples with increasing thickness reduction. In ARB Al alloys, the strength and ductility have increased with an increase in number of cycles. It also revealed an increase in both the stress intensity factor and J integral in ARB processed Al alloys with increase in number of cycles, as evident from XFEM simulation results.

1. Introduction

Aluminum alloys are the second most widely used engineering metal after steel [1]. These alloys are used as structural components in a various industries such as the automotive, aerospace industry [2,3]. Al 6061 alloy is a precipitation-hardenable alloy, which provides a combination of high specific strength, tensile, fracture toughness, good workability, and high corrosion resistance [4]. It is one of the most widely used Al alloys; its application ranges from aircraft fitting and structure such as fuselage and wings in the aerospace industry to brake pistons, hydraulic pistons, chassis (Audi A8) in the automotive industry, and various daily use products such as bike frames, beverage cans, camera lens mounts, etc. [4]. Severe plastic deformation (SPD) consists of a group of metal forming processes such as cryorolling (CR) [5,6,7], accumulative roll bonding (ARB) [8], swagging [9] used to produce ultrafine-grained (UFG) materials from the bulk materials. Grain size is a primary microstructural feature that affects the mechanical behavior of materials. The UFG materials possess better mechanical properties such as tensile strength, fatigue strength, and fracture toughness than conventional coarse grain counterparts [10]. SPD processes impart a large amount of strain to the material and result in grain refinement to nano or submicron levels [11]. Fine-grained microstructure in UFG material leads to higher strength as a consequence of the “Hall–Petch equation”.
Many numerical and analytical methods have been developed by researchers to predict and analyze the initial stages of crack growth in metallic materials [12,13,14,15,16,17,18]. Stress intensity factor and J integral are two of the parameters used in fracture mechanics to determine the structural part’s performance in the presence of a crack. In FEA, fracture mechanics problems are defined using conformal meshing. Accurate prediction of the stress–strain field around the crack tip in such techniques requires continuous mesh refinement with crack growth, and this leads to higher computational time [19]. So, in order to minimize the mesh refinement, Belytschko and Black [20] proposed a new approach in which cracks were independent of the meshing and defined by using an independent discontinuous enrichment function. This method was further modified and widely known as the extended finite element method (XFEM) [19,21]. XFEM uses partition of unity to eliminate the need for conformal mesh [22,23]. It uses a level set function to identify and handle the cracks; this allows the modelling of discontinuity without the influence of mesh size [24]. Although the tensile properties and fracture toughness of the UFG Al 6061 alloy are widely studied using experimental procedures, numerical simulation to predict tensile and fracture behavior of this alloy is limited in the literature [10,25,26,27]. Hence, the present work was focused on simulating the tensile and fracture behavior of the ultrafine-grained Al 6061 and validating it with experimental results reported in the literature.

2. Experimental Procedure

2.1. Processing

Solution treatment (ST) was performed by heating the sample to 530 °C for 2 h. followed by quenching in water at room temperature [28]. During solution treatment, the second phase particles dissolve back into metal matrix, and furthermore, the residual stress present in the material is also relieved. T6 Treatment was performed by heating the solution treated samples to 175 °C for 9 h. This leads to formation of fine spherical Mg2Si precipitates [28].
Cryorolling was performed by dipping the sample in to liquid nitrogen for 10 min before each rolling pass. The samples were stored in deep freezer at a temperature of −20 °C to avoid precipitation [10]. At cryogenic temperature, the dynamic recovery of dislocation during rolling is suppressed. This leads to higher dislocation density in the cryorolled samples. High dislocation density along with the ultrafine grain formed in the rolling are responsible for the increase in strength and fracture toughness in cryorolled samples [5].
Accumulative roll bonding (ARB) was performed on sheets of 120 mm × 75 mm × 1 mm. Sheets were stacked on top of each other and then roll bonded with thickness reduction of 50%. These roll bonded sheets were then cut into half, and this cycle is repeated with any lubricant for up to seven cycles [29]. Both CR and ARB do not require any sophisticated dies or machine and can be performed on a conventional rolling mill [5].

2.2. Testing

Tensile testing under different strain rates and temperature was performed on an electric universal tension–compression machine [30]. Three point bend test and compact tension test were performed under displacement controlled loading [10].

3. Simulation Procedure

In this study, the inputs required for simulations were obtained from the literature using “Origin Pro 9.1” software (OriginLab, Northampton, MA, USA), and the simulation was performed using “Abaqus 6.14” FEM software (Dassault system, Johnston, RI, USA).

3.1. XFEM Methodology

In conventional FEM, cracks or any other discontinuity are defined as an intrinsic part of the finite element mesh and are modelled by aligning the element boundary with the crack geometry. So, when the crack tip advances, the mesh must be redefined to ensure this alignment. In XFEM approach, the crack is independent of mesh, and hence, a crack can propagate through elements without remeshing. This significantly reduces the computational resources. The XFEM approach is based on three main factors: non-smooth solution properties, the partition of unity, and enrichment function.
Non-smooth solution properties are those properties that experience a rapid change over the domain. These properties are related to discontinuities, such as cracks, grain boundaries, holes, inclusion, etc. In real-world applications, these discontinuities can be frequently observed and are usually categorized into two types: weak discontinuities (the location where field quantities change direction) and strong discontinuities (the location where field quantities have a jump) [10]. The current study is centered on strong discontinuities.
In XFEM, the conventional finite element approximation is improved by using an extrinsic PU approach to introduce discontinuities within the problem. In the past two decades, XFEM has been widely used to model crack growth [19,31]. The cracks in XFEM mesh are defined by enriching the elements with an additional degree of freedom. The shape function in finite elements follows the PU property. This property states that the summation of a specific element’s shape function remains unity in all locations within the specified element [19].
i = 1 n φ x = 1
Heaviside function is used to determine the discontinuity in the displacement due to crack; this function takes the value of −1 below crack surface and +1 above crack surface.
H x = s i g n ϕ x = 1 ,     i f   x x . e 2 ^ 0 1 ,     o t h e r w i s e        
where x is closed point projection of x on the crack face, e 2 ^ is normal to crack face at x , and s i g n . is the signed distance function.
Displacement ( u h ) in XFEM is defined as:
u h x = u F E + u e n r
where   u F E is the displacement in traditional FEA, u e n r is the displacement due to enrichment function.
u h x = N I x I = 1 , J = 1 , K = 1 N U i x + H x a J + ϕ x b K x x = 1 x = 4  
where U i is the displacement vector corresponding to the conventional finite element, a j is the additional degree of freedom (DOF) due to enrichment by Heaviside function, and b K x is a node enriched DOF corresponding to the asymptotic crack tip. The additional degree of freedom in the enrichment function is calculated only for the elements in the vicinity of cracks or any other discontinuities, as shown in Figure 1. The crack tip is modelled using enrichment function ϕ x in the displacement approximation, which is given as:
ϕ 1 4 x = r l . sin θ 2 ,   r l . cos θ 2 ,   r l . sin θ 2 sin θ ,   r l . cos θ 2 sin θ  
where ( r , θ ) is a polar coordinate system with its origin at the crack tip, and ( θ = 0 ) is tangent to the crack at the tip. In the LEFM approach, exponent l is 0.5, while in the EPFM approach, exponent l becomes 1 / 1 + n , where n is the hardening exponent [32,33]. In the absence of enrichment, the Equation (4) becomes the equation for displacement in classical FEA. Figure 1 shows the enrichment of nodes in the vicinity of the crack.
To model the crack propagation in the Abaqus using XFEM, both damage initiation and evolution are considered [34]. In the present study, the maximum principal stress criterion is used for damage initiation. The damage will initiate when the principal stress surpasses the maximum principal stress value specified as part of the material properties. For damage evolution, Abaqus uses a scalar damage parameter D to predict the damage in the metal matrix due to nucleation, growth, and coalescence of the microvoids. It increases monotonically with increase in plastic deformation and ranges from 0 at undamaged sample to 1 at complete failure [35]. The damaged stress ( σ ¯ ) using damage coefficient is defined as [36]:
σ ¯ = 1 D σ e q
where   σ e q is the equivalent stress in the undamaged model considering the plastic behavior up to necking. Damage evolution can be defined using either displacement at failure (difference between the displacement at failure and displacement at damage initiation) or fracture energy (area of the curve under the load versus displacement curve). In the current study, displacement at failure is used as a parameter for defining the damage evolution. Damage variable is calculated using following equation [34]:
D = δ m f . δ m m a x δ m 0 δ m m a x . δ m f δ m 0
where δ m m a x is the maximum displacement during loading history, δ m f is the displacement at complete failure and δ m 0 is displacement at damage initiation.

3.2. Tensile Simulation

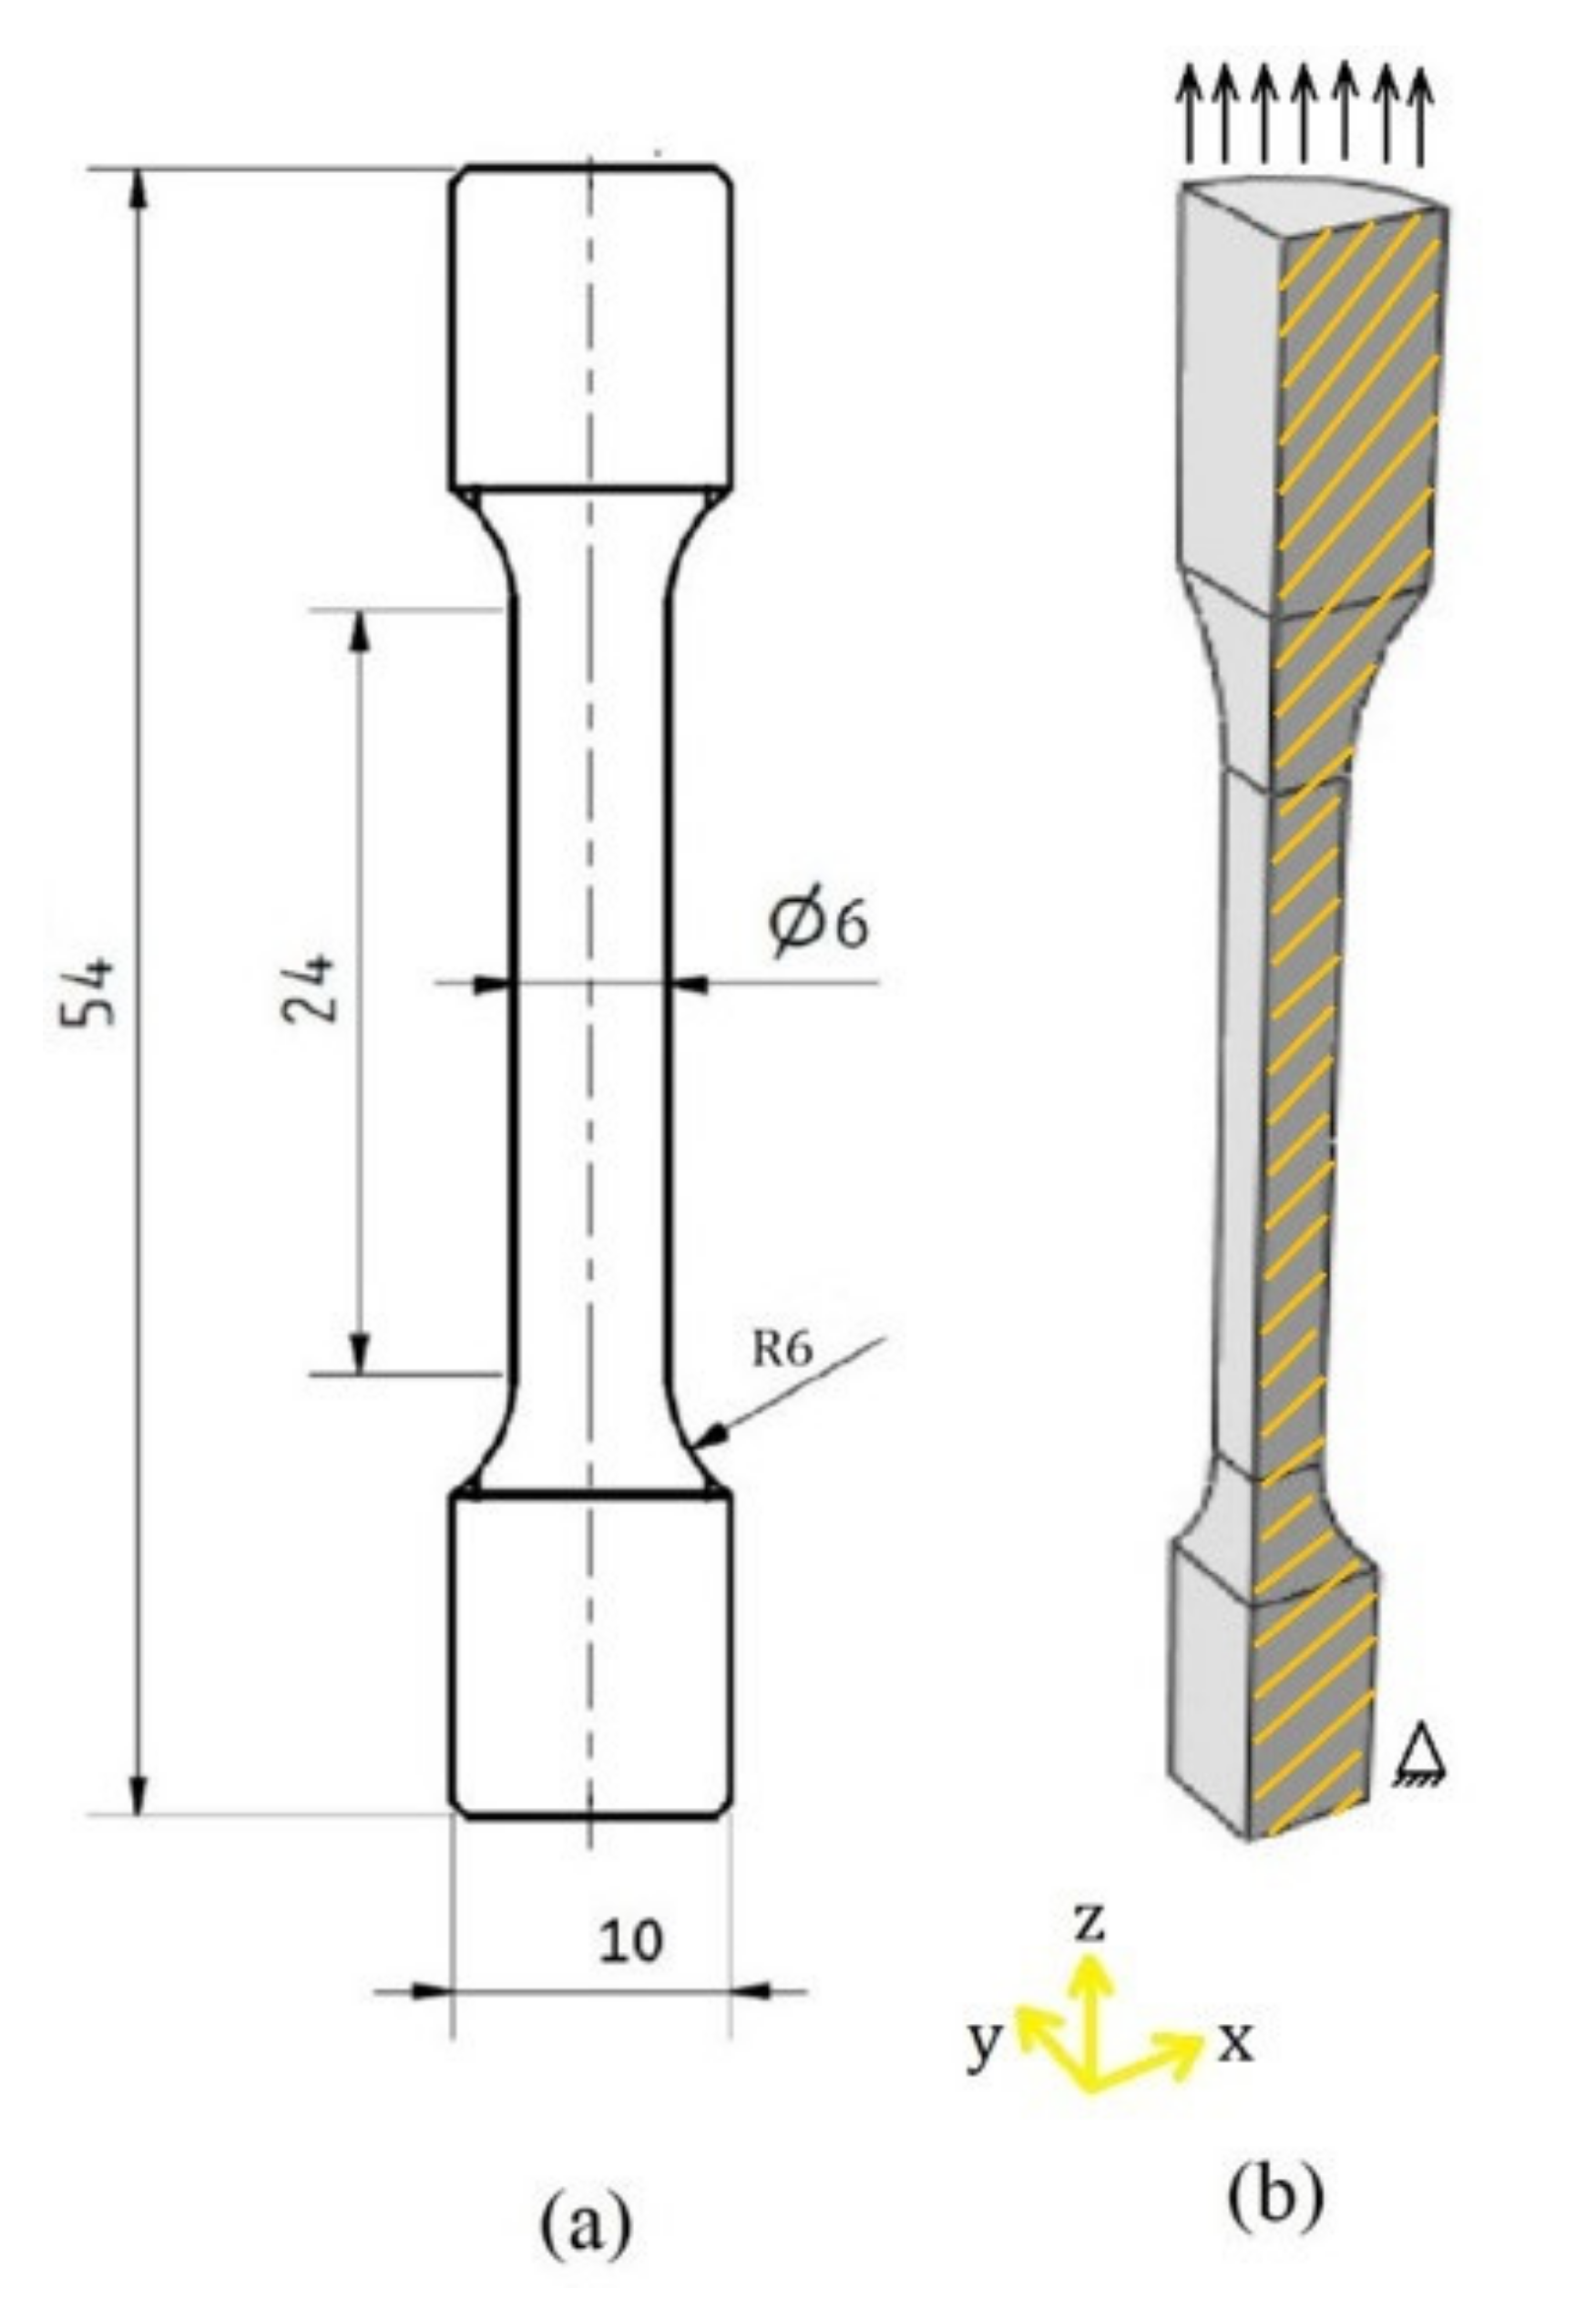
The tensile specimen of Al 6061 was modelled as per the ASTM E8 standard [37], and geometry of the specimen is shown in Figure 2a. Samples for simulation were modelled as a quarter section of dog bone shaped circular specimen, as shown in Figure 2b. Material model in the elastic region was defined by Young’s modulus (E) and Poisson’s ratio, E was calculated from the slope of the stress–strain curve in the elastic region from the experimental data of each case, and Poisson’s ratio was taken as 0.3; in the plastic region, the stress and plastic strain data were used; and for damage criteria, fracture strain, strain rate and displacement at fracture were used. These inputs required were taken from the literature and our earlier work [10,28,29]. A structural mesh containing 2736 C3D8R (8-node linear brick, reduced integration, hourglass control) elements was used. The elastoplastic approach was used to predict the tensile behavior in different conditions.
Displacement controlled loading was applied with the boundary condition of keeping one side fixed, while displacement loading is applied on the other end, as shown in Figure 2b. Two additional boundary conditions were used based on the assumption that the cross-section of the specimen remains circular during the tensile test; in xz plane (shaded by yellow color in Figure 2b), displacement and rotation perpendicular to the plane were kept zero i.e., u y = u r x = u r y = 0 and similarly, in the yz plane, u x ,   u r y ,   and   u r z were kept zero.

Flow Curve

The effect of variation in strain rate and temperature on the tensile behavior of the Al 6061 was predicted using the Johnson Cook (JC) material model. Geometry and the boundary condition used to simulate the flow curve are the same as described in the previous section. In the elastic region, Young’s modulus and Poisson’s ratio were used, and in the plastic region, the JC material model was used. The constitutive equation of the Johnson Cook model is as follows:
σ = A + B ε n 1 + C ln ε ε 0 1 T T r o o m T m e l t T r o o m m
where σ is equivalent plastic stress; A is yield stress of reference state, i.e., quasi-static test, B is hardening modulus, C is strain rate dependent coefficient, n is work hardening component, ε is the equivalent plastic strain, ε ˙   a n d   ε ˙ 0 are the plastic strain rate and the reference plastic strain rate corresponding to the quasi-static test, respectively. T* is the normalized temperature, T 0 is the reference temperature (i.e., room temperature), Tm is the melting temperature, and m is the thermal softening coefficient. The parameters in the Johnson Cook model was determined from the experimental data at different temperature and strain rate. A is the yield stress at reference strain rate (1 × 10⁻³ s−1) at room temperature [38]. At reference strain rate and room temperature, the Equation (8) reduces to:
σ = A + B ε n   o r   σ A = B ε n        
Taking natural logarithmic on both side of the equation, the modified equation can be obtained as shown below:
ln σ A = ln B + n . ln ε    
The plot between ln σ A and ln ε was drawn, and first-order regression model was fitted to the plot. The slope of the regression model gives constant n, and the y-intercept of the equation is ln B .
At reference temperature, the Equation (8) reduces to:
σ = A + B ε n 1 + C ln ε ε 0 o r   σ A + B ε n = 1 + C ln ε ε 0
The values of A, B, and n obtained using Equation (10) were put into the Equation (11). σ A + B ε n   versus ln ε ε 0 were plotted for different strains (5 × 10² s−1, 5 × 10³ s−1, 1 × 10⁴ s−1), and the first-order regression model was made with a y-intercept value of 1. The slope of the linear regression line gives us constant C.
At reference strain rate (0.001 s−1), the Equation (8) reduces to:
σ = A + B ε n 1 T T r o o m T m e l t T r o o m m o r   1 σ A + B ε n = T T r o o m T m e l t T r o o m m
Taking natural logarithmic on both sides:
ln 1 σ A + B ε n = m . ln T T r o o m T m e l t T r o o m
Substituting the material constant A, B, and n into Equation (13) and fitting the first-order regression model, the slope of the regression curve gives us material constant m. JC failure or damage model is given by [36].
D = Δ ε ε f    
where Δ ε is the increment of the equivalent plastic strain and ε f is the equivalent plastic strain at failure. The equivalent plastic strain is given by:
ε f = D 1 + D 2 exp D 3 P σ 1 + D 4 ln ε ε 0 1 + D 5 T T r o o m T m e l t T r o o m  
where D 1 D 5 are material parameters. The first term in the equation depends on pressure; the second term corresponds to the strain rate effect, and the third term is due to thermal effects.

3.3. Three-Point Bend Test Simulation

A three-point bend test specimen was modelled as per ASTM E1820−09e1 with a predefined crack length of 1.5 mm [5]. The specifications of the three-point bend test specimen are shown in Figure 3. Cylindrical rigid bodies were defined for applying load and providing support, i.e., displacement type loading in the y-direction is applied to the loading pin, and the supporting pin is kept fixed (i.e., u x = u y = u z = u r x = u r y = u r z = 0 ) as shown by red colour in the Figure 3b. The three-point bend test specimen was meshed using C3D8R elements, the same elements as used in the tensile simulation. The rigid bodies were defined using a 4-node, 3-D bilinear rigid quadrilateral (R3D4) elements; these elements do not allow deformation. Geometry was loaded using a quasi-static load in displacement-controlled loading. Tensile properties and elasto-plastic approach were used to predict the load versus displacement curve [19].

3.4. Compact Tension Simulation

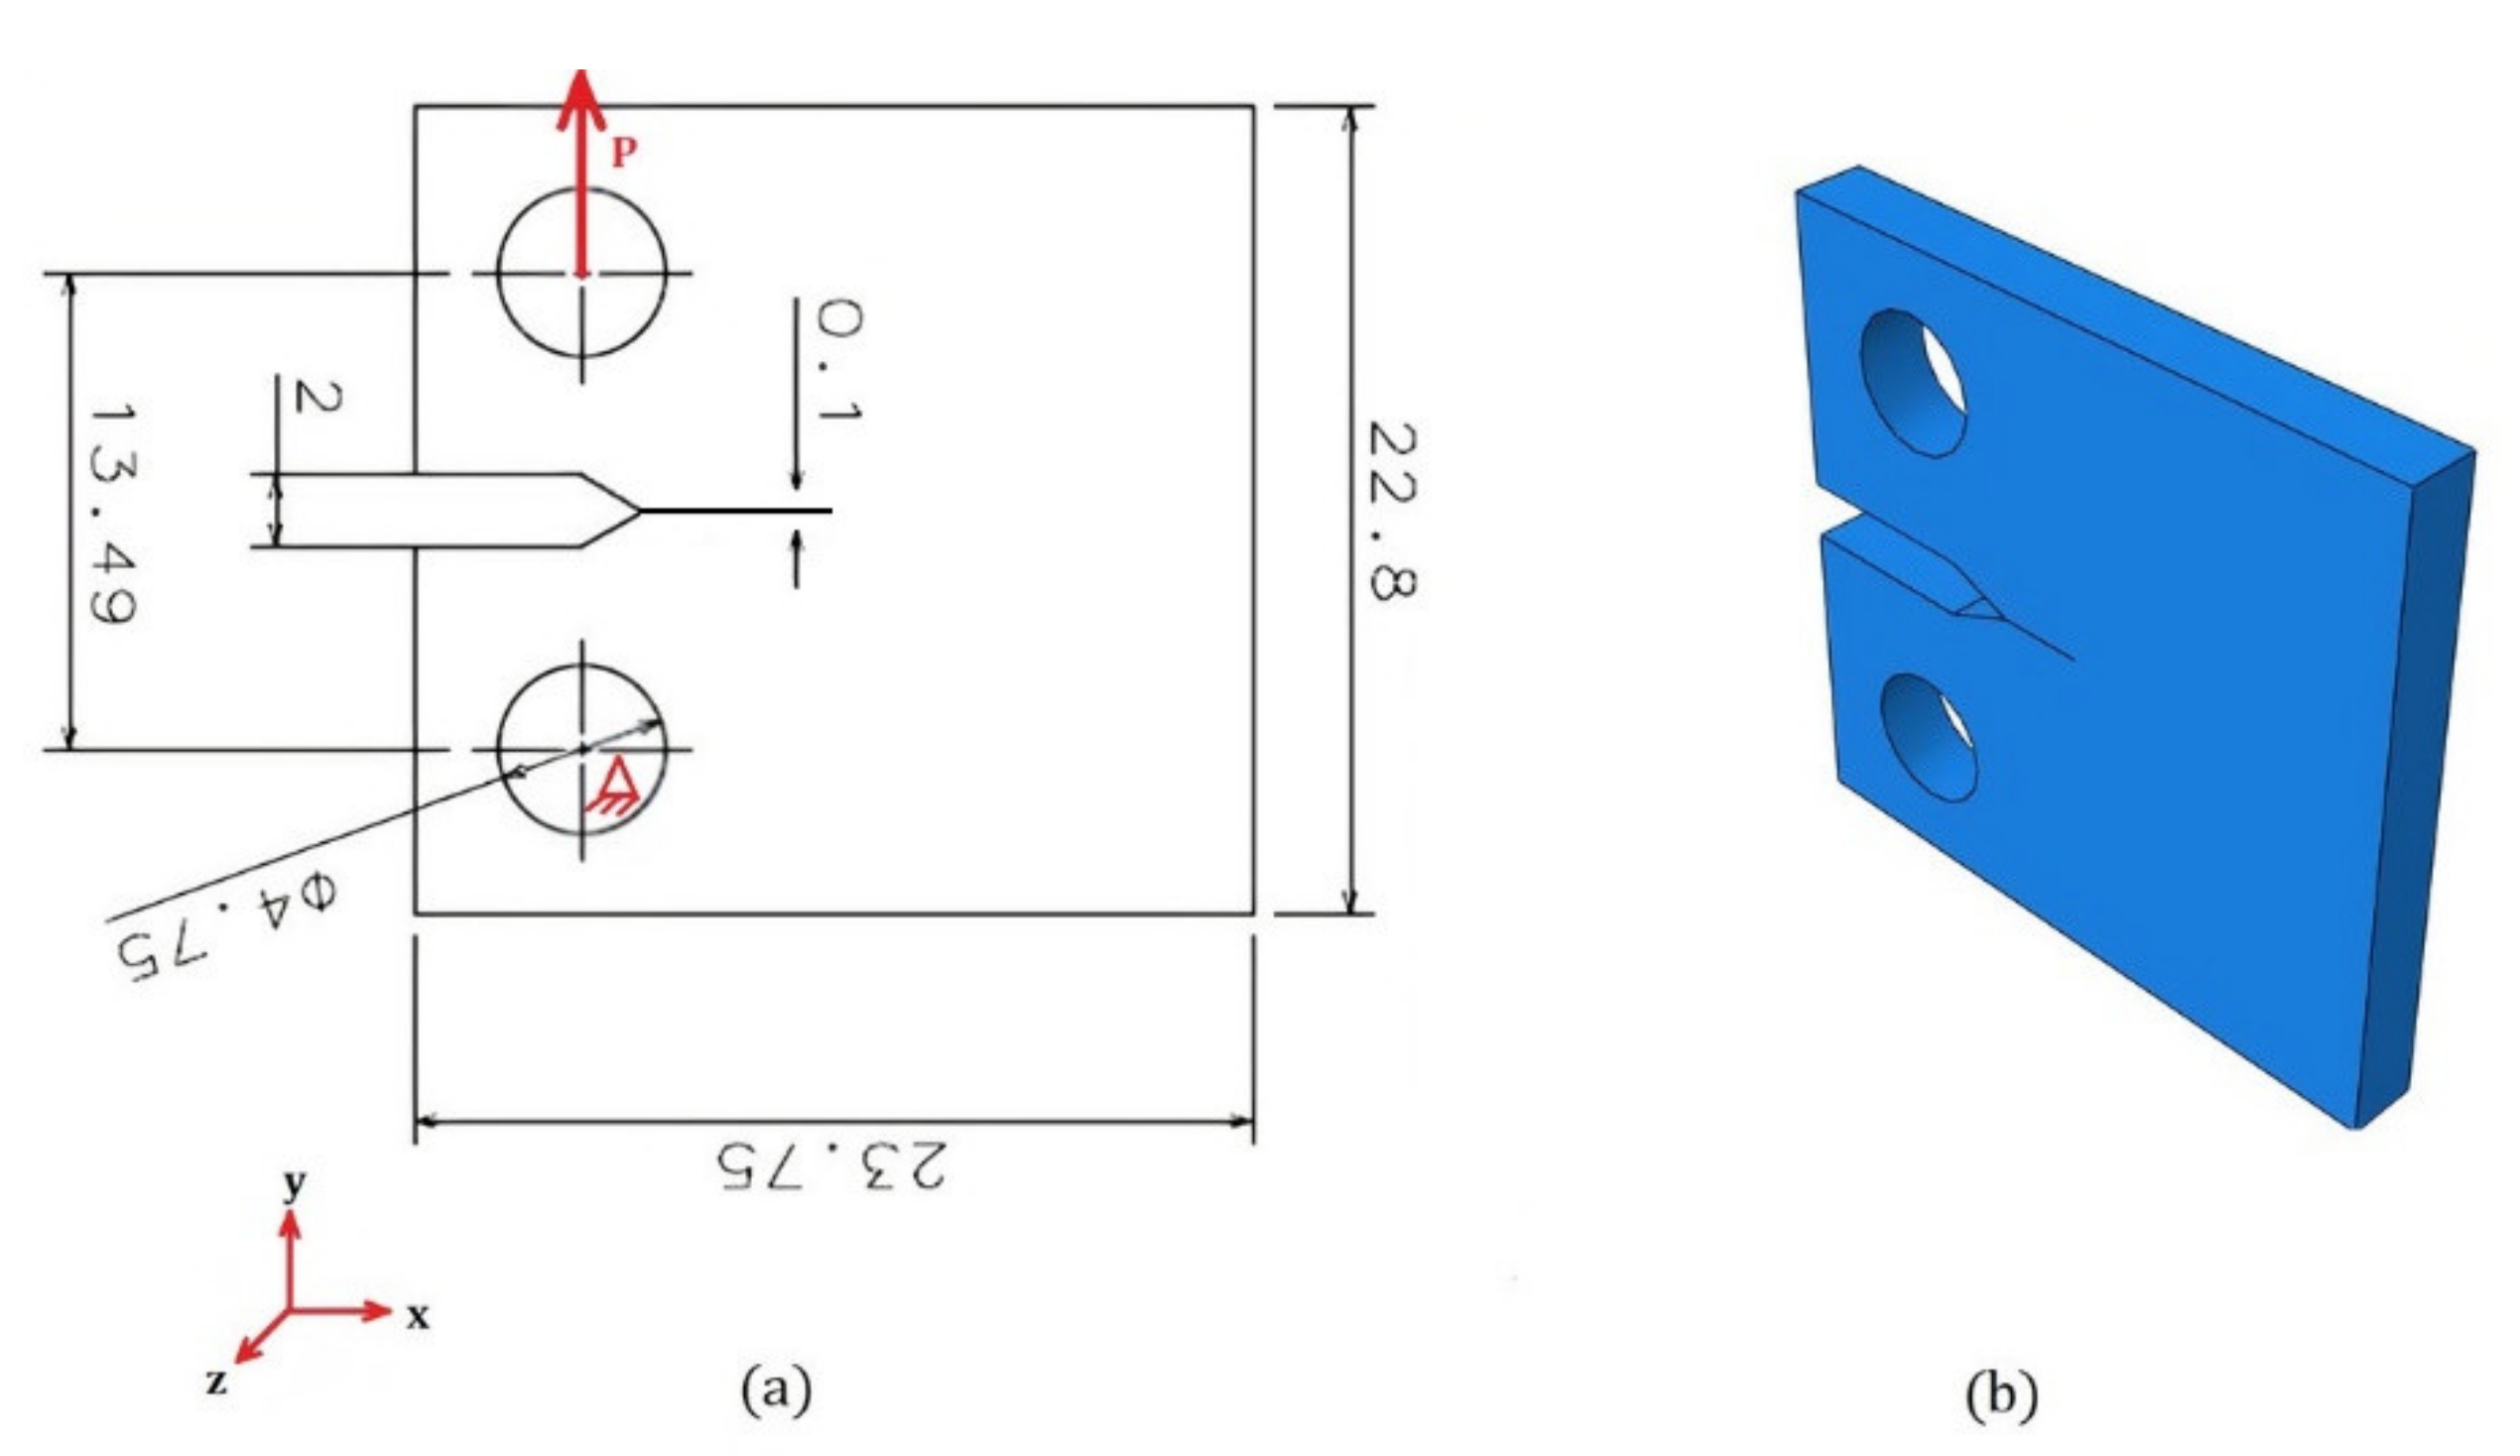
CT specimen was modelled as per ASTM standard E647 with crack length and simulated according to Mode-I loading [29]. The model was meshed using CPS4R, a four-node bilinear plane stress quadrilateral, reduced integration, and hourglass control elements in 2D model, and C3D8R, an 8-node linear brick, reduced integration, hourglass control elements were used for 3D model. Since the computational resources required for the XFEM simulation mainly depend on the mesh size, mesh sensitivity analysis was conducted to optimize the mesh size. Two reference points located at the center of holes were defined in the model, and these reference points were kinetically coupled with the corresponding holes. Displacement controlled loading in y-direction was applied to the upper reference point, while the lower reference point was kept fixed as shown by red color in Figure 4a. The load versus displacement curve is predicted using the XFEM simulations.

3.5. Center Crack and Double Edge Cracked Specimen

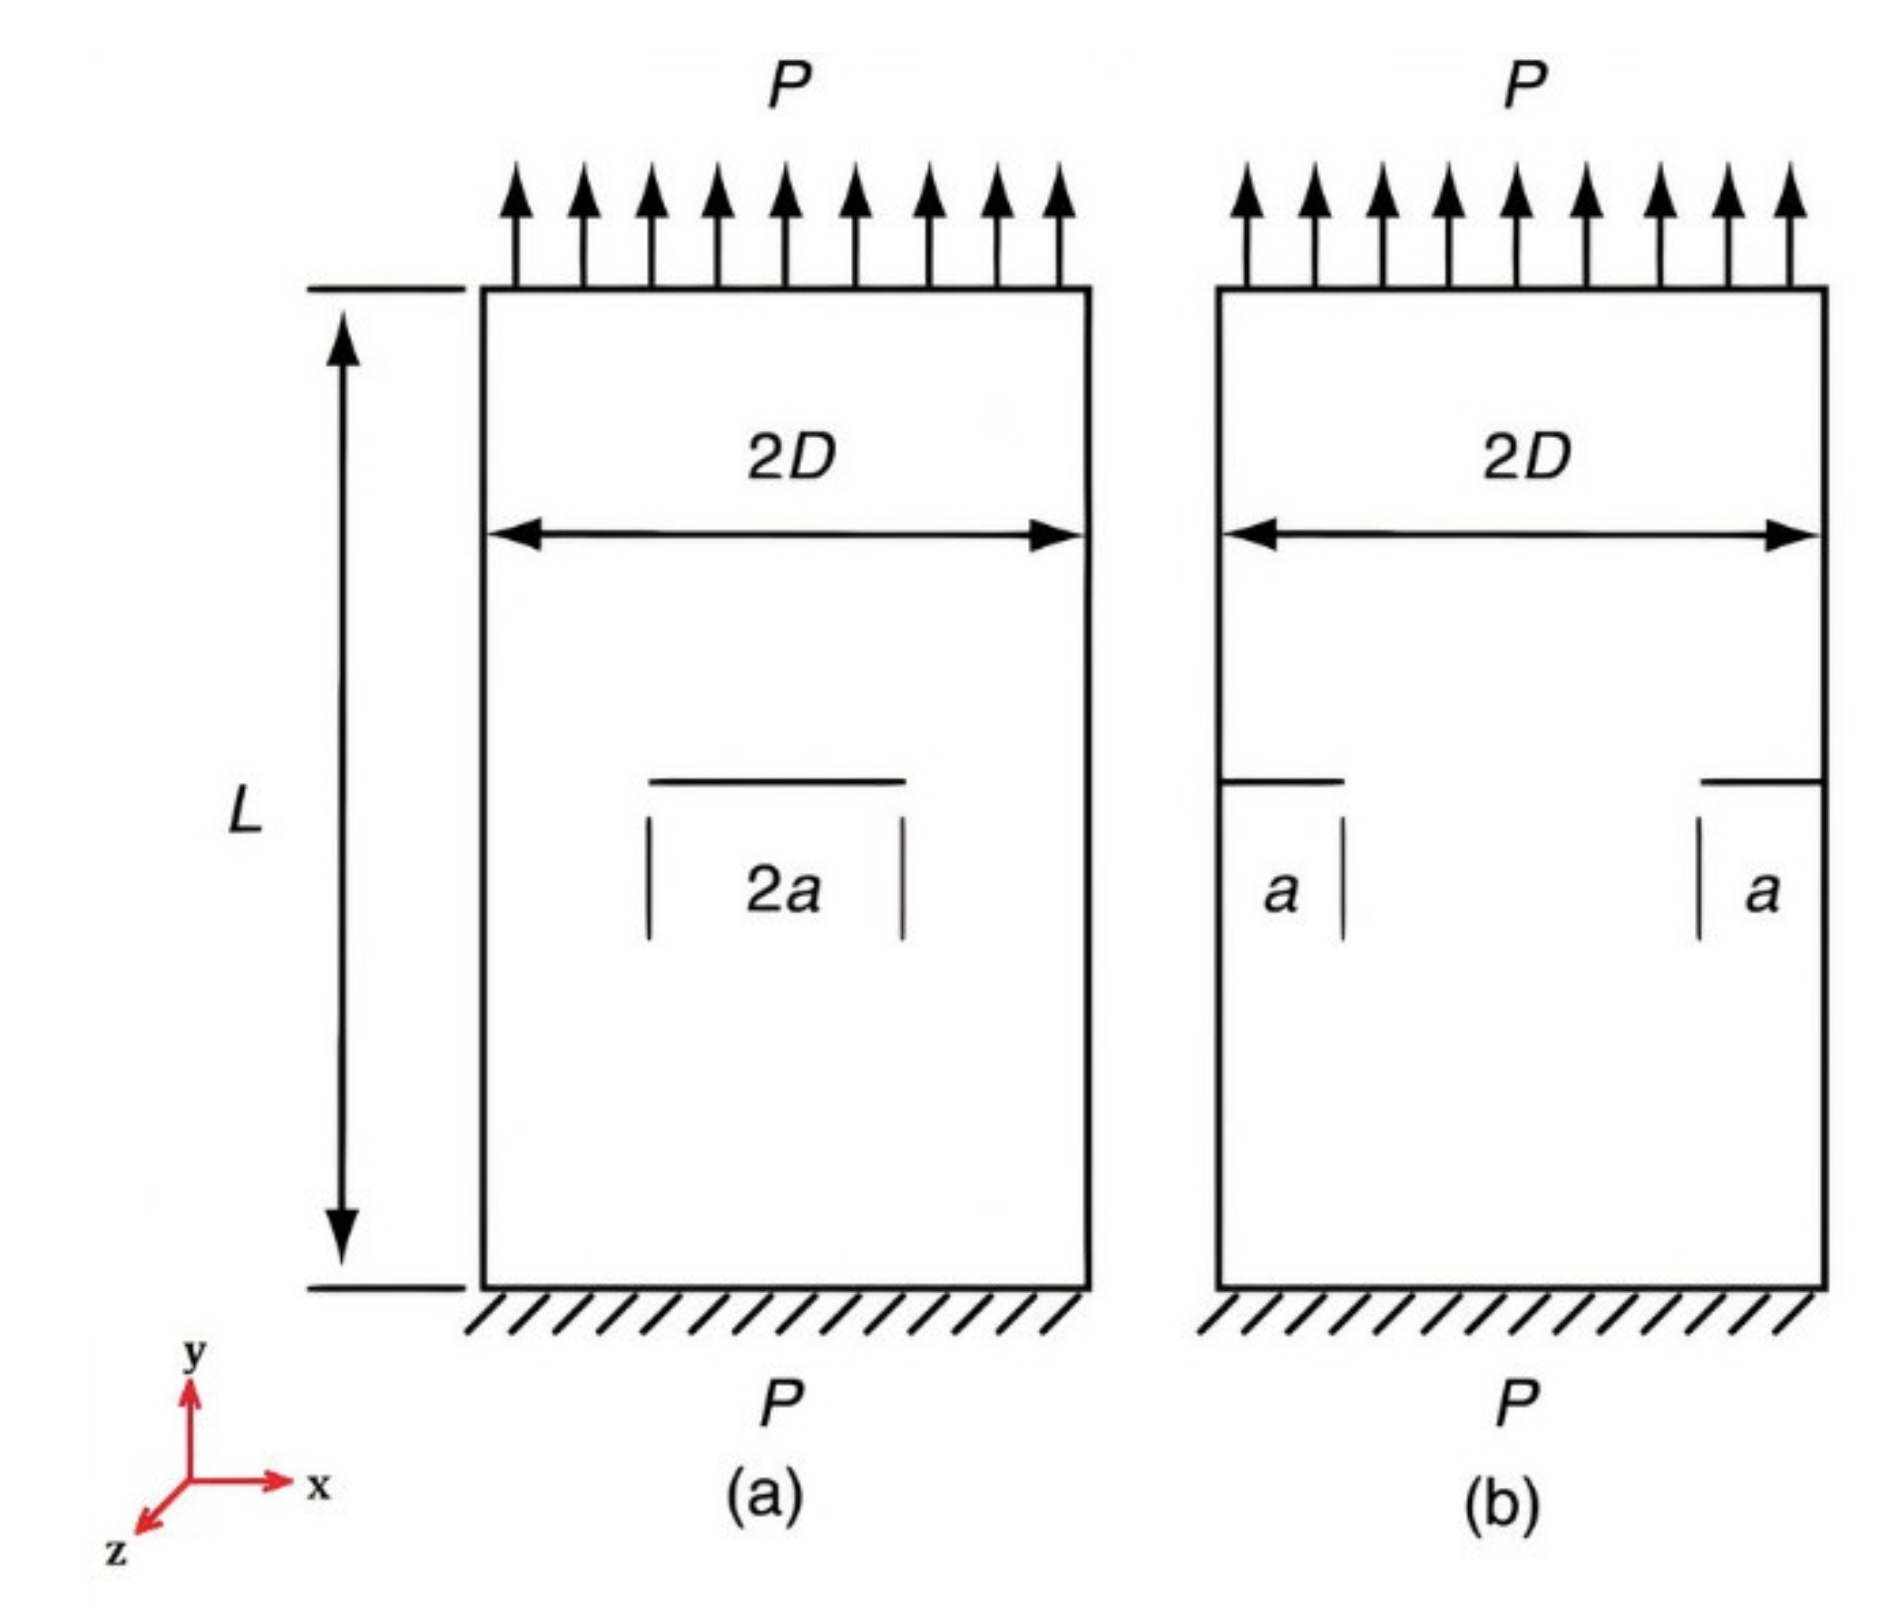
The rectangular plate of 40 mm × 20 mm dimension was modelled with a crack length of 5 mm. Displacement loading with a strain rate of 10 6 was applied to one side of the plate, and the other end was kept fixed, as shown in Figure 5. CPS4R, a four-node bilinear, quadrilateral, reduced integration, and hourglass control element, were used to mesh the model. Tensile properties and elastoplastic approach are used as inputs to predict the load versus displacement curves in different conditions, and fracture toughness is determined by load–displacement curves obtained from the simulations.

4. Results and Discussion

4.1. Tensile Test Simulation

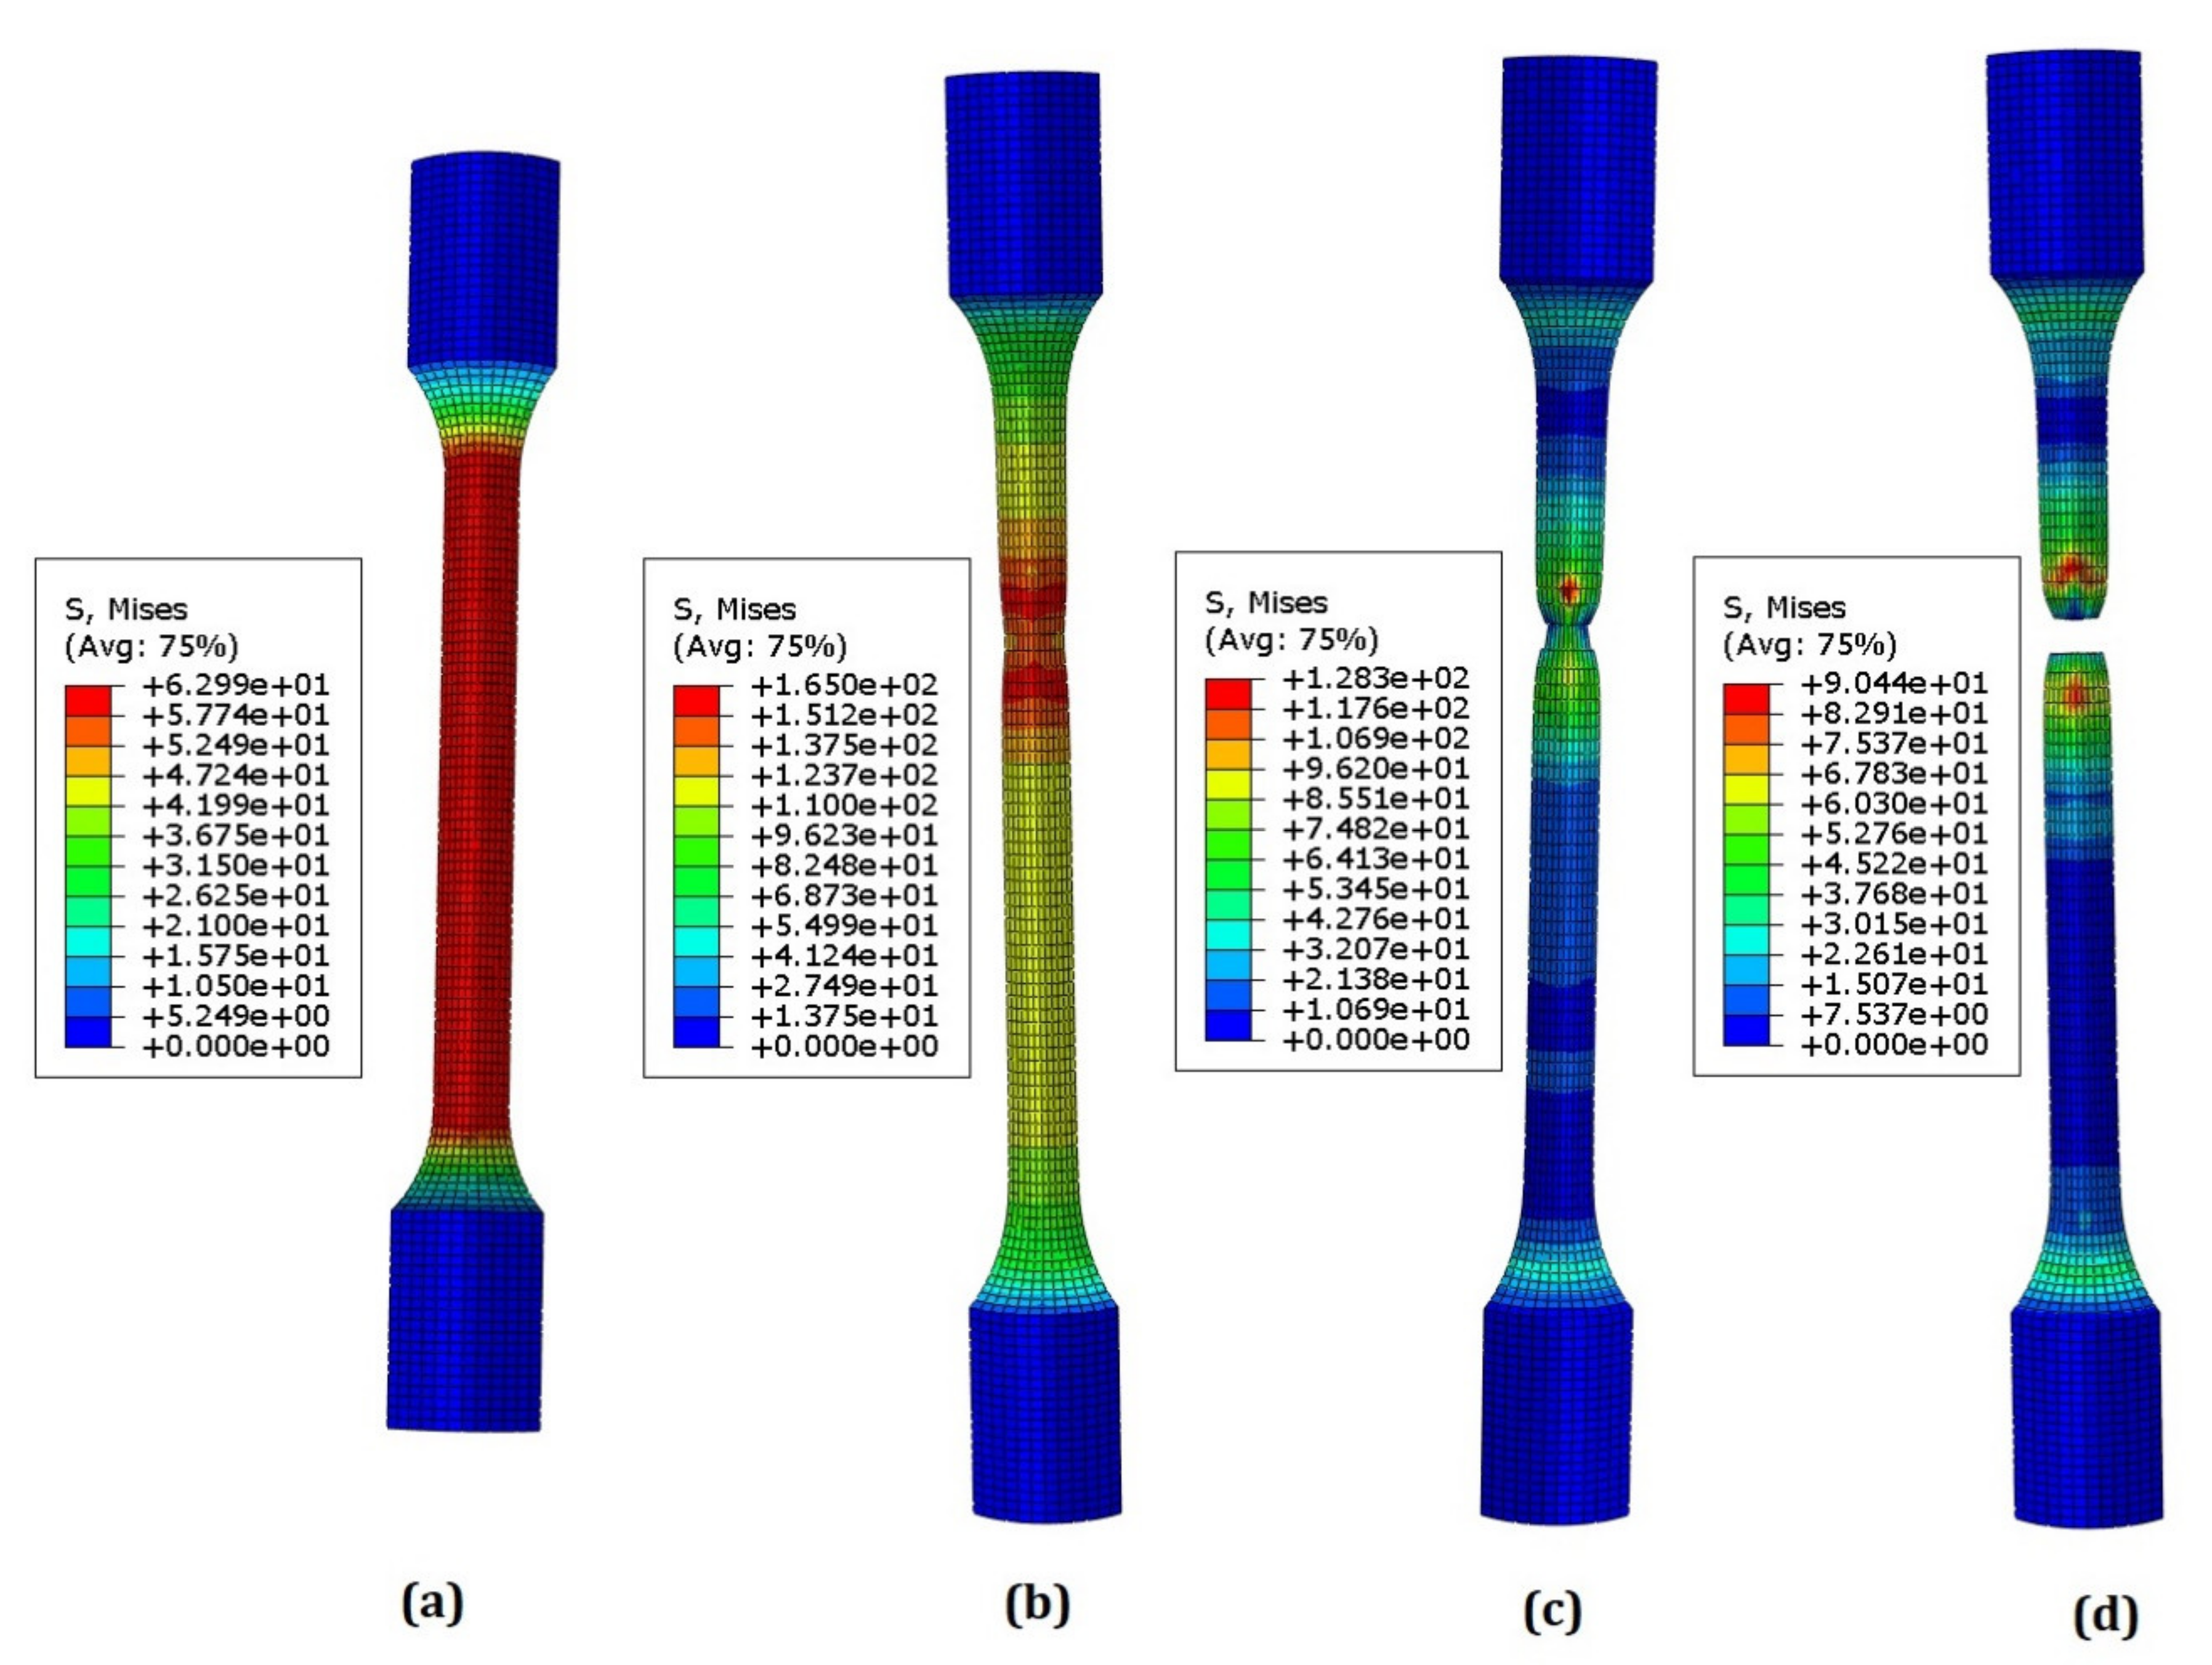
Von Mises stress distribution during the different stages of tensile simulation is shown in Figure 6. When the model is loaded, uniform stress distribution can be seen throughout the gauge length; when necking starts, the stress becomes concentrated in the necking zone. The classical Poisson’s effect can be observed in the model. Mesh sensitivity analysis was performed by varying the mesh size from 1.5 mm to 2.4 mm, but no significant change in the tensile behavior was observed as shown in Table 1.
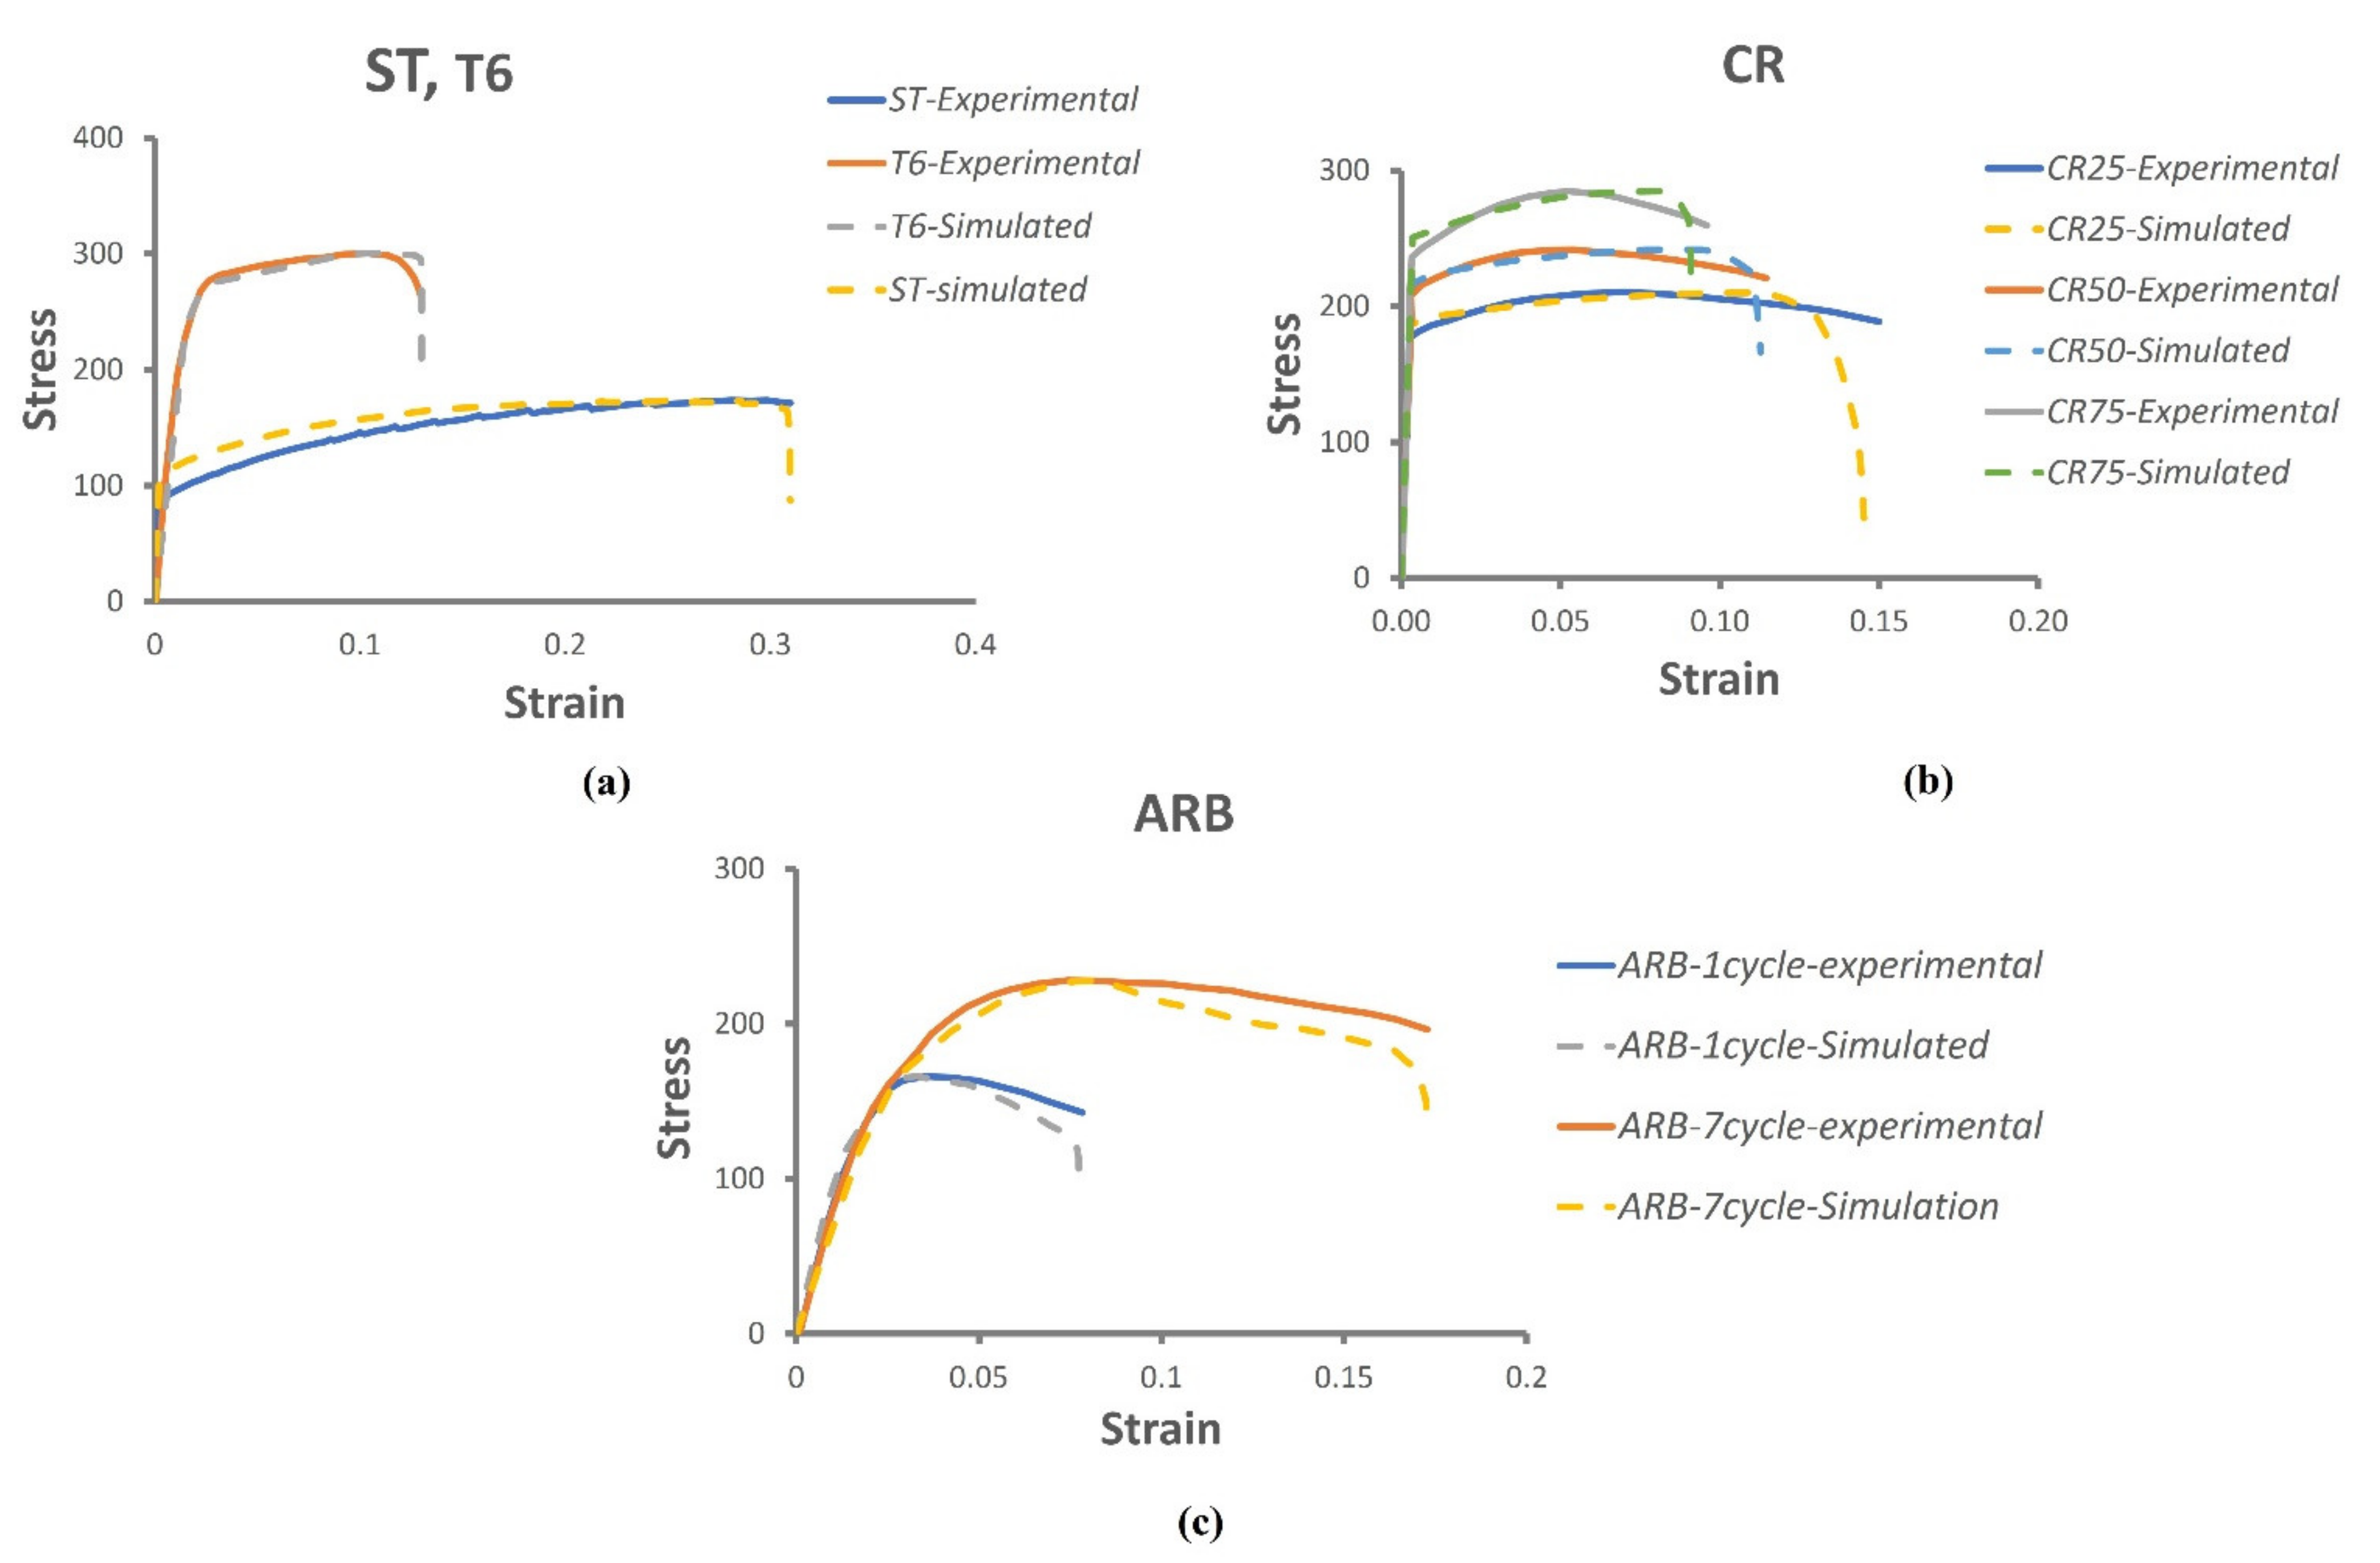
Cryorolled (CR) and Accumulative Roll bonded (ARB) specimen shows higher tensile strength and lower ductility compared to the solution treated (ST) condition. This increase in tensile strength is due to the formation of UFG structure in Al alloy [39,40,41,42]. As the deformation increases, the microstructure becomes more refined, and dislocation density increases [43,44]; so, as a direct consequence of the Hall–Petch equation, the tensile strength increases [10]. This effect can be observed in both CR and ARB samples; for example, the tensile strength of CR25 is 21.5% higher compared to the ST samples, and as thickness reduction is increased to 50%, the tensile strength increases from 210.95 MPa to 242.5 MPa, and as the thickness reduction is further increased to 75%, the tensile strength increases to 285.18 MPa, which is 64.4% higher compared to the ST samples. This increase in the tensile strength of CR is accompanied by the decrease in ductility but in ARB samples, as number of cycles increases, both tensile strength and ductility of samples increases. Tensile strength of ARB-7 cycle sample is similar to the tensile strength of CR50 sample but ductility of ARB-7 cycle (7.8) is low compared to the CR25 sample (11.5)) as shown in Table 2. CR75 samples have 19% higher tensile strength and 9.51% higher ductility compared to the ARB-7 cycles. Tensile strength and ductility of ST, T6, CR and ARB samples predicted from the simulation closely matches the results obtained from the experiments, but a tail can be observed at the end of the stress–strain curve, as shown in Figure 7. This tail is due to the fact that load will decrease drastically when displacement is increased beyond a critical value.

Flow Curve

Tensile behavior of Al 6061 in different temperatures and strain rates is shown in Figure 8 and Table 3. Tensile strength of Al6061-T6 under different strain rates shows a sharp reduction after 423 K similar to the quasi-static case with a strain rate of 1 × 10⁻³ s−1. As temperature increases from 293 K to 423 K, the tensile strength decreases by 11.5%, but when the temperature is further increased to 573 K, there is 59% reduction from 348.1 MPa to 142.7 MPa. At lower temperatures, at 423 K and 573 K, the stress–strain curve predicted by simulation using the Johnson–Cook model is comparable to the experimental results, but at higher temperatures, the simulated curve varies greatly from the experimental curve. The high-temperature sensitivity of Al 6061 alloy, especially at high temperatures, might be the cause of this behavior [30]. JC model is an empirical model that can be used to predict the tensile behavior over a range of temperature and strain rates, but it fails in a hot working process, i.e., a process involving a working temperature higher than the recrystallization temperature [30].

4.2. Three-Point Bend Test

Fracture toughness of the material is measured in terms of several parameters such as stress intensity factor (SIF) (K)) and J integral. K is a linear elastic fracture mechanics (LEFM) parameter. When the stress intensity factor attains a critical value, the crack starts propagating. The critical SIF for three-point bend test specimen is calculated according to ASTM standard E399 by [5]:
K = P S B W 1.5 f s ;     w h e r e   s = a W f s = 2.9 s 0.5 4.6 s 1.5 + 21.8 s 2.5 37.6 s 3.5 + 38.7 s 4.5
where P is the load, S is the span length, B is the specimen thickness, W is the specimen width, a is crack length, and f(s) is called as a compliance function.
J integral comes under the domain of elastic–plastic fracture mechanics, and the EPFM approach is directly linked with the crack propagation phase in the ductile material [45]. J integral can be calculated as per ASTM standard 1820-15a using the following equation [46]:
J = 2 A B b
where A is the area under load versus crack opening displacement (COD) curve, B is the specimen thickness, b is the length of the unbroken ligament ( b = W a ), and B is the width of the specimen.
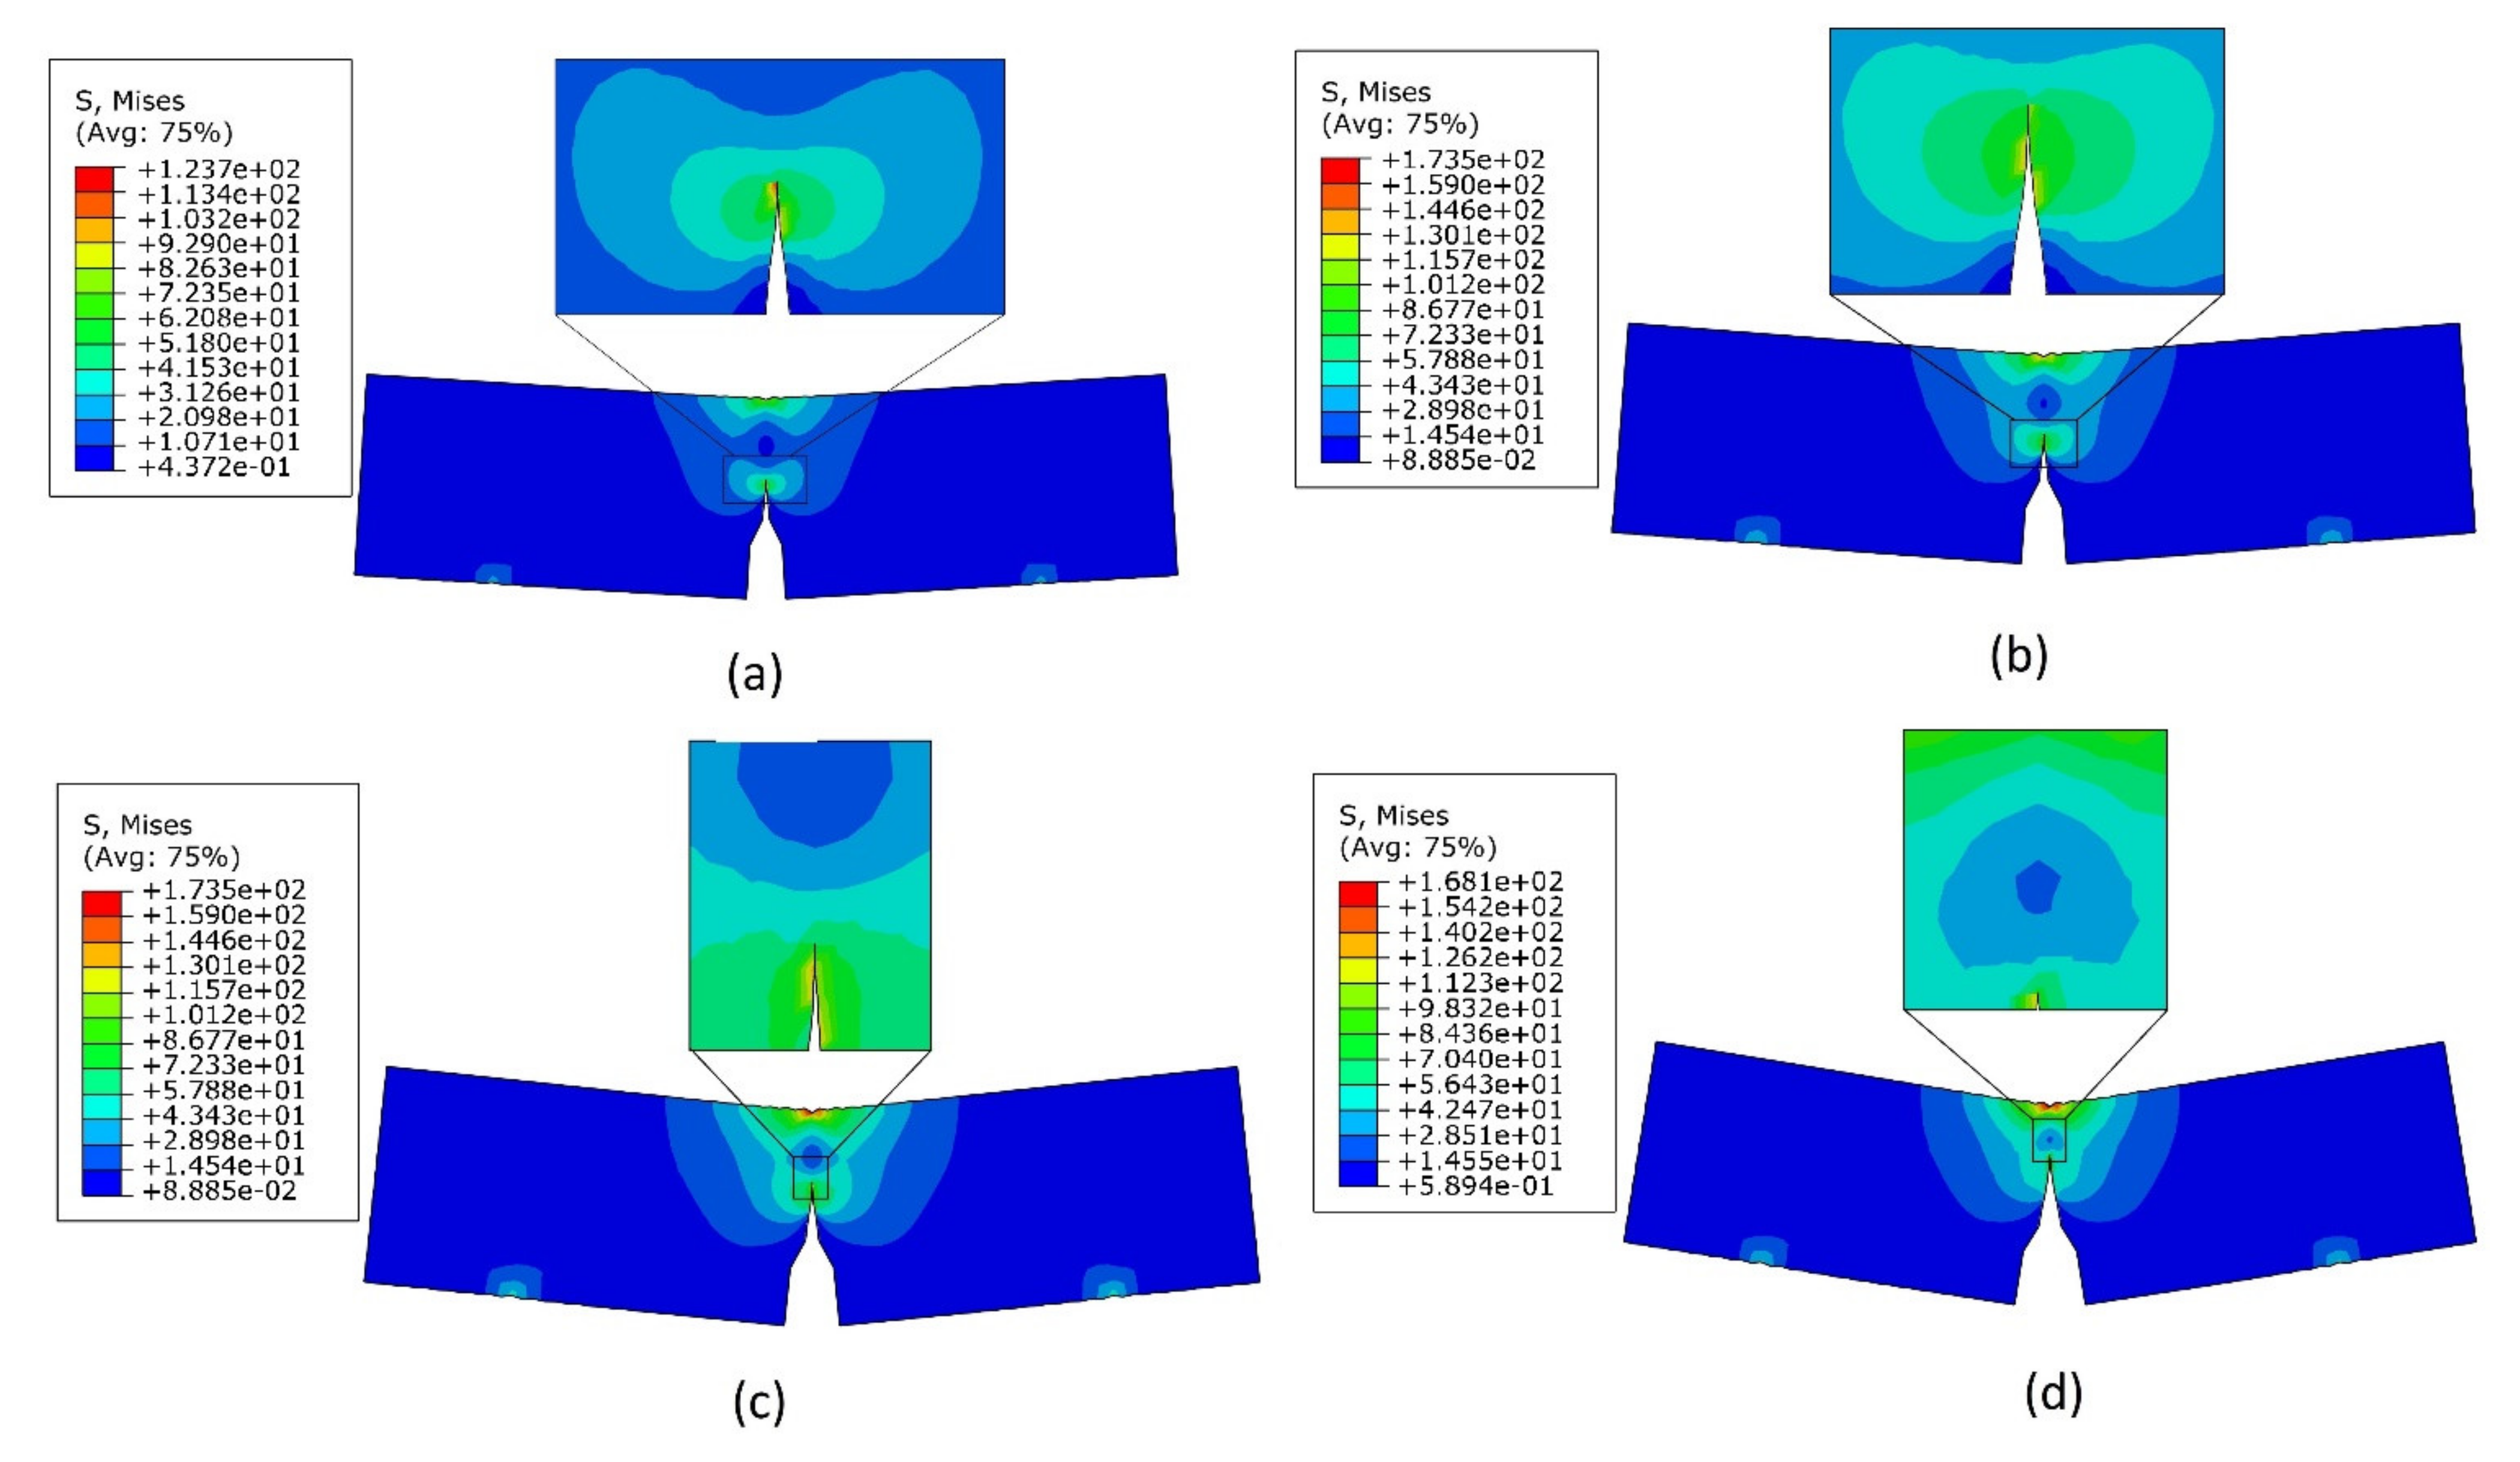
Von Mises stress distributions during different stages of crack propagation are shown in Figure 9. In this simulation, the tensile properties were used to predict fracture toughness. The load versus displacement curve obtained from the simulation varies from the curve obtained from the experiments, as shown in Figure 10. However, the fracture toughness obtained from the simulated data is in good agreement with the experimental values. Mesh sensitivity analysis was performed by refining mesh size from 1.2 mm to 0.5 mm, as shown in Table 4, and it reaffirms the mesh independent crack growth capabilities of the XFEM.
The stress intensity factor of UFG Al 6061 is higher compared to the ST. This increase is contributed to the increase in the tensile strength due to the formation of ultrafine grains and the high dislocation density of UFG samples. As deformation increases, tensile strength increases, and as a result, the critical stress intensity factor increases [10,29], but the increase in tensile strength of CR samples is accompanied by a decrease in the ductility. This decrease in the ductility is reflected in SEM fractography performed by Balakrishnan et al. [10]. In CR samples, as thickness reduction increases, the number of brittle facets also increases. The stress intensity factor is a direct indication of resistance offered by a material to the crack initiation. So, the reduction in ductility has no effect on the variation of SIF. J integral is an indicator of the crack propagation phase and depends on the material’s ductility and strength. So, as strength and ductility increase, the J integral also increases. In UFG Al alloys, strength is higher, and ductility is lower, as shown in Table 2. The combination of these two factors determines the variation of J integral; for example, the J integral of CR25 is 127.9% higher compared to the ST sample; this increase is due to the higher strength of CR25 alloy, but even though the tensile strength of CR50 is higher compared to the CR25, the J integral of CR50 is 32.5% lower compared to that of CR50. A similar trend is observed as thickness reduction is further increased to 75%, the J integral decreases from 18.5 KJ/m2 to 11.38 KJ/m2. This decrease in the J integral is attributed to the lower ductility of the CR50 compared to the CR25 condition as shown in Table 5. Plastic zone formed around the crack is a direct indicator of the resistance offered by the material for crack propagation. So, before the crack starts propagating, the size of the plastic zone determines the stress intensity factor. This effect can be observed in the CR samples; the size of the plastic zone formed before crack propagation increases as the percentage thickness reduction increases.

4.3. Compact Tension Test

Critical stress intensity factor in CT specimen is given by [10]:
K = P B . W 1 2 . f s   , s = a W   f s = 2 + s 0.886 + 4.64 s 13.32 s 2 + 14.72 s 3 5.6 s 4 1 s 3 2
where P is the load, B is thickness, W is the width of the specimen, and a is the crack length, f s is called as the compliance function.
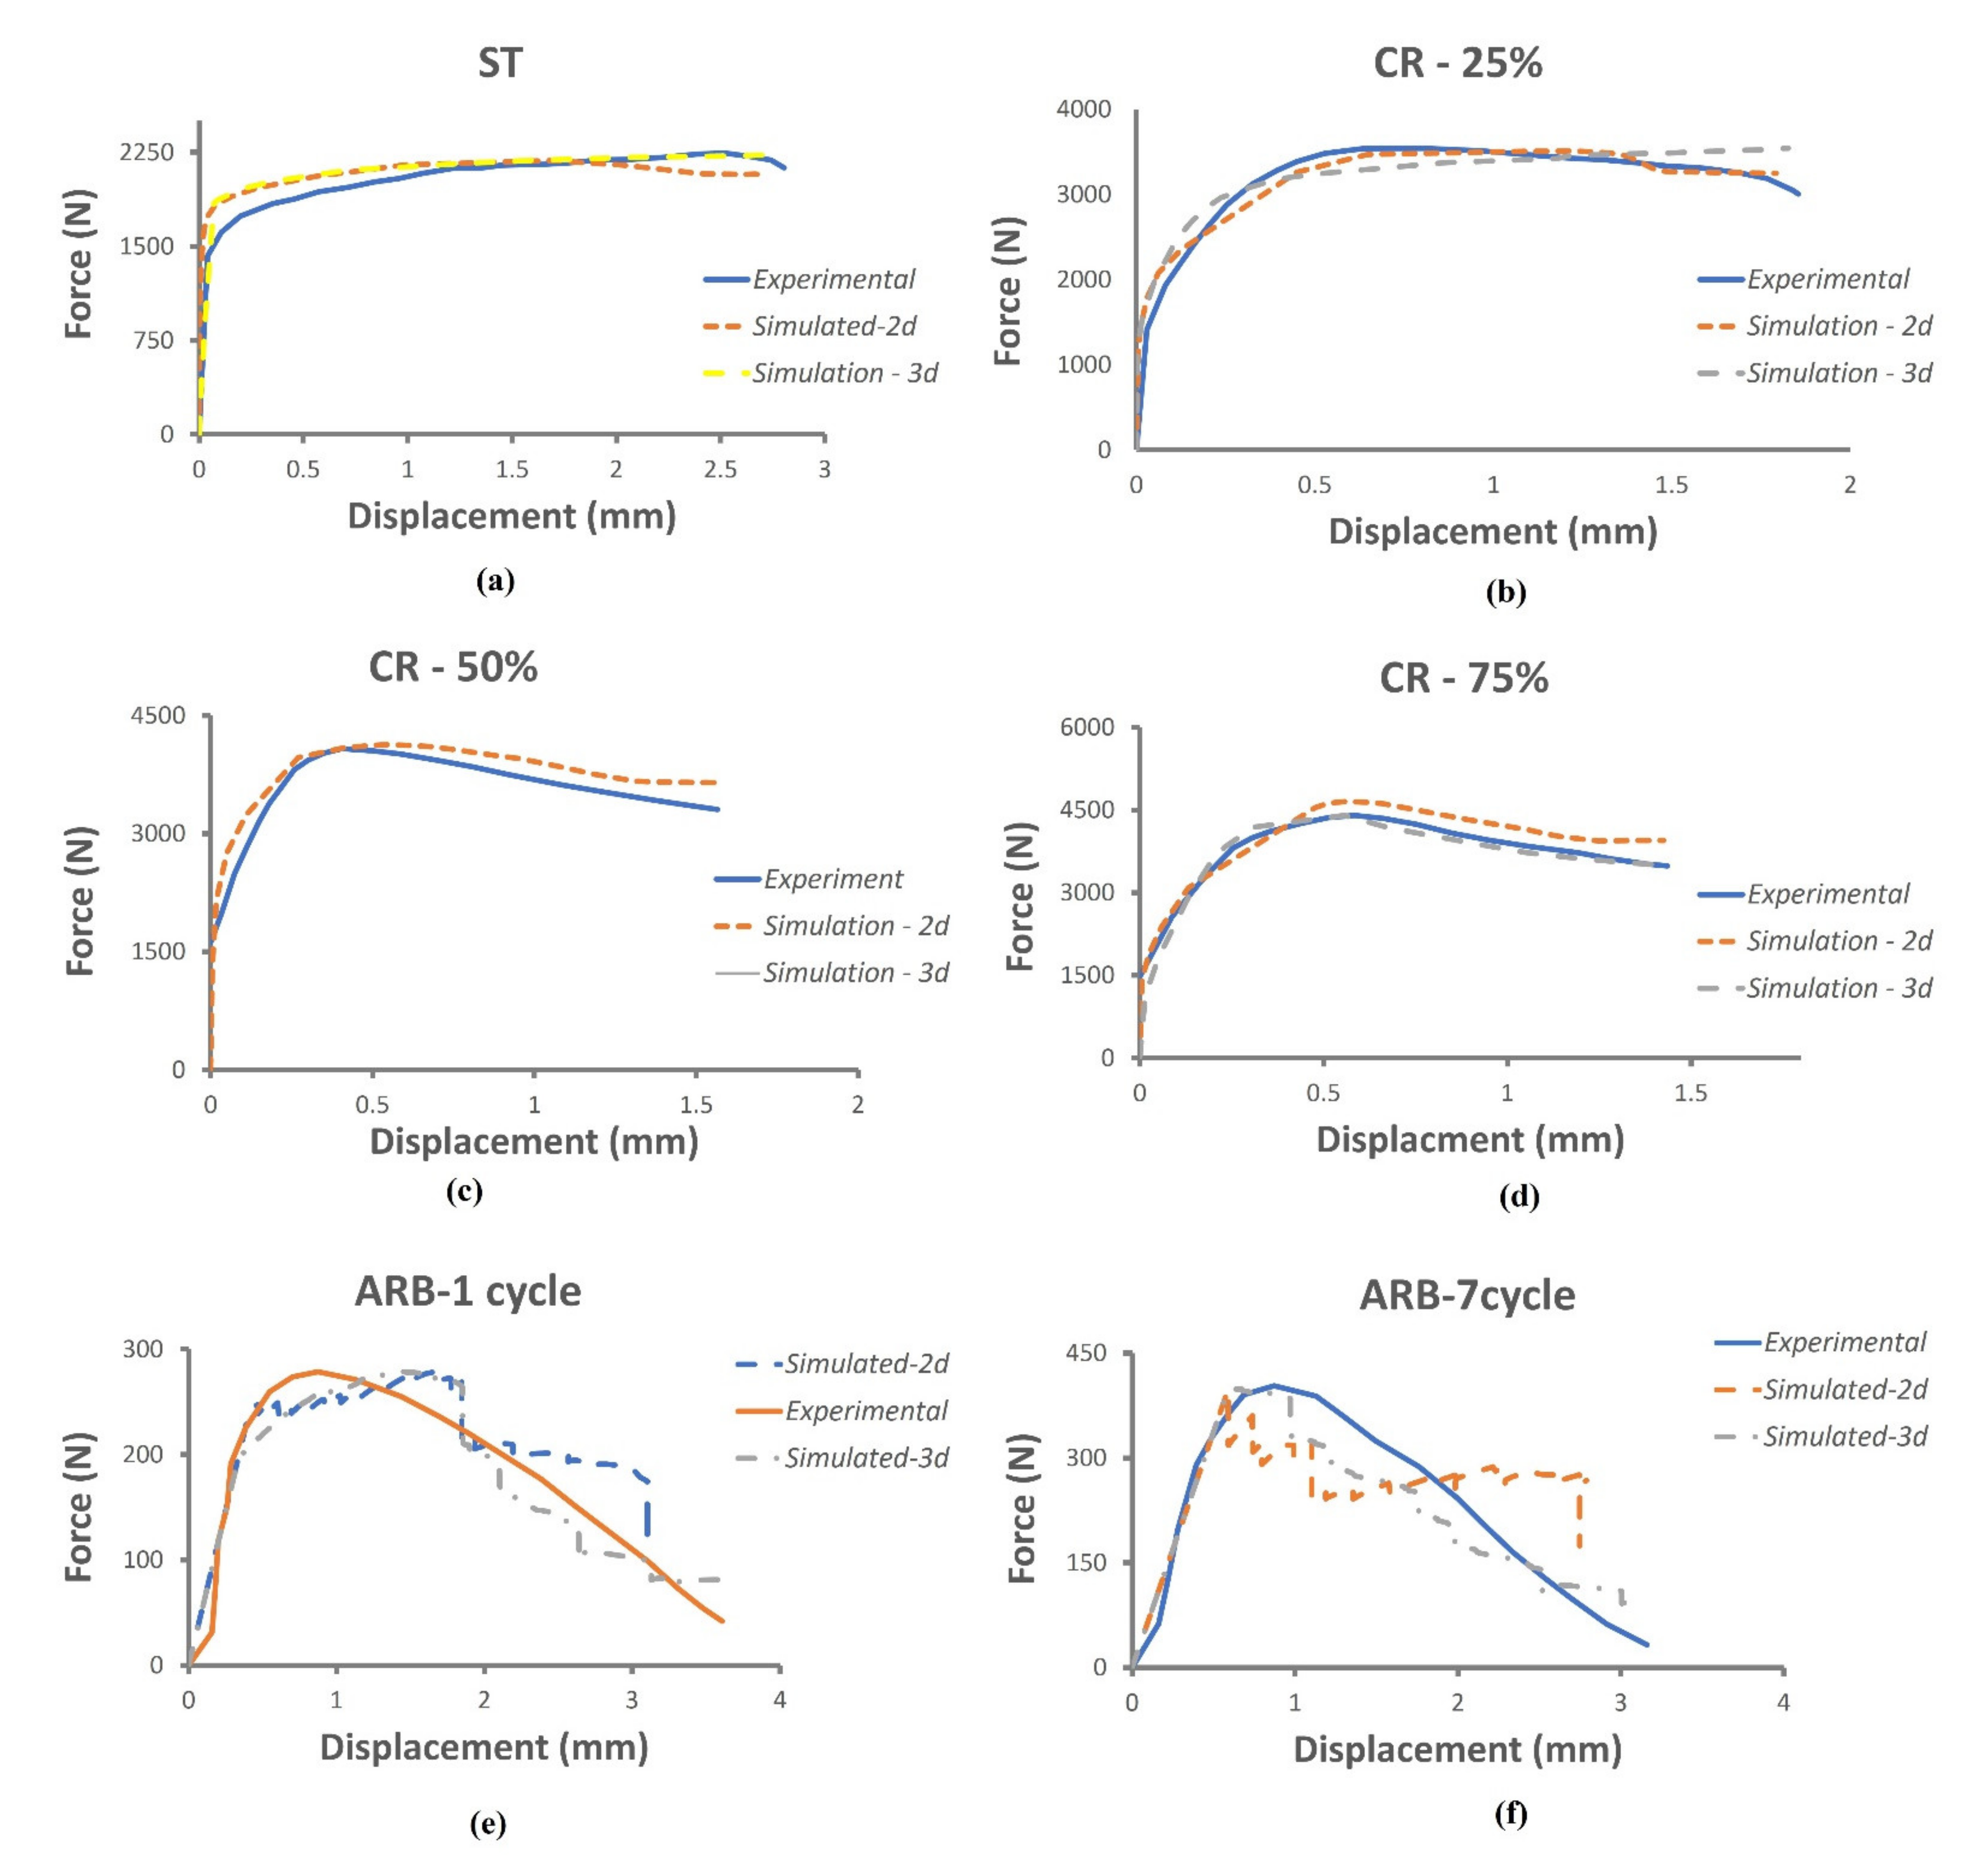
The Von Mises stress distribution during crack initiation and propagation can be seen in Figure 11. The stress distribution during loading shows typical mode I behavior, i.e., the stress distribution is symmetrical with respect to the crack axis. The results obtained from the simulation match closely with the experimental results, as shown in Figure 12. Simulation performed by using the 3D model shows consistently better results compared to the 2D simulation, but the time required for 3D simulation with the same parameters like mesh size, step size, etc., is 2–2.5 times higher compared to 2D simulation. A mesh sensitivity analysis was performed by varying mesh size from 0.5 to 1.2 mm. Variation in mesh size in 0.7–1.7 mm range does not show any significant variation in the result as observed from Table 6.
The value of fracture toughness obtained from the simulation are in good agreement with the experimental results. The trend of fracture toughness in CR samples is the same as discussed in the three-point bend test. The increase in the percentage thickness reduction in CR samples is accompanied by the increase in maximum load and K (critical stress intensity factor) value, but the decrease in ductility causes a lower J integral in CR50 compared to the CR25. In ARB samples, with an increase in the number of cycles, the strength as well as ductility increases, as shown in Figure 7c. So, as the number of cycles increases from one to seven, the stress intensity factor increases from 16.1 MPa m1/2 to 25.4 MPa m1/2, and J integral increases from 11.5 KJ/m2 to 24 KJ/m2, as shown in Table 7. SEM fractography of ARB samples was performed by Rahmatabadi et al. [29]. They observed that as the number of cycles increases, the dimple size decreases (which indicates a reduction in the grain size), and the presence of lamellar structure and brittle facets decreases.

4.4. Center Crack and Double Edge Crack under Mode-I Loading

The stress intensity factor for the center crack specimen is given by [47]:
K = σ π a sec π a W
where W is the width of the specimen, a is the crack length, and σ is the nominal stress.
The stress intensity factor of the double edge specimen is calculated using the following equation [48]:
K = σ π a . f s ,     w h e r e     s = 2 a b   f s = 1.122 0.561 s 0.205 s 2 + 0.471 s 3 0.19 s 4 1 s
where σ is the stress applied; a is the crack length. Mesh sensitivity analysis of the center cracked, and double edge cracked specimen is shown in Table 6, and the change in stress intensity factor is within 1%. Fracture toughness in the center crack and double edge crack is comparable to each other, as shown in Table 7.
Von Mises stress distribution during loading, deformation, and finally rupture is shown in center cracked, and double edge cracked specimen can be seen in Figure 13 and Figure 14. The plastic zone formed around the crack can be observed in Figure 13b,c and Figure 14b,c. The plastic zone formed is symmetrical about the crack axis, which is a characteristic feature of the stress field under mode-I loading. Table 7 shows the fracture toughness in 25%, 50%, and 75% rolled CR samples and ARB-1 cycle and ARB-7 cycle samples. Fracture toughness of the center cracked samples, and double edge cracked specimen in CR, and ARB samples are comparable to each other but compared to the fracture toughness of CT, and three-point bend samples, the fracture toughness of center cracked and double edge cracked specimen is consistently lower.

5. Conclusions

Numerical simulation of tensile behavior and fracture toughness of CR and ARB Al 6061 was performed in the current study using the XFEM technique. Experimental data on Tensile and fracture toughness were taken from the literature and our earlier work were used to validate the simulation results. The following conclusions can be made based on the present work.
  • Prediction of tensile behavior at different strain rates and temperatures was made using the JC material model. The properties at lower temperatures were comparable to the experimental properties, but at a higher temperature, 623K, the JC model failed to predict the tensile behavior.
  • Fracture toughness was calculated in different testing conditions such as the three-point bend test, compact tension specimen, center-cracked specimen, and double edge cracked specimen. UFG alloys have higher fracture toughness compared to their bulk counterparts due to their finer grain size and higher dislocation density. In CR samples, as thickness reduction increases, the stress intensity factor increases from 17.45 MPa. M1/2 in ST samples to 27.53 MPa. M1/2 in CR25, 31.64 MPa. M1/2 in CR50 and finally 34.01 MPa. M1/2 in CR75 samples, but J integral in CR samples decreases as thickness reduction decreases. This decrease is due to a decrease in ductility with an increase in thickness reduction. In ARB samples, the strength as well as ductility increases, which leads to increase in both stress intensity factor and J integral.
  • The fracture toughness obtained from XFEM simulation was in tandem with the experimental results. In the case of CT specimen, the 3D simulation produced slightly better results on fracture toughness compared to the 2D model, but the time required for the 3D simulation is approximately 2–2.5 times higher compared to the 2D simulation. The fracture toughness in center cracked, and double edge cracked specimen is lower compared to the fracture toughness in CT and three-point bend test specimen.

Author Contributions

Conceptualization, S.G. and R.J.; methodology, S.G. and R.J.; software, S.G.; validation, S.G. and R.J.; formal analysis, S.G. and R.J.; investigation, S.G.; resources, R.J.; data curation, S.G., writing—original draft preparation, S.G.; writing—review and editing, S.G. and R.J.; visualization, S.G. and R.J.; supervision, R.J.; project administration, R. Jayganthan; funding acquisition, R.J. All authors have read and agreed to the published version of the manuscript.

Funding

The authors acknowledge the funding support from Ministry of Education through Institute of Eminence (IOE).

Institutional Review Board Statement

Not applicable.

Informed Consent Statement

Not applicable.

Data Availability Statement

The current results are a part of ongoing research work and associated data are confidential at current stage.

Conflicts of Interest

The authors declare no conflict of interest.

Nomenclature

UFGUltra fine grained
XFEMExtended finite element method
SPDSevere plastic deformation
ARBAccumulative roll bonding
CRCryorolling
CR25Cryorolling with 25% thickness reduction
CR50Cryorolling with 50% thickness reduction
CR75Cryorolling with 75% thickness reduction
JCJohnson Cook material model
PUPartition of unity

References

  1. Robson, J.D.; Engler, O.; Sigli, C.; Deschamps, A.; Poole, W.J. Advances in Microstructural Understanding of Wrought Aluminum Alloys. Metall. Mater. Trans. A 2020, 51, 4377–4389. [Google Scholar] [CrossRef]
  2. Engler, O.; Hirsch, J. Recrystallization textures and plastic anisotropy in Al-Mg-Si sheet alloys. Mater. Sci. Forum 1996, 217—222, 479–486. [Google Scholar] [CrossRef]
  3. Aryshenskii, E.V.; Guk, S.V.; Galiev, E.E.; Drits, A.M.; Kavalla, R. Possibility of application of a 1565ch alloy in the automotive industry. Russ. Metall. 2018, 2018, 995–1001. [Google Scholar] [CrossRef]
  4. Hellier, A.K.; Chaphalkar, P.P.; Prusty, B.G. Fracture toughness measurement for aluminium 6061-T6 using notched round bars. In Proceedings of the 9th Australasian Congress on Applied Mechanics 2017 (ACAM 9), Sydney, Australia, 27–29 November 2017. [Google Scholar]
  5. Gairola, S.; Joshi, A.; Gangil, B.; Rawat, P.; Verma, R. Correlation of Tensile Properties and Fracture Toughness with Microstructural Features for Al–Li 8090 Alloy Processed by Cryorolling and Post-rolled Annealing. Trans. Indian Inst. Met. 2019, 72, 1743–1755. [Google Scholar] [CrossRef]
  6. Kapil, R.; Joshi, A.; Jayaganthan, R.; Gairola, S.; Verma, R. Improvement of fracture toughness of ultra fine grained Al-Li 8090 alloy processed through multi axial forging. Mater. Res. Express 2019, 6, 085064. [Google Scholar] [CrossRef]
  7. Verma, R.; Jayaganthan, R.; Nath, S.K.; Srinivasan, A. Effect of multiaxial forging followed by hot rolling on non-basal planes and its influence on tensile and fracture toughness behaviour of Mg–4Zn–4Gd alloy. Mater. Sci. Eng. A 2020, 774, 138890. [Google Scholar] [CrossRef]
  8. Roy, S.; Singh, D.S.; Suwas, S.; Kumar, S.; Chattopadhyay, K. Microstructure and texture evolution during accumulative roll bonding of aluminium alloy AA5086. Mater. Sci. Eng. A 2011, 528, 8469–8478. [Google Scholar] [CrossRef] [Green Version]
  9. Singh, G.; Verma, R.; Narayanan, K.I.; Arora, U.K.; Jayaganthan, R. Effect of swaging feed rate and annealing phenomena on tensile, fracture toughness and microstructural evolution of Zr-4 alloy. Mater. Sci. Eng. A 2021, 831, 142219. [Google Scholar] [CrossRef]
  10. Balakrishnan, V.; Roshan, P.; Goel, S.; Jayaganthan, R.; Singh, I.V. Experimental and XFEM Simulation of Tensile and Fracture Behavior of Al 6061 Alloy Processed by Severe Plastic Deformation. Metallogr. Microstruct. Anal. 2017, 6, 55–72. [Google Scholar] [CrossRef]
  11. Toth, L.S.; Gu, C. Ultrafine-grain metals by severe plastic deformation. Mater. Charact. 2014, 92, 1–14. [Google Scholar] [CrossRef]
  12. Singh, S.P.; Bhattacharya, S.; Sehgal, D.K. Evaluation of high temperature mechanical strength of Cr-Mo grade steel through small punch test technique. Eng. Fail. Anal. 2014, 39, 207–220. [Google Scholar] [CrossRef]
  13. Zhong, S.; Oyadiji, S.O. Crack detection in simply supported beams without baseline modal parameters by stationary wavelet transform. Mech. Syst. Signal Process. 2007, 21, 1853–1884. [Google Scholar] [CrossRef]
  14. Patil, D.P.; Maiti, S.K. Detection of multiple cracks using frequency measurements. Eng. Fract. Mech. 2003, 70, 1553–1572. [Google Scholar] [CrossRef]
  15. Vadiraj, A.; Kamaraj, M. Characterization of fretting fatigue damage of PVD TiN coated biomedical titanium alloys. Surf. Coat. Technol. 2006, 200, 4538–4542. [Google Scholar] [CrossRef]
  16. Vadiraj, A.; Kamaraj, M. Damage characterization of unmodified and surface modified medical grade titanium alloys under fretting fatigue condition. Mater. Sci. Eng. A 2006, 416, 253–260. [Google Scholar] [CrossRef]
  17. Samant, S.S.; Pandey, V.B.; Singh, I.V.; Singh, R.N. Effect of double austenitization treatment on fatigue crack growth and high cycle fatigue behavior of modified 9Cr–1Mo steel. Mater. Sci. Eng. A 2020, 788, 139495. [Google Scholar] [CrossRef]
  18. Samant, S.S.; Singh, I.V.; Singh, R.N. Effect of Tempering and Rolling on Fatigue Crack Growth Behavior of Modified 9Cr-1Mo Steel. J. Mater. Eng. Perform. 2018, 27, 5898–5912. [Google Scholar] [CrossRef]
  19. Goel, S.; Nikhil, K.; Devsari, F.; Jayaganthan, Y.; Singh, I.V.; Srivastava, D.; Dey, G.K.; Saibaba, N. Evaluating Fracture Toughness of Rolled Zircaloy-2 at Different Temperatures Using XFEM. J. Mater. Eng. Perform. 2016, 25, 4046–4058. [Google Scholar] [CrossRef]
  20. Belytschko, T.; Black, T. Elastic crack growth in finite elements with minimal remeshing. Int. J. Numer. Methods Eng. 1999, 45, 601–620. [Google Scholar] [CrossRef]
  21. Moës, N.; Dolbow, J.; Belytschko, T. A finite element method for crack growth without remeshing. Int. J. Numer. Methods Eng. 1999, 46, 131–150. [Google Scholar] [CrossRef]
  22. Sharma, K.; Bui, T.Q.; Zhang, C.; Bhargava, R.R. Analysis of a subinterface crack in piezoelectric bimaterials with the extended finite element method. Eng. Fract. Mech. 2013, 104, 114–139. [Google Scholar] [CrossRef]
  23. Liu, P.; Yu, T.; Bui, T.Q.; Zhang, C.; Xu, Y.; Lim, C.W. Transient thermal shock fracture analysis of functionally graded piezoelectric materials by the extended finite element method. Int. J. Solids Struct. 2014, 51, 2167–2182. [Google Scholar] [CrossRef] [Green Version]
  24. Nguyen-Vinh, H.; Abu Bakar, I.A.; Abdulrazzak Msekh, M.; Song, J.-H. Extended finite element method for dynamic fracture of piezo-electric materials. Eng. Fract. Mech. 2012, 92, 19–31. [Google Scholar] [CrossRef]
  25. Jafarlou, D.M.; Zalnezhad, E.; Hassan, M.A.; Ezazi, M.A. Severe plastic deformation of tubular AA 6061 via equal channel angular pressing. Mater. Des. 2016, 90, 1124–1135. [Google Scholar] [CrossRef]
  26. Tan, E.; Kibar, A.A.; Gür, C.H. Mechanical and microstructural characterization of 6061 aluminum alloy strips severely deformed by Dissimilar Channel Angular Pressing. Mater. Charact. 2011, 62, 391–397. [Google Scholar] [CrossRef]
  27. Moreno-Valle, E.C.; Sabirov, I.; Perez-Prado, M.T.; Murashkin, M.Y.; Bobruk, E.V.; Valiev, R.Z. Effect of the grain refinement via severe plastic deformation on strength properties and deformation behavior of an Al6061 alloy at room and cryogenic temperatures. Mater. Lett. 2011, 65, 2917–2919. [Google Scholar] [CrossRef]
  28. Rao, P.N.; Jayaganthan, R. Effects of warm rolling and ageing after cryogenic rolling on mechanical properties and microstructure of Al 6061 alloy. Mater. Des. 2012, 39, 226–233. [Google Scholar] [CrossRef]
  29. Rahmatabadi, D.; Hashemi, R.; Mohammadi, B.; Shojaee, T. Experimental evaluation of the plane stress fracture toughness for ultra-fine grained aluminum specimens prepared by accumulative roll bonding process. Mater. Sci. Eng. A 2017, 708, 301–310. [Google Scholar] [CrossRef]
  30. Fan, X.; Suo, T.; Sun, Q.; Wang, T. Dynamic mechanical behavior of 6061 al alloy at elevated temperatures and different strain rates. Acta Mech. Solida Sin. 2013, 26, 111–120. [Google Scholar] [CrossRef]
  31. Qian, Y.; Zhao, J. Fracture toughness calculation method amendment of the dissimilar steel welded joint based on 3D XFEM. Metals 2019, 9, 509. [Google Scholar] [CrossRef] [Green Version]
  32. Kumar, S.; Singh, I.V.; Mishra, B.K. Numerical investigation of stable crack growth in ductile materials using XFEM. Procedia Eng. 2013, 64, 652–660. [Google Scholar] [CrossRef] [Green Version]
  33. Das, P.; Singh, I.V.; Jayaganthan, R. Crack growth simulation of bulk and ultrafine grained 7075 Al alloy by XFEM. Int. J. Mater. Prod. Technol. 2012, 44, 252–276. [Google Scholar] [CrossRef]
  34. Abaqus/CAE 6. 14 User’s Manual; Dassault Systémes Inc.: Johnston, RI, USA, 2014; Volume IV, pp. 1–6. [Google Scholar]
  35. Džugan, J.; Španiel, M.; Prantl, A.; Konopík, P.; Růžička, J.; Kuželka, J. Identification of ductile damage parameters for pressure vessel steel. Nucl. Eng. Des. 2018, 328, 372–380. [Google Scholar] [CrossRef]
  36. Murugesan, M.; Jung, D.W. Johnson cook material and failure model parameters estimation of AISI-1045 medium carbon steel for metal forming applications. Materials 2019, 12, 609. [Google Scholar] [CrossRef] [PubMed] [Green Version]
  37. ASTM. E8 ASTM E8/E8M Standard Test Methods for Tension Testing of Metallic Materials 1; ASTM: West Conshohocken, PA, USA, 2010; pp. 1–27. [Google Scholar] [CrossRef]
  38. Sobolev, A.V.; Radchenko, M.V. Use of Johnson–Cook plasticity model for numerical simulations of the SNF shipping cask drop tests. Nucl. Energy Technol. 2016, 2, 272–276. [Google Scholar] [CrossRef]
  39. Rao, P.N.; Singh, D.; Jayaganthan, R. Effect of annealing on microstructure and mechanical properties of Al 6061 alloy processed by cryorolling. Mater. Sci. Technol. 2013, 29, 76–82. [Google Scholar] [CrossRef]
  40. Rao, P.N.; Kaurwar, A.; Singh, D.; Jayaganthan, R. Enhancement in Strength and Ductility of Al-Mg-Si Alloy by Cryorolling followed by Warm Rolling. Procedia Eng. 2014, 75, 123–128. [Google Scholar] [CrossRef] [Green Version]
  41. Panigrahi, S.K.; Devanand, D.; Jayaganthan, R. A comparative study on mechanical properties of ultrafine-grained Al 6061 and Al 6063 alloys processed by cryorolling. Trans. Indian Inst. Met. 2008, 61, 159–163. [Google Scholar] [CrossRef]
  42. Satish, D.R.; Feyissa, F.; Kumar, D.R. Cryorolling and warm forming of AA6061 aluminum alloy sheets. Mater. Manuf. Process. 2017, 32, 1345–1352. [Google Scholar] [CrossRef]
  43. Pathak, M.K.; Joshi, A.; Mer, K.K.S.; Jayaganthan, R. Mechanical Properties and Microstructural Evolution of Bulk UFG Al 2014 Alloy Processed Through Cryorolling and Warm Rolling. Acta Metall. Sin. 2019, 32, 845–856. [Google Scholar] [CrossRef] [Green Version]
  44. Joshi, A.; Yogesha, K.K.; Jayaganthan, R. Influence of cryorolling and followed by annealing on high cycle fatigue behavior of ultrafine grained Al 2014 alloy. Mater. Charact. 2017, 127, 253–271. [Google Scholar] [CrossRef]
  45. Farahmand, B. Fracture Mechanics of Metals, Composites, Welds, and Bolted Joints; Springer: Boston, MA, USA, 2001. [Google Scholar]
  46. Joshi, A.; Yogesha, K.K.; Kumar, N.; Jayaganthan, R. Influence of Annealing on Microstructural Evolution, Precipitation Sequence, and Fracture Toughness of Cryorolled Al–Cu–Si Alloy. Metallogr. Microstruct. Anal. 2016, 5, 540–556. [Google Scholar] [CrossRef]
  47. Tong-Yi, Z.; Lee, S. Stress intensity factors of interfacial cracks. Eng. Fract. Mech. 1993, 44, 539–544. [Google Scholar] [CrossRef]
  48. Chen, X.; Chen, Z.; Zhao, Y. Analysis of sheet fracture failure based on XFEM. Open Mech. Eng. J. 2015, 9, 887–891. [Google Scholar] [CrossRef]
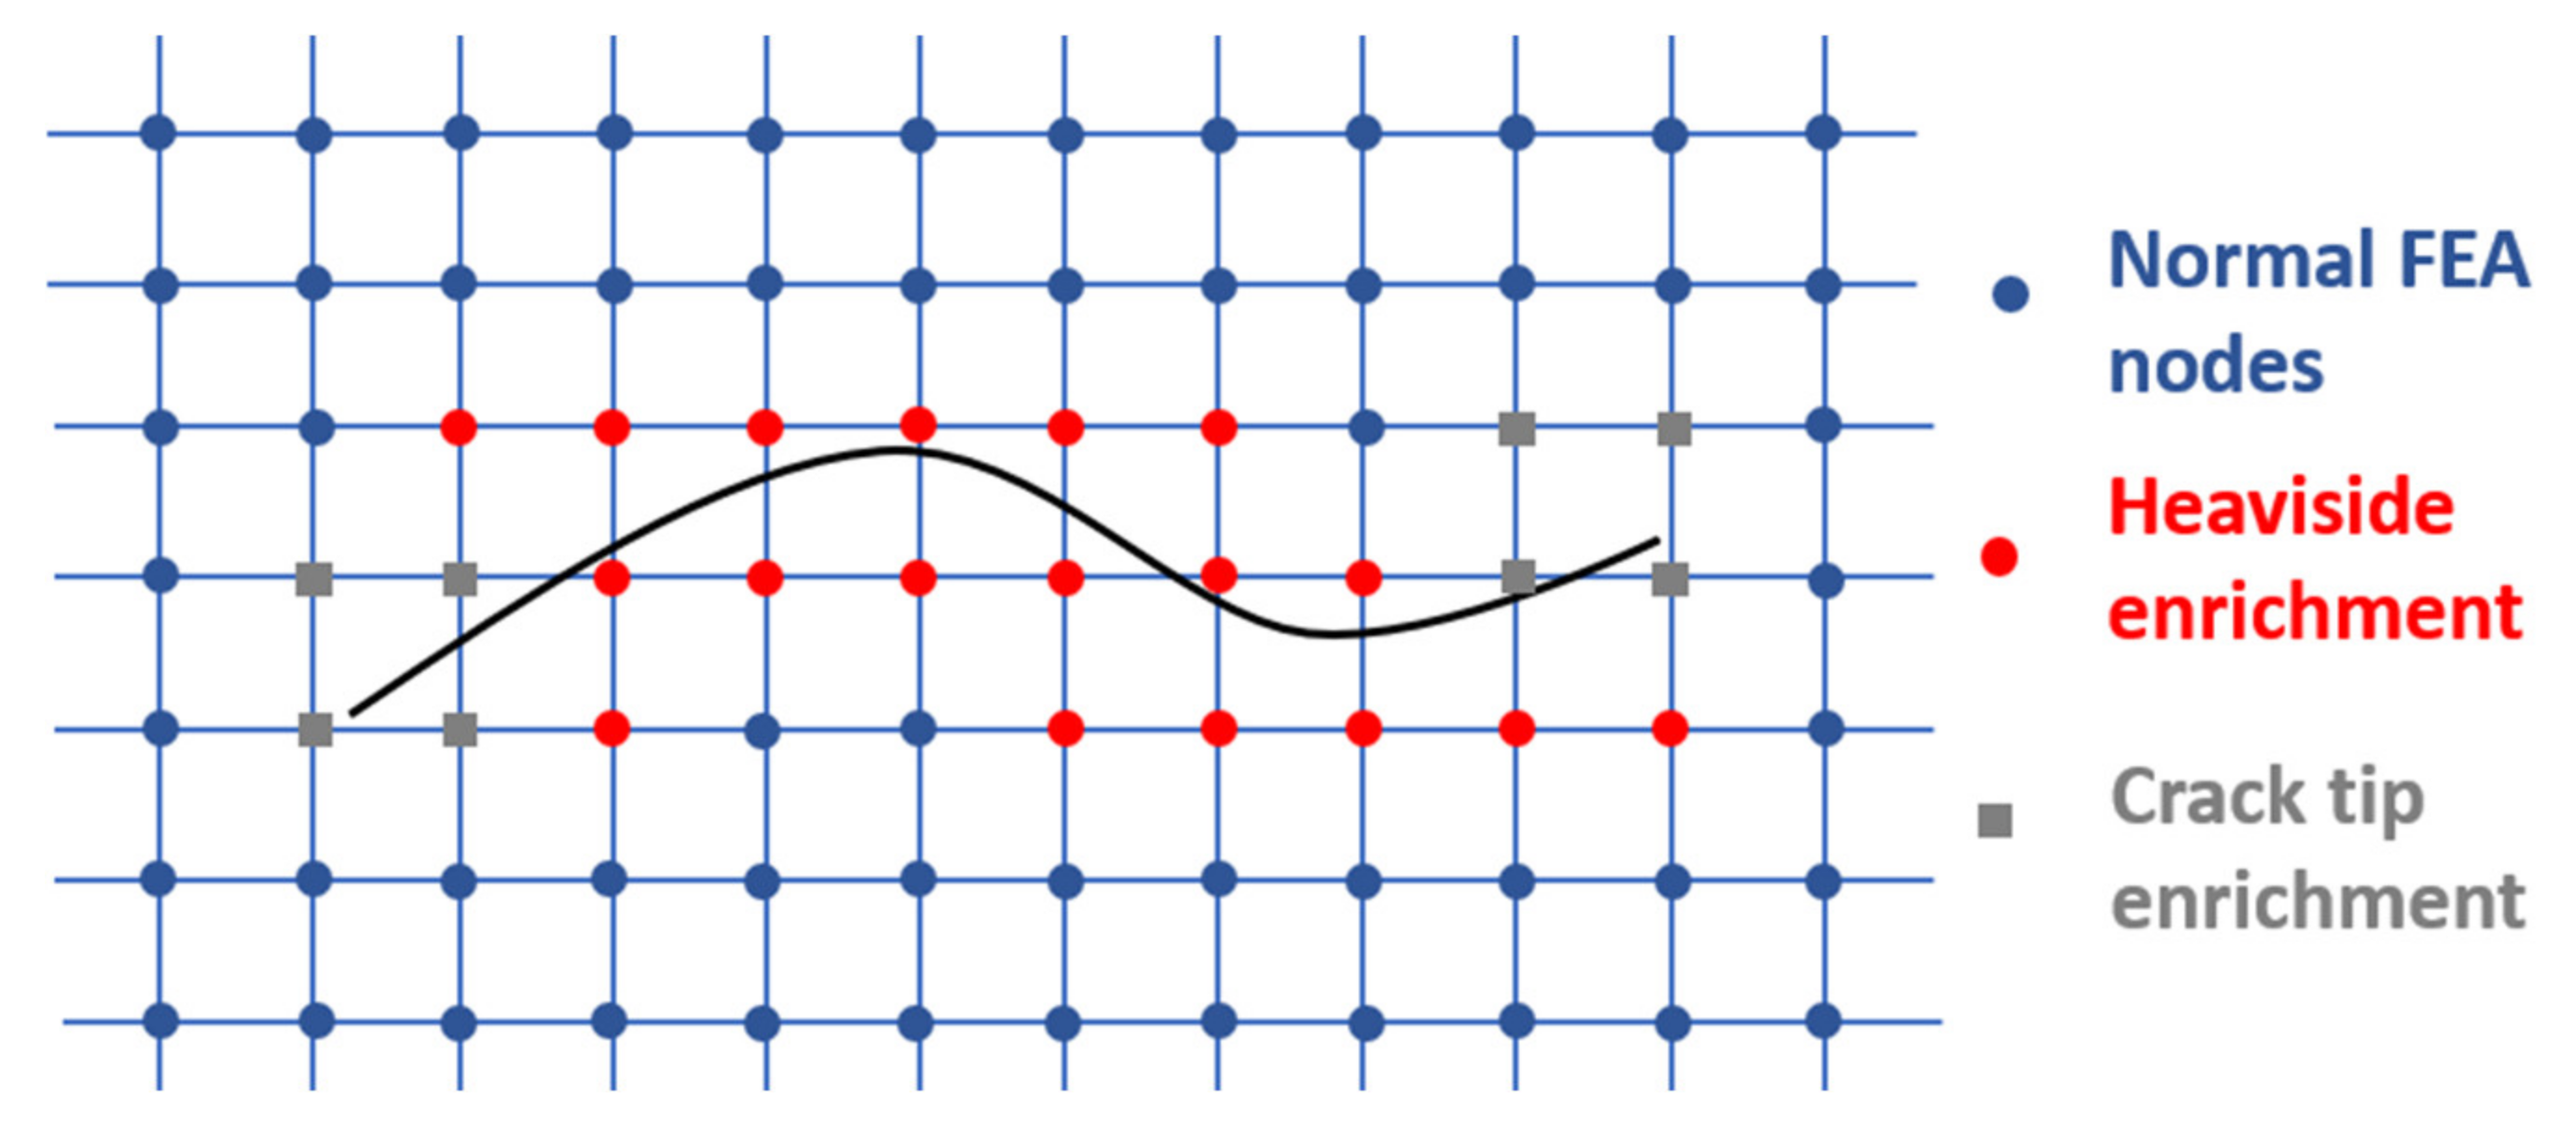
Figure 1. Enriched nodes in XFEM.
Metals 11 01761 g001
Figure 2. (a) Specifications of tensile specimen (all units are in mm) (b) tensile model for simulation.
Metals 11 01761 g002
Figure 3. (a) Specification of three-point bend test specimen (all units are in mm) (b) model of three-point bend test specimen.
Metals 11 01761 g003
Figure 4. (a) Specification of the CT specimen (all units are in mm) (b) 3d model of CT specimen.
Metals 11 01761 g004
Figure 5. Specification of (a) center cracked specimen (b) double edge cracked specimen.
Metals 11 01761 g005
Figure 6. Von Mises stress distribution at (a) loading (b), (c) necking (d) rupture for ST condition.
Metals 11 01761 g006
Figure 7. Stress–strain curve of Al6061 in (a) ST, T6 (b) CR (c) ARB condition.
Metals 11 01761 g007
Figure 8. Experimental and simulated stress–strain curve of Al 6061-T6 at strain rate of (a) 1 × 10⁻³ s−1 (b) 5 × 10² s−1 (c) 5 × 10³ s−1 (d) 1 × 10⁴ s−1.
Metals 11 01761 g008
Figure 9. Von Mises stress distribution at (a) loading (b) crack initiation (c), (d) crack propagation.
Metals 11 01761 g009
Figure 10. Comparison of experimental and simulated results in a three-point bend test specimen (a) ST (b) CR-25 (c) CR-50 (d) CR-75.
Metals 11 01761 g010
Figure 11. Von Mises stress distribution at (a) loading (b) crack initiation (c), (d) crack propagation.
Metals 11 01761 g011
Figure 12. Comparison of experimental and simulated results in (a) ST (b) CR-25 (c) CR-50 (d) CR-75 (e) ARB-1 cycle (f) ARB-7 cycle.
Metals 11 01761 g012
Figure 13. Von Mises stress distribution in center cracked specimen during (a) loading (b) crack initiation (c) crack propagation (d) fracture.
Metals 11 01761 g013
Figure 14. Von Mises stress distribution in double edge cracked specimen in (a) loading (b) crack initiation (c) crack propagation (d) fracture.
Metals 11 01761 g014
Table 1. Mesh sensitivity analysis of tensile simulation in ST condition.
Element Size (mm)Number of ElementsUTS (MPa)
0.58580174.15
0.64692174.15
0.82176174.16
1.01404174.23
1.2690174.29
1.5360174.38
Table 2. Comparison of experimental and simulated tensile properties.
Processing ConditionUTS% Elongation
ExperimentalSimulatedAbsolute Error (%)ExperimentalSimulatedAbsolute Error (%)
ST173 [28] 1740.630.931.21
T6300 [28]2980.713.012.81.5
CR25211 [10]21101514.72
CR50242 [10]242011.511.22.6
CR75285 [10]2860.48.628.42.6
ARB-1 cycle153 [29]1540.73.53.50
ARB-7 cycle231 [29]2300.47.87.45.1
Table 3. Simulated and experimental tensile properties at different temperature and strain.
ConditionTemperatureUTS (MPa)% Strain at the Fracture
Experimental [30] SimulatedAbsolute Error (%)Experimental [30] SimulatedAbsolute Error (%)
1 × 10⁻³ s−1293K3943881.534.839.212.6
423K3483685.728.436.528.5
573K143307114.737.740.98.5
673K63229263.540.441.32.2
5 × 10² s−1293K33937510.66.610.254.5
423K3323556.91010.11
573K2772832.210.410.51
673K13721859.17.81028.2
5 × 10³ s−1293K4013980.730.128.74.7
423K3633753.32828.20.7
573K2902851.718.328.254.1
673K14323362.914.62998.6
1 × 10⁴ s−1293K4184210.733.332.81.5
423K3793954.232.232.10.3
573K289292132.432.10.9
673K19023322.627.635.127.2
Table 4. Mesh sensitivity analysis of three-point bend test simulation for ST sample.
Element Size (mm)Number of ElementsStress Intensity Factor
(MPa m1/2)
0.5768012.93
0.7236512.93
0.9108812.80
1.096012.78
1.251912.6
Table 5. Comparison of fracture toughness of 3PB specimen in experimental and simulated condition.
Processing ConditionStress Intensity Factor (MPa m1/2)J Integral (KJ/m2)
Experimental [10]SimulatedAbsolute Error (%)Experimental [10]SimulatedAbsolute Error (%)
ST13.6 12.95.112 12.97.5
CR2529.5 291.727.4 25.56.9
CR5029.9 28.54.718.5 16.311.9
CR7533.7 32.53.611.4 11.21.8
Table 6. Mesh sensitivity analysis of CT, double edge cracked, and center cracked specimen in ST condition.
Stress Intensity Factor (MPa m1/2)
Element SizeCTCenter CrackedDouble Edge Cracked
2d3d
0.518.2117.8315.3215.10
0.718.2117.8315.3215.10
0.918.2217.715.3315.11
1.018.3517.6715.415.18
1.218.417.515.4215.2
Table 7. Comparison of experimental and simulated results in CT, Center cracked, and double edge cracked specimen.
Processing ConditionFracture Toughness
Parameters
ExperimentalCTCenter CrackedDouble Edge Cracked
2d 3d
Abs. Error (%) Abs. Error (%)
STStress intensity factor (MPa m1/2)17.5 [10] 18.2417.81.715.315.1
J integral (KJ/m2)13.214.16.813.52.310.911.4
CR25Stress intensity factor (MPa m1/2)27.5 [10]28.53.6281.826.125.8
J integral (KJ/m2)25.325.10.825.20.421.521
CR50Stress intensity factor (MPa m1/2)31.6 [10]30.82.531.80.629.529
J integral (KJ/m2)2120.14.320.8118.318.9
CR75Stress intensity factor (MPa m1/2)34 [10]34.782.333.90.331.931.5
J integral (KJ/m2)15.214.45.314.82.612.211.8
ARB- 1 cycleStress intensity factor (MPa m1/2)16.1 [38]15.72.516.31.215.115.4
J integral (KJ/m2)11.510.86.111.93.59.810.2
ARB- 7 cycleStress intensity factor (MPa m1/2)25.4 [38]24.82.425.20.822.722.1
J integral (KJ/m2)2423.23.323.42.520.921.4
Publisher’s Note: MDPI stays neutral with regard to jurisdictional claims in published maps and institutional affiliations.