Article

Structural Change of TiAl Alloy under Uniaxial Tension and Compression in the <001> Direction: A Molecular Dynamics Study

1
Department of Mechanical Engineering, Universitas Muhammadiyah Ponorogo, Budi Utomo St. No. 10, Ponorogo 63471, Indonesia
2
Department of Physics, Institut Teknologi Sepuluh Nopember, Kampus ITS Sukolilo, Surabaya 60111, Indonesia
3
Malaysia-Japan International Institute of Technology, Universiti Teknologi Malaysia, Jalan Sultan Yahya Petra, Kuala Lumpur 54100, Malaysia
*
Author to whom correspondence should be addressed.
Metals 2021, 11(11), 1760; https://doi.org/10.3390/met11111760
Submission received: 25 September 2021 / Revised: 19 October 2021 / Accepted: 29 October 2021 / Published: 2 November 2021
(This article belongs to the Special Issue Molecular Dynamics Study of Metal Alloys)

Abstract

:
TiAl alloys can be used in aircraft and high-performance vehicle engines owing to their structural stability at high temperatures and their light weight. Although many studies have focused on developing this alloy material, there is still a lack of information about the changes in the structure of TiAl alloys under tensile and compressive loading. Therefore, we performed molecular dynamics simulations of the tensile and compressive loading of TiAl alloys in the <001> direction at temperatures of 10 and 300 K. From our simulation results, we found that the tensile and compressive strengths of TiAl alloys are significantly affected by temperature. It was found that TiAl alloys can withstand greater compression loading than tensile loading. This is due to the change in the crystal structure of TiAl alloys after being deformed to a strain of 0.4 by compressive loading, according to the analysis of structural changes under loading conditions. From the radial distribution analysis results, there was a change in the orientation of the face-centered cubic-like structure as it reached the maximum compressive stress compared to the initial structure.

Graphical Abstract

1. Introduction

The mechanical properties of metals and their alloys have been gaining attention in materials science research for a long time [1,2,3,4,5]. Among the mechanical properties that have been widely investigated are the tensile and compressive strengths of metal alloys. For example, Daghfas et al. reported the experimental tensile strength of an Al 7075 alloy, which is widely used in the automotive industry [6]. Zhao et al. proposed a mechanism to calculate the tensile strength of Al alloys under low-cycle fatigue based on experimental and computational results [7]. Recently, Du et al. investigated the effect of cold-rolling reduction on the tensile properties and deformation mechanisms of β-Ti alloys [8].
Intermetallic γ-TiAl alloys, hereinafter referred to as TiAl alloys, are currently being intensively researched and developed because of their potential use in aircraft and automotive components [9]. This material can be found in modern airplane jet engines because of its resistance to high temperatures [10]. It is also used in high-performance vehicle engines [11]. This alloy material has excellent oxidation resistance and good structural stability during long-term thermal exposure [12,13]. Another advantage of TiAl alloys is their light mass, which increases the acceleration [14] and fuel efficiency to reduce CO2 gas emissions in vehicles [15]. In addition, many Ti-based alloy materials are joined with other metals in their applications. Several studies on the mechanical properties of the joining of Ti-based alloys with other materials have been reported recently [16,17]. When the Ti metal laminated with TiN ceramic is subjected to loading, two yield points are found on the stress and strain graph [18]. Other research has been carried out for magnesium-based alloy materials that have the potential to be applied to the automotive and aerospace fields [19,20]. Magnesium-based alloys can also be used in biomedical applications as bone implants. This alloy is claimed to be a very safe biomaterial. The interaction between magnesium implants and protein has been reported by Zhang et al. [20].
Several experimental and theoretical studies on the mechanical properties of TiAl alloys have been published [21,22,23,24,25,26]. Tanaka et al. [21,22] and He et al. [23] experimentally measured the elastic constants of TiAl alloys at various temperatures. Recently, Wu et al. [24] investigated the effect of surface defects on the tensile strength of TiAl alloys by using molecular dynamics (MD) simulations. They reported that these surface defects affect the strength of the TiAl alloy, where dislocations nucleate from edge defects and large surface defects [24]. Furthermore, Wang et al. tested the elastic behavior of pure TiAl alloys [25] and C/O doping [26]. They found that C/O doping of TiAl alloys could increase the hardness of the material while retaining its resistance to external pressures [26]. However, to the best of our knowledge, no previous studies have reported changes in the structure of TiAl alloys at the atomic scale resulting from tensile and compressive loading. This study is essential because the tensile and compressive properties of TiAl alloys are strongly influenced by their atomic structures.
In this study, we used MD simulations to investigate the structural changes in TiAl alloys that were under uniaxial tensile and compressive loading in the <001> direction. To determine the effect of temperature on the tensile and compressive strengths of TiAl alloys, the simulations were run at temperatures of 10 and 300 K, as done by Tschopp et al. for Cu single crystals [27,28].

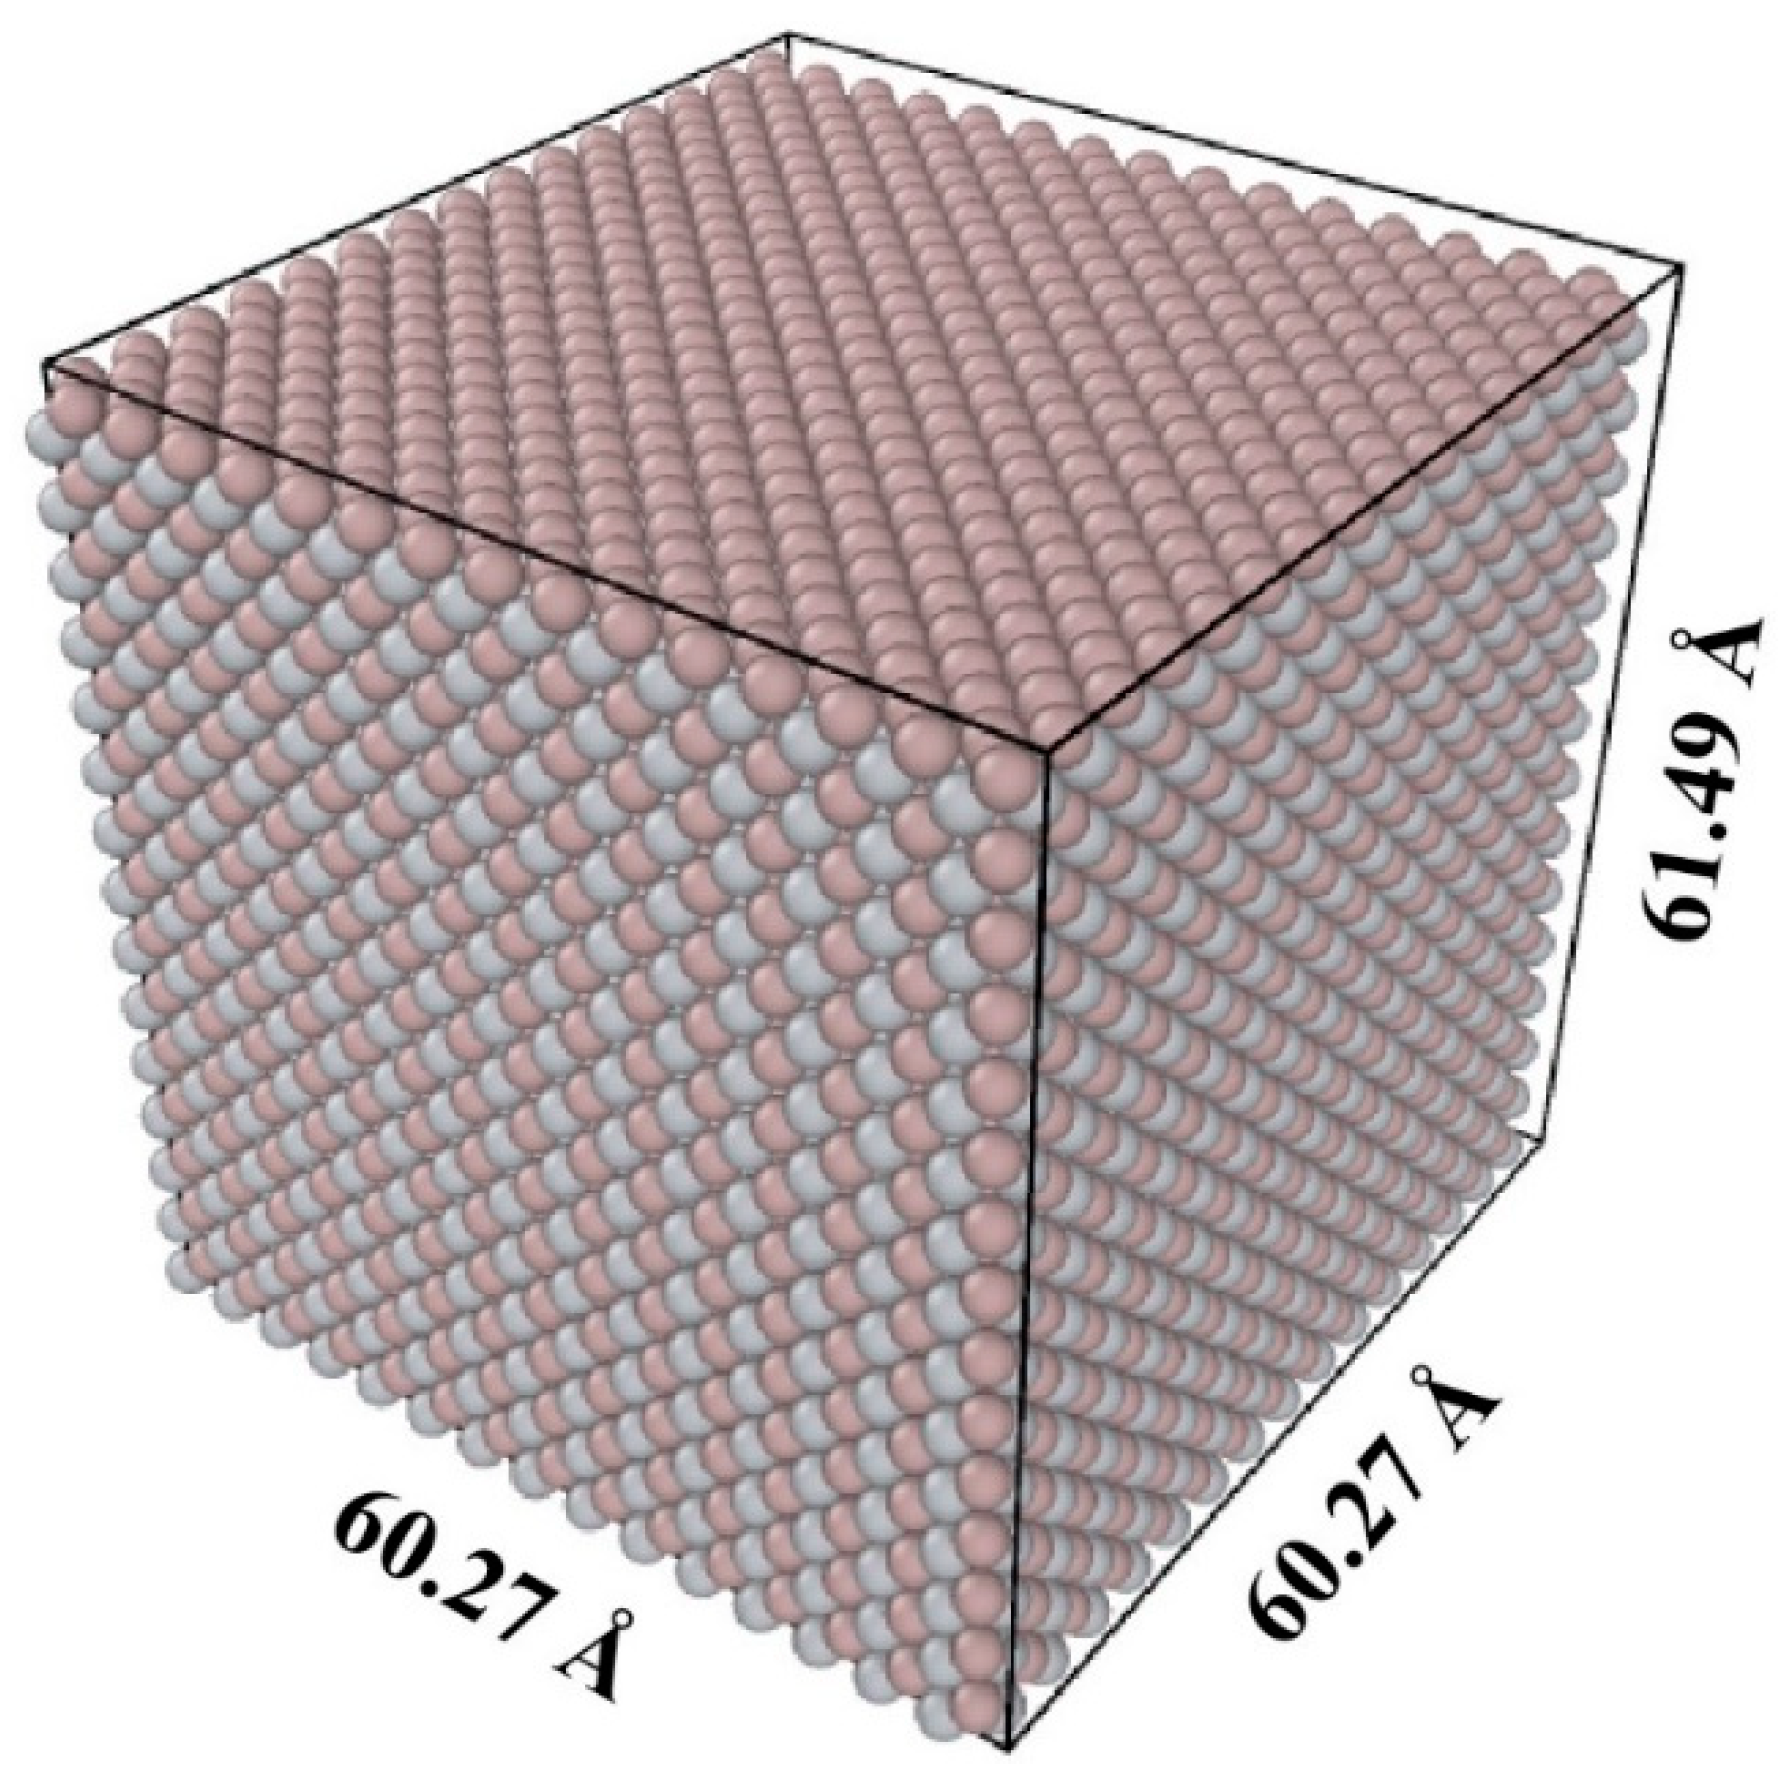
2. Computational Methods

All calculations in this study were performed in parallel by using the large-scale atomic/molecular massively parallel simulator (LAMMPS) software [29]. The second nearest-neighbor interatomic potential modified embedded-atom method (2NN-MEAM) by Kim et al. [30] was used to define the interactions between Ti and Al atoms. The calculation of the TiAl lattice constant using this potential showed a very high accuracy of 99.5% compared to the experimental value [31], and it differed by 0.95% from recent density functional theory (DFT) calculation results [32]. The c/a ratio of 1.02 of the TiAl lattice that was optimized by using this potential was identical to previous experimental results [31]. A time step of 1 fs was used to run the simulation with an isothermal-isobaric NPT Nosé-Hoover thermostat [33,34]. The initial structure was prepared by optimizing a TiAl structure consisting of 13,500 atoms with an atomic ratio of 50:50 for Ti and Al. Periodic boundary conditions were applied to all sides of the supercell. As shown in Figure 1, the dimensions of the simulation box were 60.27 Å × 60.27 Å × 61.49 Å in the x-, y-, and z-directions, respectively. MD simulations were run at 10 K and 300 K to demonstrate the effect of temperature on the results. Initially, the system was equilibrated for 50 ps at 0 bar of pressure, and a tensile and compression loading simulation in the <001> direction with a stress-free condition for the other two boundaries [27,28,35,36,37] was performed on the system for another 50 ps at a loading rate of 0.01 ps−1. The atomic trajectories during tensile and compression loading simulations were visualized and analyzed using Ovito [38]. Structural changes were identified using the bond-angle method of Ackland and Jones [39] and the centrosymmetry parameter [40]. The Wigner-Seitz analysis was used to investigate defects in the crystal using the initial configuration as a reference.

3. Results

This section presents the results of the tensile and compression tests on TiAl alloys from the MD simulations. Uniaxial tensile and compression tests were only carried out in the <001> direction of loading, which was the z-direction in our simulation system. The effect of temperature was investigated by running simulations at 10 K and 300 K. First, we present the material’s mechanical properties in terms of Young’s modulus and ultimate tensile strength. We then present the structural change data as a function of strain. Finally, we show the radial distribution function of each atomic pair.

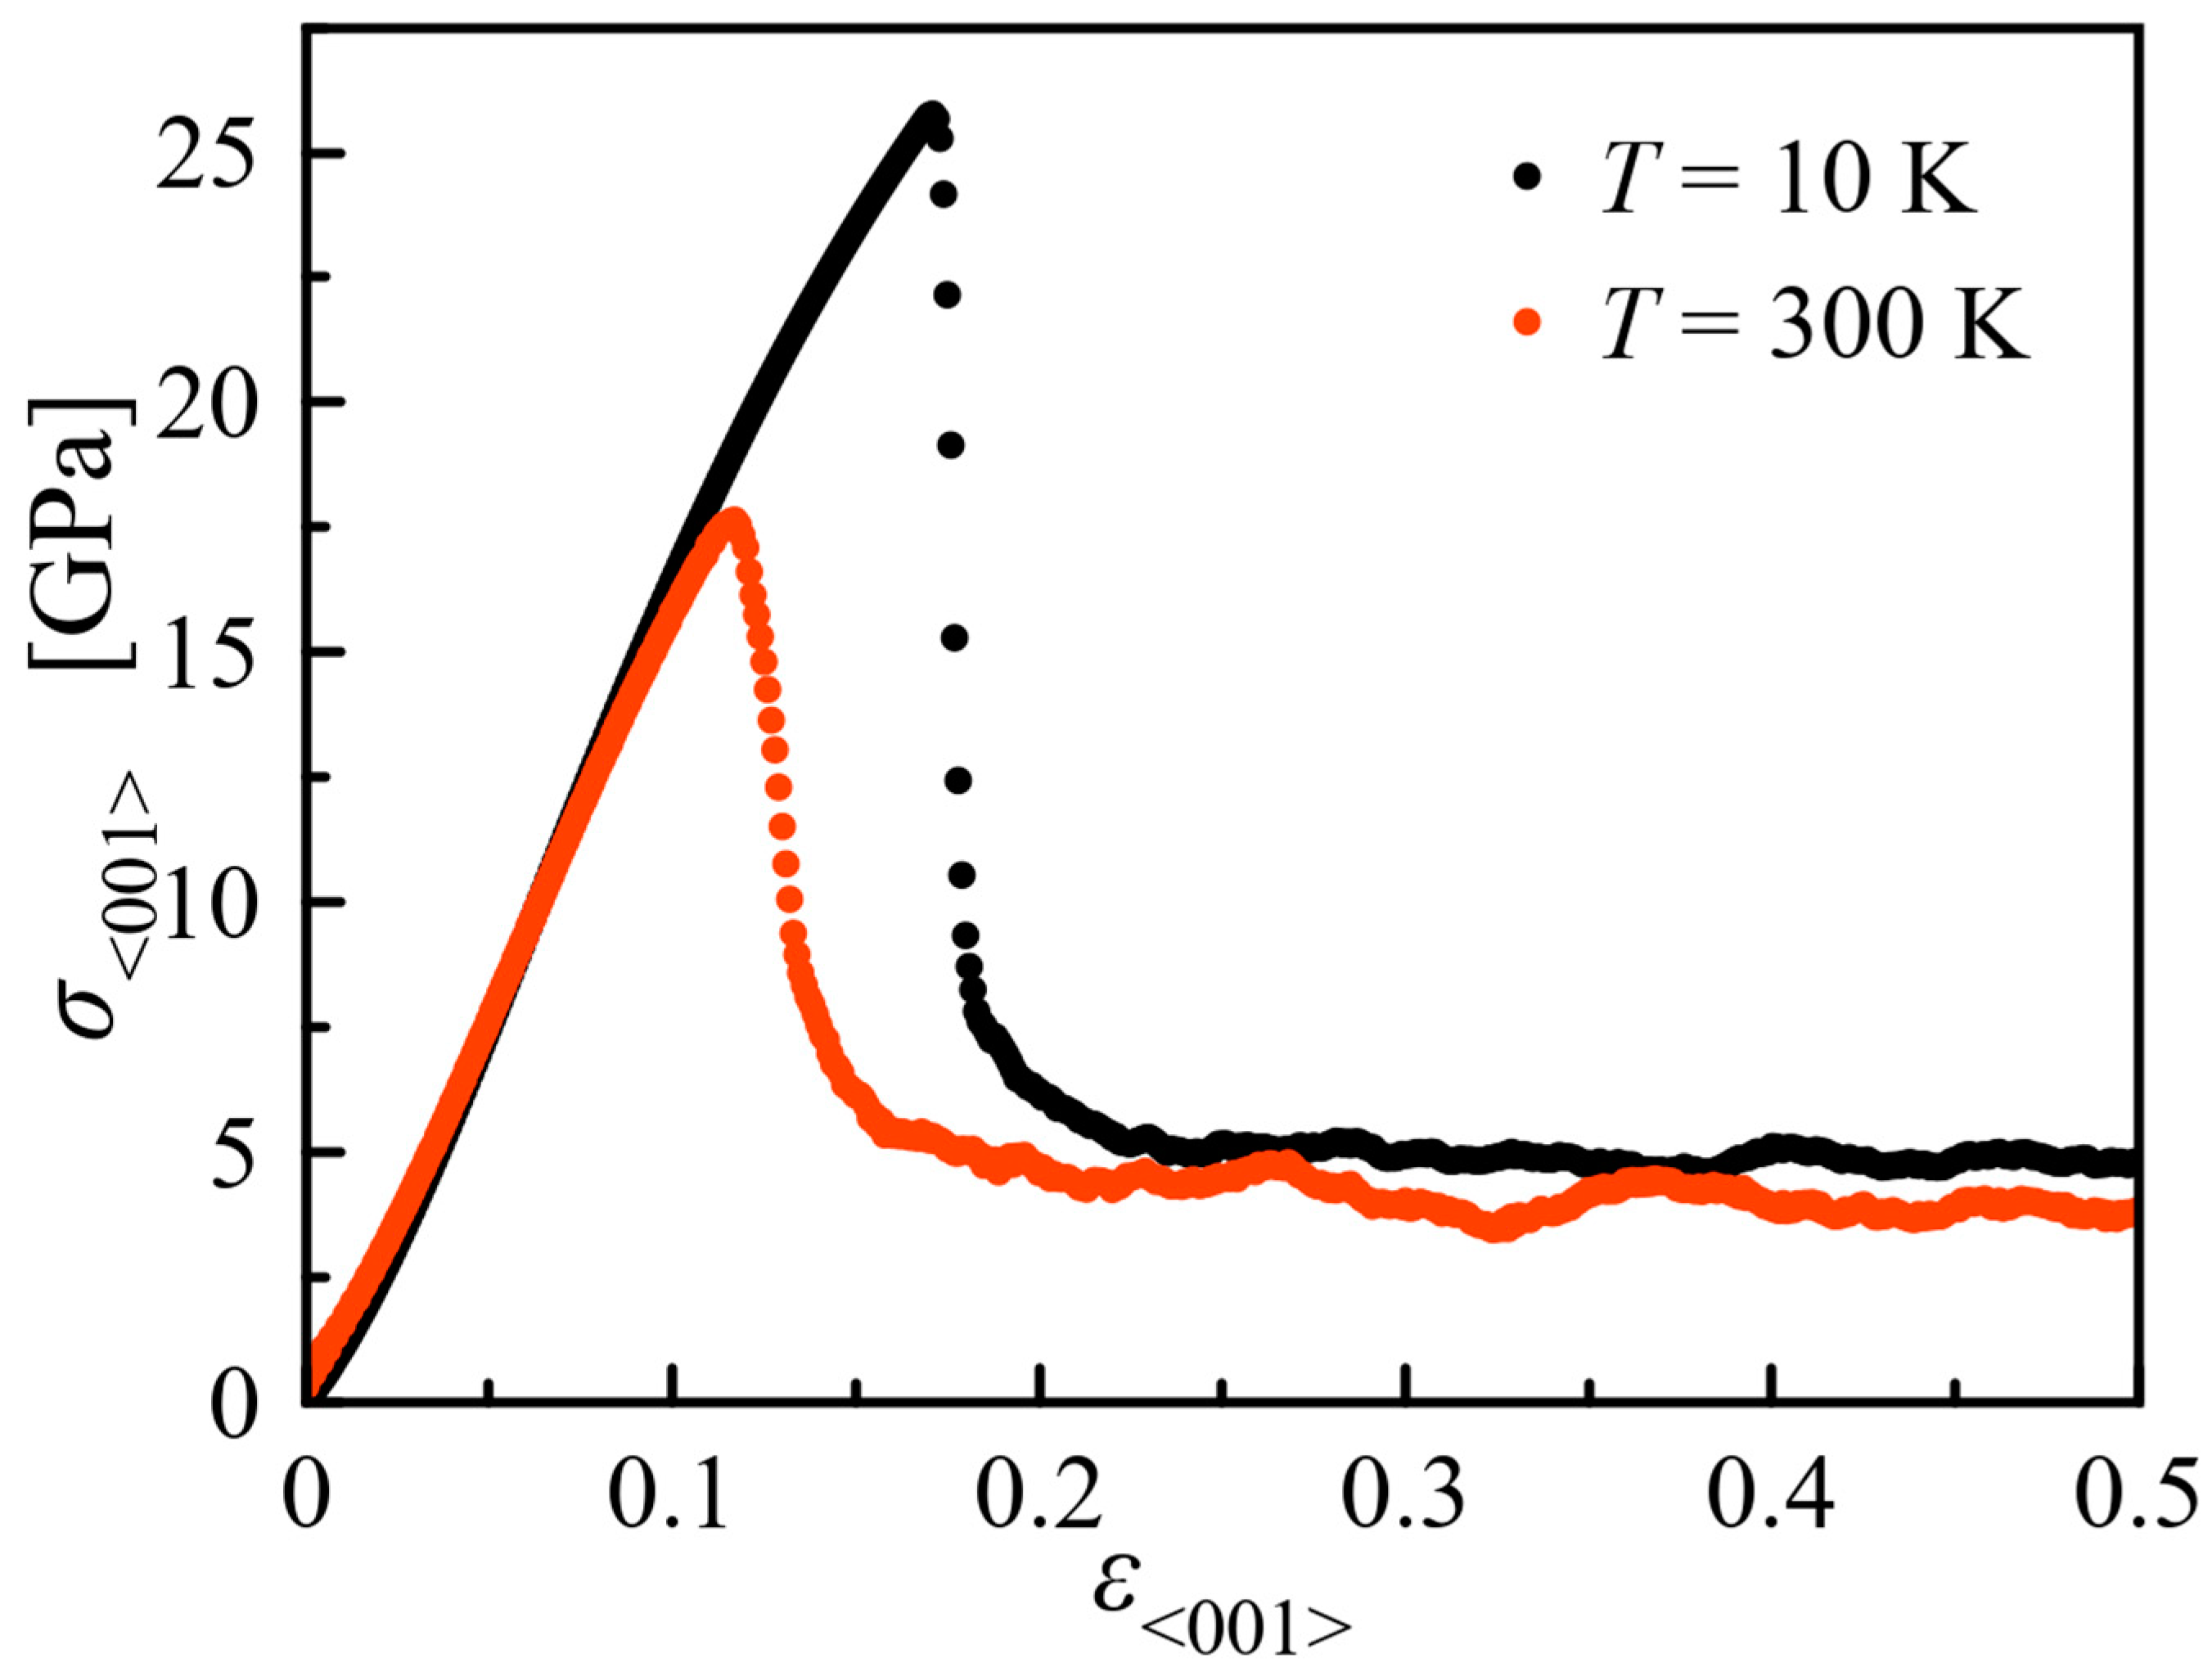
3.1. Stress-Strain Relation

The stress-strain relationship curve is commonly presented [41,42,43,44] to show how a material behaves under loading conditions. Using the stress-strain relationship curve, we can calculate Young’s modulus and determine the material’s maximum tensile and compressive strengths.
Figure 2 shows the stress-strain curve for the tensile loading of TiAl alloys in the <001> direction. The highest peak stress at a temperature of 10 K is much higher than that at 300 K. The peak value corresponds to the maximum tensile stress of the material. In Table 1, it can be seen that the maximum stress values of TiAl alloys at 10 and 300 K are 25.8 and 17.7 GPa, respectively, which are located at strains of 0.17 and 0.12, respectively, indicating the significant effect of temperature on the strength and ductility of the material. It is observed that the slope of the curve before the peak is slightly different at 10 and 300 K. By calculating the gradient of the curve, the values of Young’s modulus in the <001> direction of tensile loading were found to be 180 and 168.5 GPa at temperatures of 10 and 300 K, respectively (see Table 1). This result is close to the previous experimental results of 182 and 178 GPa at 0 (extrapolation) and 298 K [21], respectively. From recently reported first-principles calculation results, values of 172.2 and 157.8 GPa [25] were obtained at 0 and 300 K, respectively. The effect of temperature on Young’s modulus in our results, which decreases with increasing temperature, is consistent with the results of the first-principles calculations [25] and previous experiments [21,23]. In contrast, Wang et al. [25] and He et al. [23] have also found that the value of the elastic constant C13 increases with increasing temperature.
Figure 3 shows the stress-strain curve for compressive loading in the <001> direction. In the case of compression, the material became shorter, resulting in a negative strain value. In this case, the compressive stress was negative. However, compressive stresses and strains can normally be plotted on the positive axis for straightforward interpretation and analysis. From Figure 3, we can see that the characteristics of the stress-strain curve under compression are different from those of the tensile stress curve. The yield point is obvious, after which the compressive stress value decreases significantly and then increases again until it reaches the highest peak. In Table 1, we can see that the maximum compressive stress values of the TiAl alloys in the <001> direction were 39.2 and 31.3 GPa at temperatures of 10 and 300 K, respectively, at strains of 0.39–0.4. These values are approximately 52–77% higher than the maximum tensile strength of the material. The Young’s modulus values for compression of TiAl alloys at 10 and 300 K were 145.9 and 89.2 GPa, respectively. This value is approximately 23–89% lower than Young’s modulus under tensile loading. From these results, we can conclude that TiAl alloys are more resistant to compressive loading than tensile loading in the <001> direction. However, they are stiffer under tensile loading than under compression. In the case of compressive testing for systems with porosity, the compressive strength decreases in materials with greater porosity, as was the result of a previous study by Xu et al. [45] and Galimzyanov and Mokshin [46] for the NiTi alloy system.

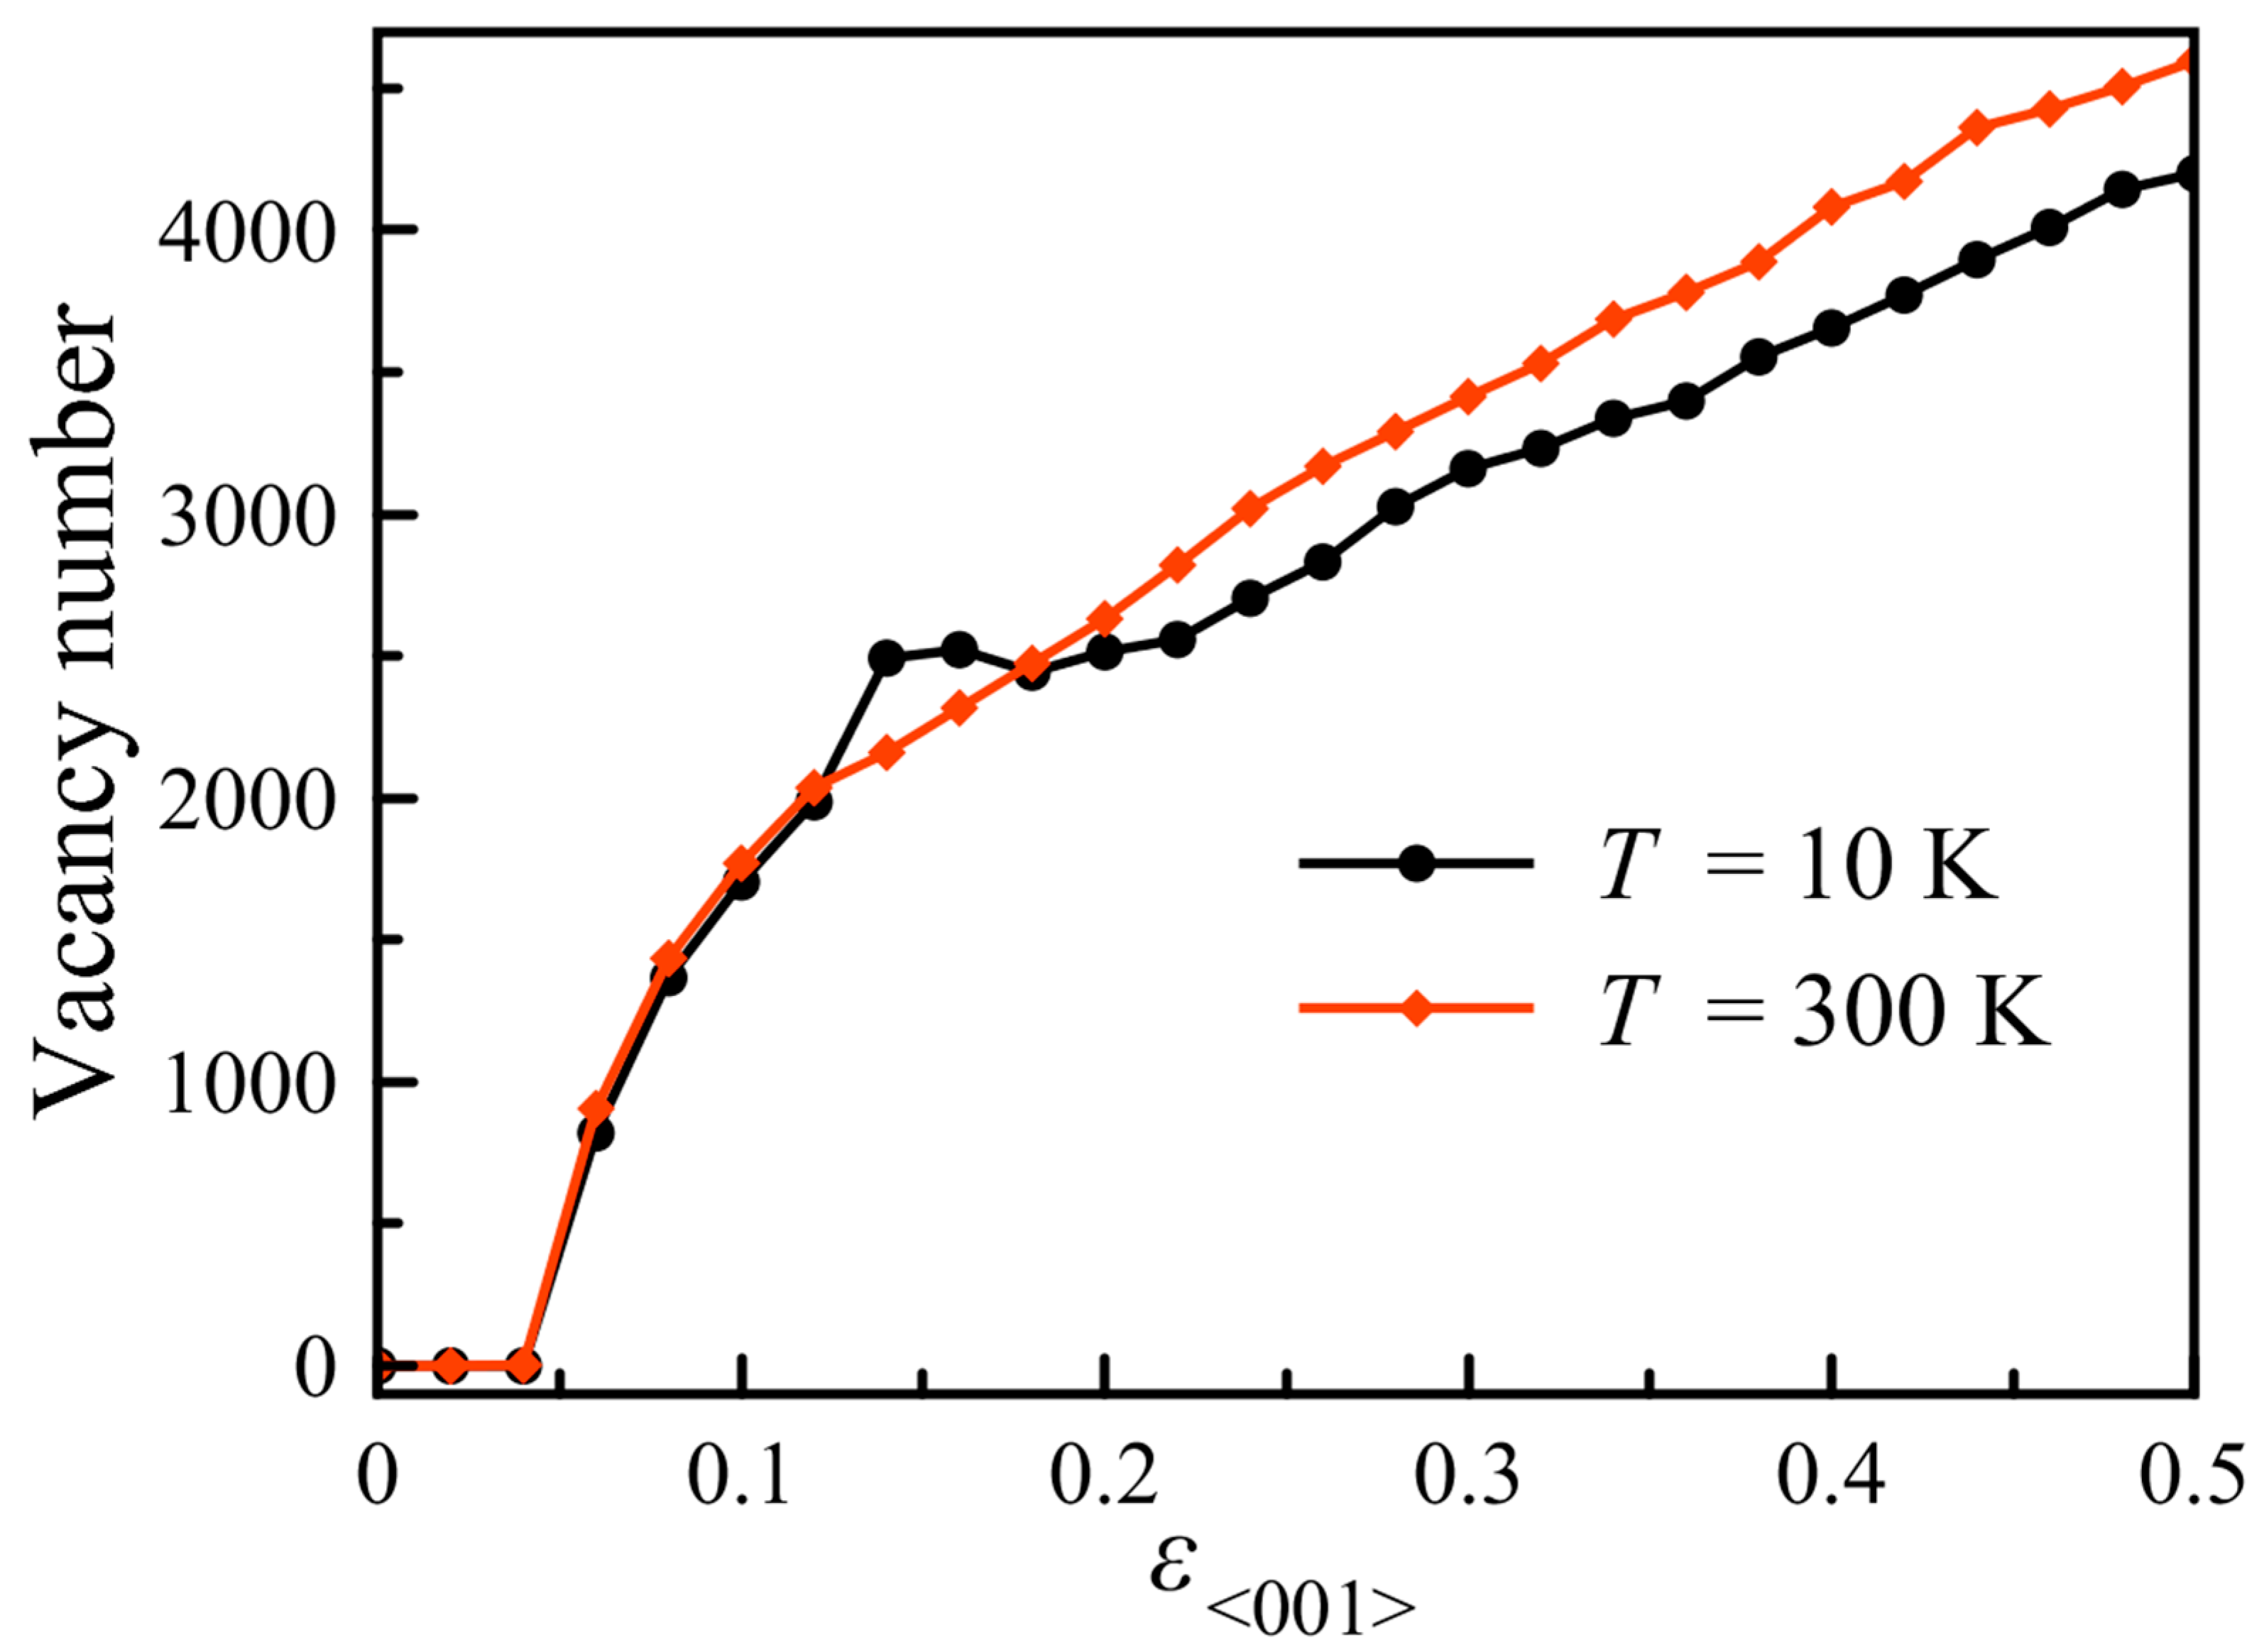
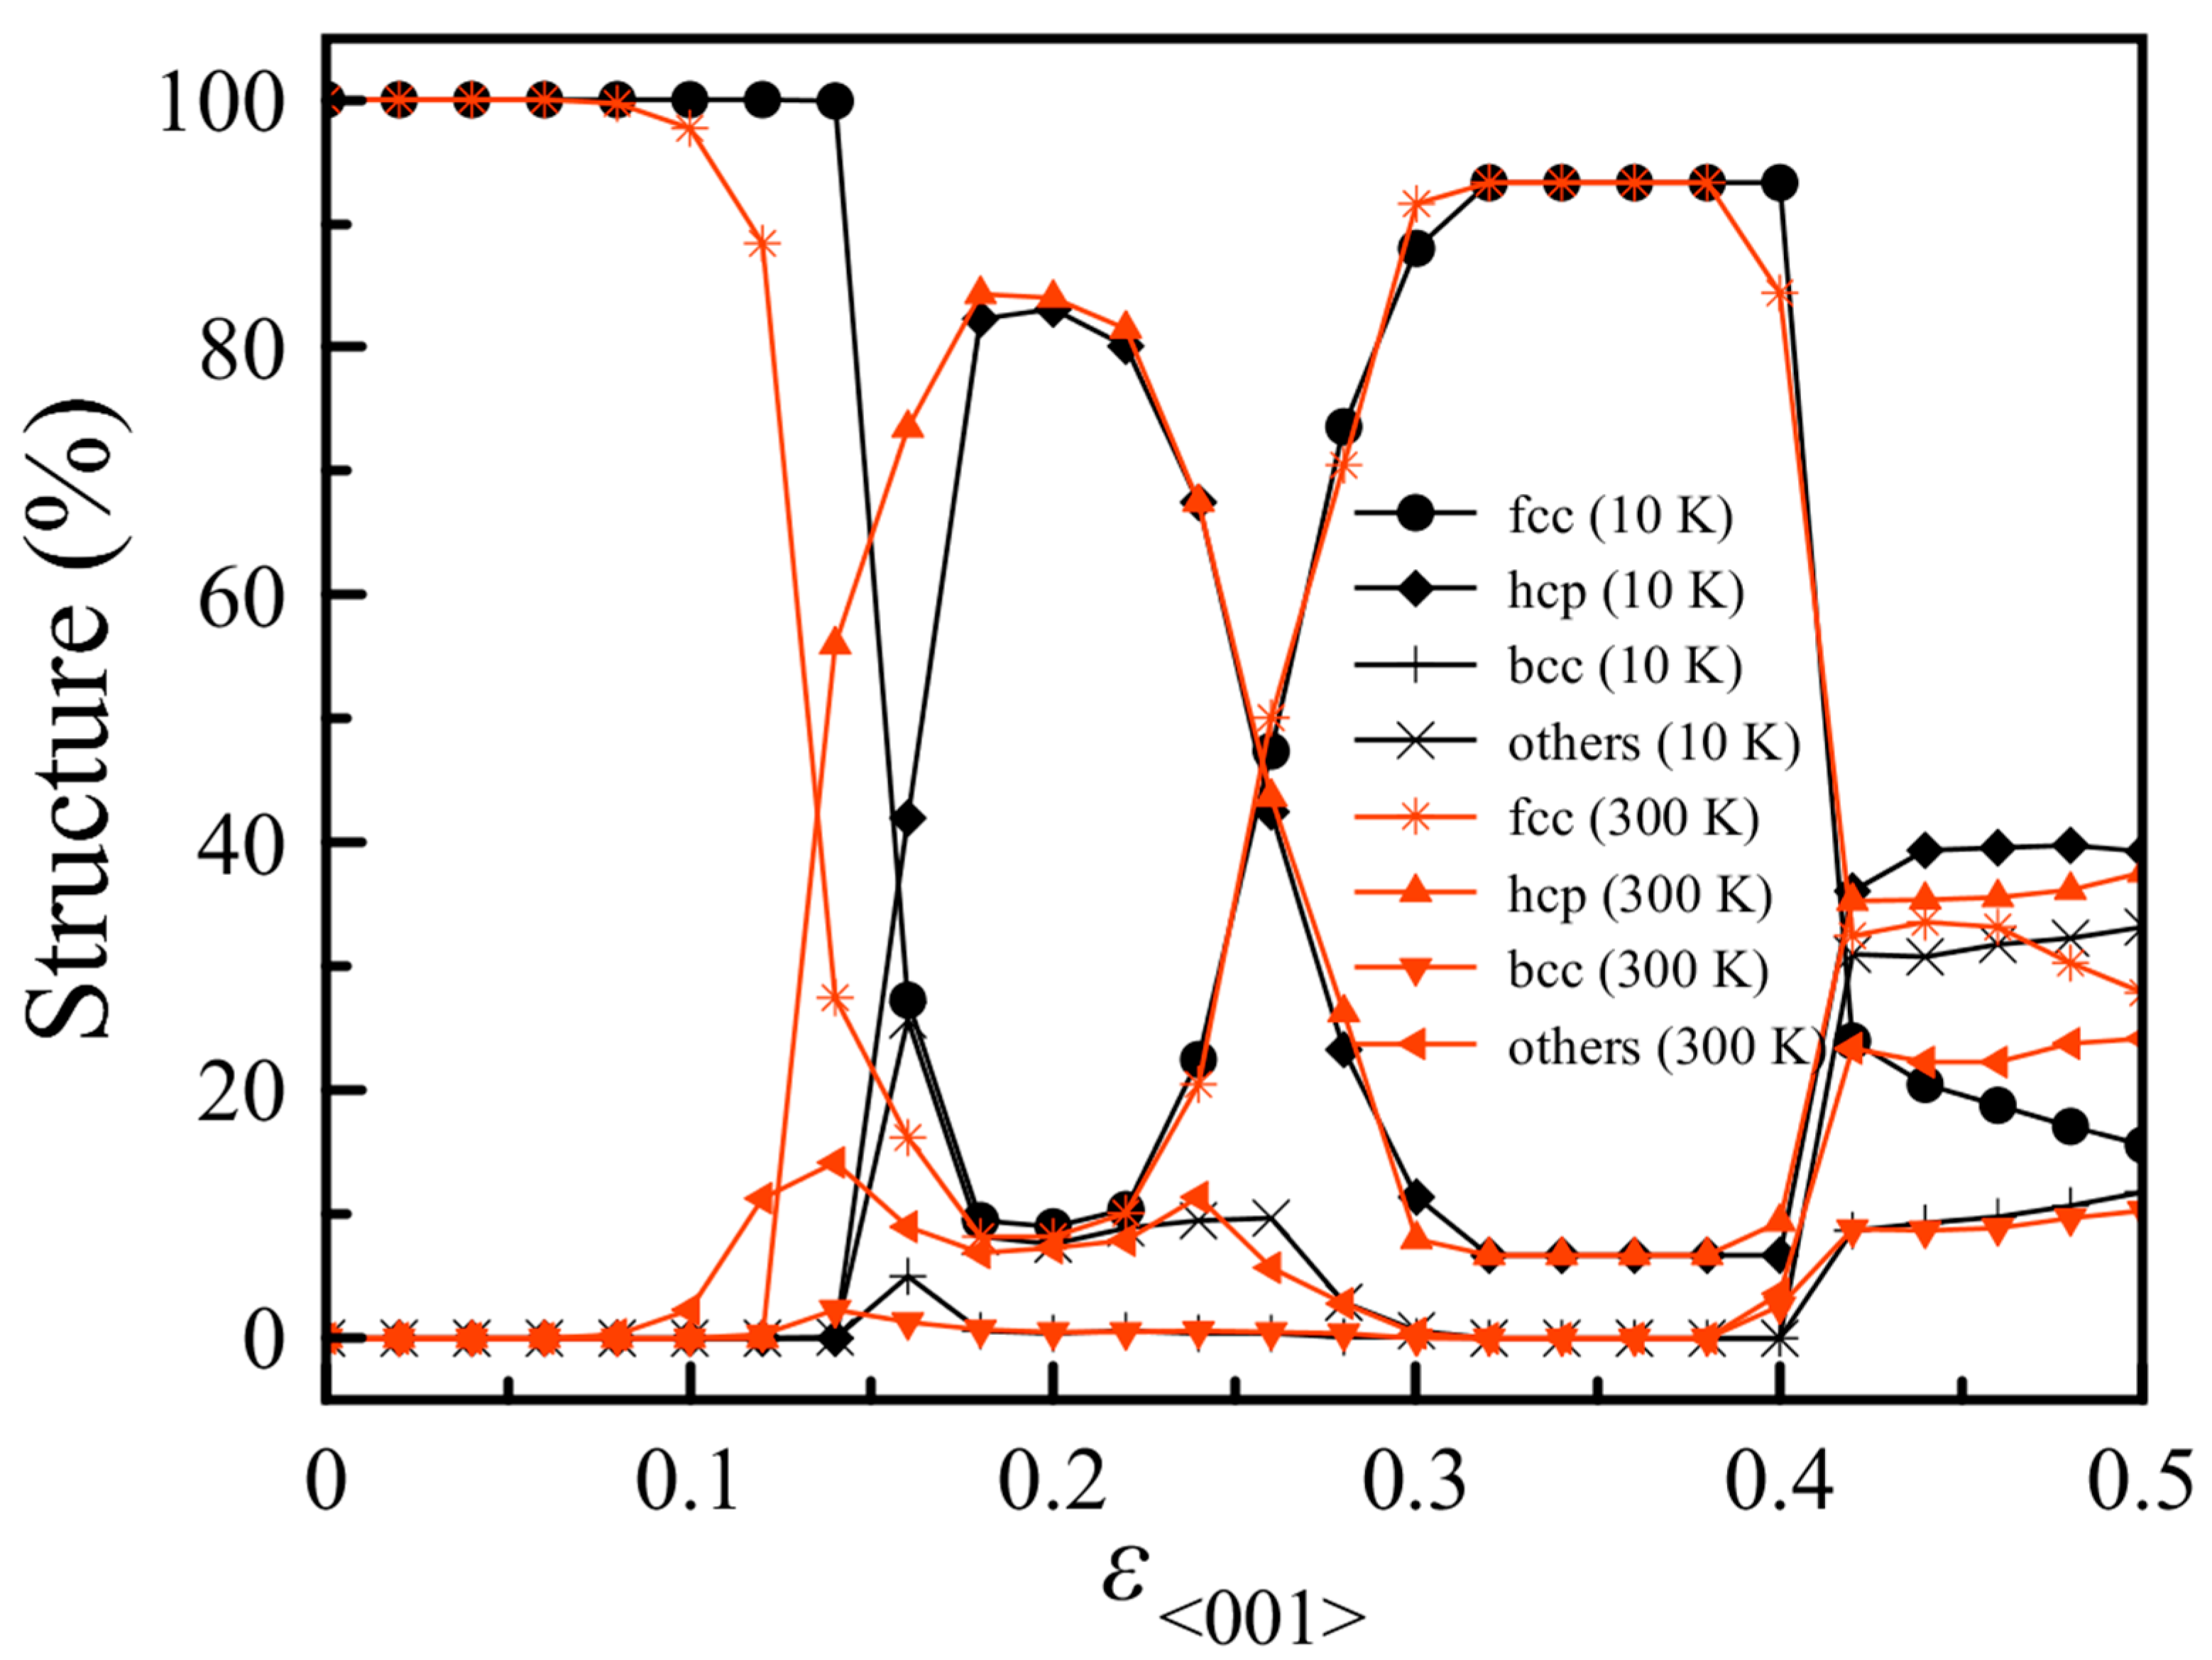
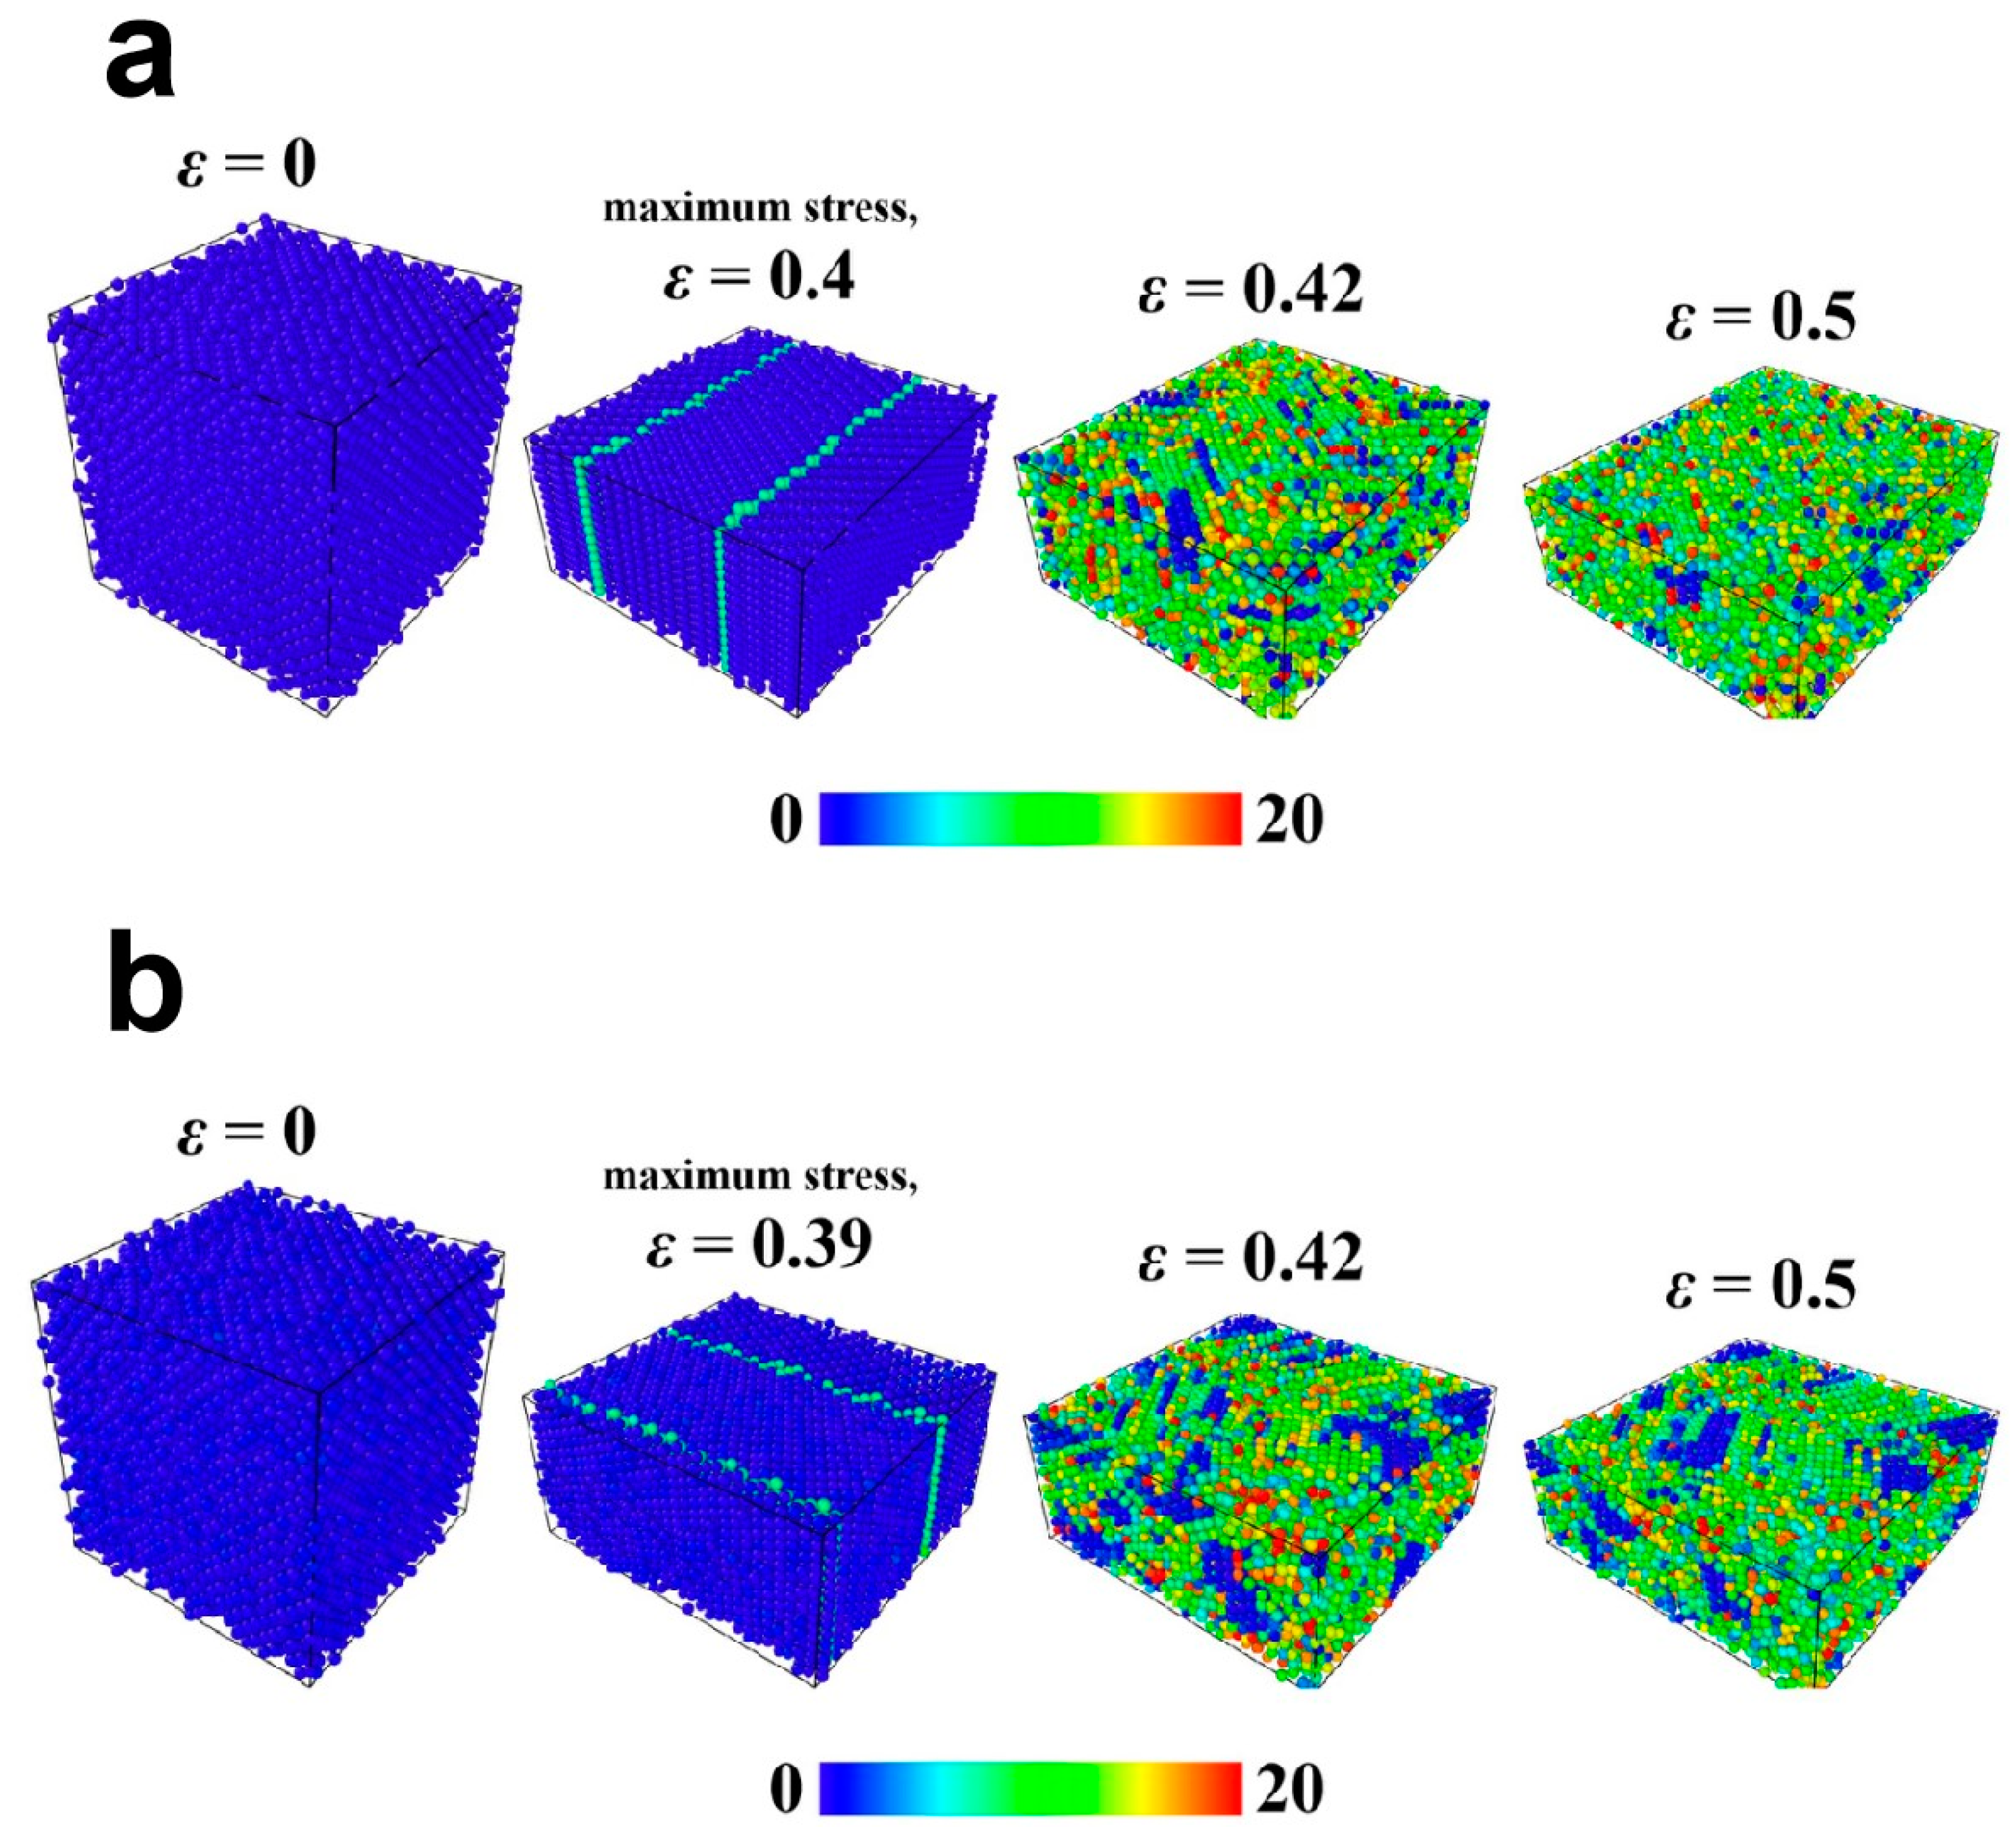
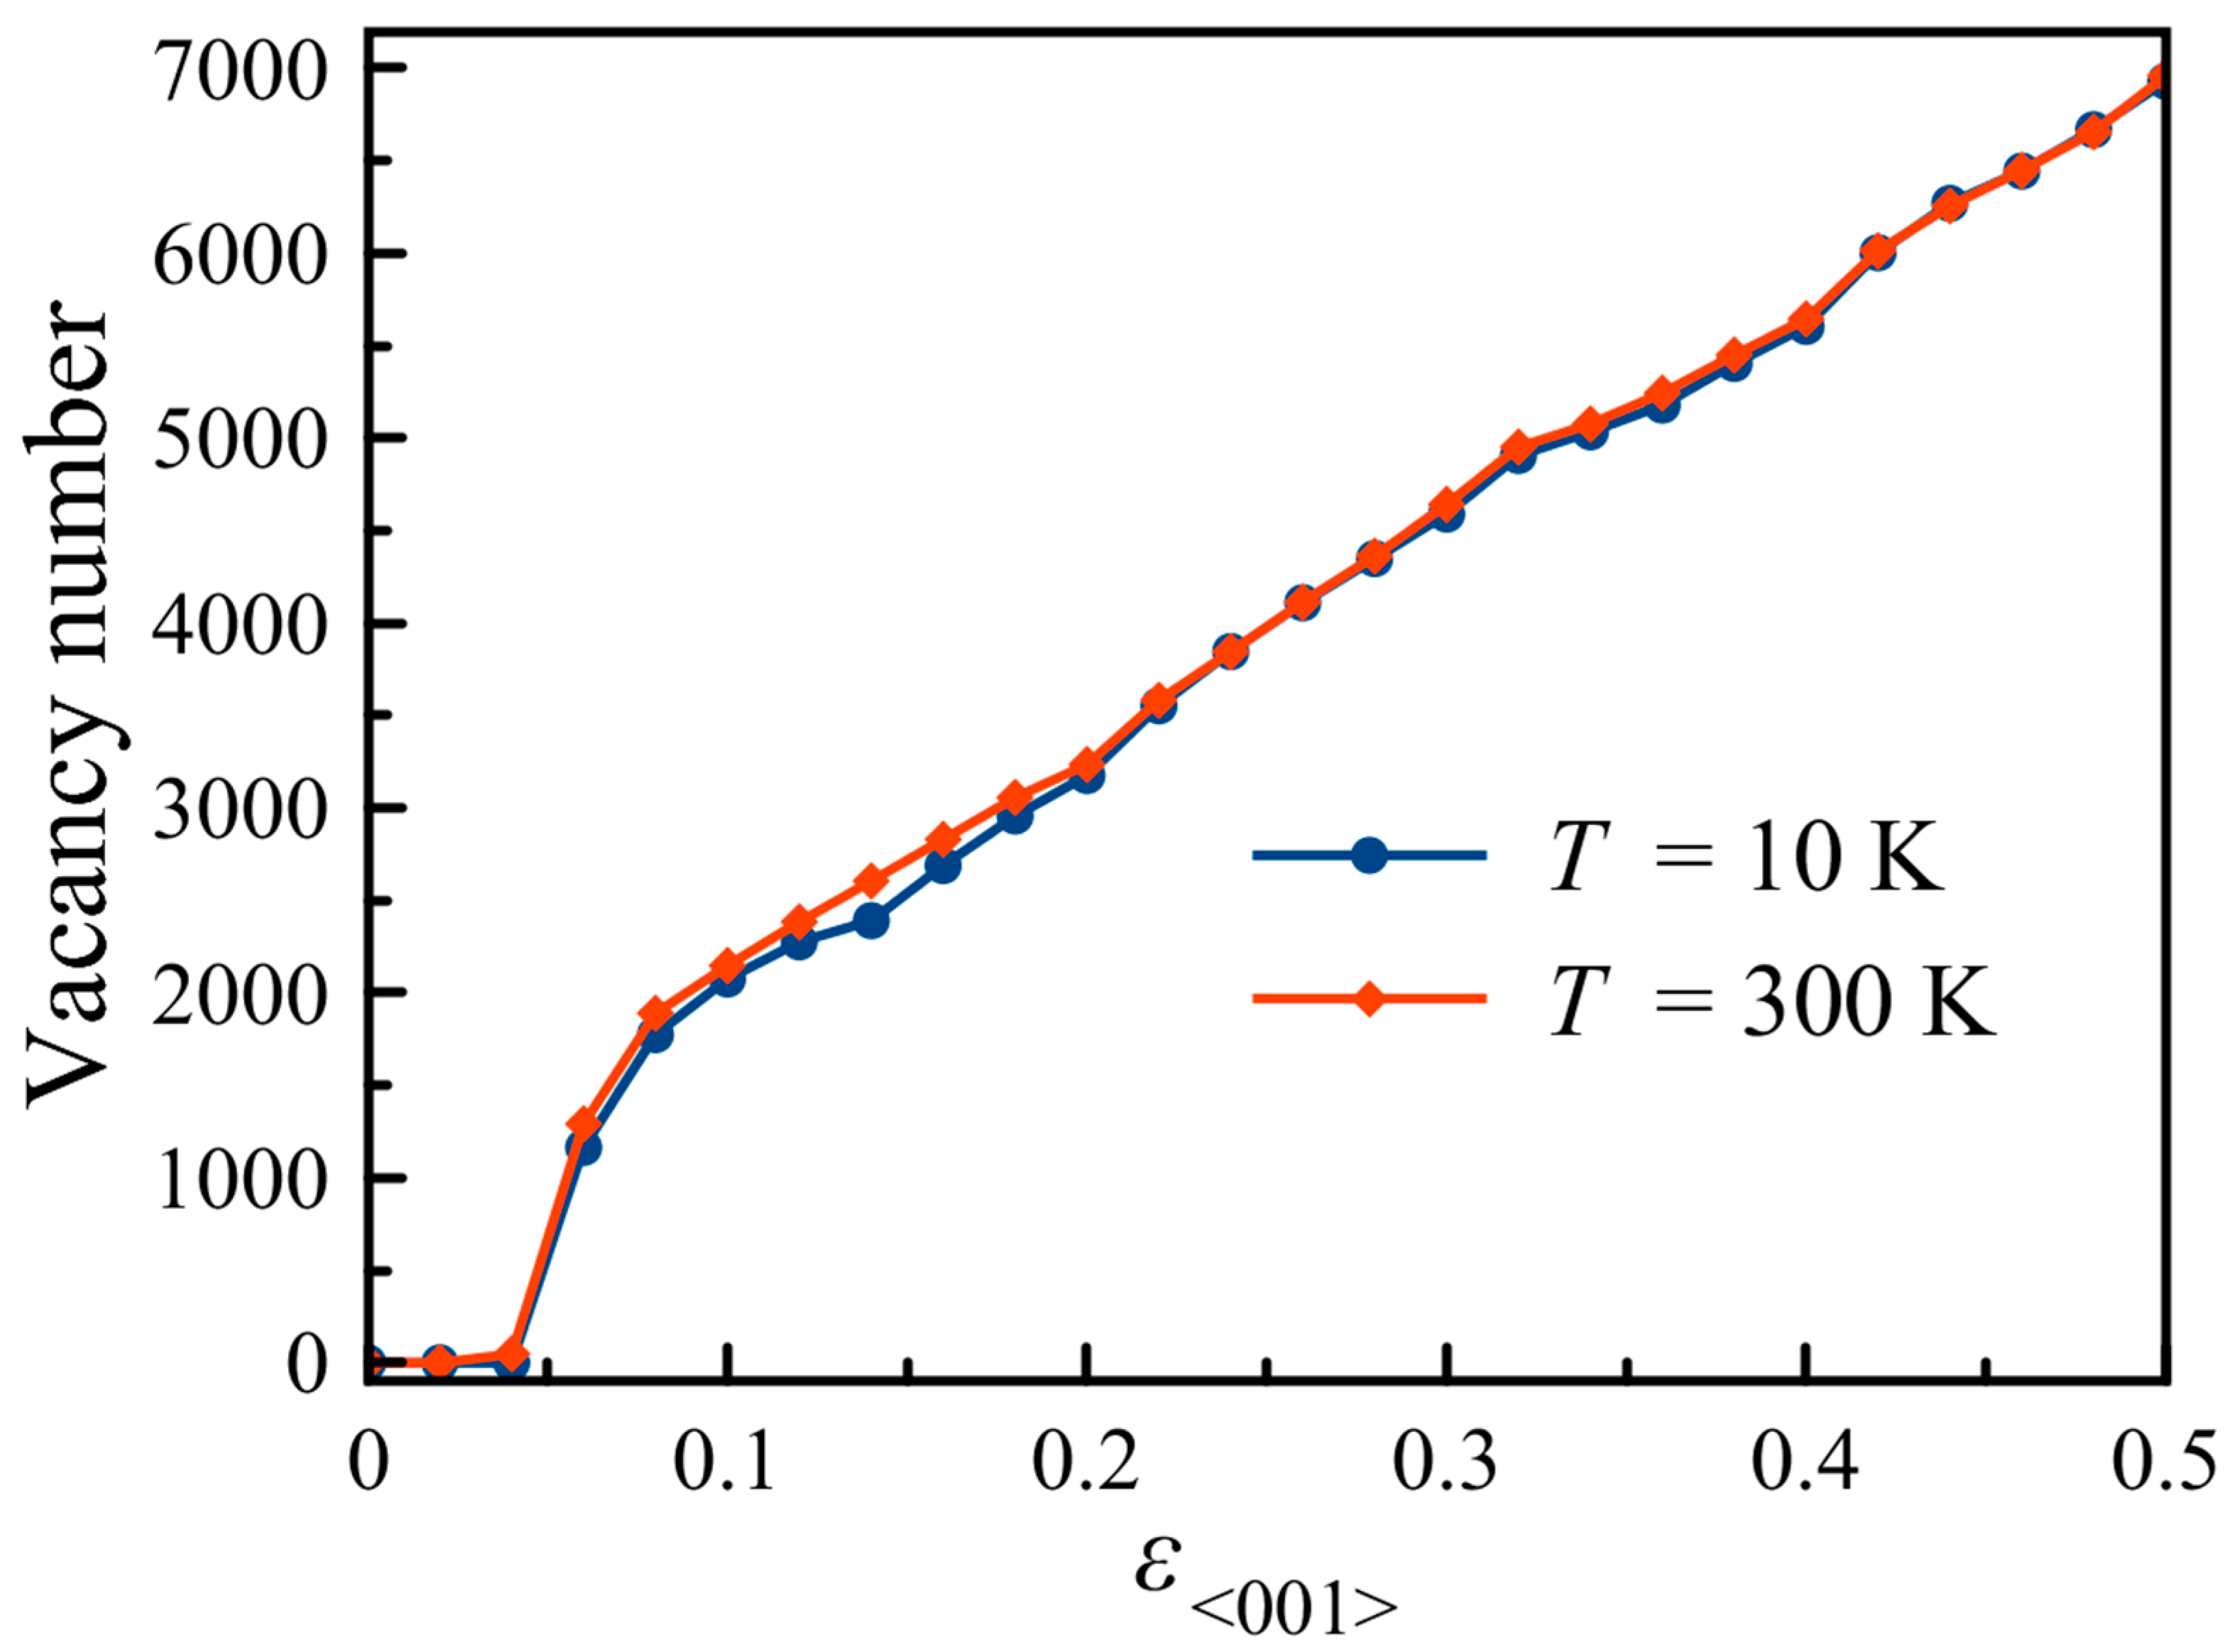
3.2. Structural Change

In this study, the structure of the TiAl alloy was identified based on the analysis of the distribution of angles formed on the neighboring pairs of reference atoms, which is a method developed by Ackland and Jones [39]. Only crystal structures consisting of one species of an atom such as face-centered cubic (fcc), body-centered cubic (bcc), and hexagonal close packed (hcp) can be identified using this method; thus, in this case, we did not distinguish the type of atom. For example, if the identified structure in the TiAl system is fcc, then the actual structure may be an L10 intermetallic structure or something similar. Here, we refer to the structures as fcc-like, bcc-like, or hcp-like. From Figure 4, we can see that at the beginning of the simulation (T = 10 K) up to the strain position at the maximum tensile stress, the TiAl alloy maintained an fcc-like structure. Subsequently, some of the structures changed to bcc-like and other structures. The simulation results at 300 K showed that 100% of the identified structures were fcc-like at the beginning of the simulation until near the maximum stress condition. A bcc-like structure and other structures were observed at the maximum tensile stress (strain of 0.12). Subsequently, the number of hcp-like structures increased significantly.
Figure 5 shows the dislocation nucleation of TiAl alloys that was determined based on the centrosymmetry values that correspond to tensile loading in the <001> orientation. The number of neighbors used as a reference was 12 for fcc-like crystals. Atoms in blue indicate that they belong to the centrosymmetric environment. Atoms with other colors are in the non-centrosymmetric environment, indicating dislocations. From Figure 5a,b we can compare the dislocation nucleation from the simulation results at 10 (see Video S1 in the Supplementary Material) and 300 K, respectively. In Figure 5a, the dislocation nucleation at the strain values of 0.2 and 0.5 looks more significant than the dislocation nucleation that was found in the simulation results at 300 K (Figure 5b). These findings are consistent with those shown in Figure 4, where the number of fcc-like structures in the tensile test results at 300 K is smaller than that at 10 K at the end of the simulation.
The number of vacancies vs. strain is plotted for the tensile loading of TiAl alloys in the <001> direction in Figure 6. It can be observed that vacancies become identifiable when the TiAl alloy is stretched by a strain of 0.06. The number of vacancies from the simulation results at 10 and 300 K was similar up to the strain value of 0.12. Subsequently, the number of vacancies at 10 K was higher than that at 300 K. From Figure 2, it can be seen that the maximum tensile stress is at the strain value of 0.12, after which the value begins to restructure from the fcc-like structure to form other crystal structures and amorphous structures (see Figure 3). A different situation occurs in the system with an initial temperature of 10 K, where at a strain value of 0.12, it retains an fcc-like structure up to a strain of 0.17. Due to tensile loading, the fcc-like structure is stretched which causes an increase in the number of vacancies. At strain values of 0.2–0.5, the number of vacancies at 300 K exceeded that at 10 K. The process of structural change due to loading occurs through several stages. In the elastic region, the work done by the surroundings is converted into potential energy of the system, at which point the system can return to its original structure when the load is released. After achieving the elastic limit, the work done by the surroundings will be accumulated at a certain value until it reaches the maximum limit. In this condition, there are a few changes in the structure. If work continues to be done by the environment, the system is no longer able to accommodate it which causes massive dislocations [43].
The results of the bond-angle analysis under compressive loading (Figure 7) show the characteristics of the structural changes that are different from those of tensile loading. At temperatures of 10 and 300 K, the number of fcc-like structures in TiAl alloys at strain values of 0.14–0.16 decreased significantly, and many hcp-like structures were identified. Then, starting at a strain value of 0.28, the number of fcc-like structures increased significantly. This condition continued until the maximum stress was reached (strain values of 0.39–0.4). From there until the end of the simulation, there was no dominant structure in the stretched TiAl alloy. The multiple risings and fallings in the curve observed in Figure 3 occur due to a phase change from the initial TiAl (fcc-like) structure, which changes to an hcp-like structure immediately after the stress peak, then changes again to a bcc-like structure with a different orientation from the initial conditions. The stress value drops at the point where there is a change from one crystal structure to another.
Figure 8a,b show that most of the atoms were included in the centrosymmetric environment when the compressive stress was maximum, based on the centrosymmetry analysis for the fcc-like structure (see Video S2 in the Supplementary Material). Some of the dislocations formed two vertical planes that may have had an hcp-like structure, as shown in Figure 7. Furthermore, dislocations were observed in almost all of the TiAl alloys, starting at a strain value of 0.42. The last two results explain the transformation of the crystal structure in the compressive loading of TiAl alloy materials.
Figure 9 shows the number of vacancies in TiAl alloys as a result of compressive loading in the <001> direction. Vacancies are initially observed at a strain value of 0.06, and the number increases monotonically as a function of strain. In contrast to the results in the case of tensile loading (Figure 6), the curves of the number of vacancies under compressive loading at temperatures of 10 and 300 K coincided with each other (Figure 9). In this case, the temperature difference did not affect the number of observed vacancies.

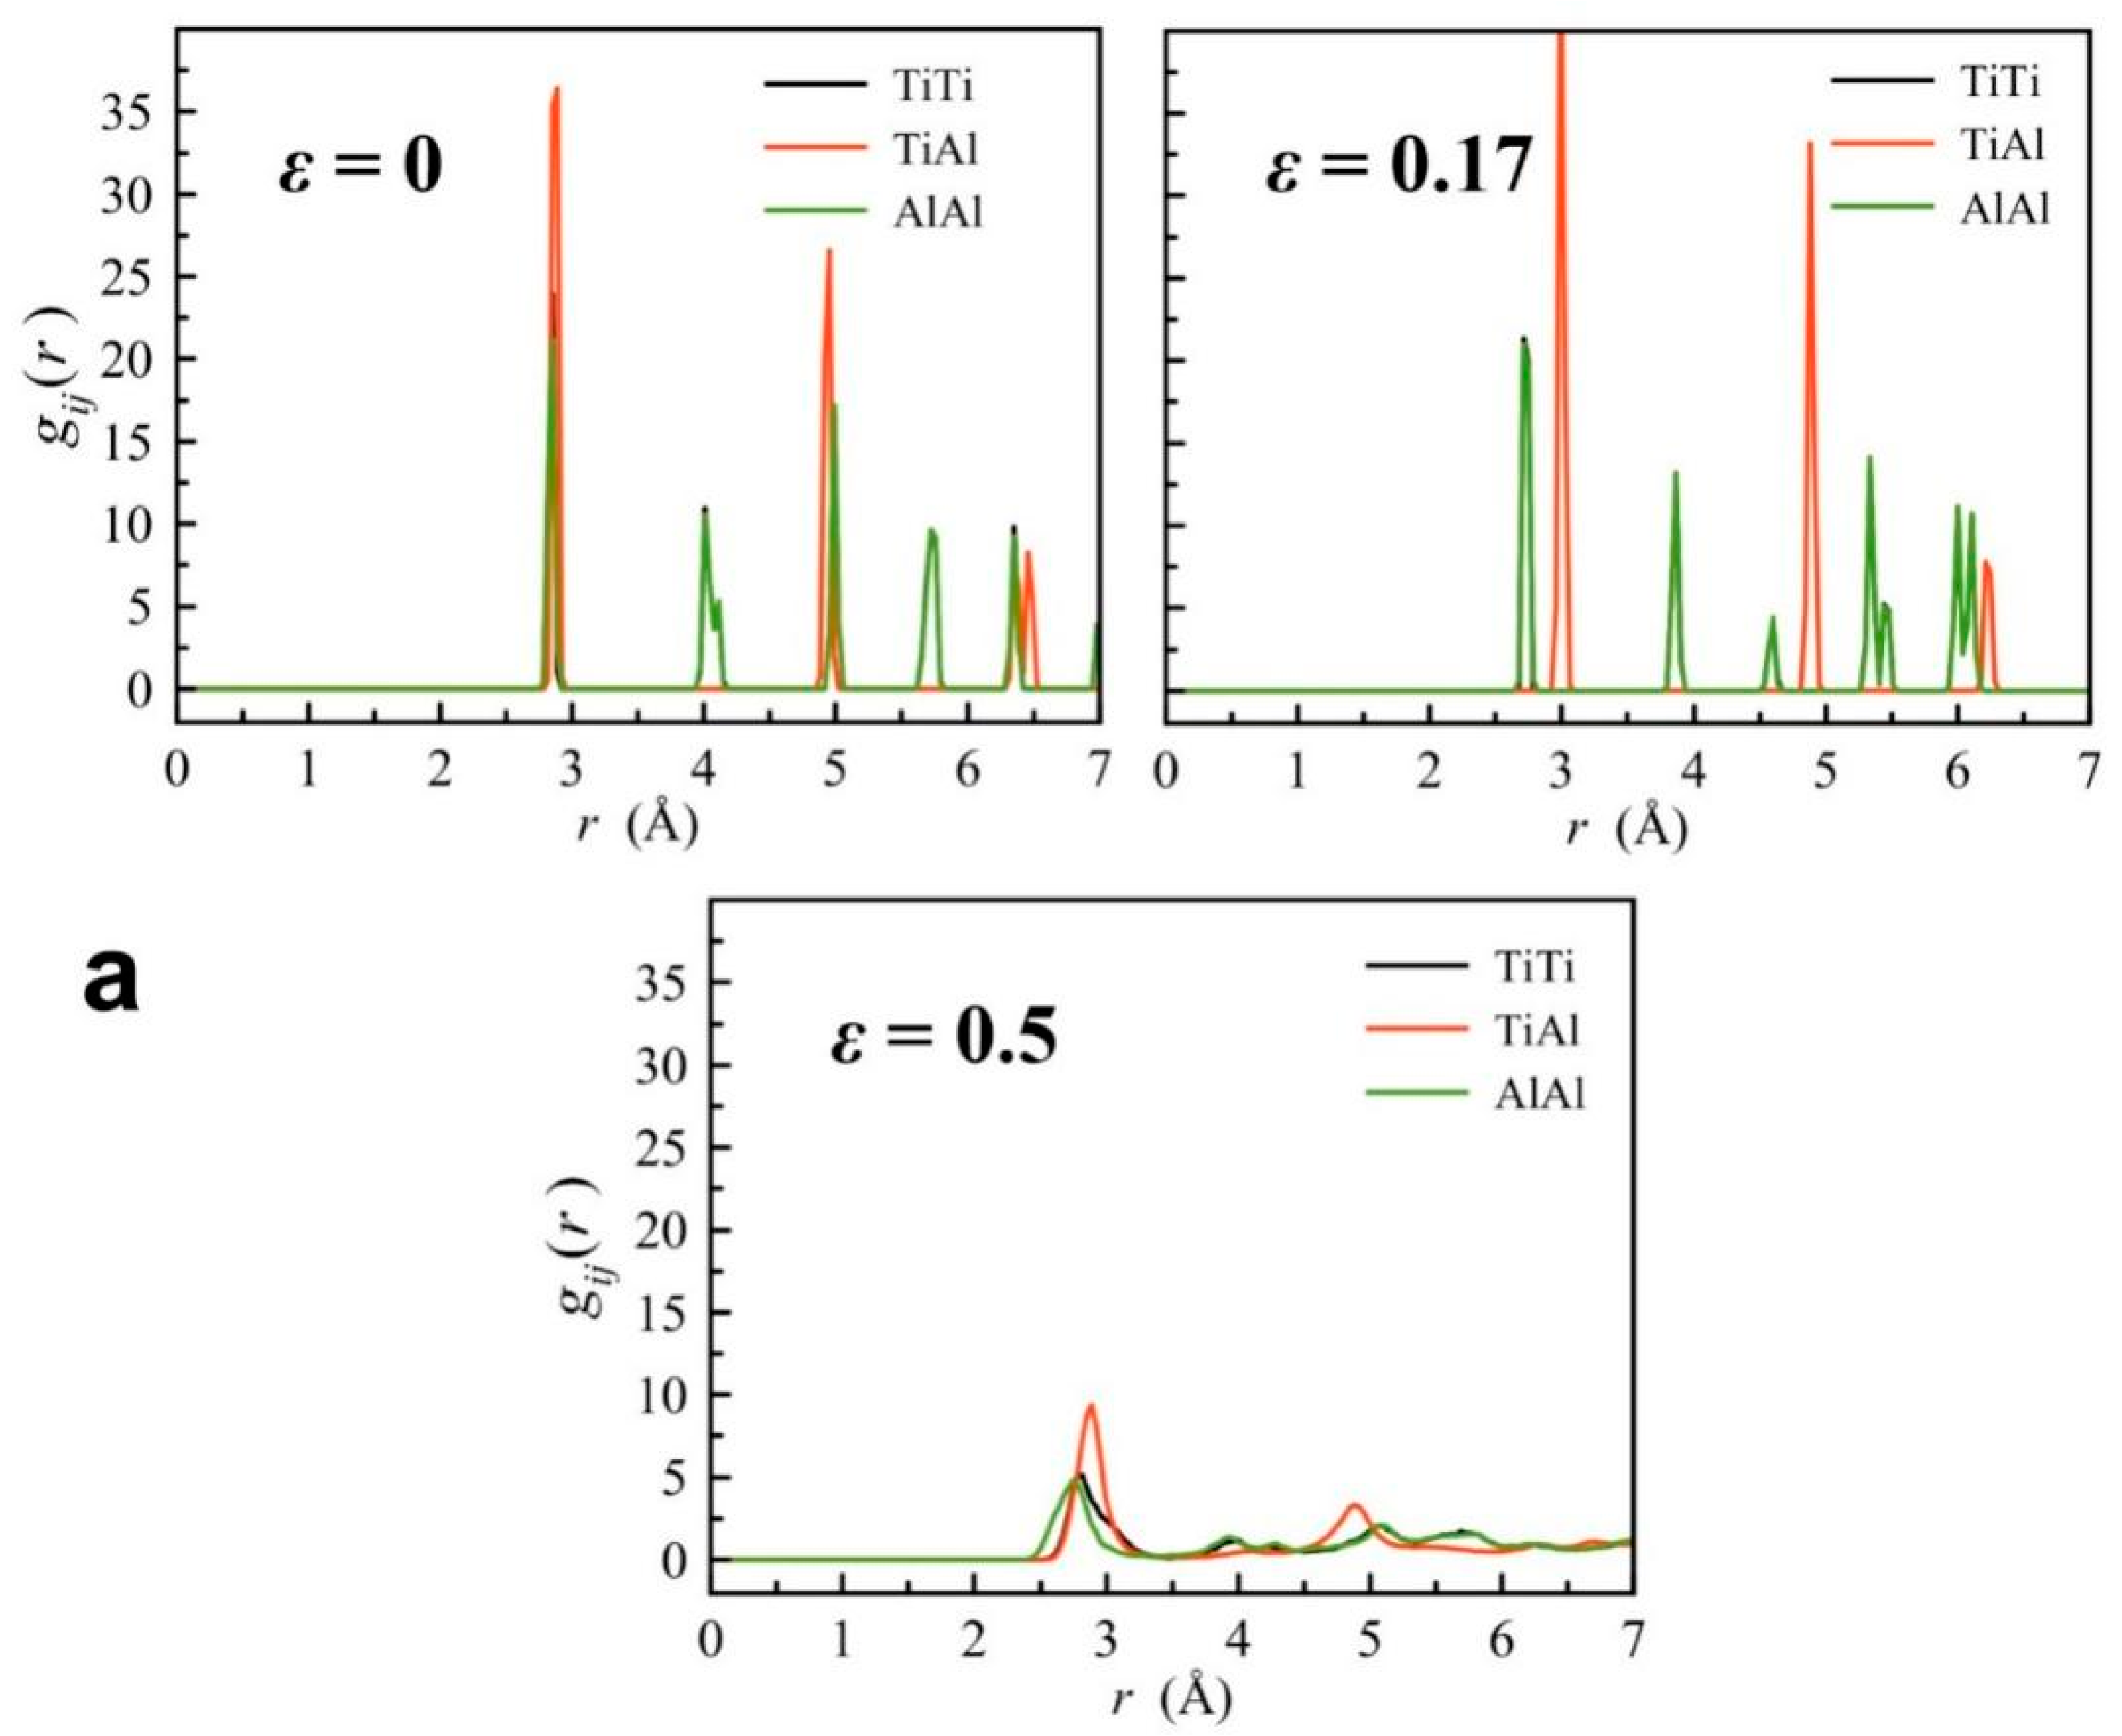
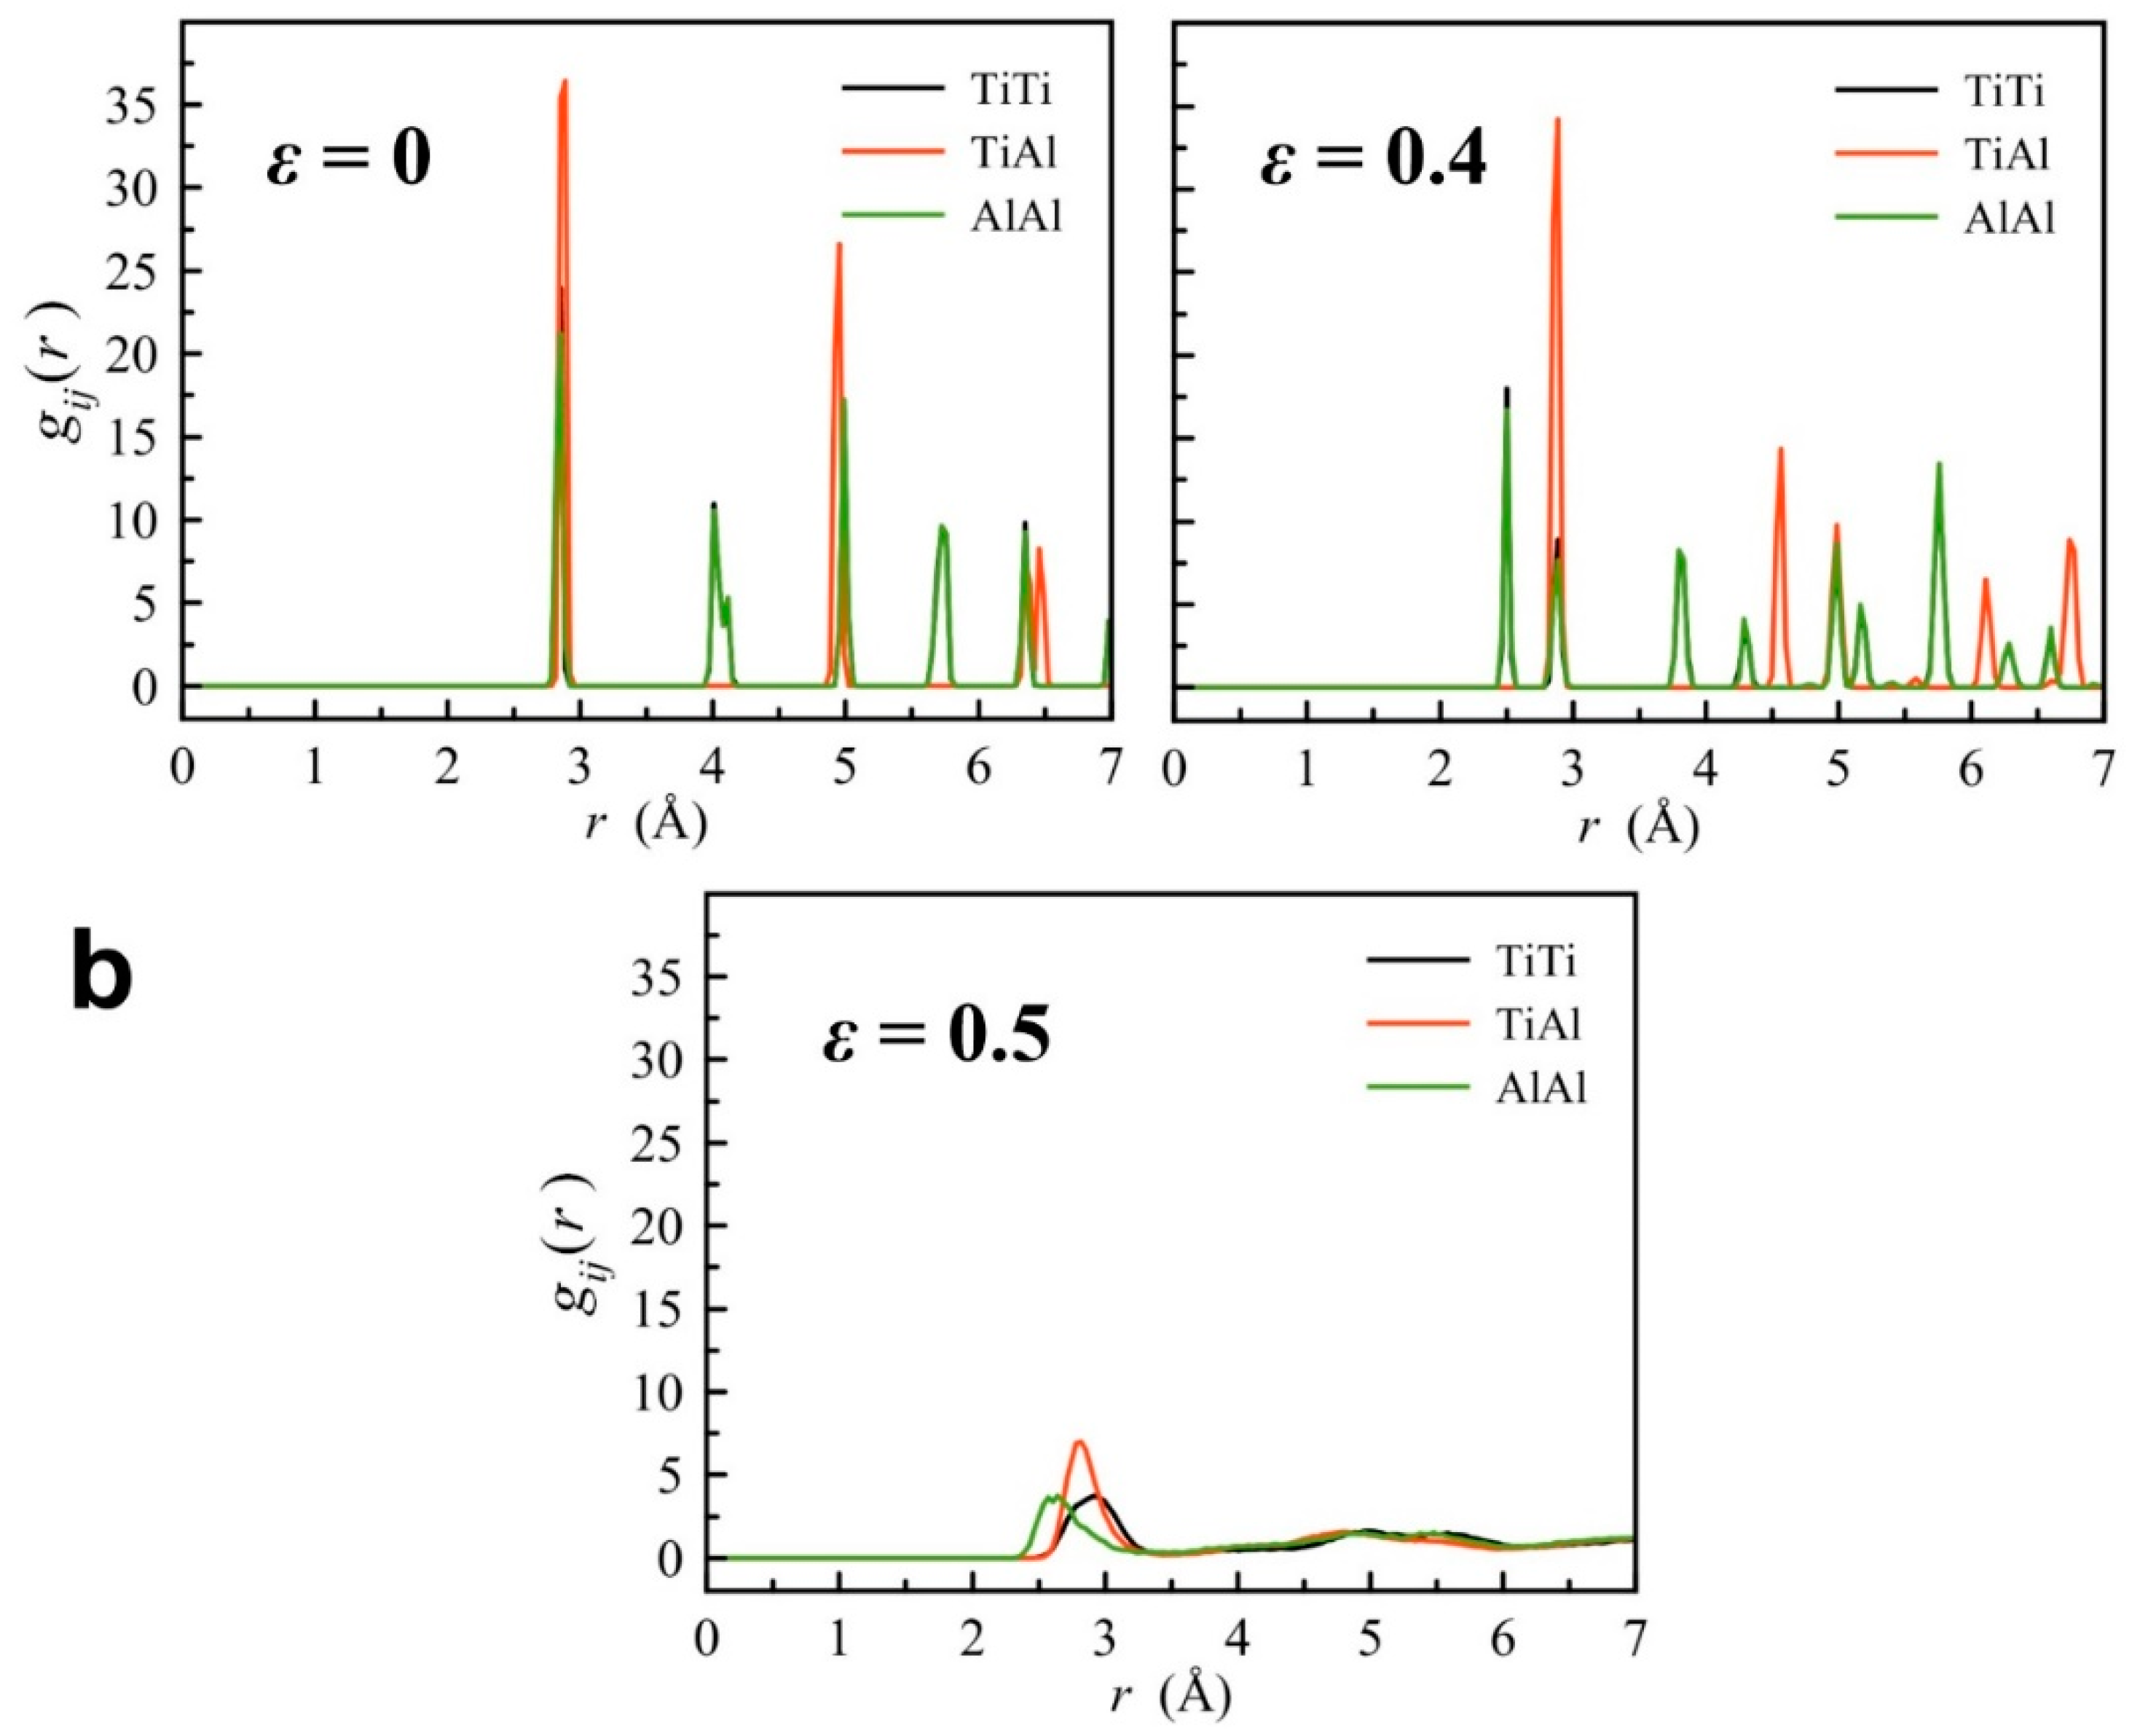
3.3. Radial Distribution Function

Figure 10 shows the partial radial distribution function under tensile and compressive loading of TiAl alloys in the <001> direction. From Figure 10a, it can be seen that at the initial moment before tensile loading at 10 K, the TiAl alloy retains its original crystal structure, and the first peaks (first nearest-neighbor distribution) for the TiTi, TiAl, and AlAl pairs are located in the same position. Then, when the TiAl alloy is loaded toward <001> with a strain value of 0.17 (at maximum stress), the first peak of the TiAl pair shifts to the right, indicating that the distance between the Ti and Al atoms had increased. These results were obtained because the Ti and Al atoms are in different layers in the <001> direction, so the distance between them stretches when under tensile loading. At this stage, the pattern of the radial distribution function still shows a crystal structure. At the end of the MD simulation (strain of 0.5), the structure of the TiAl alloy changed to amorphous. This change occurred after the point of maximum tensile stress, which was indicated by the subsequent decrease in the stress value (see Figure 2).
In Figure 10b, it can be seen that when the maximum compressive loading is applied to a strain of 0.4, the first peak of the radial distribution function of the TiTi and AlAl pairs shifts to the left, indicating that the distance between the atoms in the pair decreases. Figure 7 and Figure 8 show that the fcc-like structure still dominates at this stage, which indicates a change in the orientation of the crystal direction from the initial condition owing to compression. Finally, at the end of the simulation (strain of 0.5), the structure changed to amorphous.

4. Discussion

From the results presented in this study, it can be concluded that temperature affects the tensile and compressive strength of TiAl alloy materials in the <001> direction. The values of the tensile and compressive strengths of the material decreased significantly with increasing temperature. The decrease in the strength of this material occurs because the thermal energy facilitates the dislocation nucleation process, as has been observed in previous experimental [21,22] and computational studies [27,28]. In addition, with increasing thermal energy, TiAl alloys deform more easily, as indicated by the decrease in Young’s modulus at higher temperatures. One of the interesting topics to be studied in the future is the effect of porosity on the mechanical properties of TiAl alloys. In the research results that have been reported recently, the mechanical properties of the NiTi alloy biomaterial were affected by the porosity of the material [46]. Xu et al. [45] reported that the higher the porosity of the material, the lower the compressive strength and modulus of elasticity of the material, which indicates that the mechanical properties of the NiTi alloy biomaterial can be adjusted to the supported bone by tuning the porosity of the material [45]. The same conclusion was reported by Galimzyanov and Mokshin [46], who carried out a computational study to investigate the effect of porosity on the mechanical properties of NiTi alloys. Through shear, tensile, and compression tests, it can be concluded that the increasing porosity of NiTi alloys causes a decrease in the modulus of elasticity and strength of the NiTi alloy [46]. Similar studies may need to be carried out on TiAl alloys to inspire potential wider applications in the future.
From the MD simulation results, it was found that the TiAl alloys exhibited different mechanical behaviors when tensile and compressive loads were applied in the <001> direction. When subjected to tensile loading, the material had a very high stiffness with only slight deformation until it reached maximum stress. In contrast, the TiAl alloys deformed significantly with strains reaching 0.4 at the maximum stress under compressive loading. In fact, it took two phase changes to reach the maximum stress, that is, from an initial fcc-like structure to an hcp-like structure and finally back to an fcc-like structure with a change in crystal orientation. The magnitude of the deformation that occurred caused the number of vacancies under compression loading to be 1.4 times higher than that under tensile loading. Finally, the results of this study reveal the structural changes and their correlation with the mechanical behavior of TiAl alloys owing to tensile and compressive loading in the <001> direction. In future research, it will be necessary to observe the factors that affect the mechanical properties of TiAl alloys, such as the effects of increasing the temperature to the maximum limit, of crystal defects, and of partial substitution of Ti or Al atoms by other atoms.

5. Conclusions

We performed molecular dynamics simulations of the tensile and compressive loading of TiAl alloys in the <001> direction at temperatures of 10 and 300 K. The values of Young’s modulus obtained from the simulation results were in good agreement with the values obtained from previous experimental measurements. The tensile and compressive strengths of the TiAl alloys were significantly affected by the temperature. From the results obtained, it can be concluded that TiAl alloys can withstand greater compression loading than tensile loading owing to the change in their crystal structure after being deformed to a strain of 0.4 upon compressive loading, according to the analysis of structural changes under loading conditions. From the radial distribution analysis results, it was observed that, compared to the initial structure, there was a change in the orientation of the fcc-like structure as it reached the maximum compressive stress value.

Supplementary Materials

The following are available online at https://www.mdpi.com/article/10.3390/met11111760/s1, Video S1: Centrosymmetry parameter values of atoms of TiAl alloy under tensile loading in the <001> direction at 10 K; Video S2: Centrosymmetry parameter values of atoms of TiAl alloy under compressive loading in the <001> direction at 10 K.

Author Contributions

Conceptualization, R.A., F.A. and M.A.B.; methodology, R.A., F.A. and M.A.B.; validation, R.A., F.A. and M.A.B.; formal analysis, D. and A.S.; investigation, R.A.; resources, R.A., D. and A.S.; data curation, Y.A.W. and Y.W.; writing—original draft preparation, R.A.; writing—review and editing, F.A., M.A.B., D. and A.S.; visualization, Y.A.W. and Y.W.; supervision, R.A., D. and A.S.; funding acquisition, R.A. All authors have read and agreed to the published version of the manuscript.

Funding

This work was supported by a WCR 2021 research grant from the Ministry of Education, Culture, Research, and Technology of the Republic of Indonesia [contract # 167/E4.1/AK.04.PT/2021], and manuscript preparation for the World Class Professor Program 2021 [# 2817/E4.1/KK.04.05/2021].

Data Availability Statement

The data presented in this study are available on request from the corresponding author.

Conflicts of Interest

The authors declare no conflict of interest.

References

  1. Li, X.; Lu, L.; Li, J.; Zhang, X.; Gao, H. Mechanical properties and deformation mechanisms of gradient nanostructured metals and alloys. Nat. Rev. Mater. 2020, 5, 706–723. [Google Scholar] [CrossRef]
  2. Gale, W.F. Mechanical properties of metals and alloys. In Smithells Metals Reference Book; Totemeier, T.C., Ed.; Butterworth-Heinemann: Oxford, UK, 2004. [Google Scholar]
  3. Dewidar, M.M.; Yoon, H.-C.; Lim, J.K. Mechanical properties of metals for biomedical applications using powder metallurgy process: A review. Met. Mater. Int. 2006, 12, 193. [Google Scholar] [CrossRef]
  4. Olugbade, T.O.; Lu, J. Literature review on the mechanical properties of materials after surface mechanical attrition treatment (SMAT). Nano Mater. Sci. 2020, 2, 3–31. [Google Scholar] [CrossRef]
  5. Zhang, L.; Shibuta, Y.; Huang, X.; Lu, C.; Liu, M. Grain boundary induced deformation mechanisms in nanocrystalline Al by molecular dynamics simulation: From interatomic potential perspective. Comput. Mater. Sci. 2019, 156, 421–433. [Google Scholar] [CrossRef] [Green Version]
  6. Daghfas, O.; Znaidi, A.; Mohamed, A.B.; Nasri, R. Experimental Study on Mechanical Properties of Aluminum Alloys under Uniaxial Tensile Tests. Int. J. Technol. 2017, 8, 662–672. [Google Scholar] [CrossRef]
  7. Zhao, X.; Li, H.; Chen, T.; Cao, B.; Li, X. Mechanical Properties of Aluminum Alloys under Low-Cycle Fatigue Loading. Materials 2019, 12, 2064. [Google Scholar] [CrossRef] [Green Version]
  8. Du, Z.; He, Q.; Chen, R.; Liu, F.; Zhang, J.; Yang, F.; Zhao, X.; Cui, X.; Cheng, J. Rolling reduction—Dependent deformation mechanisms and tensile properties in a β titanium alloy. J. Mater. Sci. Technol. 2021. In Press. [Google Scholar] [CrossRef]
  9. Clemens, H.; Kestler, H. Processing and Applications of Intermetallic γ-TiAl-Based Alloys. Adv. Eng. Mater. 2000, 2, 551–570. [Google Scholar] [CrossRef]
  10. Bewlay, B.P.; Nag, S.; Suzuki, A.; Weimer, M.J. TiAl alloys in commercial aircraft engines. Mater. High Temp. 2016, 33, 549–559. [Google Scholar] [CrossRef]
  11. Burtscher, M.; Klein, T.; Lindemann, J.; Lehmann, O.; Fellmann, H.; Güther, V.; Clemens, H.; Mayer, S. An Advanced TiAl Alloy for High-Performance Racing Applications. Materials 2020, 13, 4720. [Google Scholar] [CrossRef]
  12. Pflumm, R.; Donchev, A.; Mayer, S.; Clemens, H.; Schütze, M. High-temperature oxidation behavior of multi-phase Mo-containing γ-TiAl-based alloys. Intermetallics 2014, 53, 45–55. [Google Scholar] [CrossRef]
  13. Schwaighofer, E.; Clemens, H.; Mayer, S.; Lindemann, J.; Klose, J.; Smarsly, W.; Güther, V. Microstructural design and mechanical properties of a cast and heat-treated intermetallic multi-phase γ-TiAl based alloy. Intermetallics 2014, 44, 128–140. [Google Scholar] [CrossRef]
  14. Gebauer, K. Performance, tolerance and cost of TiAl passenger car valves. Intermetallics 2006, 14, 355–360. [Google Scholar] [CrossRef]
  15. Eylon, D.; Keller, M.; Jones, P. Development of permanent-mold cast TiAl automotive valves. Intermetallics 1998, 6, 703–708. [Google Scholar] [CrossRef]
  16. Bao, J.-W.; Yang, S.-Y.; Yang, T. Microstructural evolution, tensile property and dynamic compressive property of FSWed Ti–6Al–4V alloy. Rare Met. 2020, 39, 169–175. [Google Scholar] [CrossRef]
  17. Wan, B.; Li, X.-Q.; Pan, C.-L.; Li, D.-Y.; Qu, S.-G.; Yang, C. Microstructure and mechanical properties of TiAl/Ni-based superalloy joints vacuum brazed with Ti–Zr–Fe–Cu–Ni–Co–Mo filler metal. Rare Met. 2021, 40, 2134–2142. [Google Scholar] [CrossRef]
  18. Yang, W.; Ayoub, G.; Salehinia, I.; Mansoor, B.; Zbib, H. Multiaxial tension/compression asymmetry of Ti/TiN nano laminates: MD investigation. Acta Mater. 2017, 135, 348–360. [Google Scholar] [CrossRef]
  19. Zhoua, X.; Fub, H.; Zhua, J.-H.; Yang, X.-S. Atomistic simulations of the surface severe plastic deformation-induced grain refinement in polycrystalline magnesium: The effect of processing parameters. J. Magnes. Alloy. 2021. In Press. [Google Scholar] [CrossRef]
  20. Zhang, Z.-Q.; Wang, H.-Y.; Wang, L.; Chen, X.-B.; Guan, S.-K.; Lin, C.-G.; Zeng, R.-C. Protein conformation and electric attraction adsorption mechanisms on anodized magnesium alloy by molecular dynamics simulations. J. Magnes. Alloy. 2021. In Press. [Google Scholar] [CrossRef]
  21. Tanaka, K.; Ichitsubo, T.; Inui, H.; Yamaguchi, M.; Koiwa, M. Single-crystal elastic constants of gamma-TiAl. Philos. Mag. Lett. 1966, 73, 71–78. [Google Scholar] [CrossRef]
  22. Tanaka, K.; Koiwa, M. Single-crystal elastic constants of intermetallic compounds. Intermetallics 1996, 4, S29–S39. [Google Scholar] [CrossRef]
  23. He, Y.; Schwarz, R.B.; Darling, T.; Hundley, M.; Whang, S.H.; Wang, Z.M. Elastic constants and thermal expansion of single crystal γ-TiAl from 300 to 750 K. Mater. Sci. Eng. A 1997, 239–240, 157–163. [Google Scholar] [CrossRef]
  24. Wu, H.N.; Xu, D.S.; Wang, H.; Yang, R. Molecular Dynamics Simulation of Tensile Deformation and Fracture of γ-TiAl with and without Surface Defects. J. Mater. Sci. Technol. 2015, 32, 1033–1042. [Google Scholar] [CrossRef]
  25. Wang, J.-H.; Lu, Y.; Zhang, X.-L.; Shao, X. The elastic behaviors and theoretical tensile strength of γ-TiAl alloy from the first principles calculations. Intermetallics 2018, 101, 1–7. [Google Scholar] [CrossRef]
  26. Wang, J.; Lu, Y.; Shao, X. First-Principles Calculation for the Influence of C and O on the Mechanical Properties of γ-TiAl Alloy at High Temperature. Metals 2019, 9, 262. [Google Scholar] [CrossRef] [Green Version]
  27. Tschopp, M.A.; Spearot, D.E.; McDowell, D.L. Atomistic simulations of homogeneous dislocation nucleation in single crystal copper. Model. Simul. Mater. Sci. Eng. 2007, 15, 693. [Google Scholar] [CrossRef]
  28. Tschopp, M.A.; McDowell, D.L. Influence of single crystal orientation on homogeneous dislocation nucleation under uniaxial loading. J. Mech. Phys. Solids 2008, 56, 1806–1830. [Google Scholar] [CrossRef]
  29. Plimpton, S. Fast Parallel Algorithms for Short-Range Molecular Dynamics. J. Comput. Phys. 1995, 117, 1–19. [Google Scholar] [CrossRef] [Green Version]
  30. Kim, Y.-K.; Kim, H.-K.; Jung, W.-S.; Lee, B.-J. Development and application of Ni-Ti and Ni-Al-Ti 2NN-MEAM interatomic potentials for Ni-base superalloys. Comput. Mater. Sci. 2017, 139, 225–233. [Google Scholar] [CrossRef]
  31. Pearson, W.B. A Handbook of Lattice Spacings and Structures of Metals and Alloys, 4th ed.; Pearson, W.B., Ed.; Pergamon Press: London, UK; New York, NY, USA, 1958. [Google Scholar]
  32. Jeong, B.; Kim, J.; Lee, T.; Kim, S.-W.; Ryu, S. Systematic investigation of the deformation mechanisms of a γ-TiAl single crystal. Sci. Resports 2018, 8, 15200. [Google Scholar] [CrossRef] [Green Version]
  33. Nosé, S. A molecular dynamics method for simulations in the canonical ensemble. Mol. Phys. 1984, 52, 255–268. [Google Scholar] [CrossRef]
  34. Hoover, W.G. Canonical dynamics: Equilibrium phase-space distributions. Phys. Rev. A 1985, 31, 1695. [Google Scholar] [CrossRef] [Green Version]
  35. Tschopp, M.A.; McDowell, D.L. Tension-compression asymmetry in homogeneous dislocation nucleation in single crystal copper. Appl. Phys. Lett. 2007, 90, 121916. [Google Scholar] [CrossRef] [Green Version]
  36. Spearot, D.E.; Jacob, K.I.; McDowell, D.L. Dislocation nucleation from bicrystal interfaces with dissociated structure. Int. J. Plast. 2007, 23, 143–160. [Google Scholar] [CrossRef]
  37. Spearot, D.E.; Jacob, K.I.; McDowell, D.L. Nucleation of dislocations from [0 0 1] bicrystal interfaces in aluminum. Acta Mater. 2005, 53, 3579–3589. [Google Scholar] [CrossRef]
  38. Stukowski, A. Visualization and analysis of atomistic simulation data with OVITO–the Open Visualization Tool. Model. Simul. Mater. Sci. Eng. 2010, 18, 015012. [Google Scholar] [CrossRef]
  39. Ackland, G.J.; Jones, A.P. Applications of local crystal structure measures in experiment and simulation. Phys. Rev. B 2006, 73, 054104. [Google Scholar] [CrossRef]
  40. Kelchner, C.L.; Plimpton, S.J.; Hamilton, J.C. Dislocation nucleation and defect structure during surface indentation. Phys. Rev. B 1998, 58, 11085. [Google Scholar] [CrossRef]
  41. Mahata, A.; Sikdar, K. Molecular dynamics simulation of nanometer scale mechanical properties of hexagonal Mg—Li alloy. J. Magnes. Alloy. 2016, 4, 36–43. [Google Scholar] [CrossRef] [Green Version]
  42. Meraj, M.; Pal, S. Molecular dynamics based study of high temperature deformation process of nanocrystalline Ni-Nb alloy under tensile loading condition. Mater. Today Proc. 2019, 11, 740–746. [Google Scholar] [CrossRef]
  43. Li, Z.; Gao, Y.; Zhan, S.; Fang, H.; Zhang, Z. Molecular dynamics study on temperature and strain rate dependences of mechanical properties of single crystal Al under uniaxial loading. AIP Adv. 2020, 10, 075321. [Google Scholar] [CrossRef]
  44. Xu, R.-G.; Song, H.; Leng, Y.; Papanikolaou, S. A Molecular Dynamics Simulations Study of the Influence of Prestrain on the Pop-In Behavior and Indentation Size Effect in Cu Single Crystals. Materials 2021, 14, 5220. [Google Scholar] [CrossRef]
  45. Xu, J.L.; Bao, L.Z.; Liu, A.H.; Jin, X.J.; Tong, Y.X.; Luo, J.M.; Zhong, Z.C.; Zheng, Y.F. Microstructure, mechanical properties and superelasticity of biomedical porous NiTi alloy prepared by microwave sintering. Mater. Sci. Eng. C 2015, 46, 387–393. [Google Scholar] [CrossRef]
  46. Galimzyanov, B.N.; Mokshin, A.V. Mechanical response of mesoporous amorphous NiTi alloy to external deformations. Int. J. Solids Struct. 2021, 224, 111047. [Google Scholar] [CrossRef]
Figure 1. Initial configuration of TiAl alloy. Gray and pink balls represent Ti and Al atoms, respectively.
Metals 11 01760 g001
Figure 2. Engineering strain-stress curve for uniaxial tensile loading of TiAl alloy in the <001> direction. The black and red circles represent the loading process at 10 and 300 K, respectively.
Metals 11 01760 g002
Figure 3. Engineering strain-stress curve for uniaxial compressive loading of TiAl alloy in the <001> direction. The black and red circles represent the loading process at 10 and 300 K, respectively.
Metals 11 01760 g003
Figure 4. Structural evolution for uniaxial tensile loading of TiAl alloy in the <001> direction. The black and red circles represent the loading process at 10 and 300 K, respectively.
Metals 11 01760 g004
Figure 5. Atomic configuration for uniaxial tensile loading of TiAl alloy in the <001> direction at (a) 10 K and (b) 300 K. The atoms are colored according to the centrosymmetry parameter values calculated for the fcc crystal structure.
Metals 11 01760 g005
Figure 6. Vacancy number for uniaxial tensile loading of TiAl alloy in the <001> direction. The black and red circles represent the loading process at 10 and 300 K, respectively.
Metals 11 01760 g006
Figure 7. Structural evolution for uniaxial compressive loading of TiAl alloy in the <001> direction. The black and red circles represent the loading process at 10 and 300 K, respectively.
Metals 11 01760 g007
Figure 8. Atomic configuration for uniaxial compressive loading of TiAl alloy in the <001> direction at (a) 10 K and (b) 300 K. The atoms are colored according to the centrosymmetry parameter values calculated for the fcc crystal structure.
Metals 11 01760 g008
Figure 9. Vacancy number for uniaxial compressive loading of TiAl alloy in the <001> direction. The black and red circles represent the loading process at 10 and 300 K, respectively.
Metals 11 01760 g009
Figure 10. Partial radial distribution function gij for uniaxial (a) tensile and (b) compressive loading of TiAl alloy in the <001> direction. The black, red, and green lines represent the TiTi, TiAl, and AlAl pairs, respectively.
Metals 11 01760 g010aMetals 11 01760 g010b
Table 1. The Young’s Modulus E and ultimate strength σmax for uniaxial tensile and compressive loading of TiAl alloy in the <001> direction at 10 and 300 K.
LoadingT (K)E (GPa)σmax (GPa)
Tensile10180.0 a; 182.0 b; 172.2 c25.8 a
300168.5 a; 178 b; 157.8 c 17.7 a
Compression10 145.9 a39.2 a
30089.2 a31.3 a
a this calculation; b from ref. [21]; c from ref. [25].
Publisher’s Note: MDPI stays neutral with regard to jurisdictional claims in published maps and institutional affiliations.

