Article

Kinetic and Interaction Studies of Adenosine-5′-Triphosphate (ATP) Hydrolysis with Polyoxovanadates

by
Francisco de Azambuja
*,
Nele Steens
and
Tatjana N. Parac-Vogt
*
Department of Chemistry, KU Leuven, Celestijnenlaan 200F, 3001 Leuven, Belgium
*
Authors to whom correspondence should be addressed.
Metals 2021, 11(11), 1678; https://doi.org/10.3390/met11111678
Submission received: 23 September 2021 / Revised: 15 October 2021 / Accepted: 19 October 2021 / Published: 21 October 2021
(This article belongs to the Special Issue The Biological Applications of Metals and Metal Complexes)

Abstract

:
The reactivity of polyoxovanadates towards adenosine-5′-triphosphate (ATP) hydrolysis at pH 2, 4, 6 and 7 is reported. Detailed kinetic investigation of ATP hydrolysis in the presence of polyoxovanadates was performed through multinuclear nuclear magnetic resonance (NMR) spectroscopy. In general, rate acceleration of up to five orders of magnitude was observed in the presence of vanadates compared to spontaneous ATP hydrolysis, with the greatest acceleration observed for reactions carried out at pH 2. Interestingly, the effectiveness of vanadates in promoting ATP hydrolysis decreased as the pH of the reaction solution increased; nevertheless, at pH = 7, the rate increase of one order of magnitude in comparison to blank reactions was still observed. Interactions between vanadate species in solution and ATP were investigated by means of 31P and 51V NMR spectroscopy, and this pointed towards the preferential interaction of vanadium with the phosphate groups rather than other regions of the ATP molecule.

1. Introduction

The bioactivity and medicinal chemistry of polyoxometalates are of great interest for the development of inorganic-based drugs, given their stability in physiological conditions, great structural variability and versatile properties [1,2,3,4,5,6]. Accordingly, a thorough understanding of their reactivity towards biomolecules is key to elucidate the potential mechanisms through which these drugs act. In this context, several aspects of the fundamental reactivity of vanadium species toward biomolecules are still unclear, despite the well-known bioactivity of vanadium compounds [7,8,9,10]. In our previous work, we have unveiled the phosphodiesterase activity of polyoxovanadates toward DNA model substrates [11,12]. Here, we advance this study by addressing the reactivity of polyoxovanadates towards adenosine-5′-triphosphate (ATP) hydrolysis.
ATP plays a central role in the metabolism of living cells [13]. Nucleotides, especially the adenine-containing ones, are substrates for a large number of enzymes responsible for the transfer of phosphoryl or nucleotidyl groups. Moreover, ATP is a key metabolite of the glycolytic pathway, serving as the main ‘energy carrier’ throughout the body and providing the required energy for several enzymatic transformations. For example, the formation, replication and cleavage of nucleic acid polymers require the presence of ATP. Furthermore, ATP also plays a role in challenging diseases such as cancer because the high growth rate of cancer cells makes them more dependent on ATP than noncancerous cells [14,15,16]. Therefore, identifying compounds able to quickly modulate the supply of ATP under physiological conditions should assist in the development of more efficient therapies for diseases widely recognized as problematic to treat.
Various divalent metal ions such as Cu2+, Zn2+, Mn2+ and Cd2+ have been reported to catalyze ATP dephosphorylation, including valuable investigations to clarify the mechanism of metal-promoted ATP hydrolysis [17,18,19,20]. However, most of these reactions were performed at high temperatures of up to 80 °C. On the other hand, phosphate ester hydrolysis catalyzed by molybdates has been highly efficient, occurring even at room temperature [21,22,23,24]. Therefore, given the similarities between molybdates and vanadates [25], and the metabolic relevance of ATP as whole, we set out to investigate in detail the reactivity of vanadates towards ATP hydrolysis, aiming to contribute to a better understanding of polyoxometalates’ biological activity. Specifically, ATP hydrolysis kinetics at pH 2, 4, 6 and 7 and temperatures of 25–50 °C were followed by a newly developed 31P NMR-based method, and key vanadate–ATP interactions were investigated by means of different heteronuclear NMR spectroscopy techniques.

2. Materials and Methods

Unless otherwise noted, reagents were purchased from commercial sources and used as received. Reactions were monitored by 31P and 51V NMR spectra recorded on a Bruker Avance III HD 400 and a Bruker Avance II+ 600 spectrometer (Bruker, Billerica, MA, USA). All 31P-NMR spectra were recorded in the presence of an external reference of H3PO4 85% v/v (0 ppm). When phosphate was expected as a reaction product, trimethyl phosphate (TMP) was used as a reference in order to avoid the overlap with phosphoric acid. 51V NMR spectra were externally referenced with an aqueous solution of 1 M sodium metavanadate at pH 12, which contains the anion VO43− (δ = −535.7 ppm). Reactions were performed without any precautions against air.
Synthesis [HxPV14O42](9−x)− (PV14): PV14 was synthesized based on a previously published procedure, as follows [26]: A ~4:1 molar ratio Na3VO4:H3PO4 was mixed by Na3VO4 (1.47 g, 7.99 mmol) and H3PO4 85% (0.154 mL, 2.24 mmol) in 10 mL H2O. The pH was adjusted to pH 2.3 using concentrated HCl, and the solution was maintained at this pH and room temperature for a couple of days. After, NaCl 4M (10 mL, 40 mmol) was added, and the reaction mixture was cooled in the fridge overnight. The precipitate formed was collected by filtration, and recrystallized twice from acidic aqueous solutions (pH 2.3) upon addition of NaCl 4M. 51V- and 31P-NMR spectra were in agreement with a previous report (Figure S6) [26].

3. Results

The reactivity of polyoxovanadates toward ATP was studied in water under different conditions of pH, temperature and concentration. Generally, the same consecutive reaction pattern was observed for all the studied ATP hydrolysis reactions. Initially, ATP is hydrolyzed to ADP and free inorganic phosphate (Pi), and in a second step, ADP is further hydrolyzed to AMP, resulting in the liberation of another free phosphate ion (Scheme 1).
Reactions were monitored by 31P NMR spectroscopy as the ATP substrate, and corresponding products ADP, AMP and Pi could be clearly identified in the spectra (Figure 1). Resonances of ATP and AMP were identified by comparing them with 31P-NMR spectra of commercially available samples, and ADP was identified based on 31P-NMR resonances previously reported [27]. However, accurate integration of the AMP, ADP, ATP and free phosphate peaks was difficult to obtain due to the overlapping of their 31P-NMR resonances (Figure 1b), prompting us to develop a method to monitor the concentration of all species as a function of time, in order to be able to study the reaction kinetics.

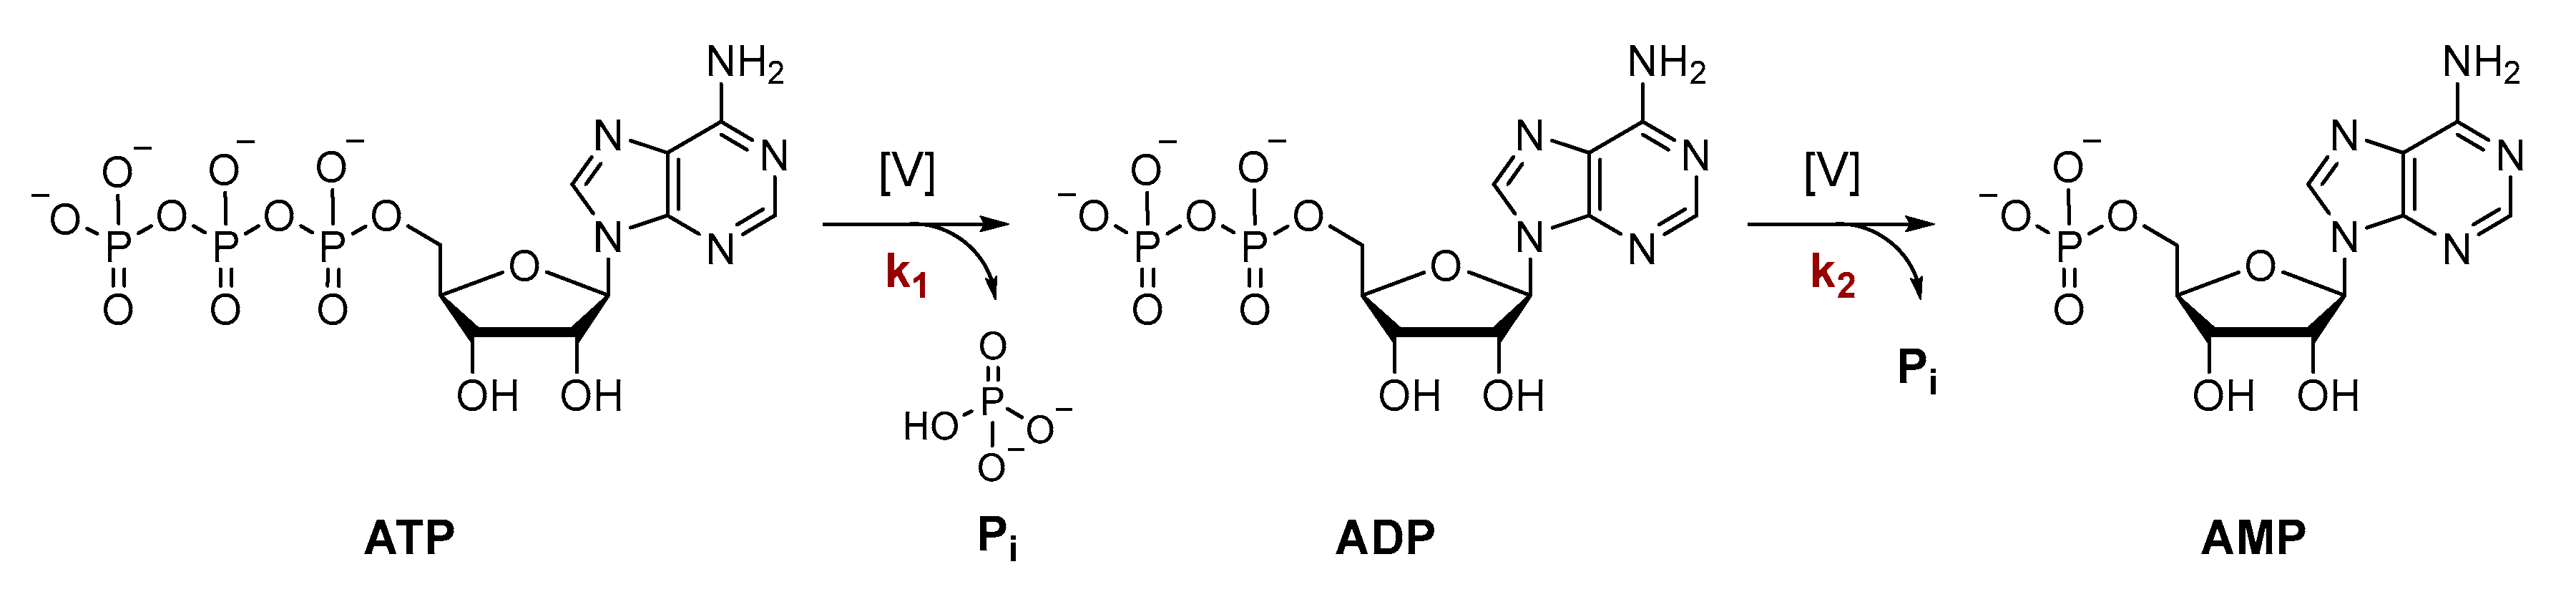
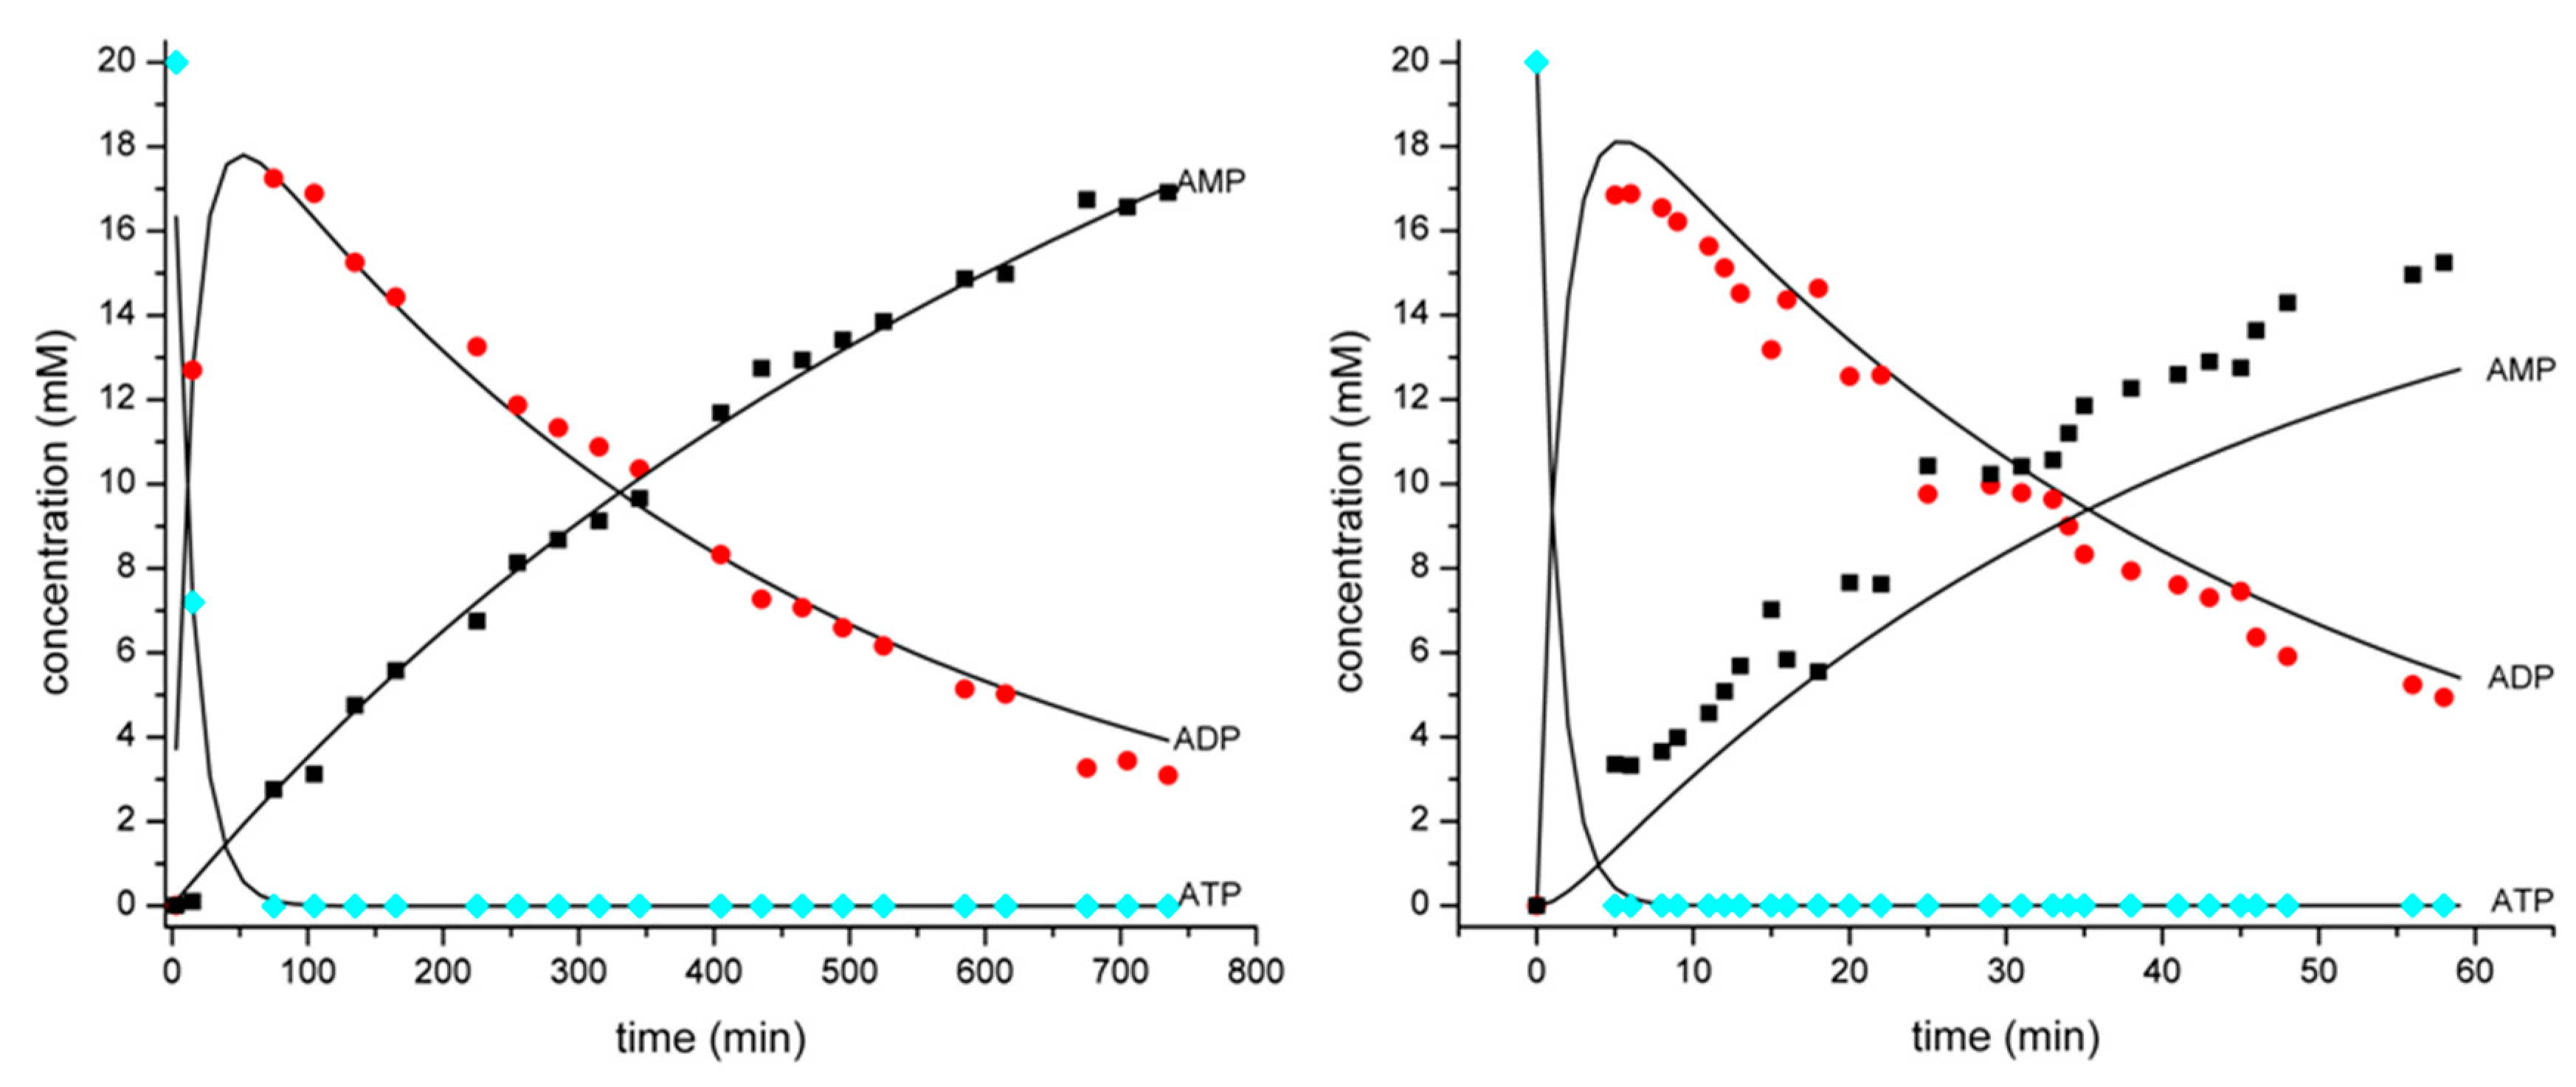
3.1. Development of a Method for the Determination of Rate Constants of ATP Hydrolysis

Representative 31P-NMR spectra obtained during the course of a hydrolytic reaction between ATP and vanadate at pH 7.0 and 50 °C are shown in Figure 2. Given the absence of isolated peaks for ADP, which overlaps with ATP, and the overlapping of AMP and Pi at longer times, we defined three ‘integration regions’ (Table 1). The integral value of the peaks in region 1 (R1) corresponds to the sum of the concentrations of AMP and Pi. Region 2 (R2) represents the sum of the concentrations of two phosphate groups each of ADP and ATP. Region 3 (R3) corresponds to the β-phosphate group of ATP (Figure 1a).
Accurate concentrations at a given time point could be obtained using the integration regions defined in Table 1, considering the overall reaction scheme (Scheme 1). When ATP is hydrolyzed to ADP, equivalent amounts of inorganic phosphate (Pi−1) and ADP are released. A second equivalent of inorganic phosphate (Pi−2) is released upon further hydrolysis of ADP to AMP. Considering that two Pi are formed for each AMP molecule in the solution, the concentration of inorganic phosphate is equal to [ADP] + 2[AMP], and the integration of R1, corresponding to [AMP] + [Pi], can be rewritten as 3 [AMP] + [ADP]. In R2, the integration value corresponds to 2 [ADP] + 2 [ATP] because each signal corresponds to two P nuclei (one from each substrate). Finally, the integral value of R3 is equal to the concentration of [ATP]. Rearranging these relationships to be expressed as a function of the AMP, ADP, ATP and Pi concentrations affords the following equations:
[ATP] = R3
[ ADP ] = R 2 2 [ ATP ] 2
[ AMP ] = R 1 [ ADP ] 3
[Pi] = R1 − [AMP]
Using the 31P-NMR spectra obtained during the hydrolysis of ATP, Equations (1)–(4) allowed us to obtain the concentration profiles as a function of reaction time for each of the species in the reaction. The rate coefficients k1 and k2 of ATP hydrolysis could then be determined by fitting each curve to its respective rate equation (Equations (5)–(7)). These equations were derived considering the consecutive nature of the reaction (see SI for details).
[ ATP ] = [ A ] 0 e k 1 t
[ ADP ] = [ A ] 0 ( k 1 k 2 k 1 ) ( e k 1 t e k 2 t )
[ AMP ] = [ A ] 0 ( [ A ] 0 k 2 k 2 k 1 e k 1 t ) + ( [ A ] 0 k 1 k 2 k 1 e k 2 t )
To illustrate these calculations, an example is shown for a solution containing 20 mM ATP and 20 mM decavanadate (V10) at pH 2 (Table 2). The reaction was performed in the presence of 600 mM NaCl in H2O/D2O at 25 °C. In Table 2, the integration values in R1, R2 and R3 are converted to concentrations using Equations (1)–(3) (the integration values are given only for a few reaction times). The concentrations of ATP, AMP and ADP are plotted as a function of time, resulting in a typical concentration plot for a consecutive reaction similar to the one observed in Figure 3. Fitting these plots to Equations (5)–(7) of the main text affords rate constants. Under the aforementioned conditions, this method furnishes k1 = 1.13 × 10⁻³ s−1 and k2 = 4.67 × 10⁻⁵ s−1 for the ATP hydrolysis.

3.2. Effect of pH and Temperature on the Dephosphorylation of ATP

With a suitable kinetic model in hand, we moved on to study the kinetics of ATP hydrolysis in the presence of polyoxovanadates under different conditions of pH and temperature (Figure 3). A summary of the rate constants observed is given in Table 3. For these studies, solutions containing an initial 200 mM concentration of vanadate and 600 mM NaCl were used [12]. The pH of the solutions was varied from 2 to 7. Under these conditions, the V4, V5 or V10 polyoxovanadate forms are the major components in the solution, and their concentration is dependent on the acidity of the solution [12]. These species are likely the ones present in the solution at the beginning of the reactions. The initial concentration of ATP was 20 mM, which means that, for conditions featuring V10, the concentration ratio of ATP and V10 is 1:1, while, for conditions where V4 and V5 are present, their concentrations are up to two times higher than that of ATP.
In general, increasing the temperature increased the rates observed under all pH conditions, while the pH had a strong effect on the reactivity. Representative concentration profiles for two reactions at pH = 2, differing in their temperature, obtained from 31P NMR spectra analogous to those in Figure 2, are given in Figure 3. Inspection of these concentration profiles reveals an induction period for the appearance of AMP, with the point of inflection in the concentration of AMP matching the maximum concentration of ADP. This suggests that AMP is formed from ADP hydrolysis rather than directly from ATP de-pyrophophorylation, underlining the consecutive character of the reaction. When the shapes of the plots are examined, it is clear that, in this case, k1 > k2, which is confirmed by the k1 and k2 values obtained by the least-squares fitting to Equations (5)–(7) (Table 3).
Similar concentration profiles were observed for reactions carried out in less acidic solutions (Figures S1–S3). However, smaller k1/k2 ratios were obtained, and the AMP product was present in the solution even before the intermediate ADP reached its peak concentration. In addition, the maximum concentrations of ADP were circa 8–10 mM, while at pH 2, nearly 18 mM of ADP was present in the solution. This contrast in the concentration profile of ADP reflects the differences between the k1 and k2 values for reactions. While, at pH = 2, k1 was larger than k2 regardless of the reaction temperature, for other pH conditions, k1 ≈ k2, except for the relatively small difference between k1 and k2 values at room temperature for pH = 4.
Blank experiments carried out in the absence of Na3VO4 confirmed that the vanadate species in the solution promoted the reaction, and excluded the possibility that ATP hydrolysis was caused by the presence of acidic protons at the pH values and temperatures evaluated (Table S1). In general, rates in the presence of vanadates were up to five orders of magnitude faster when compared to the blank reactions, with the greatest acceleration observed for reactions carried out at pH = 2. Interestingly, the effectiveness of vanadates in promoting ATP hydrolysis decreased as the pH of the reaction solution increased, and at pH = 7, the presence of vanadates sped up hydrolysis by only one order of magnitude in comparison to blank reactions.

3.3. NMR Study of ATP–Vanadate Interactions

To gain a better understanding about the reactivity differences observed in the reactions above, the interactions between ATP and vanadates were probed through a series of nuclear magnetic resonance (NMR) experiments. At first, 31P- and 51V-NMR snapshots of the reaction mixtures before mixing the reagents, and at different time intervals, were observed. Then, the binding between ATP and vanadates was addressed by several 51V NMR, including compounds structurally related to ATP.

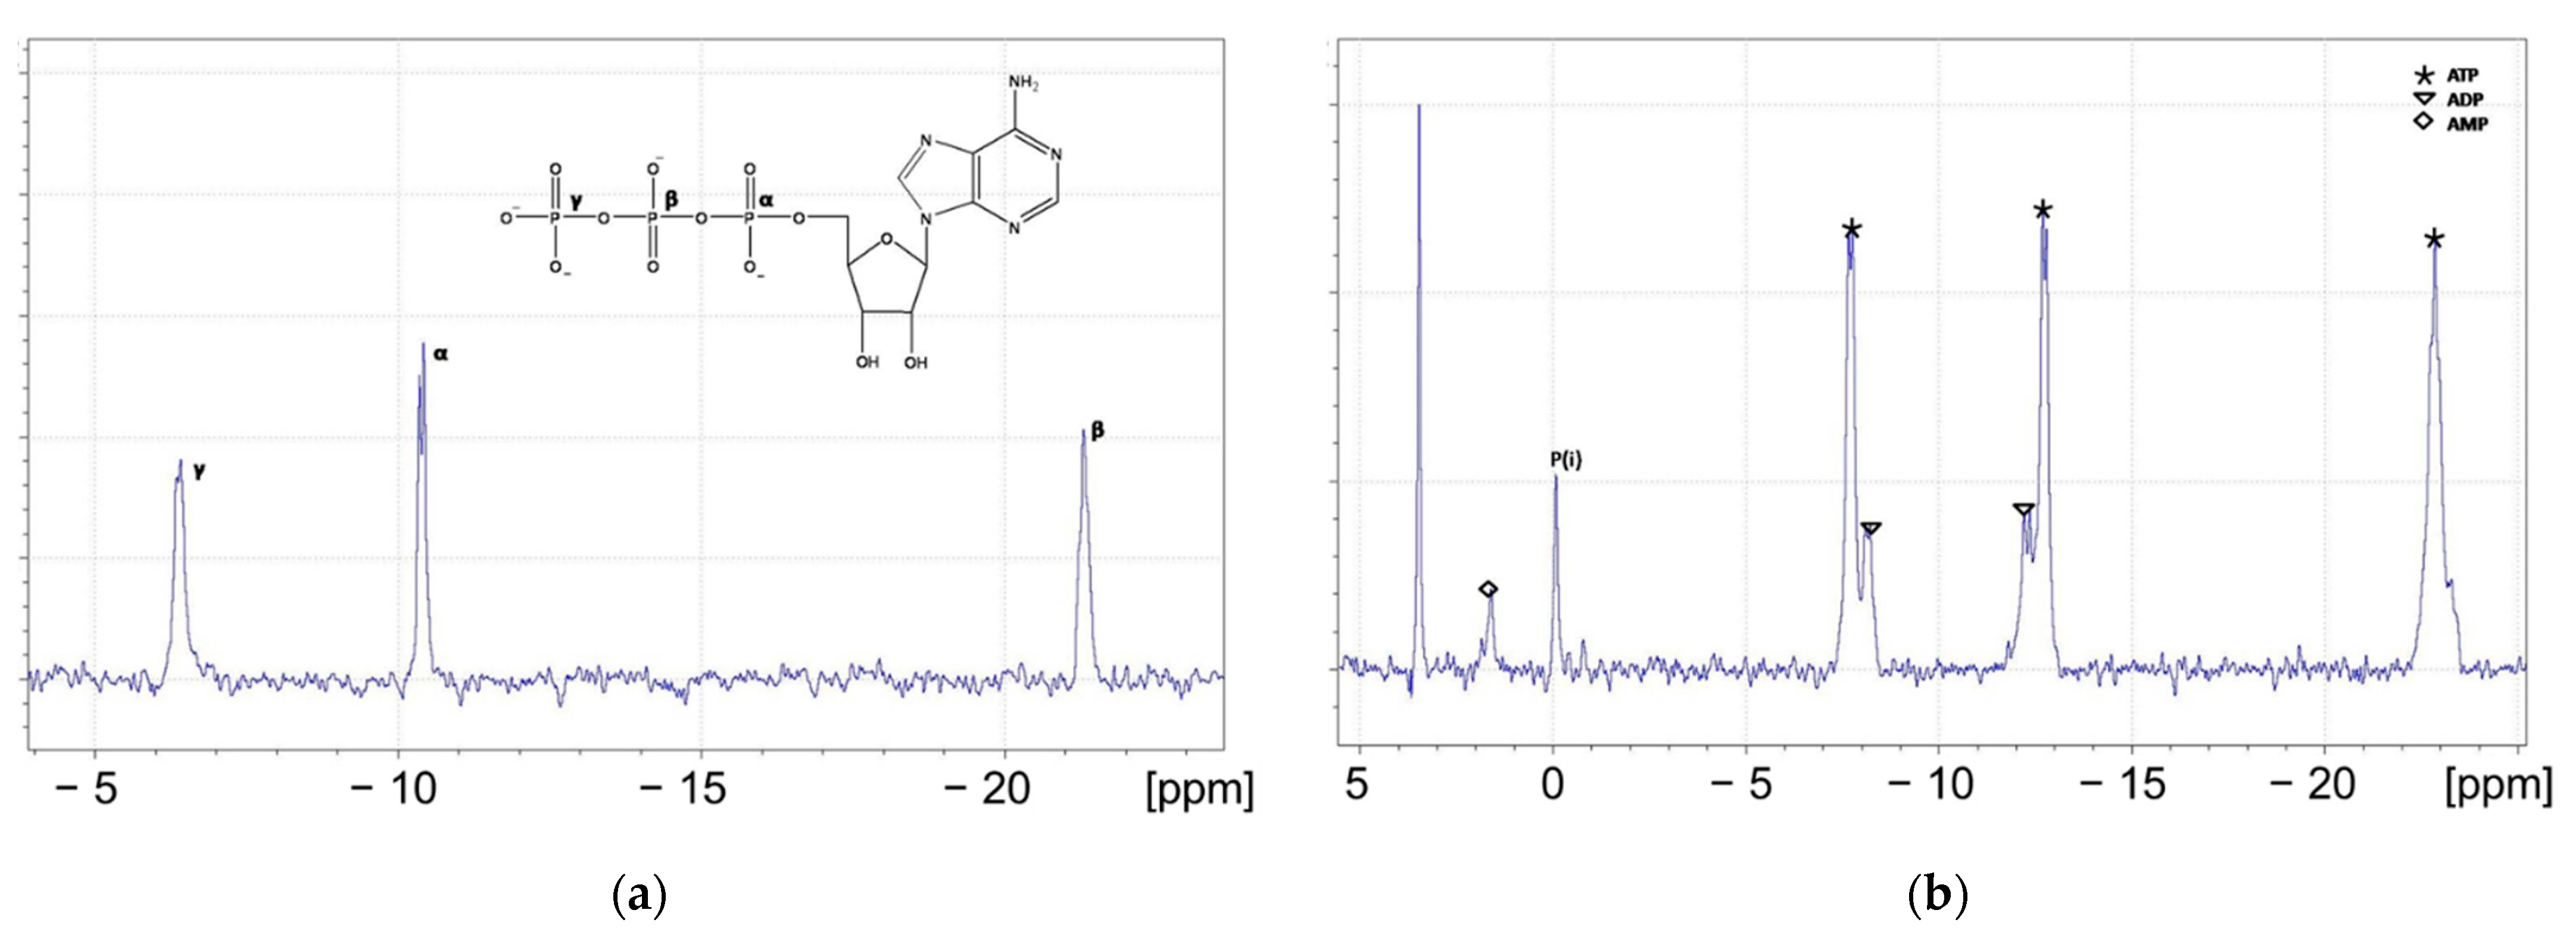
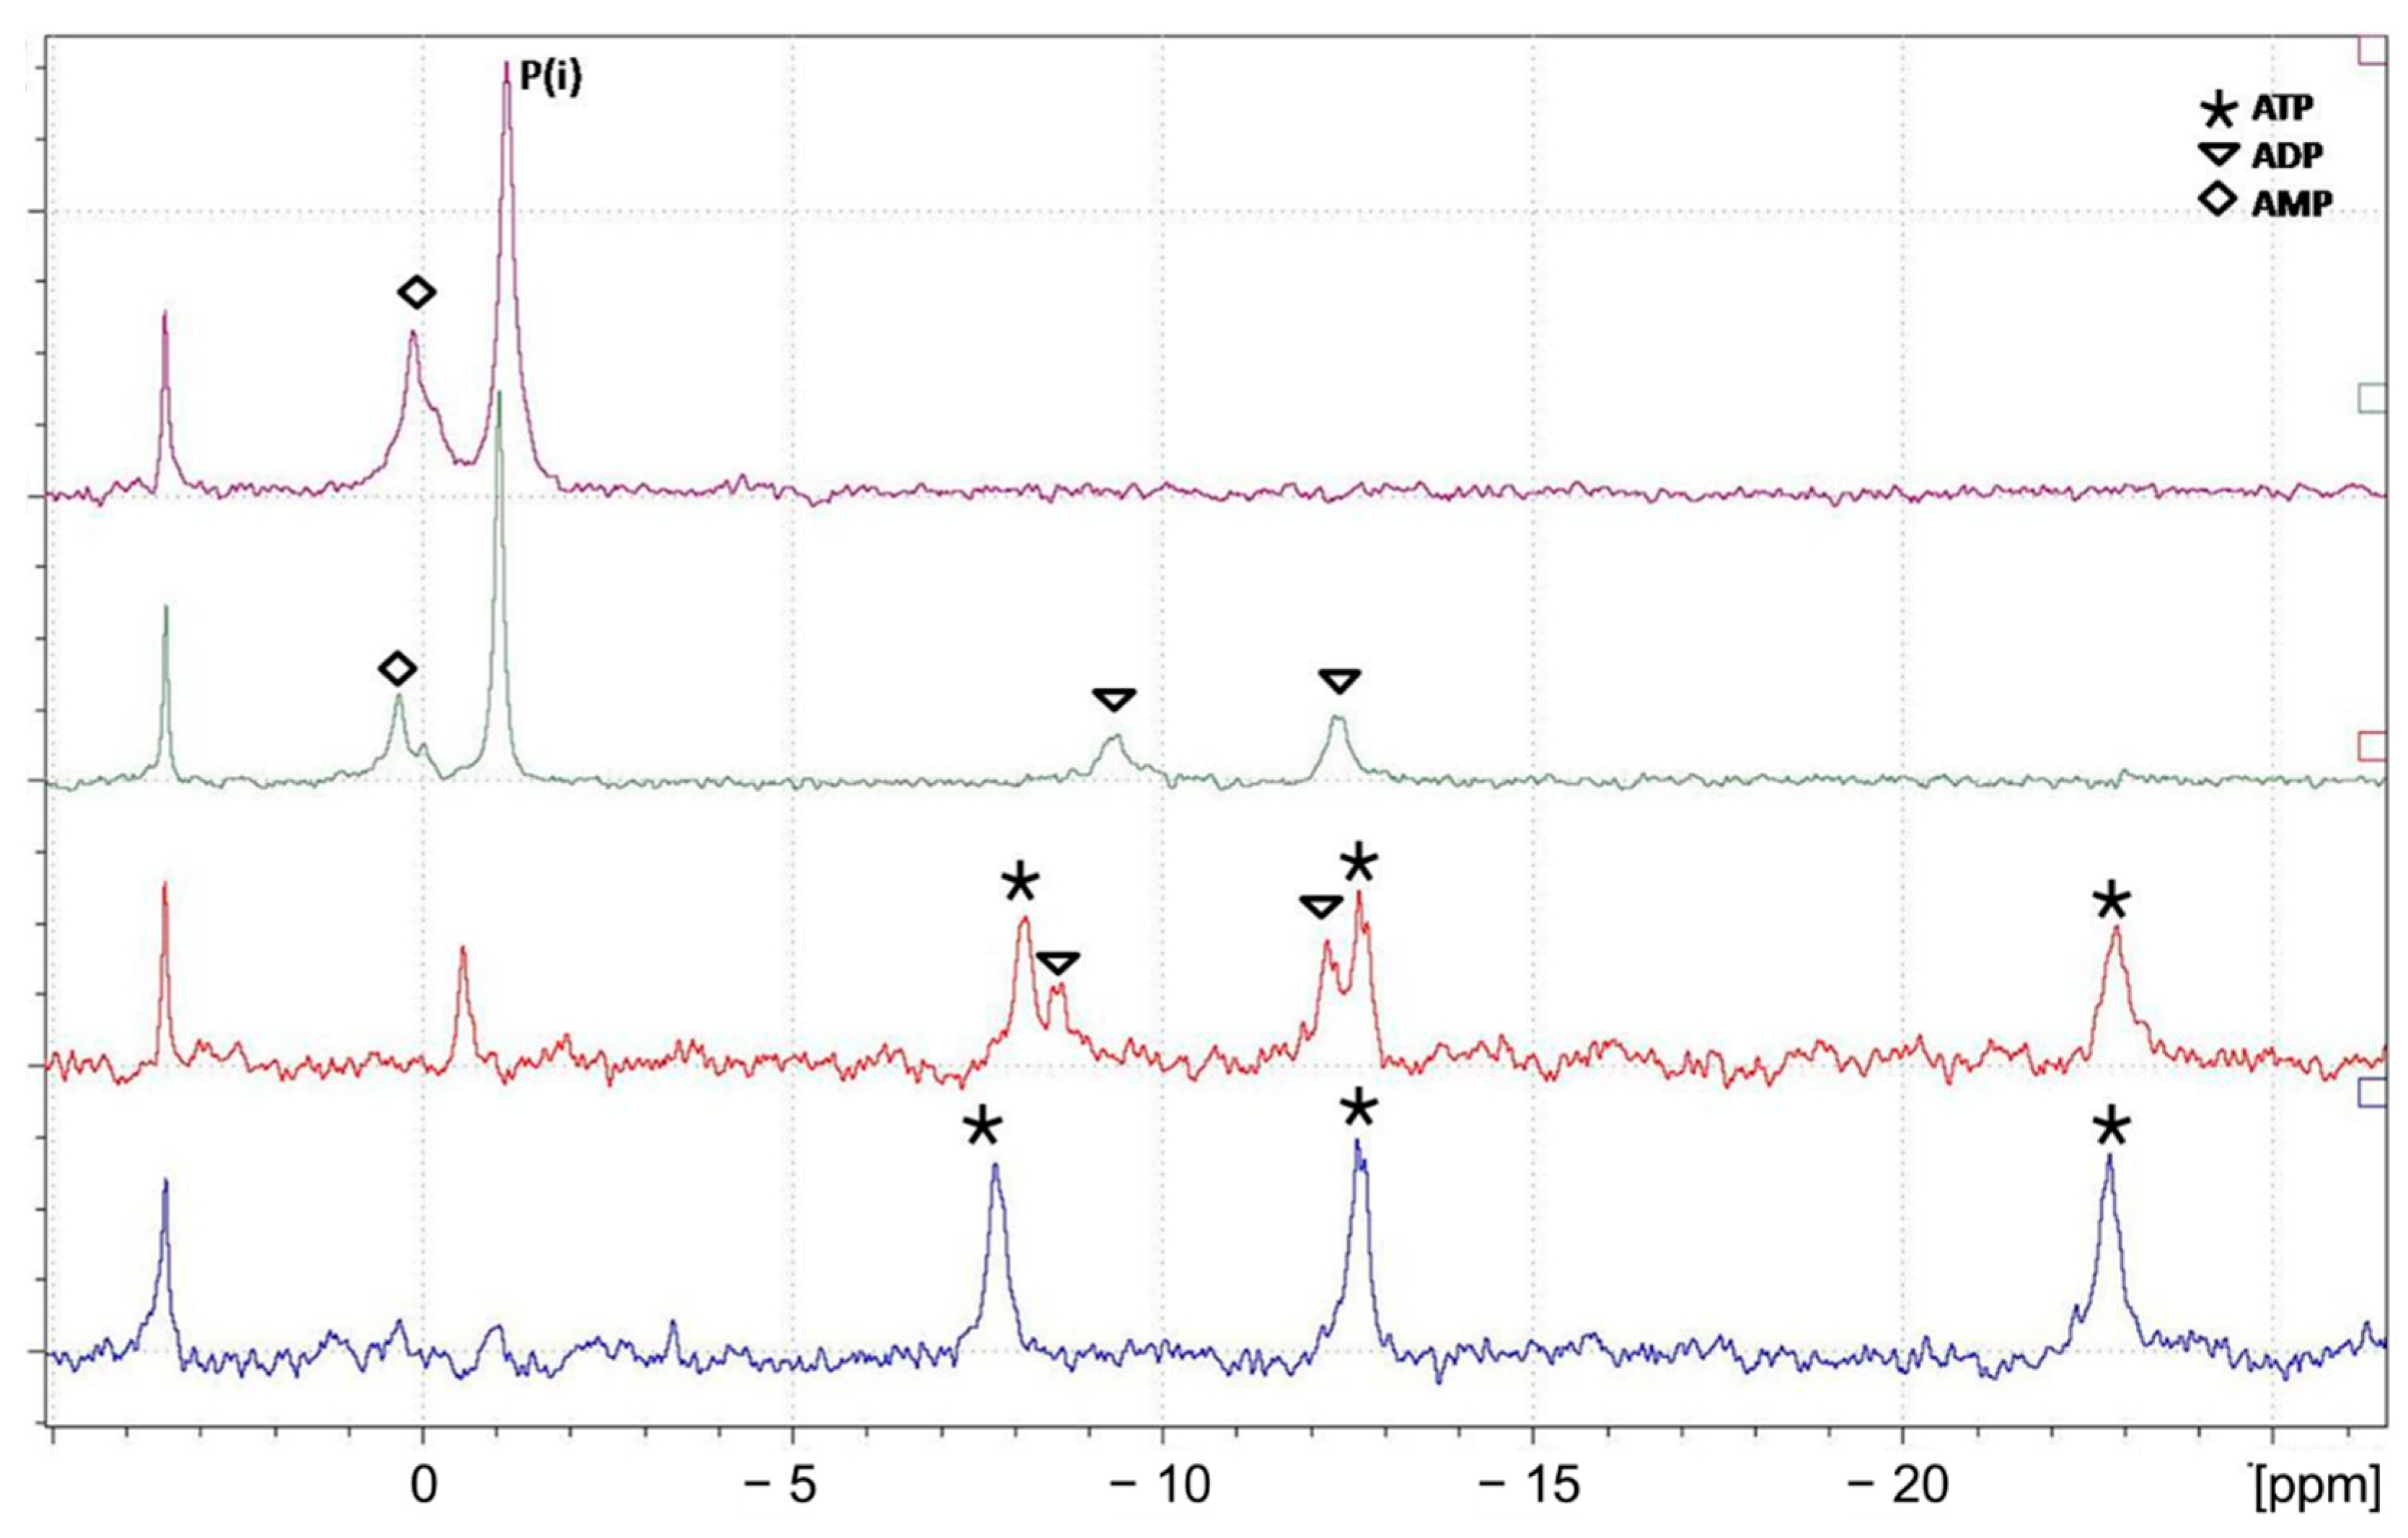
3.3.1. 31P and 51V NMR snapshots of reaction mixtures

At pH 2, both 31P- and 51V-NMR showed that the interaction occurs as soon as the reagents are mixed, and products can be detected already at the early stages of the reaction (Figures S4 and S5). All 31P-NMR spectra recorded before mixing had the same appearance regardless of the temperature (Figure S4a). However, a clear difference was observed for the spectra taken immediately after mixing both compounds (Figure S4b). At 25 °C, the resonances belonging to the γ- and β-phosphates of ATP were clearly broadened upon the addition of vanadate. Moreover, the spectra at 37 °C and 50 °C already showed the appearance of ADP and inorganic phosphate reaction products, even though they were recorded immediately after mixing (Figure S4c,d). 51V-NMR spectra recorded immediately after mixing did not reveal any broadening or shifting of decavanadate (V10) resonances, the only vanadate species present, upon mixing with ATP. However, at 37 °C and 50 °C, the appearance of a small new peak at −543 ppm was detected, likely originating from the complexation of a vanadate species to the phosphate groups of ATP or ADP (Figure S5) [28,29]. This new peak could be the result of a complexation of free vanadate, formed in minor amounts from V10 during the reaction, and free phosphate groups (see Section 3.3.3). In this case, it is possible that signals pointing to the presence of free vanadate were overlapped by the sodium metavanadate solution used as a reference.
51V-NMR spectra recorded at different time increments during ATP hydrolysis show that new vanadate species are formed as the reaction progresses (Figure 4). Again, the broad resonance signal at −543 ppm could be observed (peak ‘1’ in Figure 4). However, it disappeared upon completion of ATP hydrolysis. Furthermore, a new set of 51V-NMR resonances at −536, −579 and −596 ppm (peaks assigned with ‘2’ in Figure 4) could be detected at the end of the hydrolytic reaction. These resonances mostly likely refer to the trans-bicapped Keggin tetradecavanadophosphate species [HxPV14O42](9−x)− (PV14), which has been reported to be formed in freshly mixed solutions of NaHPO4 and NaVO3 over a wide range of V:P ratios (0.5–14) and pH (1–6) [30,31]. In order to verify this, PV14 was independently synthesized [26]. Comparison of the 51V-NMR spectrum of the PV14 species (Figure S6) to the 51V-NMR spectrum recorded after the hydrolysis of ATP (Figure 4) revealed that PV14 is indeed formed as a side product upon ATP hydrolysis in the presence of vanadate.
31P NMR spectra before and after mixing at pH 4 and 6 were similar to the ones observed at pH 2, while at pH 7, the ATP signal shifted and no peak broadening was detected. At pH 4 and 6, mixing ATP with vanadate species resulted in the broadening of the γ- and β-phosphate resonances of ATP (Figures S7 and S9). This broadening is especially prominent at pH 6 and 50 °C, while ATP spectra recorded in the absence of vanadate showed little effect of temperature on the peak width. On the other hand, 31P-NMR spectra recorded before and after mixing ATP with the vanadate species present at pH 7 revealed that the γ- and β-phosphate resonances of ATP shifted upon the addition of vanadate (Figure S11). The γ-phosphate shifted from 2 ppm at room temperature to 2.5 ppm at 50 °C, and the β-phosphate shifted from 1.2 ppm at room temperature to 2.2 ppm at 50 °C. However, no significant peak broadening as observed for the reactions performed at pH 2, 4 and 6 was detected.
51V-NMR spectra recorded at pH 4, 6 and 7 before and after the addition of ATP revealed distinct behaviors depending on the pH of the solution. Before ATP addition, 51V-NMR confirmed that different vanadate species are present in each condition [25]. At pH 4, only decavanadate (V10) was detected, while at pH 6, tetravanadate (V4), pentavanadate (V5) and V10 were detected, and at pH 7, only V4 and V5 were present in the solution, consistent with our previous work [12]. After ATP addition at pH 4, no significant differences could be detected immediately after mixing (Figure S8). Upon completion of hydrolysis, only the spectra recorded at 50 °C showed a new peak; specifically, a small and broad resonance appeared at −580 ppm, which likely corresponded to PV14 as observed at pH 2. On the other hand, minimal peak broadenings were detected immediately after ATP addition at pH 6 (37 °C) and pH 7 (50 °C), while prominent broadenings for V4 and V5 resonances were observed after ca. 70 h of reaction in both cases (Figures S10 and S12, respectively).

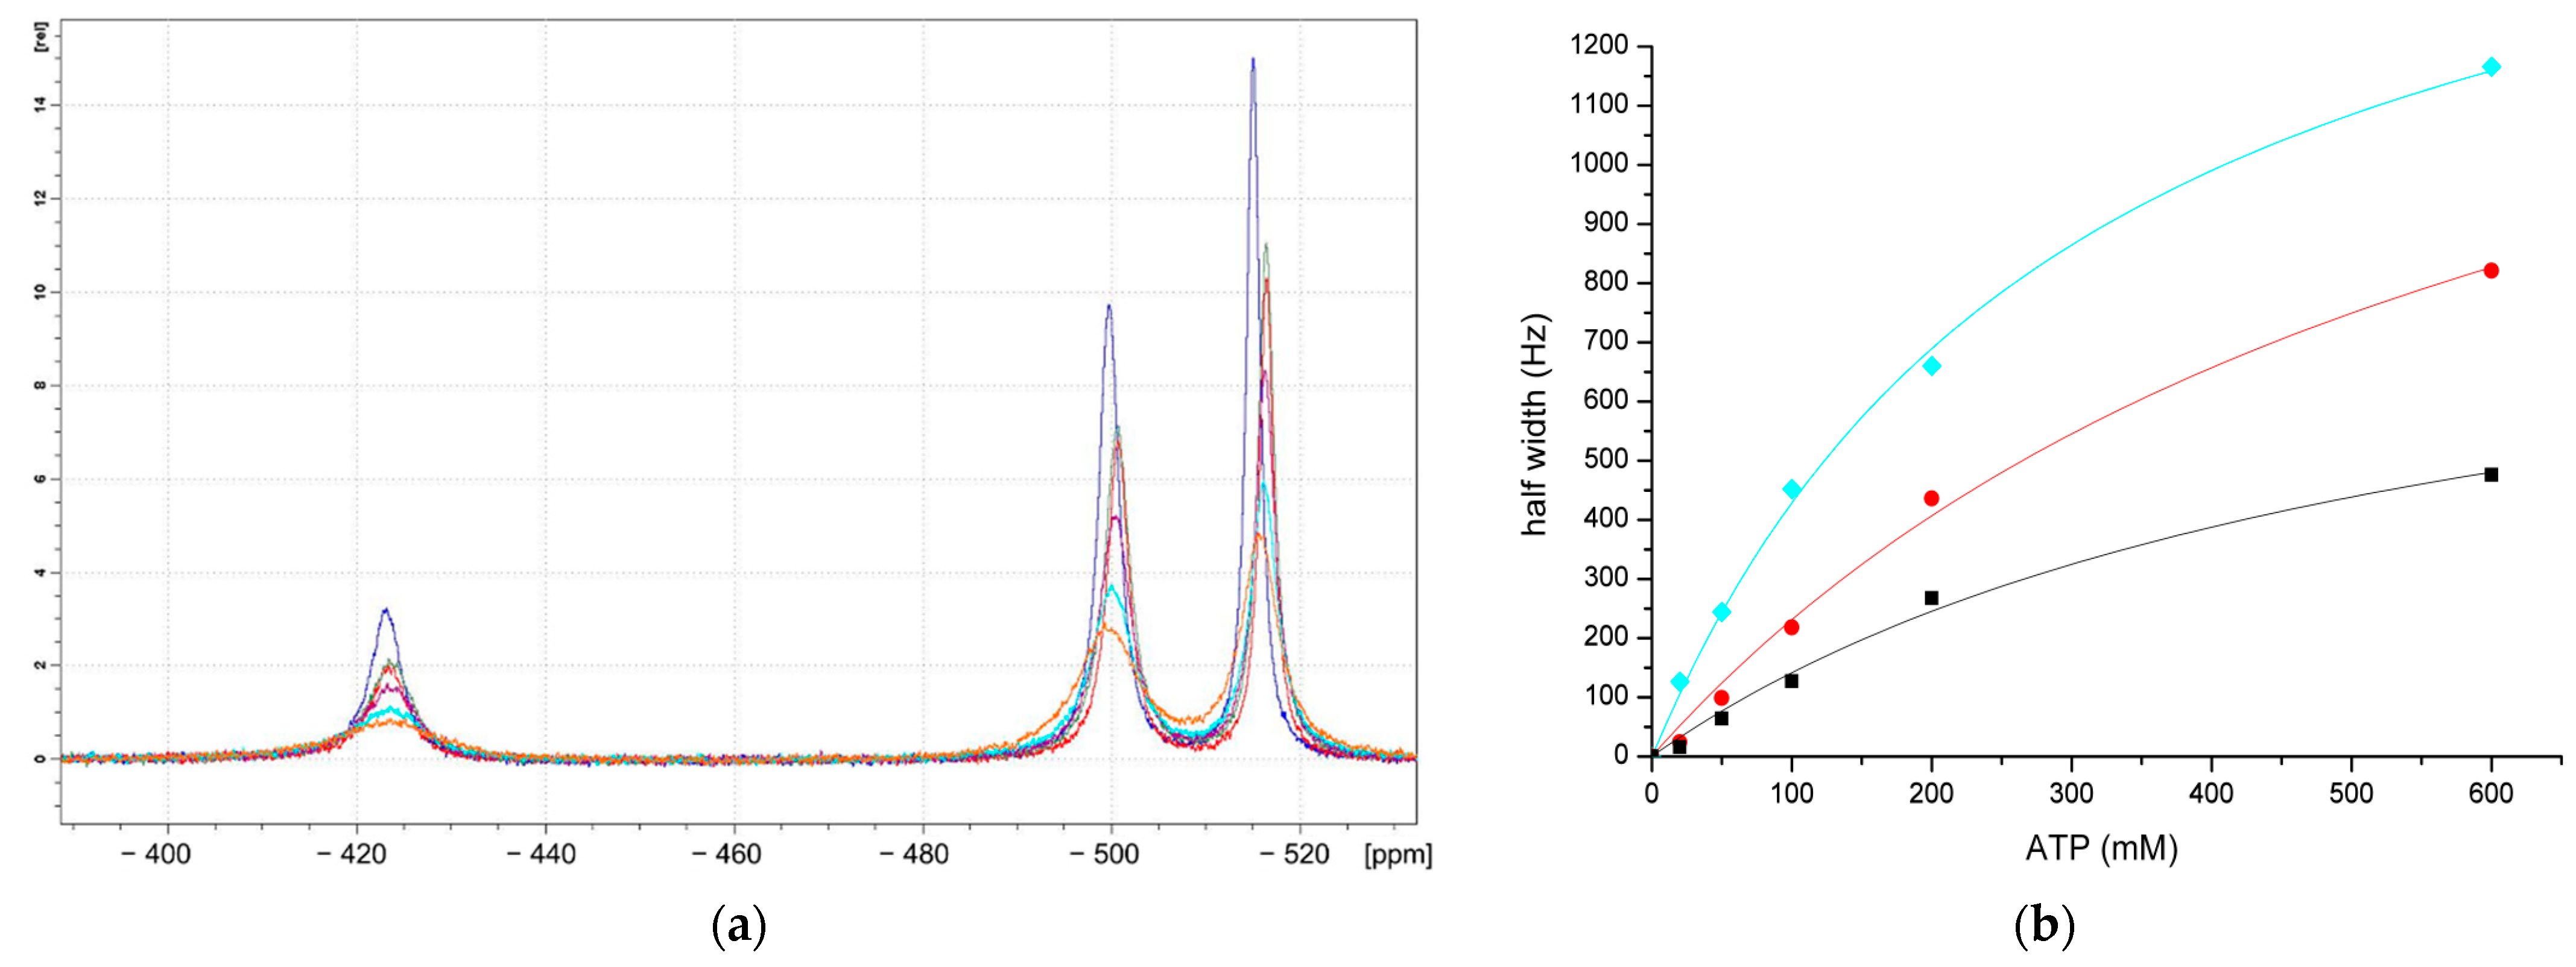
3.3.2. Binding between ATP and Decavanadate Studied by 51V-NMR Spectroscopy

To evaluate the binding between ATP and decavanadate, we assessed the 51V-NMR shifts upon the addition of ATP. 51V-NMR spectra were recorded for a series of solutions in which the decavanadate concentration was kept constant (20 mM) and the ATP concentration was increased from 0 to 600 mM (Figure 5). The addition of ATP had a minor effect on the 51V chemical shifts, but the effect on the line broadening of 51V resonances was more prominent, indicating that the ATP and vanadate interactions in the solution are very dynamic as the peak broadening upon the increase in ATP concentration can be interpreted as an increase in the rate of chemical exchange between bound ATP and free decavanadate.

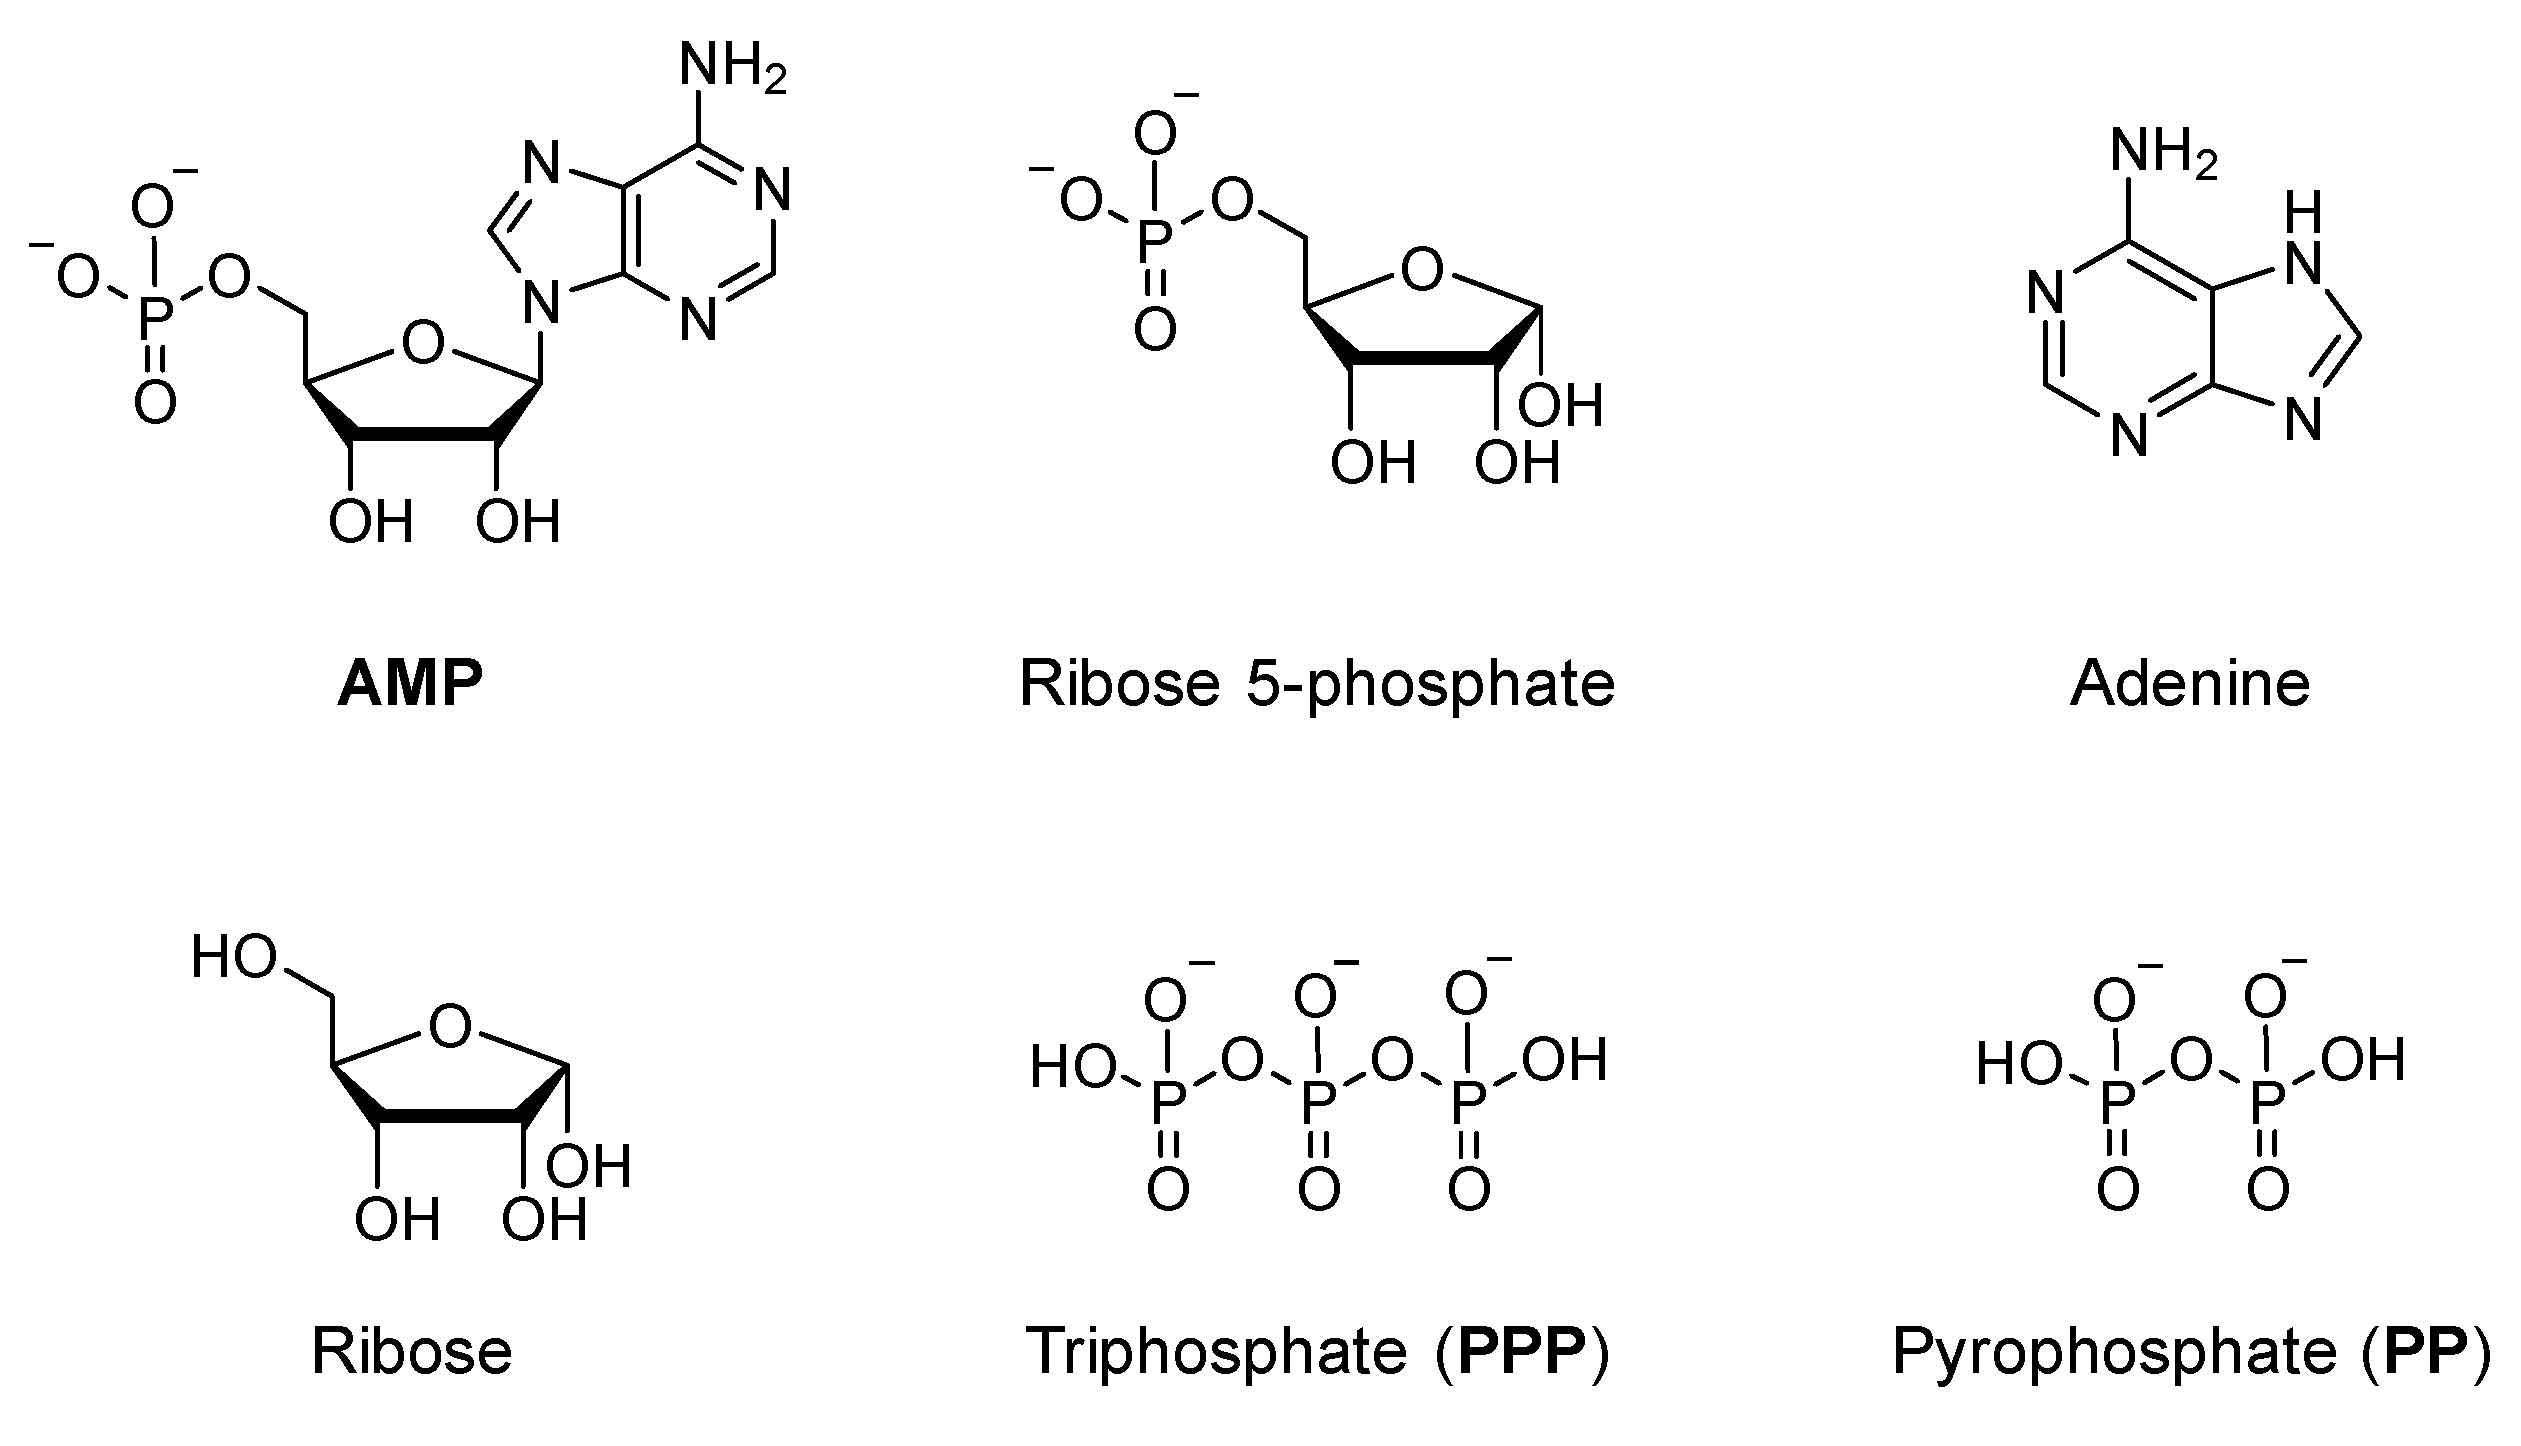
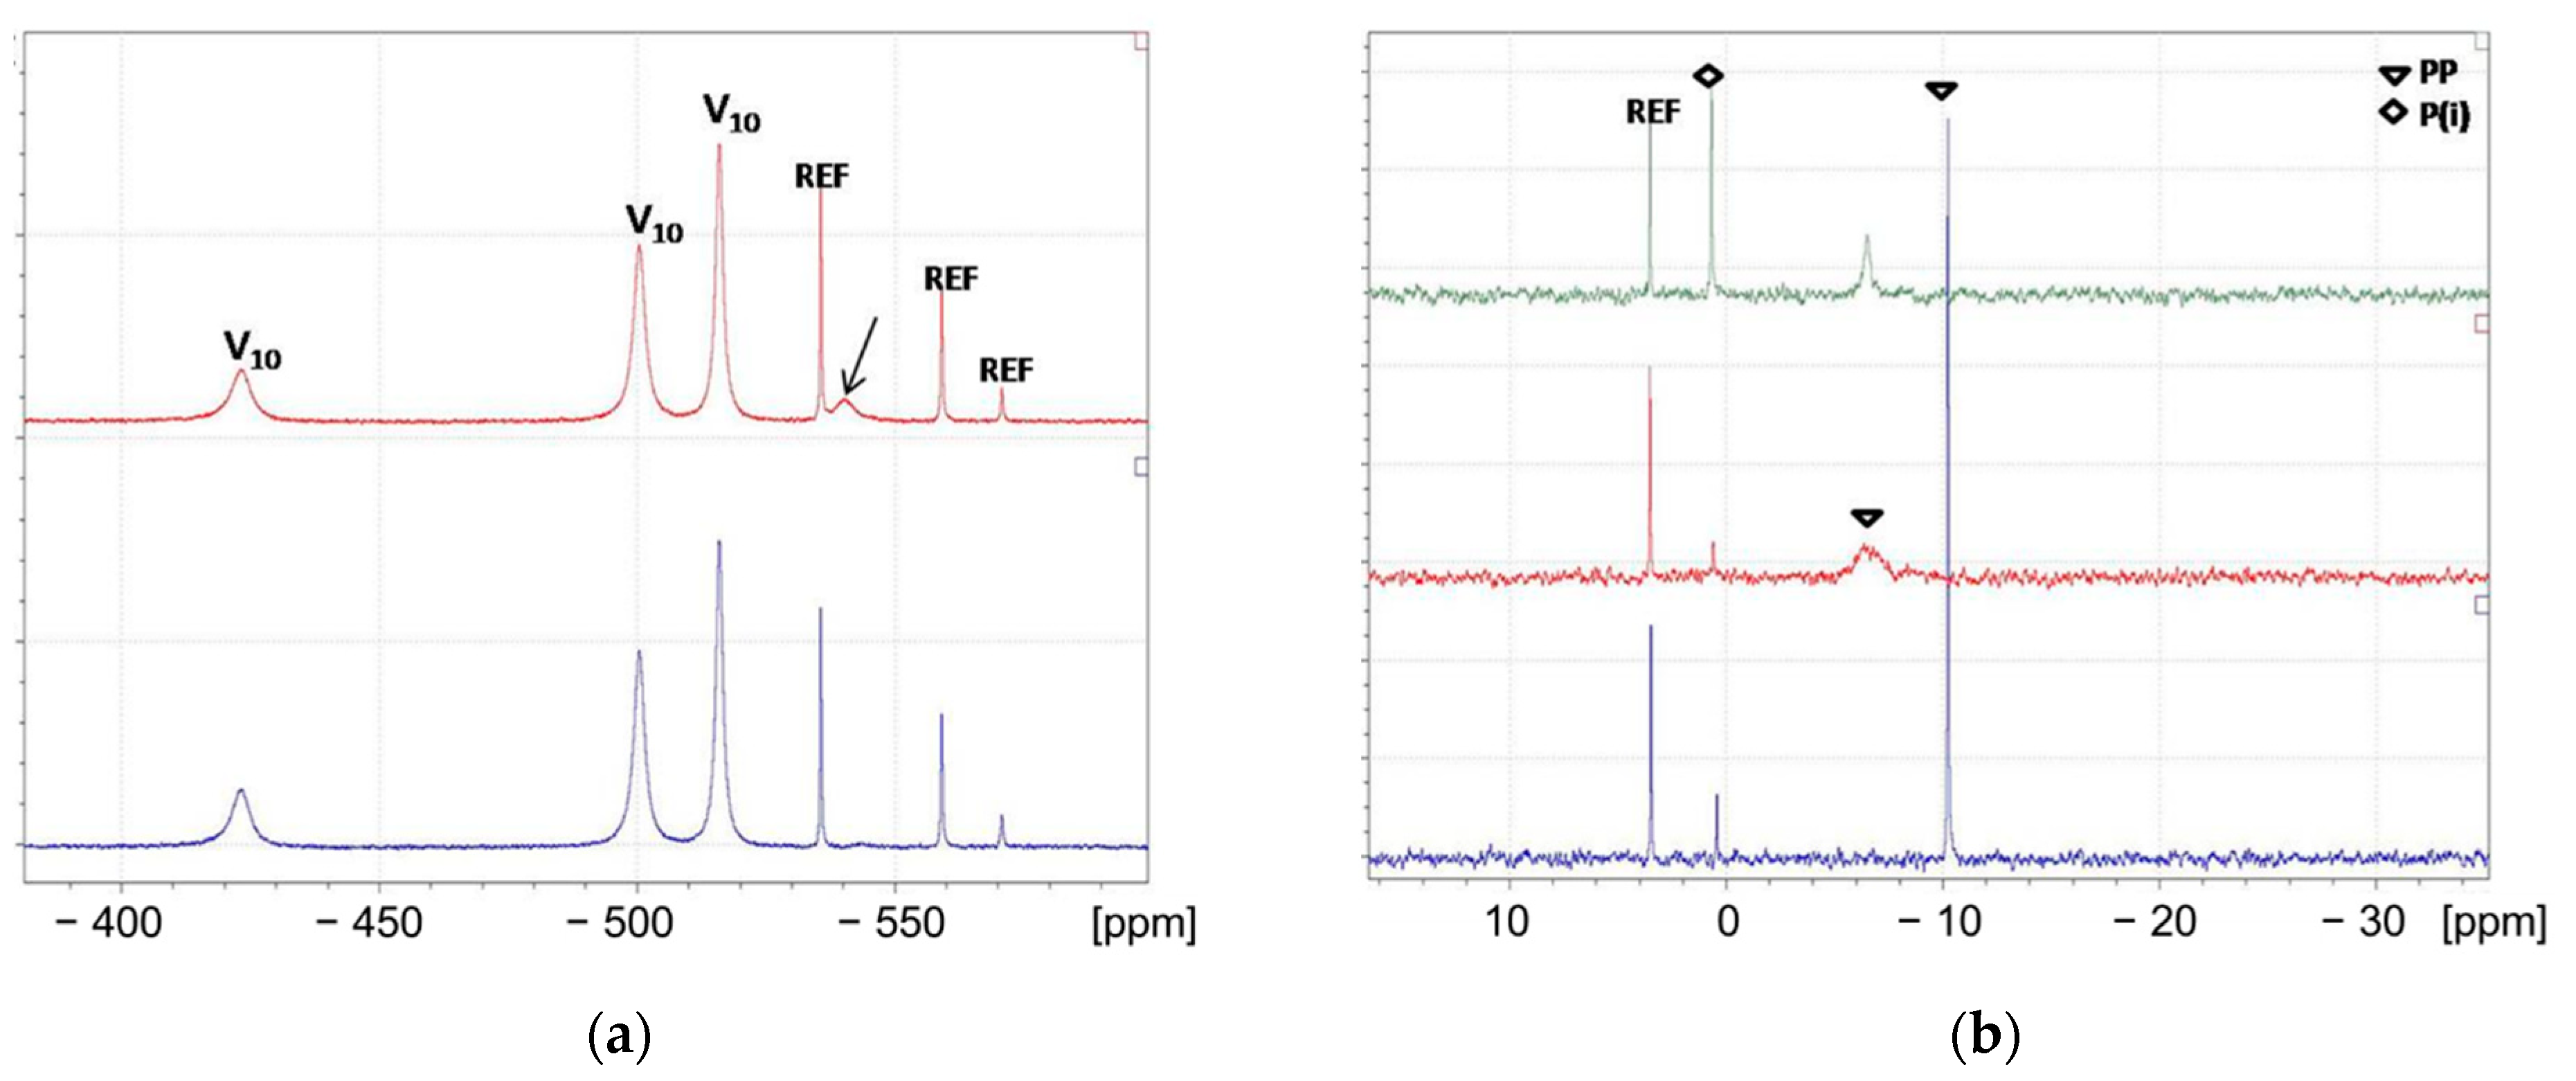
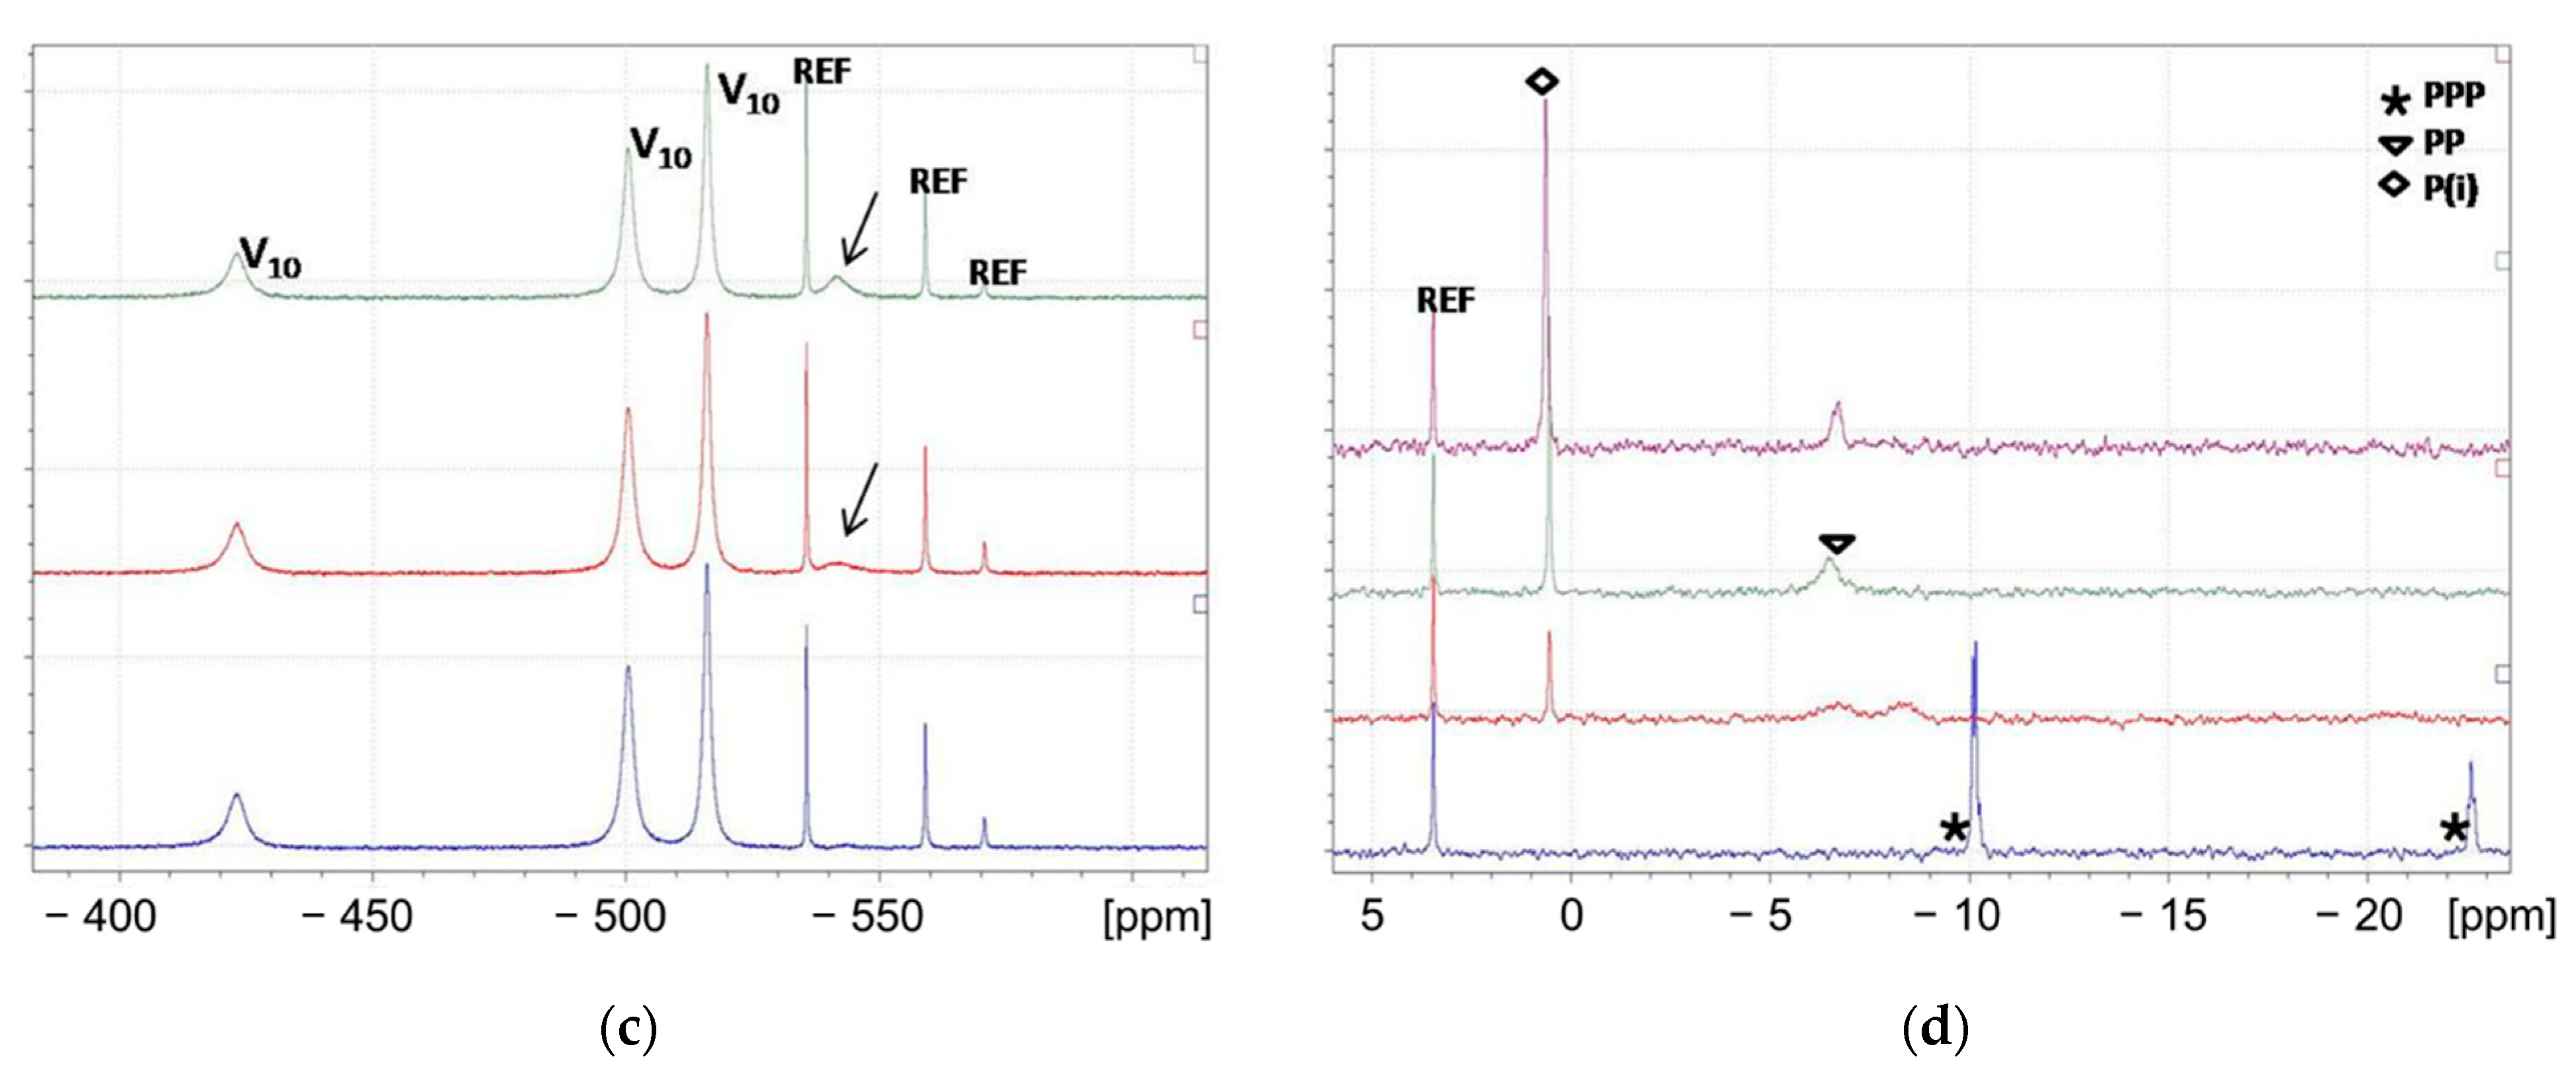
3.3.3. Interaction between Vanadates and Other Substrates Structurally Related to ATP

ATP molecules consist of three chemically different components, namely a ribose sugar, the nucleoside base adenosine and three phosphate groups. Since all three components can interact with vanadate, we examined the interaction between vanadate and smaller molecules bearing one or two of the components found in ATP by 51V- and 31P-NMR spectroscopy on solutions containing 20 mM decavanadate at pH 4 and at room temperature. The following compounds were studied: AMP, pyrophosphate (PP), triphosphate (PPP), ribose, adenine and ribose phosphate (Figure 6).
Inspection of the 51V-NMR spectra recorded before and immediately after the mixing of PP and PPP with vanadate revealed the presence of a new resonance around −540 ppm (Figure 7). This peak agrees well with the formation of cyclic bidentate and tridentate dianhydrides between vanadate and polyphosphate species reported previously [28,29]. The resonance at −540 ppm was more intense in the case of PP than in the case of PPP. Further, monitoring the PP and PPP solutions with decavanadate for possible phosphoanhydride hydrolysis over several days revealed the relatively fast hydrolysis of PPP to PP, which in turn slowly hydrolyzed to inorganic phosphate. Upon complete PPP hydrolysis to PP, the resonance at −540 ppm became more intense. Accordingly, PP was also slowly converted to inorganic phosphate in the presence of decavanadate.
AMP, ribose 5-phosphate, ribose and adenine did not alter the 51V-NMR spectra of decavanadate, suggesting that no significant interaction between these components and vanadates took place in the solution. No changes or hydrolysis were observed in both 51V- and 31P-NMR spectra upon mixing AMP and vanadate, even though broadened 31P resonances were observed for ribose 5-phosphate (Figure S13). No hydrolysis of the phosphoester bond in ribose phosphate was detected. Moreover, no evidence of ribose–vanadate interactions was detected by 51V-NMR for AMP, ribose 5-phosphate or only ribose, even though an interaction between monomeric vanadate and the 2,3-hydroxyl groups of ribose is described in the literature [32,33,34]. The 51V resonance expected for this type of complex appears at −520 ppm, and, therefore, it is also plausible that it overlaps with one of the V10 resonances. Finally, no changes in the 1H-NMR spectra of ribose and adenine could be detected, even after keeping the reaction mixture for several days, implying that decavanadate does not interact with these compounds.

4. Discussion

The major influence of pH on the reactivity is likely related to the large effect of the solution acidity in the nature of vanadate, and nucleotide species in the solution. Inspection of the k1 and k2 values shown in Table 3 and Table S1 clearly indicates that the rate accelerations for the hydrolysis of ATP to ADP and for the hydrolysis of ADP to AMP in the presence of vanadate significantly increase as the pH is lowered. For example, at pH 2, the acceleration factor for k1 at room temperature is nearly 25,000, while at pH 4, it is only around 300. In general, these reactivity differences match the overall charge variation in ATP and ADP in the solution, as different protonated forms of ATP and its hydrolysis products can occur in the solution depending on the pH (Table 4) [35,36,37]. For instance, ATP is completely deprotonated to ATP4− at pH 7, while, in the pH range between 4 and 6, HATP3− is largely present in the solution, and the diprotonated form H2ATP2− predominates at pH 2. In addition, the pKa values for the protonation of V10 around 5.5, 3.5 and 2 indicated that its negative character is partially neutralized at pH 2 and 4. V4 and V5 only exist in the completely deprotonated forms [38]. Therefore, the lowest negative charge of reactants at pH 2 would result in the smallest electrostatic repulsion between the vanadate and substrates, allowing them to interact more favorably and accelerating the reaction. On the other hand, less favorable interactions at higher pH values derived from the overall increase in the negative charge of all species are consistent with the lower reactivity observed at these conditions.
In addition to the overall protonation of species in the solution, the large influence of the solution acidity on the rates observed likely relates to the kinetic lability of vanadates in solution [25]. A previous study revealed that all oxygen atoms present in decavanadate exchange at similar rates with the oxygen from the bulk H2O, and that such exchange is much faster at lower pH [39]. Similar exchanges were also observed for V4 and V5 species [40]. Presumably, this kinetic lability results in the breaking apart and subsequent re-assembly of the cluster structure. A similar scenario has been recently described for a phosphate bond hydrolysis reaction mediated by [Mo7O24]6−, in which dimeric molybdates formed in situ were suggested as the true hydrolytic species [24]. Although the formation of new vanadate species was not observed by 51V NMR during the reactions, we hypothesize that the hydrolysis of ATP may result from the formation of mixed anhydrides between structurally related phosphate and vanadate groups, which would cause strain on the phosphoanhydride bonds, making them more susceptible to hydrolysis. As the condensation of metal oxo species is well-known to be favored in acidic solutions, the formation of mixed anhydrides species could also be favored under similar conditions, thus explaining the higher hydrolysis rates observed at lower pH.

5. Conclusions

In conclusion, we have the shown that ATP is smoothly hydrolyzed to AMP through a stepwise dephosphorylation in the presence of isopolyoxovanadates. Using a newly developed 31P-NMR-based method to follow the reaction kinetics, faster hydrolysis was observed as the temperature increased from 25 to 50 °C. A marked pH effect on the reactivity was also detected as larger rate accelerations were obtained for reactions conducted at lower pH values. This trend suggests that decavanadate species, which are predominant in acidic conditions, are more hydrolytically active towards ATP than cyclic tetra- and pentavanadate species dominant in neutral conditions. This may be due to the higher lability of the decavanadate structure, especially in acidic solutions, which may allow for more effective incorporation of the ATP phosphate groups into its skeleton. In accordance with this hypothesis, the trans-bicapped Keggin tetradecavanadophosphate species [HxPV14O42](9−x)− (PV14), presumably formed from the interaction between inorganic phosphate and decavanadate, was detected after hydrolysis reactions conducted in acidic conditions. Importantly, the formation of PV14 might work as a driving force of the reaction since it displaces the equilibrium towards the hydrolytic products. 31P- and 51V-NMR studies supported these findings, suggesting that ATP hydrolysis occurs due to the interaction of vanadates with the phosphate groups of ATP rather than other groups in the nucleoside unit. Such interactions would also be more favored in acidic conditions due to the overall greater protonation of species in the solution, which decreases the electrostatic repulsion between the reacting species.

Supplementary Materials

The following are available online at https://www.mdpi.com/article/10.3390/met11111678/s1, Concentration profiles, rate constants of spontaneous ATP hydrolysis, additional figures of NMR study.

Author Contributions

N.S.: experiments, data analysis, writing—original draft preparation; F.d.A.: data analysis, writing—original draft preparation; T.N.P.-V.: conceptualization, supervision, writing—review and editing. All authors have read and agreed to the published version of the manuscript.

Funding

F.d.A.: Research Foundation Flanders (FWO), grant 195931/1281921N.

Data Availability Statement

Data are contained within the article or supplementary material. Additional details about the data are also available on request from the corresponding author.

Acknowledgments

We thank KU Leuven and Research Foundation Flanders (FWO) for financial support. F.d.A. thanks the FWO for fellowship (195931/1281921N).

Conflicts of Interest

The authors declare no conflict of interest. The funders had no role in the design of the study; in the collection, analyses, or interpretation of data; in the writing of the manuscript, or in the decision to publish the results.

References

  1. Rhule, J.T.; Hill, C.L.; Judd, D.A.; Schinazi, R.F. Polyoxometalates in Medicine. Chem. Rev. 1998, 98, 327–358. [Google Scholar] [CrossRef]
  2. Yamase, T. Anti-tumor, -viral, and -bacterial activities of polyoxometalates for realizing an inorganic drug. J. Mater. Chem. 2005, 15, 4773–4782. [Google Scholar] [CrossRef]
  3. Arefian, M.; Mirzaei, M.; Eshtiagh-Hosseini, H.; Frontera, A. A survey of the different roles of polyoxometalates in their interaction with amino acids, peptides and proteins. Dalton Trans. 2017, 46, 6812–6829. [Google Scholar] [CrossRef]
  4. Bijelic, A.; Aureliano, M.; Rompel, A. The antibacterial activity of polyoxometalates: Structures, antibiotic effects and future perspectives. Chem. Commun. 2018, 54, 1153–1169. [Google Scholar] [CrossRef] [PubMed] [Green Version]
  5. Bijelic, A.; Aureliano, M.; Rompel, A. Polyoxometalates as Potential Next-Generation Metallodrugs in the Combat Against Cancer. Angew. Chem. Int. Ed. 2019, 58, 2980–2999. [Google Scholar] [CrossRef] [Green Version]
  6. Guedes, G.; Wang, S.; Santos, H.A.; Sousa, F.L. Polyoxometalate Composites in Cancer Therapy and Diagnostics. Eur. J. Inorg. Chem. 2020, 2020, 2121–2132. [Google Scholar] [CrossRef]
  7. Rehder, D. Biological and medicinal aspects of vanadium. Inorg. Chem. Commun. 2003, 6, 604–617. [Google Scholar] [CrossRef]
  8. Rehder, D. Influence of Vanadium Compounds on Cellular Functions. In Bioinorganic Vanadium Chemistry; John Wiley & Sons, Ltd.: Chichester, UK, 2008; pp. 157–201. [Google Scholar]
  9. Pessoa, J.C.; Etcheverry, S.; Gambino, D. Vanadium compounds in medicine. Coord. Chem. Rev. 2015, 301–302, 24–48. [Google Scholar] [CrossRef] [PubMed]
  10. Rehder, D. The (biological) speciation of vanadate(V) as revealed by 51V NMR: A tribute on Lage Pettersson and his work. J. Inorg. Biochem. 2015, 147, 25–31. [Google Scholar] [CrossRef]
  11. Steens, N.; Ramadan, A.M.; Parac-Vogt, T.N. When structural and electronic analogy leads to reactivity: The unprecedented phosphodiesterase activity of vanadates. Chem. Commun. 2009, 965–967. [Google Scholar] [CrossRef]
  12. Steens, N.; Ramadan, A.M.; Absillis, G.; Parac-Vogt, T.N. Hydrolytic cleavage of DNA-model substrates promoted by polyoxovanadates. Dalton Trans. 2010, 39, 585–592. [Google Scholar] [CrossRef]
  13. Walsh, C.T.; Tu, B.P.; Tang, Y. Eight Kinetically Stable but Thermodynamically Activated Molecules that Power Cell Metabolism. Chem. Rev. 2018, 118, 1460–1494. [Google Scholar] [CrossRef]
  14. Ahmann, F.R.; Garewal, H.S.; Schifman, R.; Celniker, A.; Rodney, S. Intracellular adenosine triphosphate as a measure of human tumor cell viability and drug modulated growth. In Vitro Cell. Dev. Biol. 1987, 23, 474–480. [Google Scholar] [CrossRef]
  15. Lu, X.; Errington, J.; Chen, V.J.; Curtin, N.J.; Boddy, A.V.; Newell, D.R. Cellular ATP Depletion by LY309887 as a Predictor of Growth Inhibition in Human Tumor Cell Lines. Clin. Cancer Res. 2000, 6, 271–277. [Google Scholar] [PubMed]
  16. Martin, D.S.; Bertino, J.R.; Koutcher, J.A. ATP Depletion + Pyrimidine Depletion Can Markedly Enhance Cancer Therapy: Fresh Insight for a New Approach. Cancer Res. 2000, 60, 6776–6783. Available online: https://cancerres.aacrjournals.org/content/canres/60/24/6776.full.pdf (accessed on 15 September 2021). [PubMed]
  17. Granot, J. Nuclear magnetic resonance studies of catecholamines. Ternary complexes with adenosine 5’-triphosphate and divalent metal ions in aqueous solution. J. Am. Chem. Soc. 1978, 100, 2886–2891. [Google Scholar] [CrossRef]
  18. Tetas, M.; Lowenstein, J.M. The Effect of Bivalent Metal Ions on the Hydrolysis of Adenosine Di- and Triphosphate*. Biochemistry 1963, 2, 350–357. [Google Scholar] [CrossRef]
  19. Wilson, J.E.; Chin, A. Chelation of divalent cations by ATP, studied by titration calorimetry. Anal. Biochem. 1991, 193, 16–19. [Google Scholar] [CrossRef]
  20. Granot, J.; Fiat, D. Proton magnetic resonance study of divalent metal ions binding to adenosine 5′-triphosphate. J. Am. Chem. Soc. 1977, 99, 70–79. [Google Scholar] [CrossRef]
  21. Absillis, G.; Cartuyvels, E.; Van Deun, R.; Parac-Vogt, T.N. Hydrolytic Cleavage of an RNA-Model Phosphodiester Catalyzed by a Highly Negatively Charged Polyoxomolybdate [Mo7O24]6− Cluster. J. Am. Chem. Soc. 2008, 130, 17400–17408. [Google Scholar] [CrossRef]
  22. Cartuyvels, E.; Absillis, G.; Parac-Vogt, T.N. Questioning the paradigm of metal complex promoted phosphodiester hydrolysis: [Mo7O24]6− polyoxometalate cluster as an unlikely catalyst for the hydrolysis of a DNA model substrate. Chem. Commun. 2008, 85–87. [Google Scholar] [CrossRef]
  23. Lokeren, L.V.; Cartuyvels, E.; Absillis, G.; Willem, R.; Parac-Vogt, T.N. Phosphoesterase activity of polyoxomolybdates: Diffusion ordered NMR spectroscopy as a tool for obtaining insights into the reactivity of polyoxometalate clusters. Chem. Commun. 2008, 2774–2776. [Google Scholar] [CrossRef]
  24. Martins, F.F.; Sánchez-González, Á.; Lanuza, J.; Miras, H.N.; Lopez, X.; Bandeira, N.A.G.; Gil, A. Probing the Catalytically Active Species in POM-catalysed DNA-model Hydrolysis. Chem. Eur. J. 2021, 27, 8977–8984. [Google Scholar] [CrossRef]
  25. Gumerova, N.I.; Rompel, A. Polyoxometalates in solution: Speciation under spotlight. Chem. Soc. Rev. 2020, 49, 7568–7601. [Google Scholar] [CrossRef] [PubMed]
  26. Selling, A.; Andersson, I.; Pettersson, L.; Schramm, C.M.; Downey, S.L.; Grate, J.H. Multicomponent Polyanions. 47. The Aqueous Vanadophosphate System. Inorg. Chem. 1994, 33, 3141–3150. [Google Scholar] [CrossRef]
  27. Ishikawa, E.; Yamase, T. 31P NMR and isothermal titration calorimetry studies on polyoxomolybdates-catalyzed hydrolysis of ATP. J. Inorg. Biochem. 2006, 100, 344–350. [Google Scholar] [CrossRef] [PubMed]
  28. Gresser, M.J.; Tracey, A.S.; Parkinson, K.M. Vanadium(V) oxyanions: The interaction of vanadate with pyrophosphate, phosphate, and arsenate. J. Am. Chem. Soc. 1986, 108, 6229–6234. [Google Scholar] [CrossRef]
  29. Geraldes, C.F.G.C.; Castro, M.M.C.A. Multinuclear NMR study of the interaction of vanadate with mononucleotides, ADP, and ATP. J. Inorg. Biochem. 1989, 37, 213–232. [Google Scholar] [CrossRef]
  30. Kato, R.; Kobayashi, A.; Sasaki, Y. The heteropolyvanadate of phosphorus. Crystallographic and NMR studies. Inorg. Chem. 1982, 21, 240–246. [Google Scholar] [CrossRef]
  31. Andersson, I.; Gorzsás, A.; Kerezsi, C.; Tóth, I.; Pettersson, L. Speciation in the aqueous H+/H2VO4−/H2O2/phosphate system. Dalton Trans. 2005, 3658–3666. [Google Scholar] [CrossRef]
  32. Richter, J.; Rehder, D. Modeling the Transition State of Biological Phosphoester Cleavage: The Complexation of Vanadate(V) by Nucleosides. Z. Naturforsch. B 1991, 46, 1613–1620. [Google Scholar] [CrossRef]
  33. Angus-Dunne, S.J.; Batchelor, R.J.; Tracey, A.S.; Einstein, F.W.B. The Crystal and Solution Structures of the Major Products of the Reaction of Vanadate with Adenosine. J. Am. Chem. Soc. 1995, 117, 5292–5296. [Google Scholar] [CrossRef]
  34. Elvingson, K.; Crans, D.C.; Pettersson, L. Speciation in Vanadium Bioinorganic Systems. 4. Interactions between Vanadate, Adenosine, and ImidazoleAn Aqueous Potentiometric and 51V NMR Study. J. Am. Chem. Soc. 1997, 119, 7005–7012. [Google Scholar] [CrossRef]
  35. Smith, R.M.; Martell, A.E.; Chen, Y. Critical evaluation of stability constants for nucleotide complexes with protons and metal ions and the accompanying enthalpy changes. Pure Appl. Chem. 1991, 63, 1015–1080. [Google Scholar] [CrossRef]
  36. Sigel, H.; Griesser, R. Nucleoside 5′-triphosphates: Self-association, acid–base, and metal ion-binding properties in solution. Chem. Soc. Rev. 2005, 34, 875–900. [Google Scholar] [CrossRef] [PubMed]
  37. De Stefano, C.; Milea, D.; Pettignano, A.; Sammartano, S. Modeling ATP protonation and activity coefficients in NaClaq and KClaq by SIT and Pitzer equations. Biophys. Chem. 2006, 121, 121–130. [Google Scholar] [CrossRef] [PubMed]
  38. Rehder, D. The Bioinorganic Chemistry of Vanadium. Angew. Chem. Int. Ed. 1991, 30, 148–167. [Google Scholar] [CrossRef]
  39. Comba, P.; Helm, L. The solution structure and reactivity of decavanadate. Helv. Chim. Acta 1988, 71, 1406–1420. [Google Scholar] [CrossRef]
  40. Crans, D.C.; Rithner, C.D.; Theisen, L.A. Application of time-resolved vanadium-51 2D NMR for quantitation of kinetic exchange pathways between vanadate monomer, dimer, tetramer, and pentamer. J. Am. Chem. Soc. 1990, 112, 2901–2908. [Google Scholar] [CrossRef]
Scheme 1. ATP is consecutively hydrolyzed to ADP and AMP in the presence of polyoxovanadates. [V] = polyoxovanadates (see text for details).
Metals 11 01678 sch001
Figure 1. (a) 31P-NMR spectrum of ATP (20 mM in H2O/D2O at pH 7.0). The phosphate resonances are assigned as shown in the structure of ATP. (b) Representative 31P-NMR spectra obtained during the course of the hydrolytic reaction between ATP and vanadate (pH 6.0, 25 °C, 4 days). Small shift in the resonances of ATP and reaction products are attributed to slight variations in solution acidity given the absence of buffer in the reaction mixture.
Metals 11 01678 g001
Figure 2. 31P-NMR spectra of a reaction mixture containing 20 mM ATP, 200 mM initial concentration Na3VO4 and 600 mM NaCl at pH 7.0 and 50 °C after 0 min (blue), 40 h (red), 90 h (green) and 7 days (purple).
Metals 11 01678 g002
Figure 3. Concentration of ATP, ADP and AMP (dots) in solution as a function of time for a reaction mixture containing ATP (20 mM) and Na3VO4 (initial concentration = 200 mM) in the presence of NaCl (600 mM) at pH 2 and 25 °C (left) or 50 °C (right). The concentration profiles were fitted to Equations (5)–(7) (lines, R2 25 °C—ATP: 0.9616, ADP: 0.9739, AMP: 0.9951; R2 50 °C—ATP: 0.9889, ADP: 0.8459, AMP: 0.8786).
Metals 11 01678 g003
Figure 4. Schematic representation of (a) decavanadate (V10) and (b) trans-bicapped Keggin tetradecavanadophosphate species [HxPV14O42](9−x)− (PV14). (c) 51V-NMR recorded spectra immediately after mixing (blue) and after 30 min (red) and 110 min (green) during hydrolysis of 20 mM ATP in the presence of 200 mM Na3VO4 and 600 mM NaCl at pH 2.0 and 37 °C show that two new vanadate species appear (marked as 1 and 2) in the reaction mixture. Spectra recorded at 25 °C and 50 °C were very similar to the one presented. The sharp resonances assigned with ‘REF’ belong to the external reference.
Metals 11 01678 g004
Figure 5. (a) Overlay of 51V-NMR spectra of 20 mM V10 at pH 4.0 (measured at room temperature) and 50 °C upon addition of ATP: 0 mM (blue), 20 mM (red), 50 mM (green), 100 mM (purple), 200 mM (cyan) and 600 mM (orange). (b) Plot of the half width of V10 resonances in 51V-NMR as a function of ATP concentration. The V10 resonance at −423 ppm is presented in cyan, the resonance at −500 ppm in red and the resonance at −516 ppm is presented in black.
Metals 11 01678 g005
Figure 6. Molecular structure of molecules structurally related to ATP.
Metals 11 01678 g006
Figure 7. 51V-NMR (left) and 31P-NMR spectra (right) recorded before (blue) and immediately after mixing (red) and after 2 days (green) of (a,c) 20 mM PP and (b,d) 20 mM PPP in the presence of Na3VO4 (200 mM) and NaCl (600 mM) at pH 4.0 and 25 °C. The arrow indicates the new resonance observed at −540 ppm (see text for discussion). A small amount of phosphate was already present as impurity in the starting product PP. The sharp resonances assigned with ‘REF’ belong to the external reference.
Metals 11 01678 g007aMetals 11 01678 g007b
Table 1. Integration regions in 31P-NMR spectra used to calculate the concentrations of AMP, ADP, ATP and free phosphate (Pi).
RegionChemical Shift RangeSpecies Monitored
R13 ppm → −0.5 ppmAMP, free phosphate (Pi)
R2−4 ppm → −12 ppmADP (2 P), ATP (γ-P, α-P)
R3−15 ppm → −25 ppmATP (β-P)
Table 2. Representative calculation of ATP, ADP and AMP concentrations for different time points based on the integration values of regions R1, R2 and R3 using the Equations (1)–(3) of the main text. ATP starting concentration = 20 mM.
QuantityReaction Time
t = 0t = 15 mint = 45 mint = 225 mint = 735 min
Integration values R100.2170.3750.5580.897
Integration values R20.6660.6630.6250.4420.103
Integration values R30.3330.120000
ATP (relative value)0.3330.120000
ADP (relative value)00.2120.3130.2210.052
AMP (relative value)00.0020.0210.1120.282
ATP (absolute value, mM)207.20000
ADP (absolute value, mM)012.7018.7513.253.09
AMP (absolute value, mM)00.101.256.7516.91
Table 3. Rate constants (s−1) for the hydrolysis of ATP with polyoxovanadates at pH = 2–7 and T = 25 °C, 37 °C and 50 °C 1.
pH25 °C37 °C50 °C
k1 (×10−5)k2 (×10−5)k1 (×10−5)k2 (×10−5)k1 (×10−5)k2 (×10−5)
21314.6717734107338.33
41.230.535.015.9211.6712.10
6n.d.n.d.1.151.253.532.35
7n.d.n.d.0.130.170.430.43
1 Conditions: ATP (20 mM), Na3VO4 (200 mM), NaCl (600 mM) in H2O, pH values were adjusted at room temperature.
Table 4. Protonation states of each compound at the pH values used for reactions.
CompoundpKa1/pKa2/pKa3pH 2pH 4pH 6pH 7
ATP6.5/4.0H2ATP2−H2ATP2−/HATP3−HATP3−ATP4−
ADP6.2/3.8H2ADPH2ADP/HADP2−HADP2−ADP3−
AMP6.1/3.7H2AMPH2AMP/HAMPHAMP/AMP2-AMP2−
V10, V4, V55.5/3.5/2.0 (V10)H3V10O283−/H2V10O284−HV10O285-V10O286−/V4O124−/V5O105−V4O124−/V5O105−
Publisher’s Note: MDPI stays neutral with regard to jurisdictional claims in published maps and institutional affiliations.

